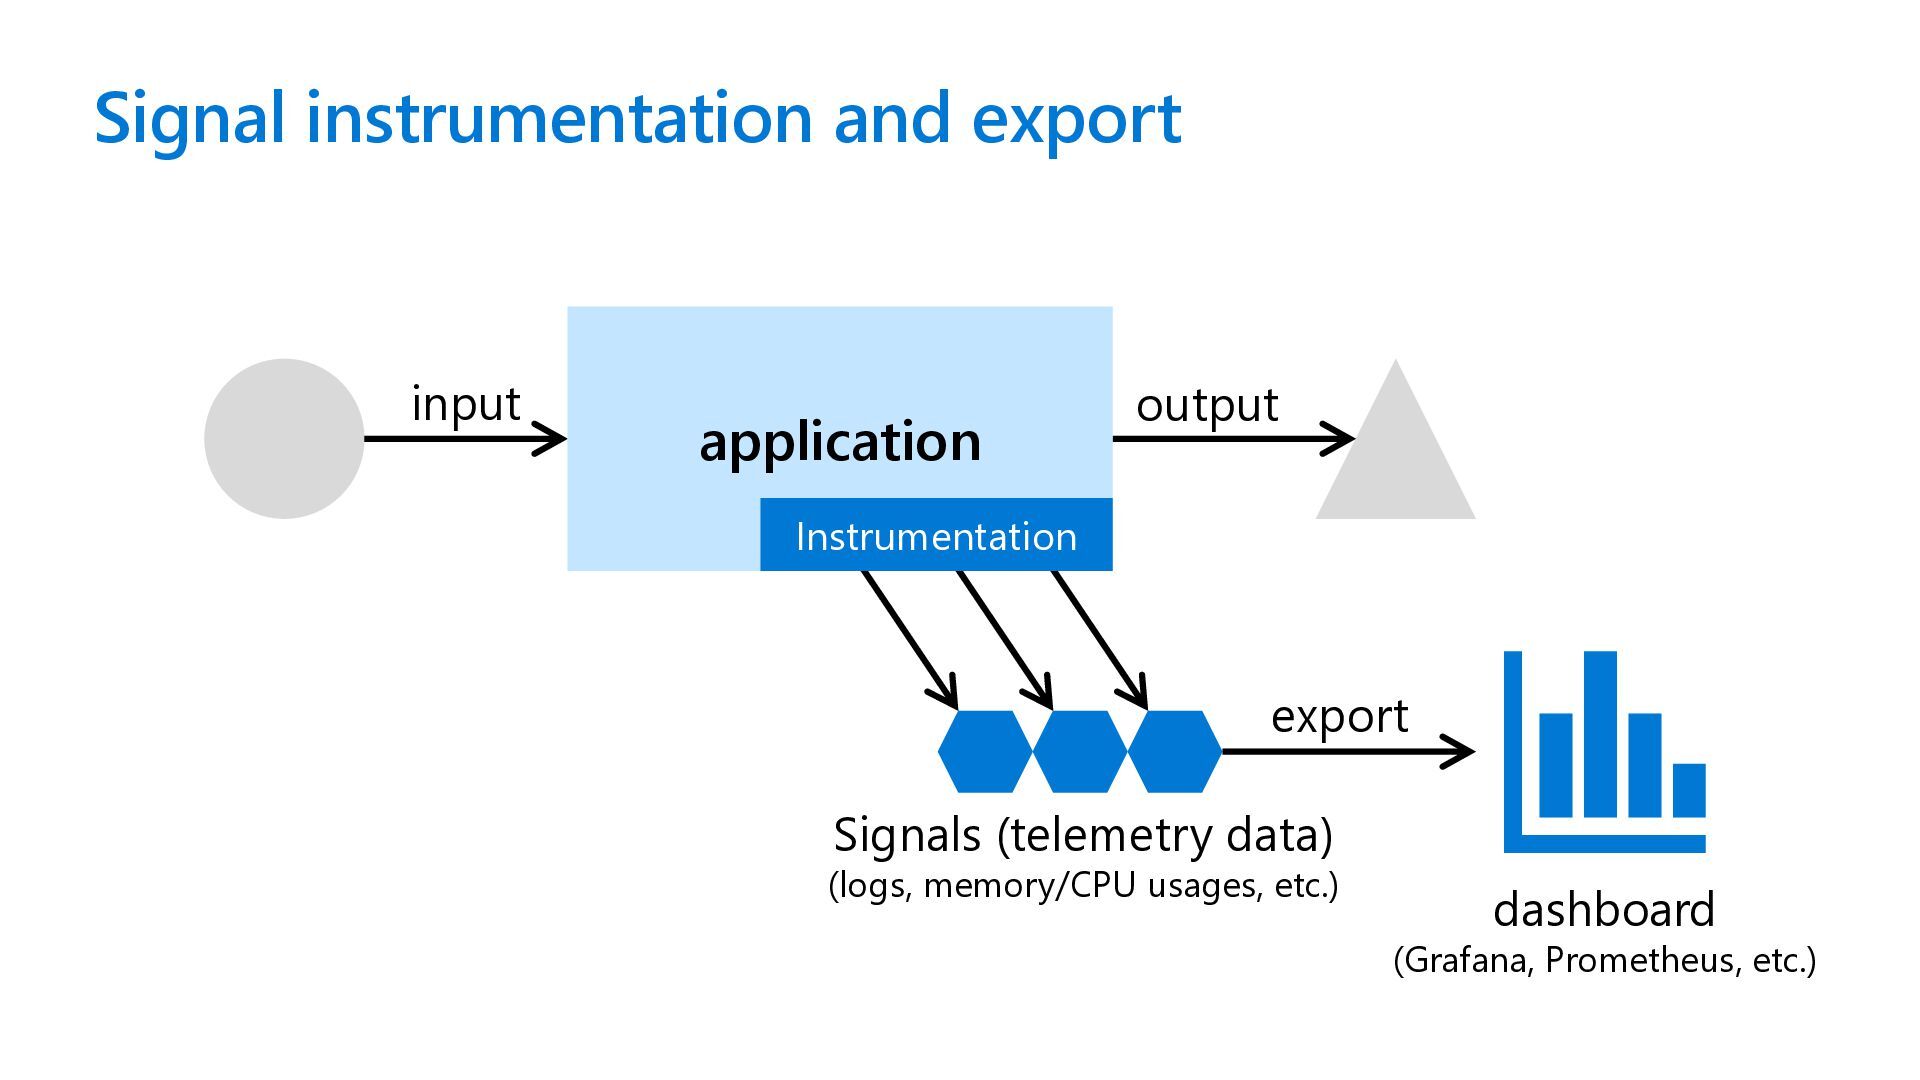
a system by examining its outputs. In the context of software, this means being able to understand the internal state of a system by examining its telemetry data, which includes traces, metrics, and logs. https://opentelemetry.io/docs/what-is-opentelemetry/#what-is-observability
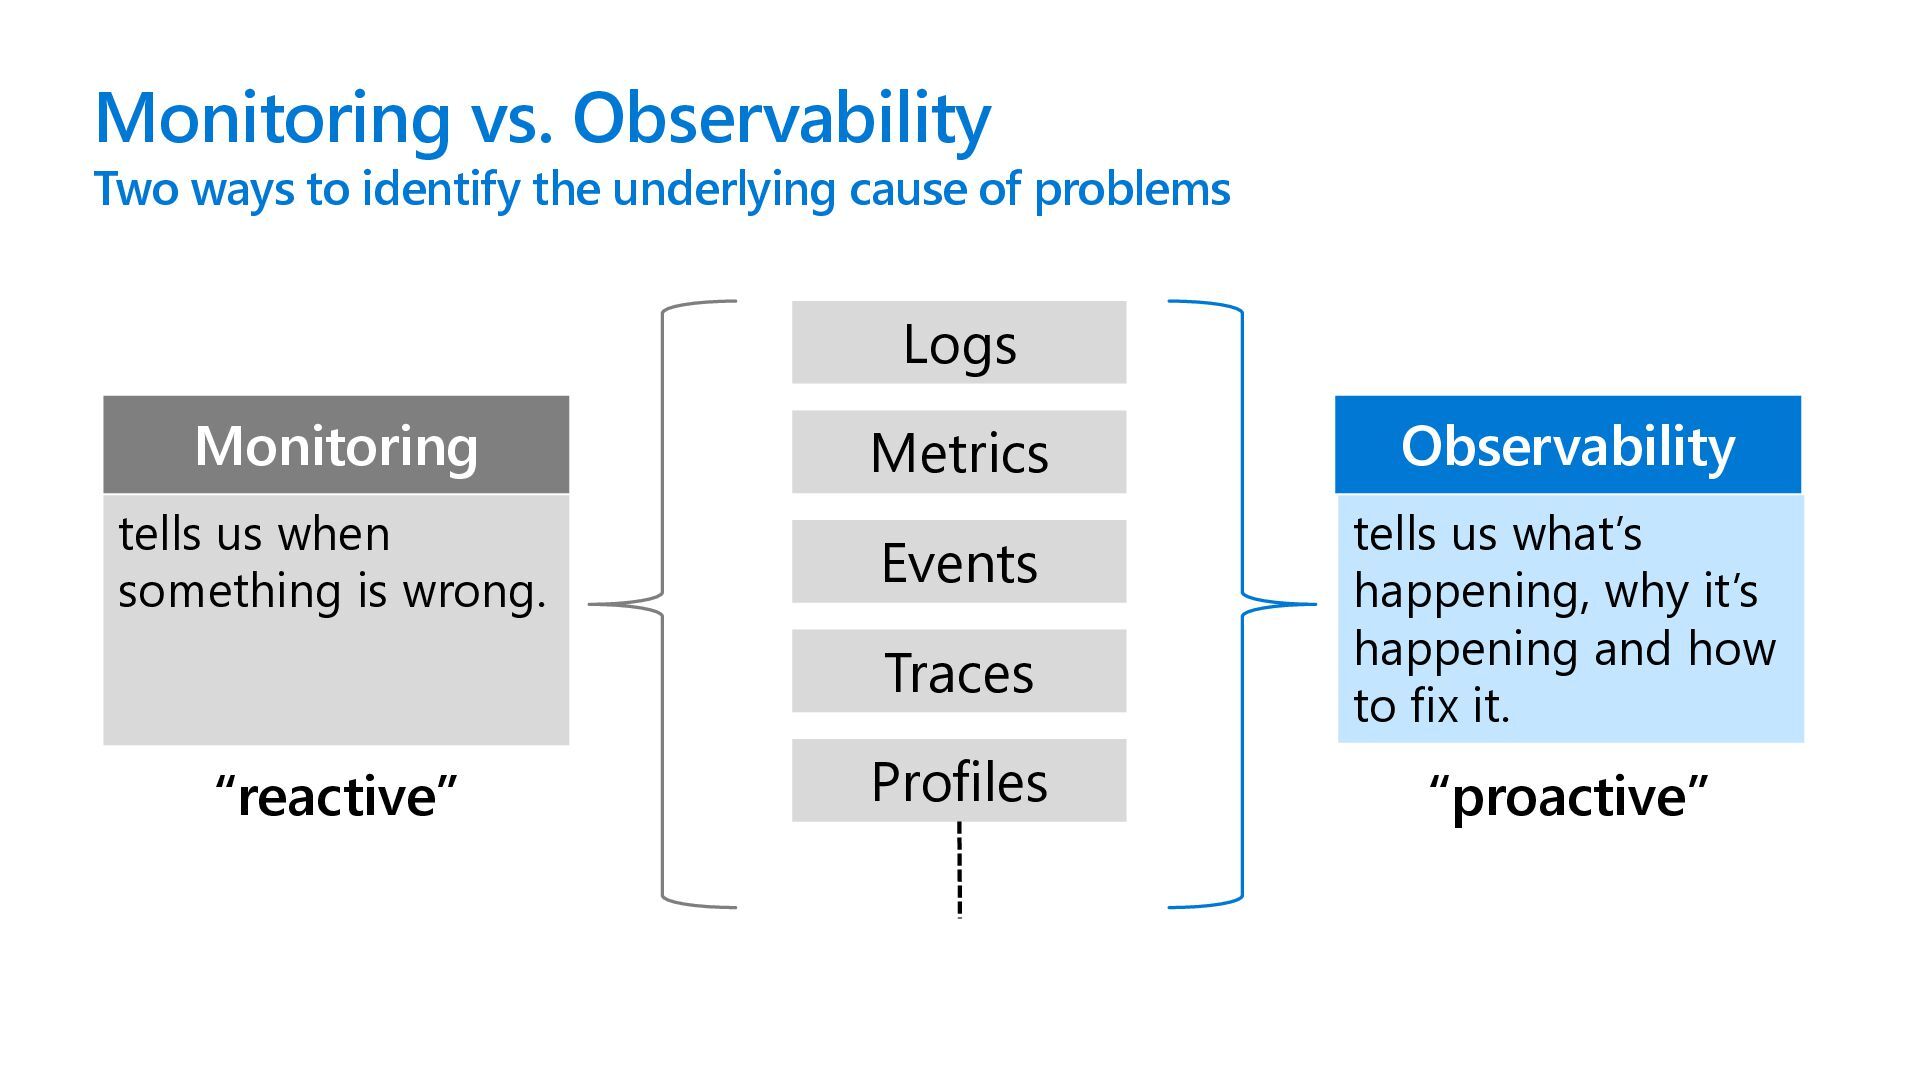
fix it. Monitoring vs. Observability Two ways to identify the underlying cause of problems Traces Metrics Logs Profiles Events Monitoring Observability tells us when something is wrong. “proactive” “reactive”
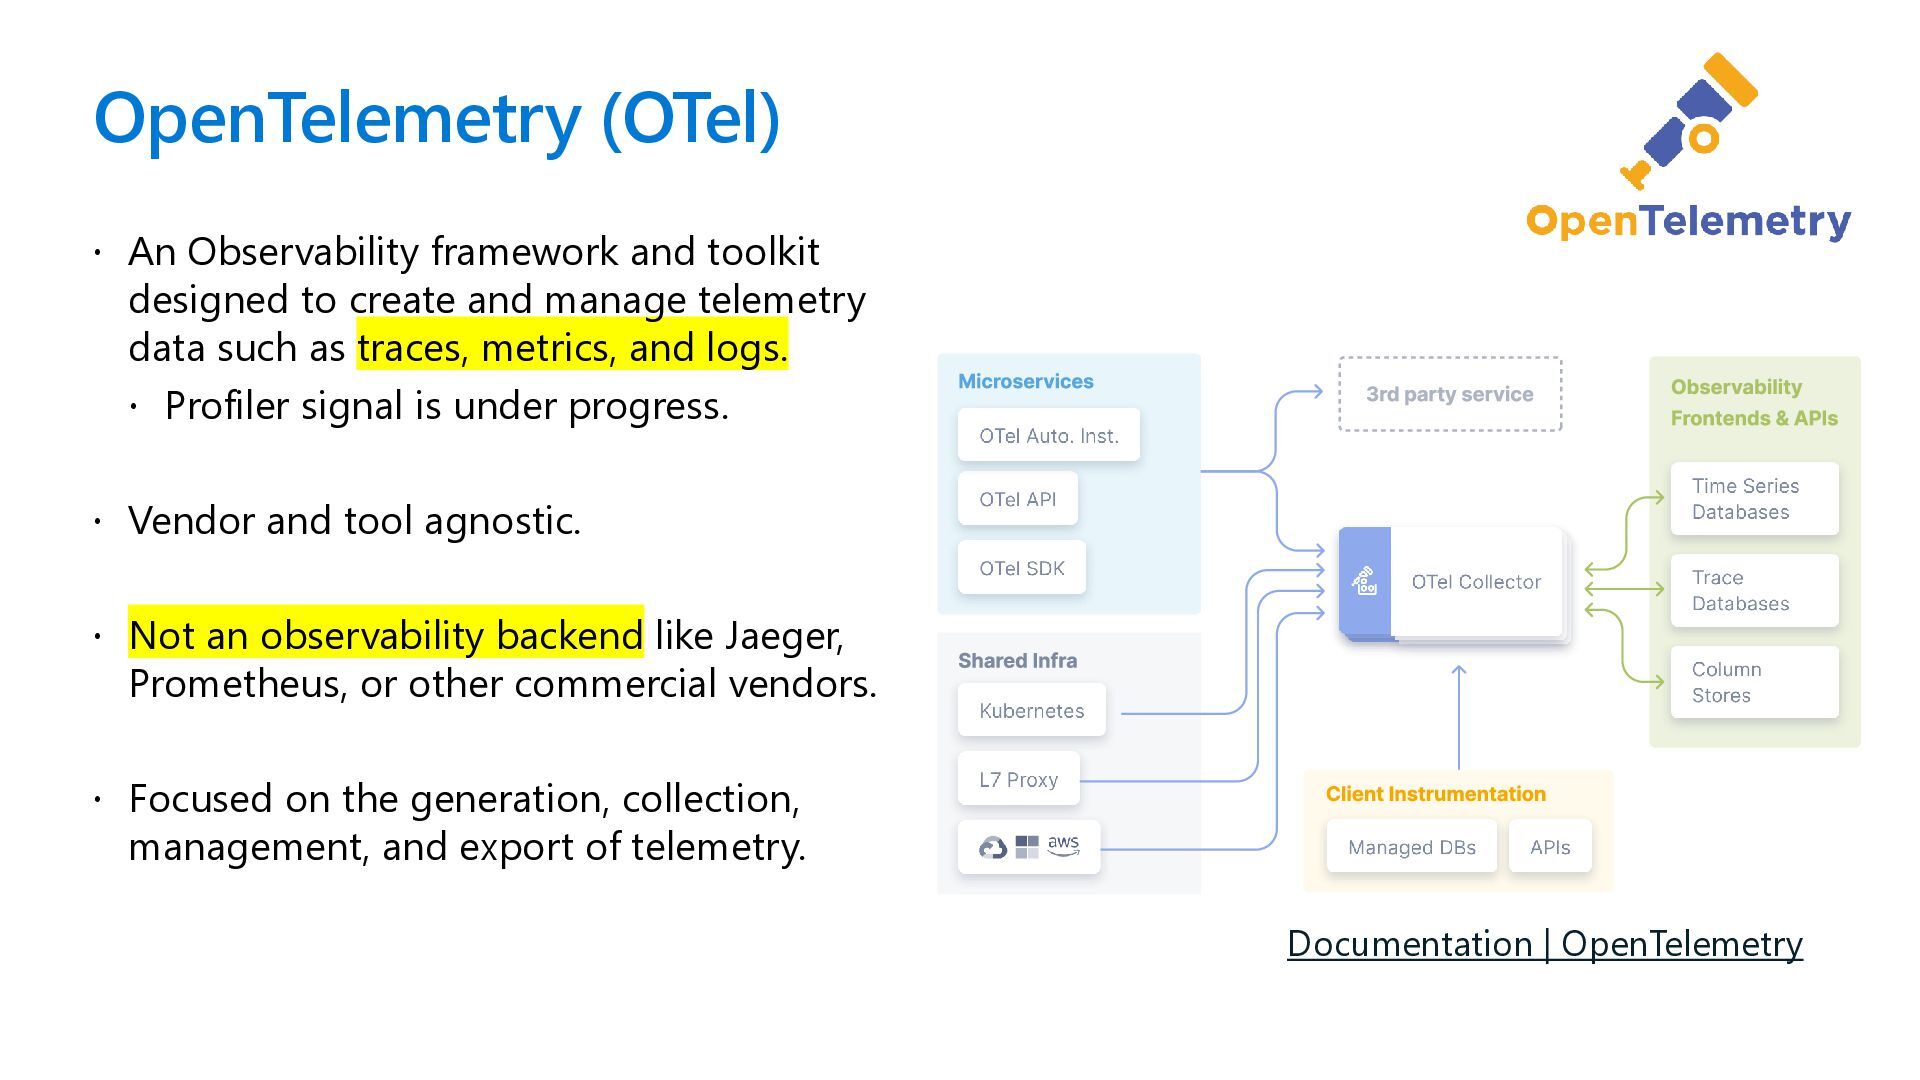
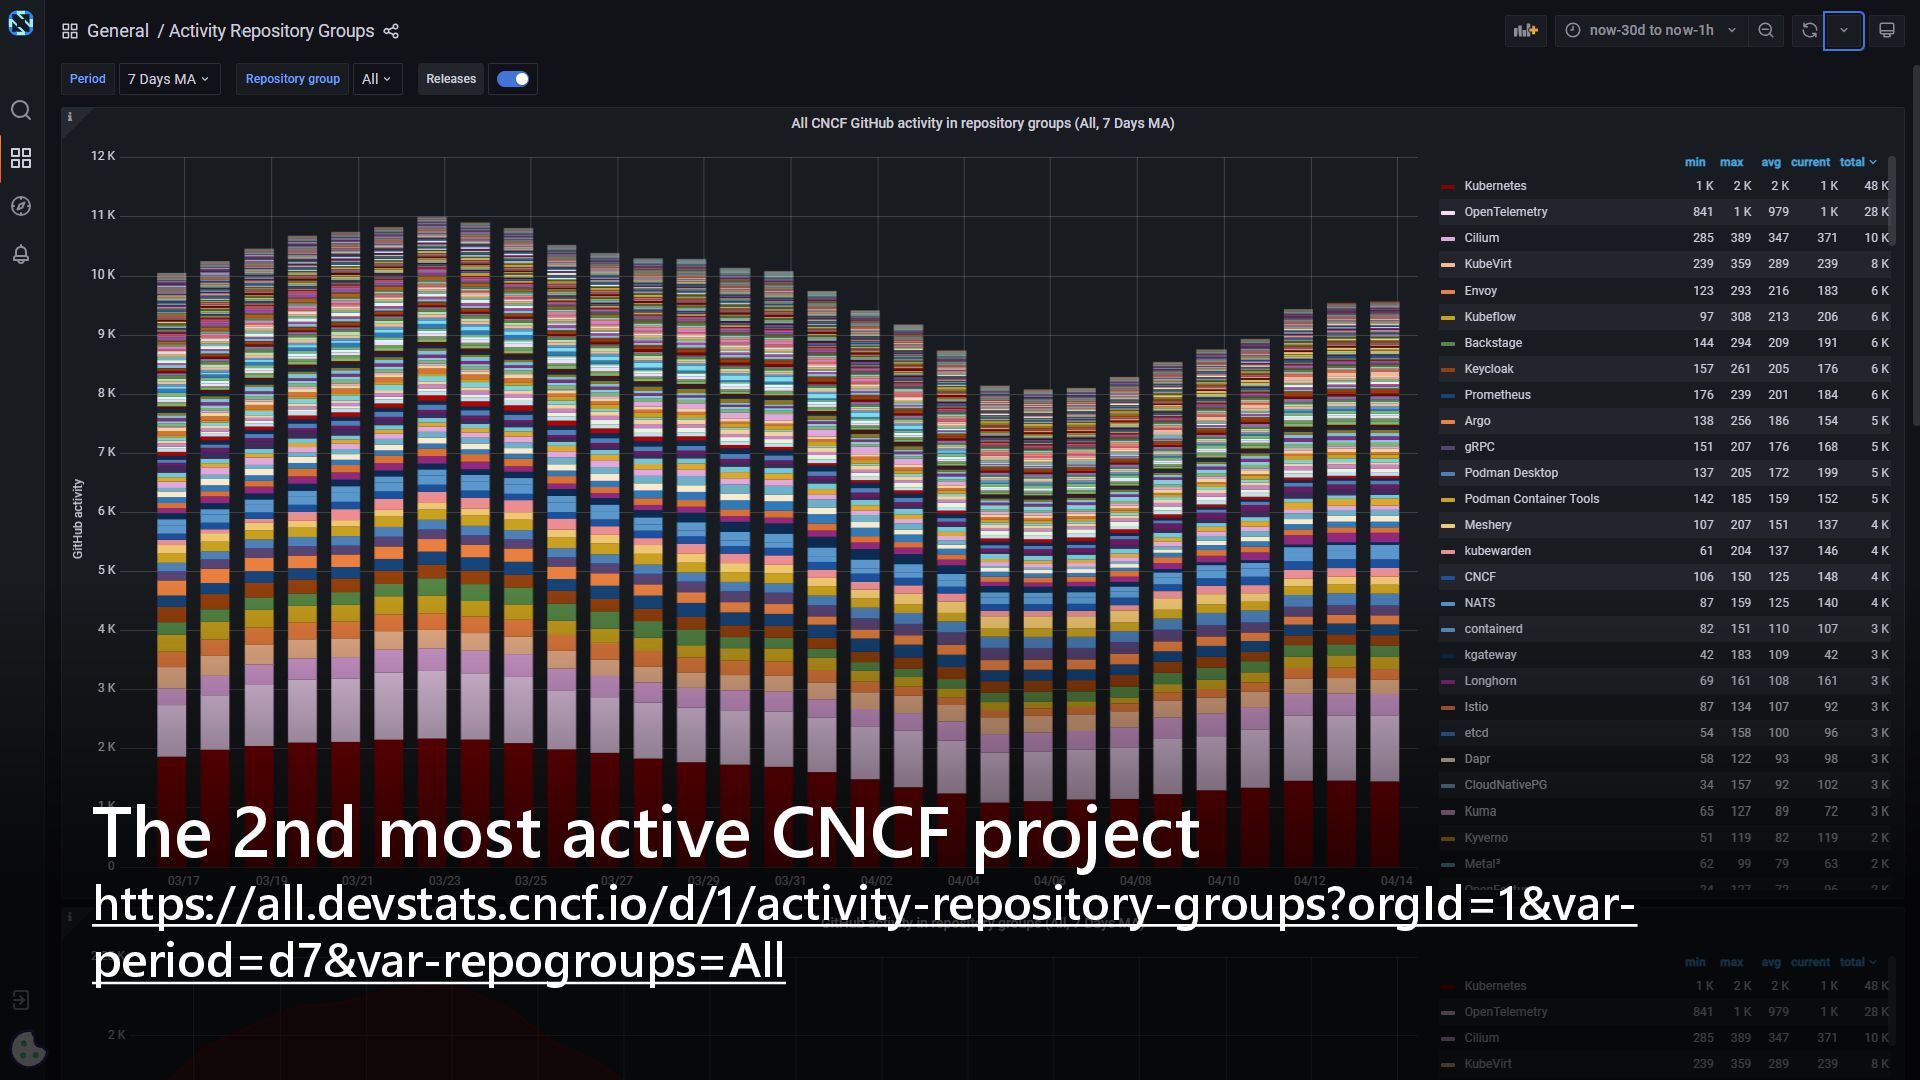
create and manage telemetry data such as traces, metrics, and logs. Profiler signal is under progress. Vendor and tool agnostic. Not an observability backend like Jaeger, Prometheus, or other commercial vendors. Focused on the generation, collection, management, and export of telemetry. Documentation | OpenTelemetry
[2] Generating actionable insights and storing telemetry data are out of scope. An observability backend like Jaeger, Prometheus, or other commercial vendors. A major goal of OpenTelemetry is that you can easily instrument your applications or systems[1], no matter their language, infrastructure, or runtime environment. The storage and visualization of telemetry is intentionally left to other tools[2]. https://opentelemetry.io/docs/what-is-opentelemetry/
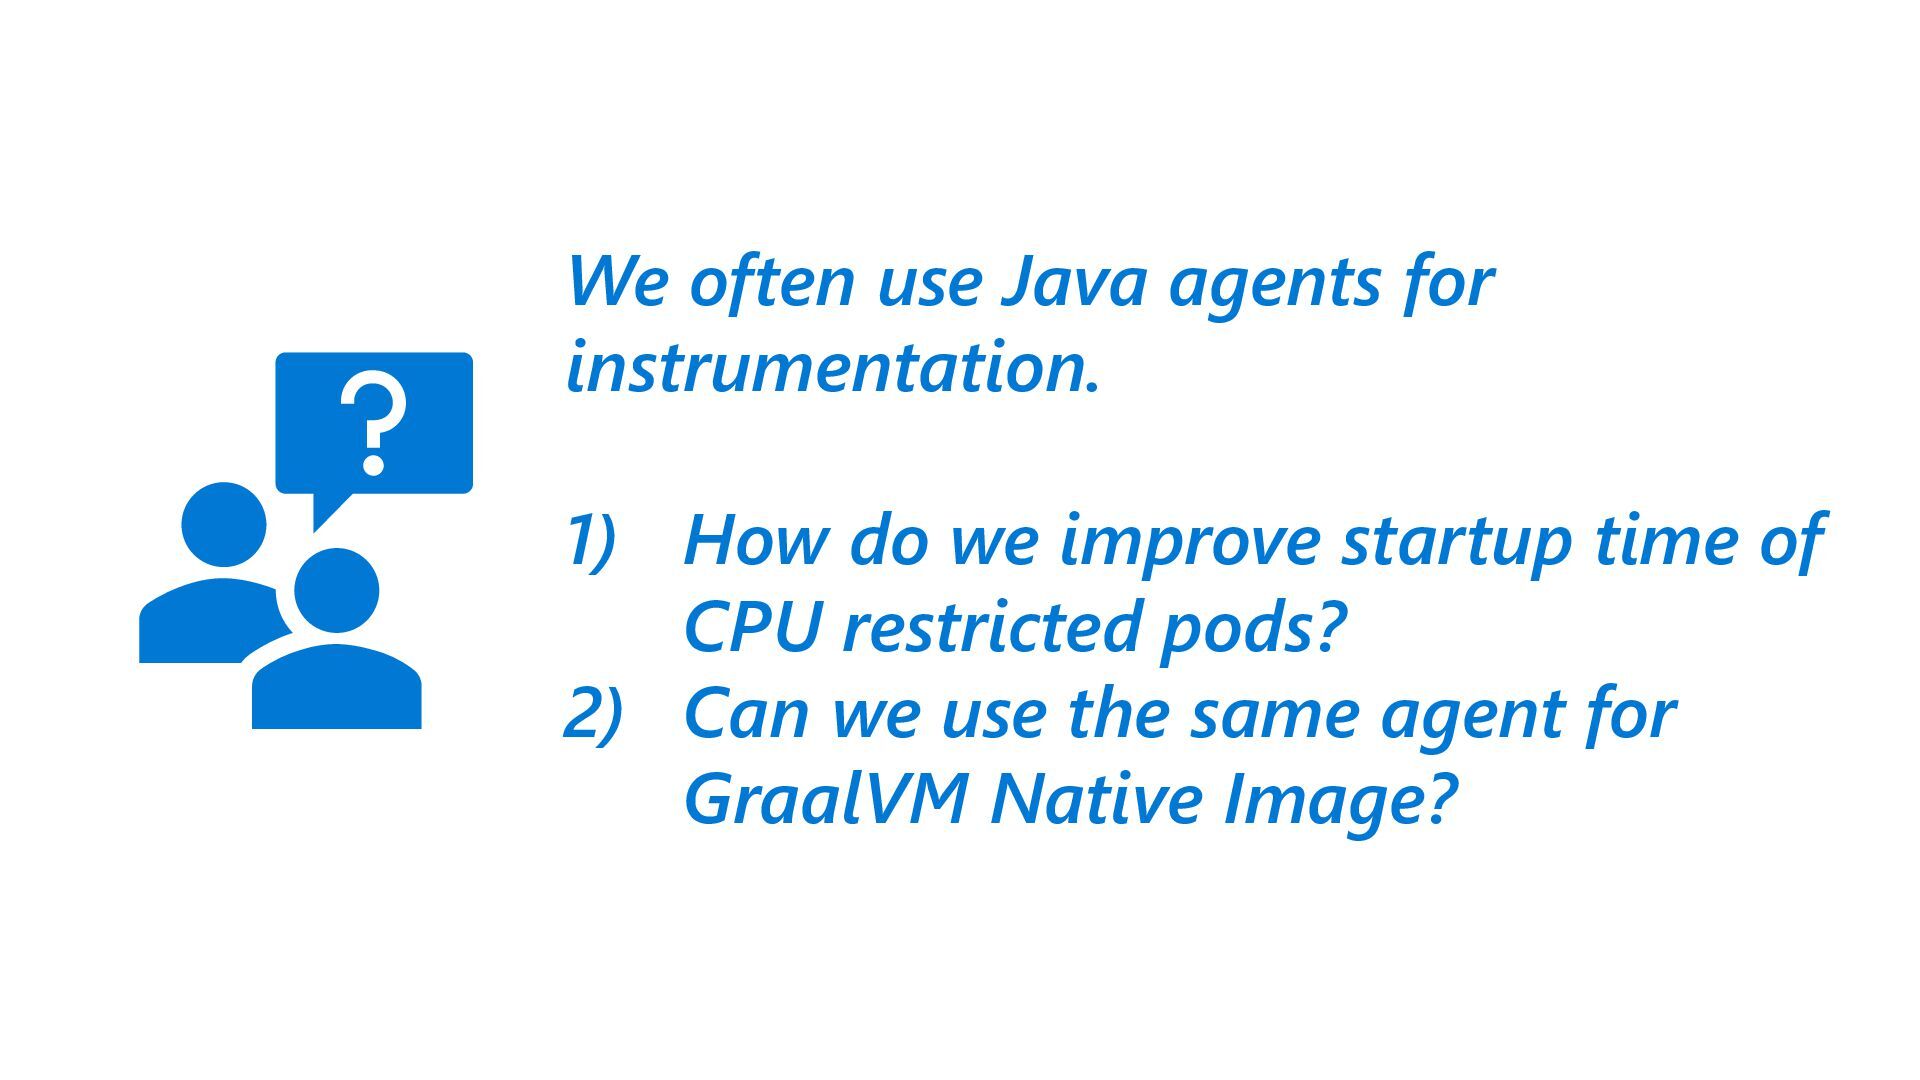
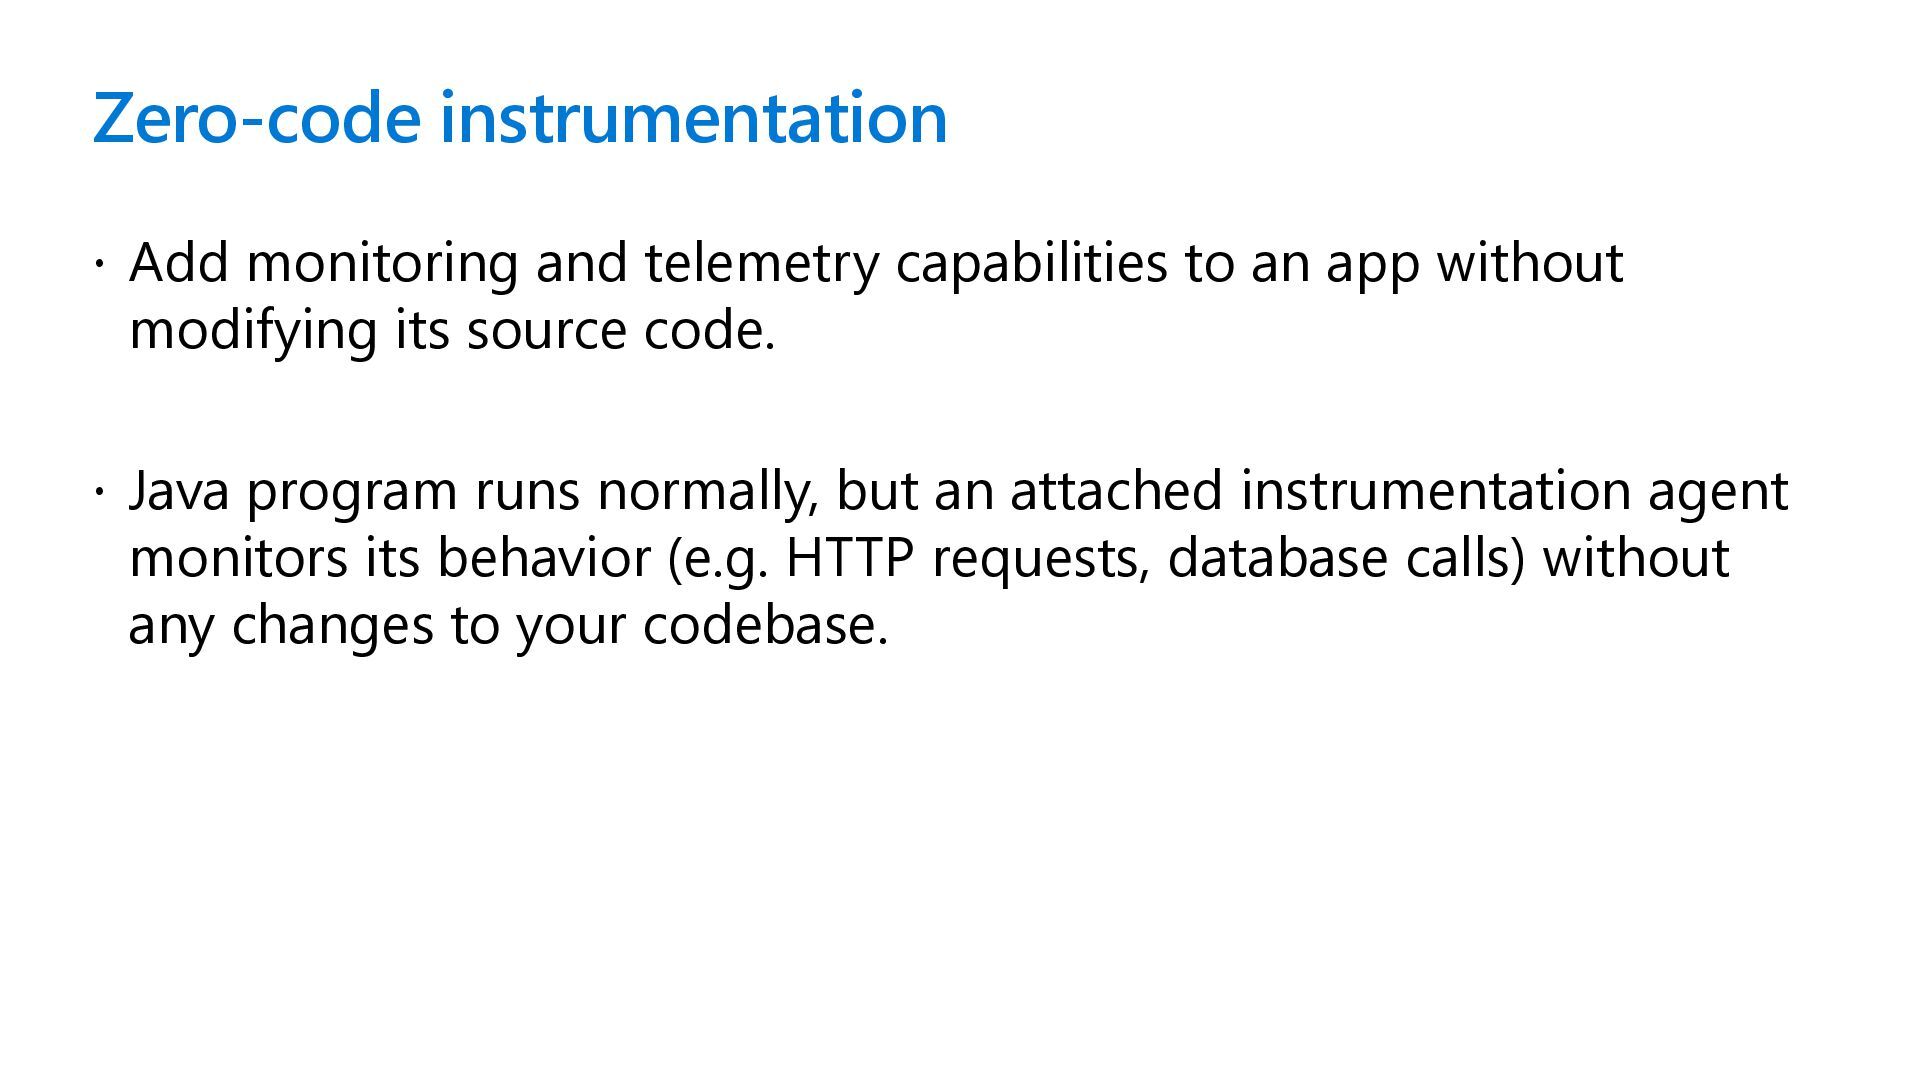
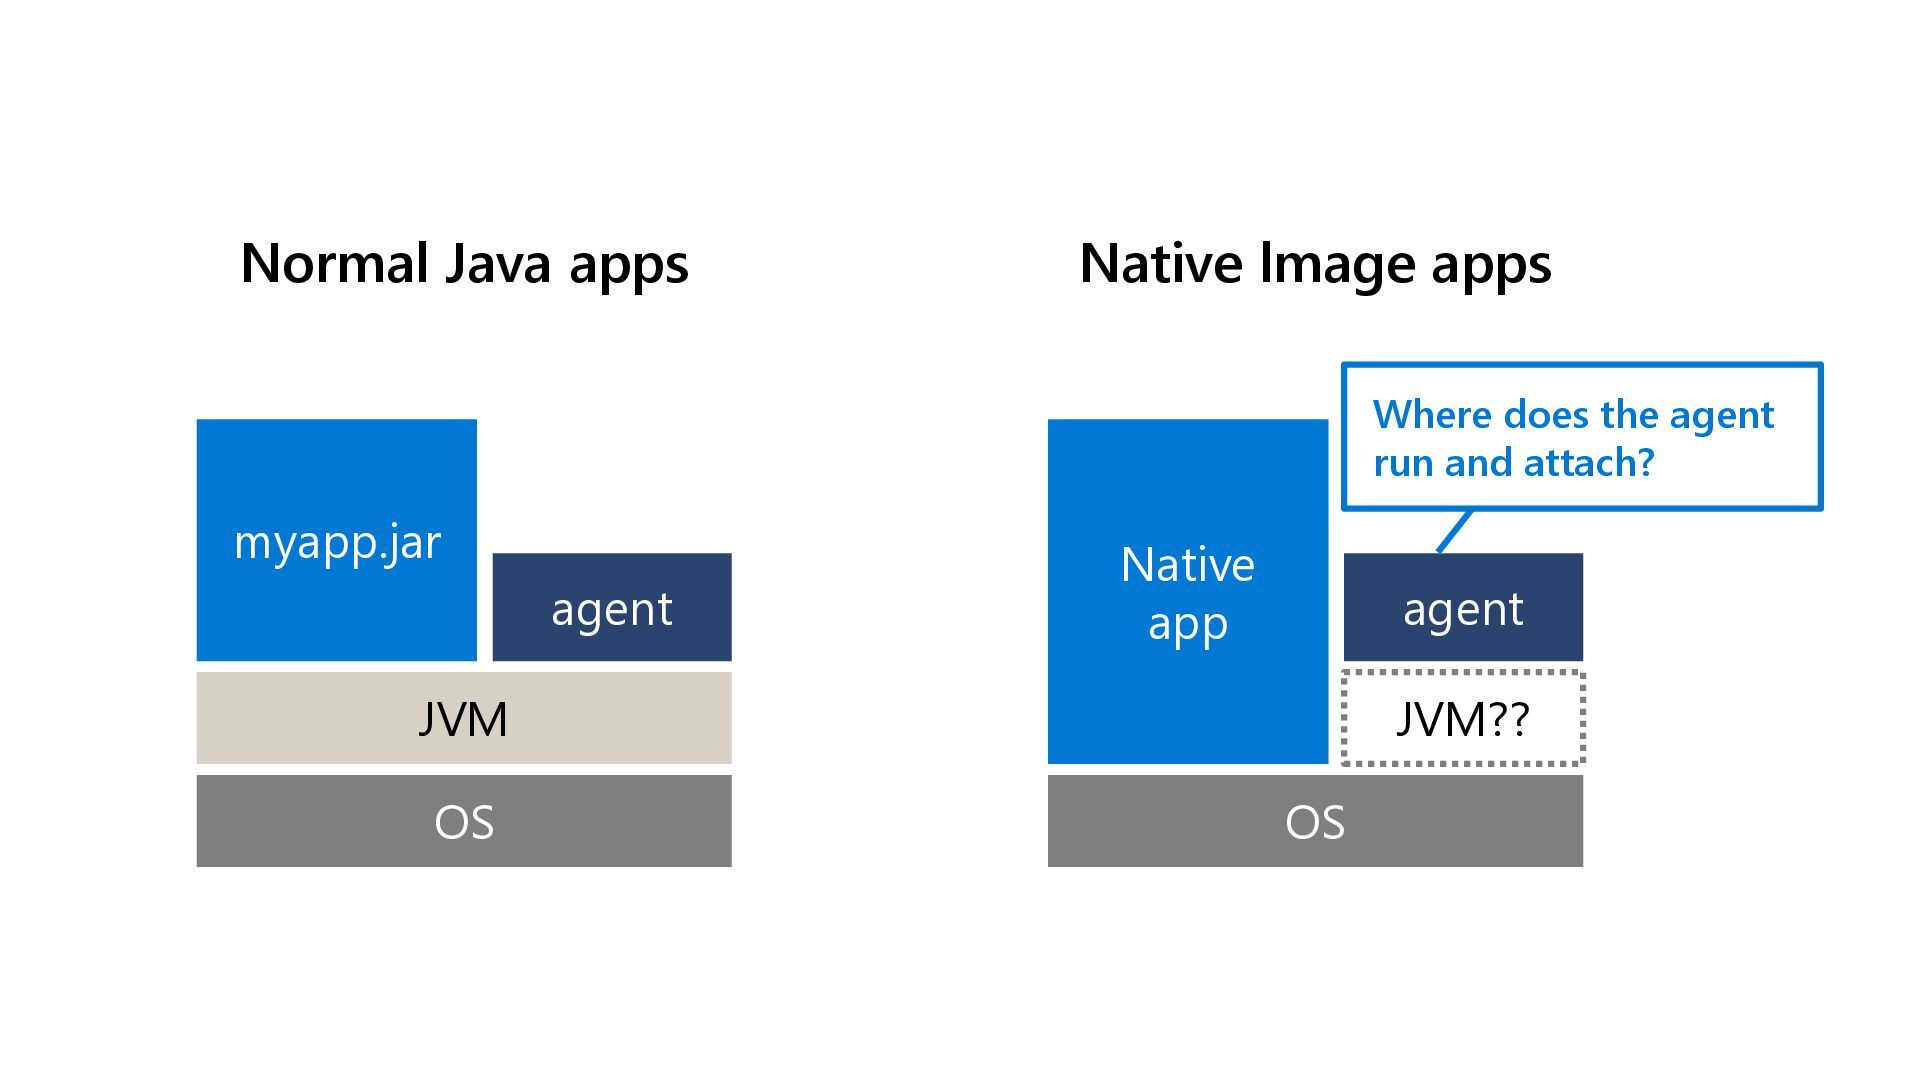
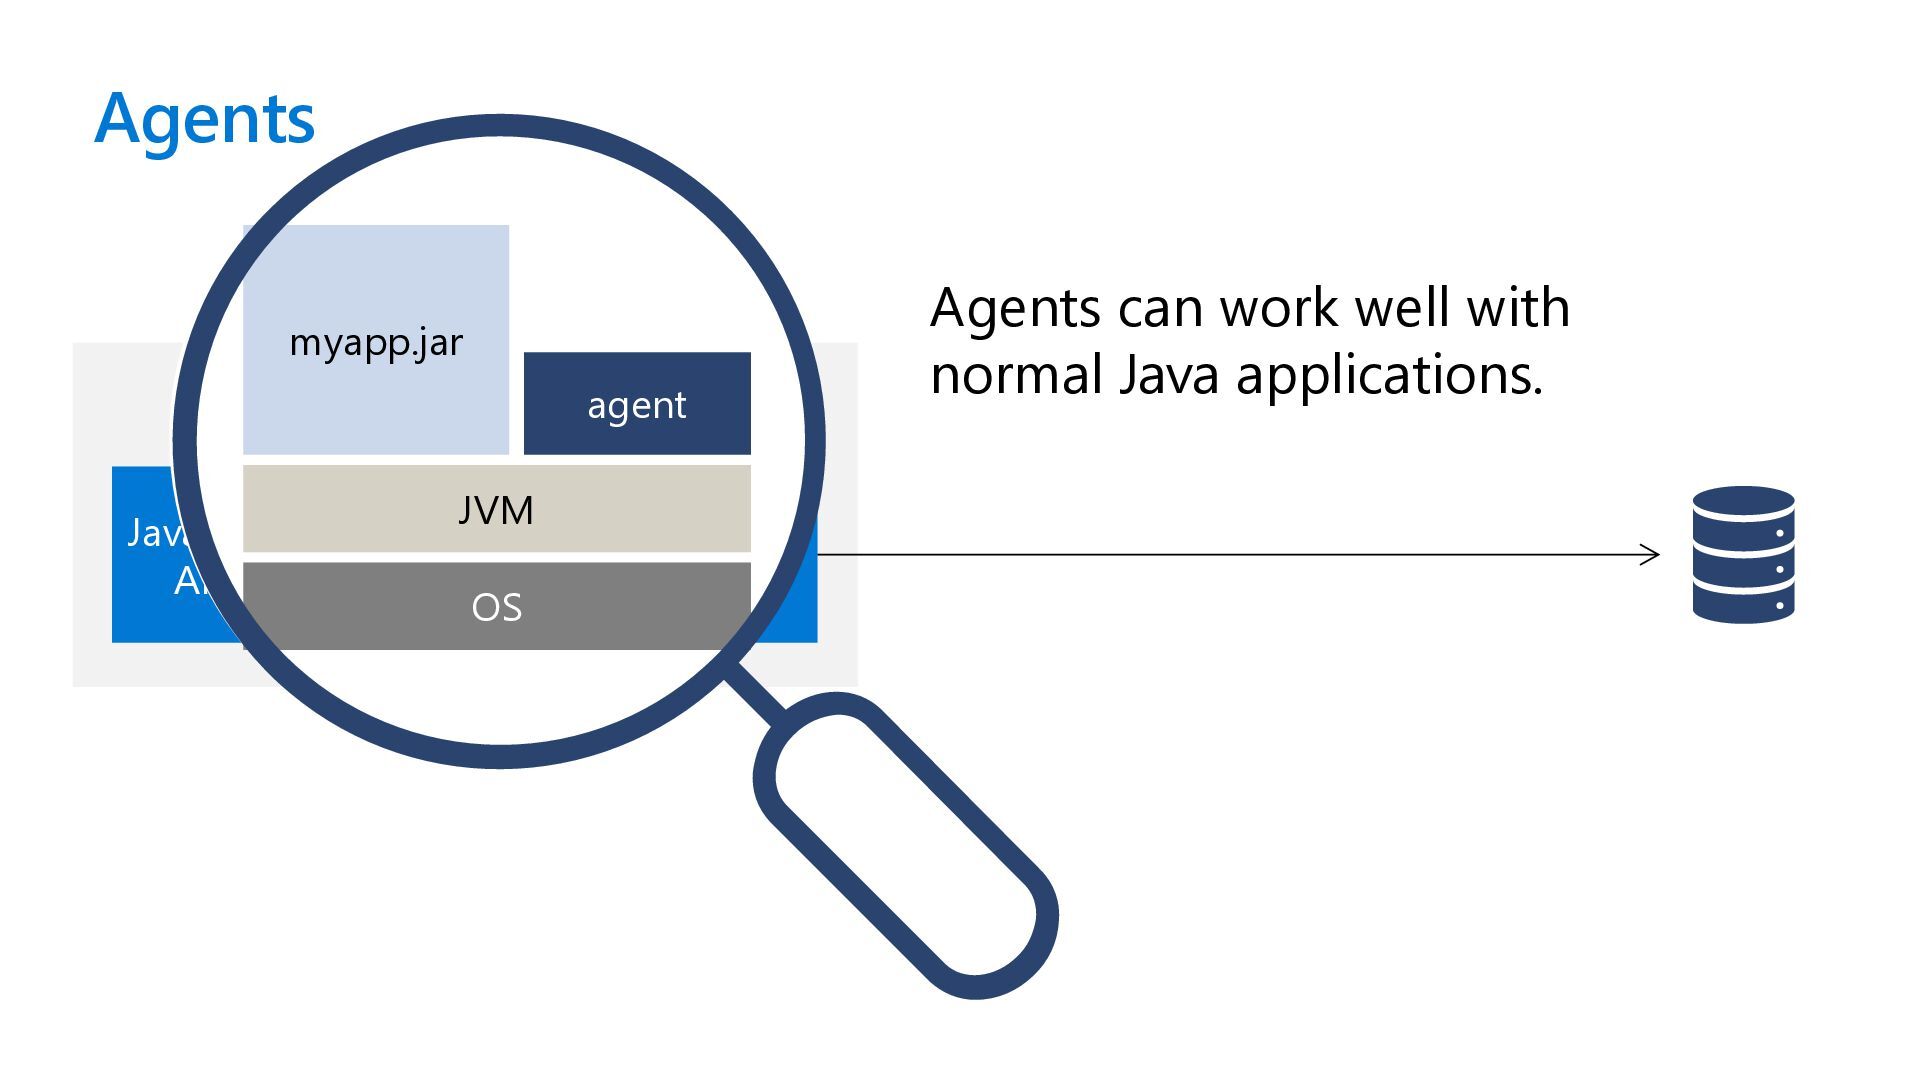
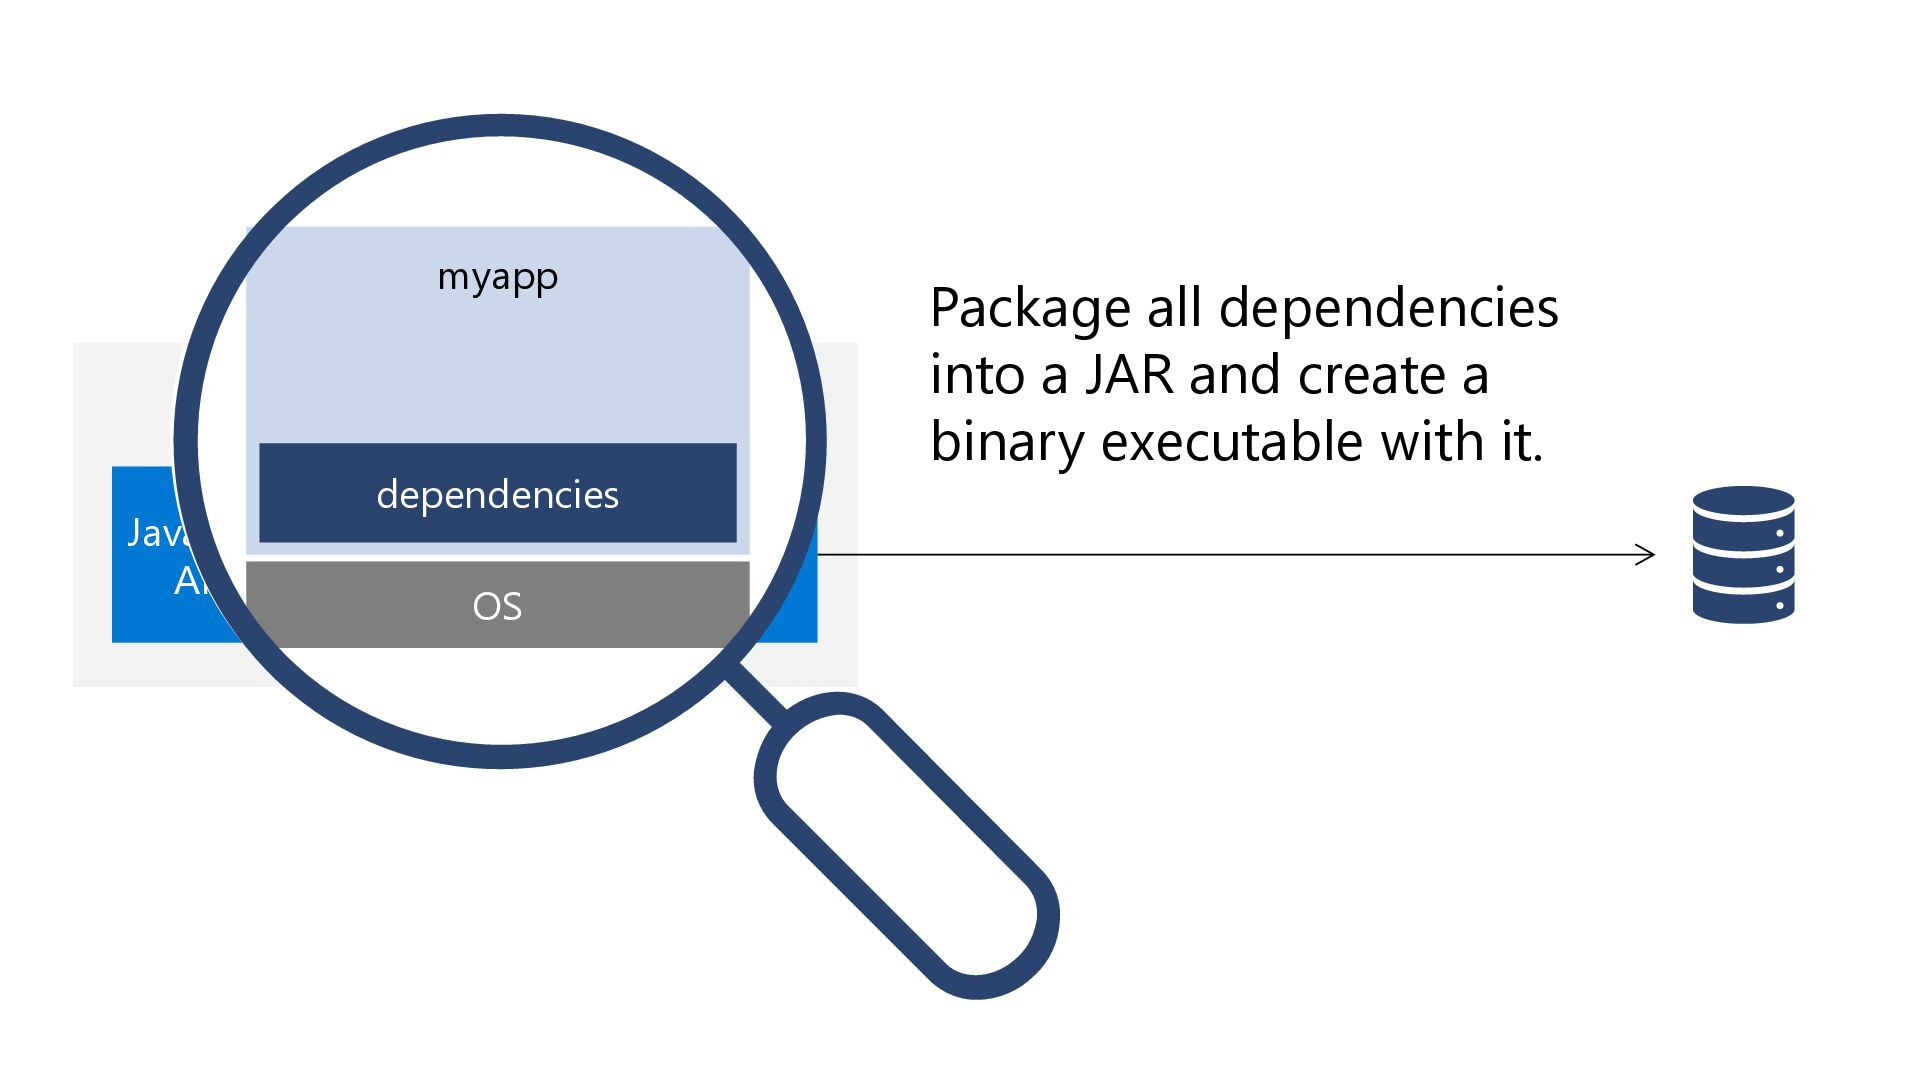
app without modifying its source code. Java program runs normally, but an attached instrumentation agent monitors its behavior (e.g. HTTP requests, database calls) without any changes to your codebase.
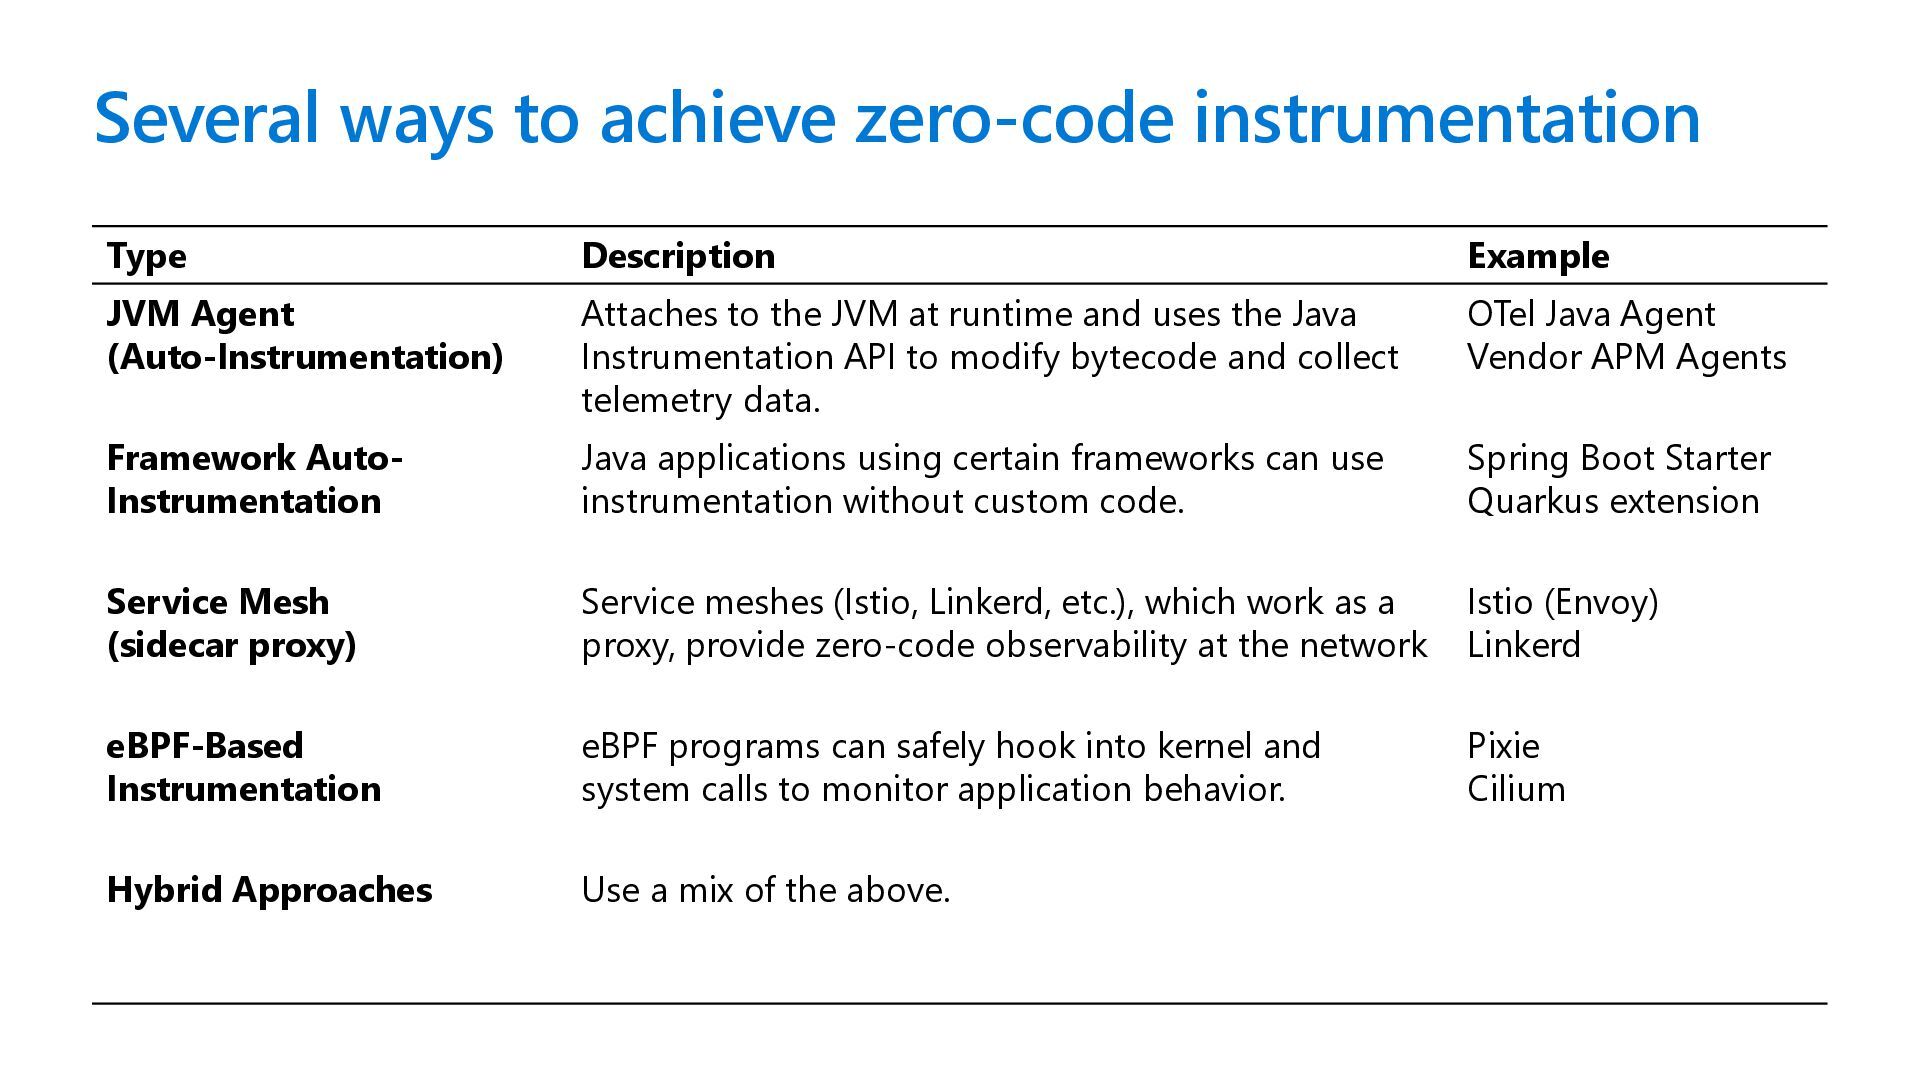
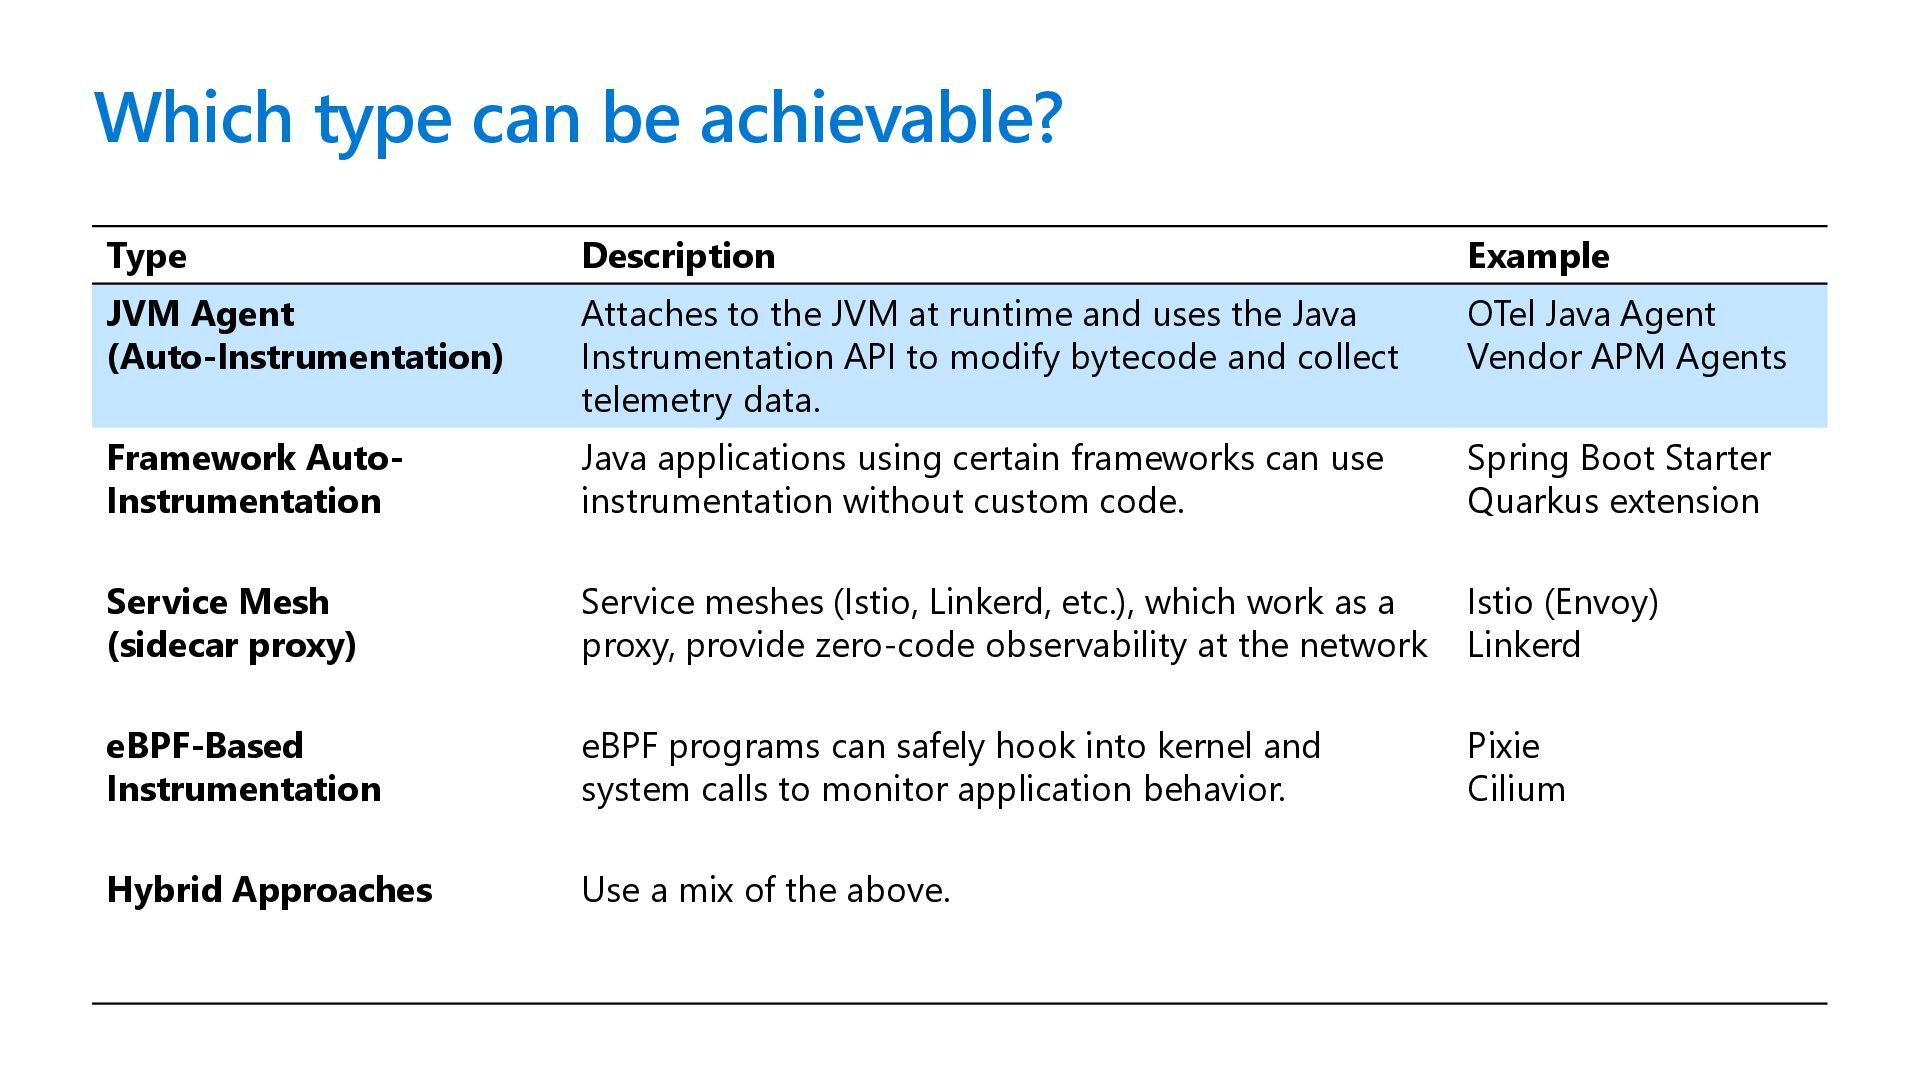
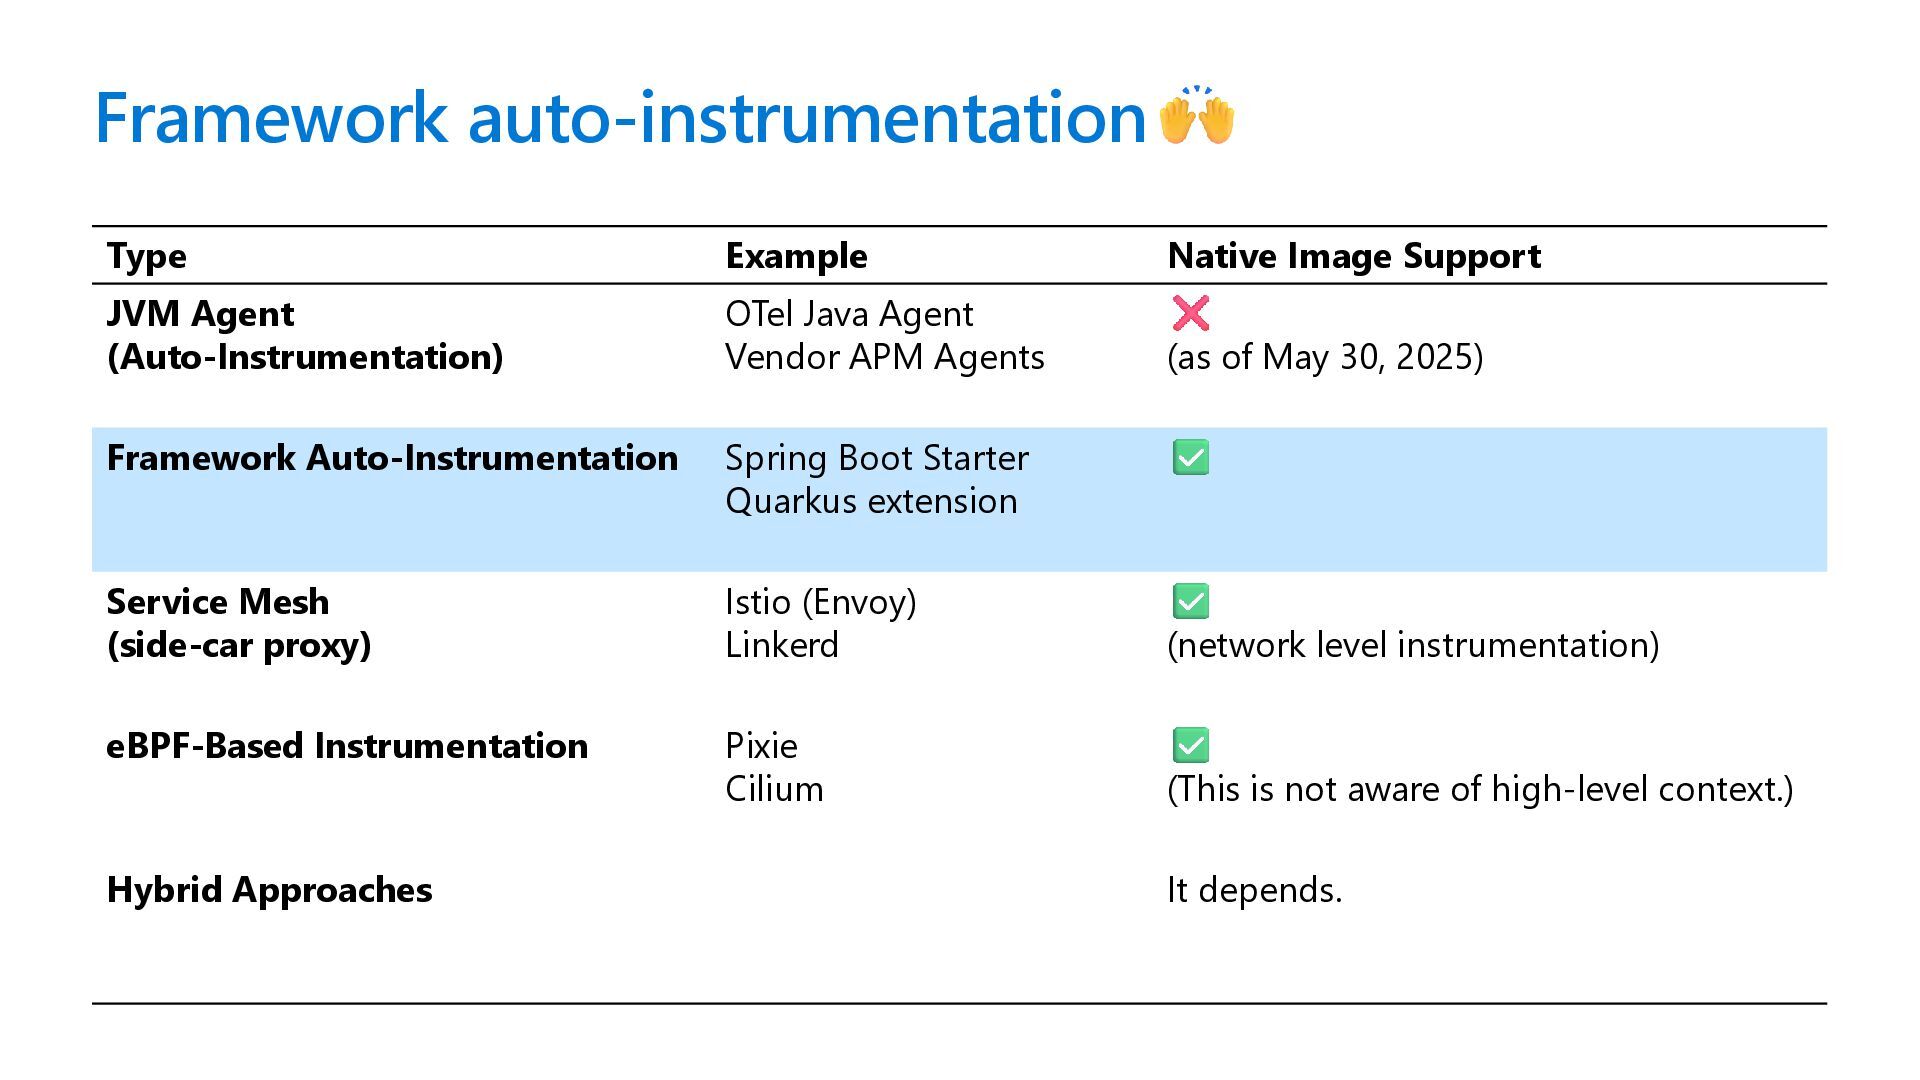
Agent (Auto-Instrumentation) Attaches to the JVM at runtime and uses the Java Instrumentation API to modify bytecode and collect telemetry data. OTel Java Agent Vendor APM Agents Framework Auto- Instrumentation Java applications using certain frameworks can use instrumentation without custom code. Spring Boot Starter Quarkus extension Service Mesh (sidecar proxy) Service meshes (Istio, Linkerd, etc.), which work as a proxy, provide zero-code observability at the network Istio (Envoy) Linkerd eBPF-Based Instrumentation eBPF programs can safely hook into kernel and system calls to monitor application behavior. Pixie Cilium Hybrid Approaches Use a mix of the above.
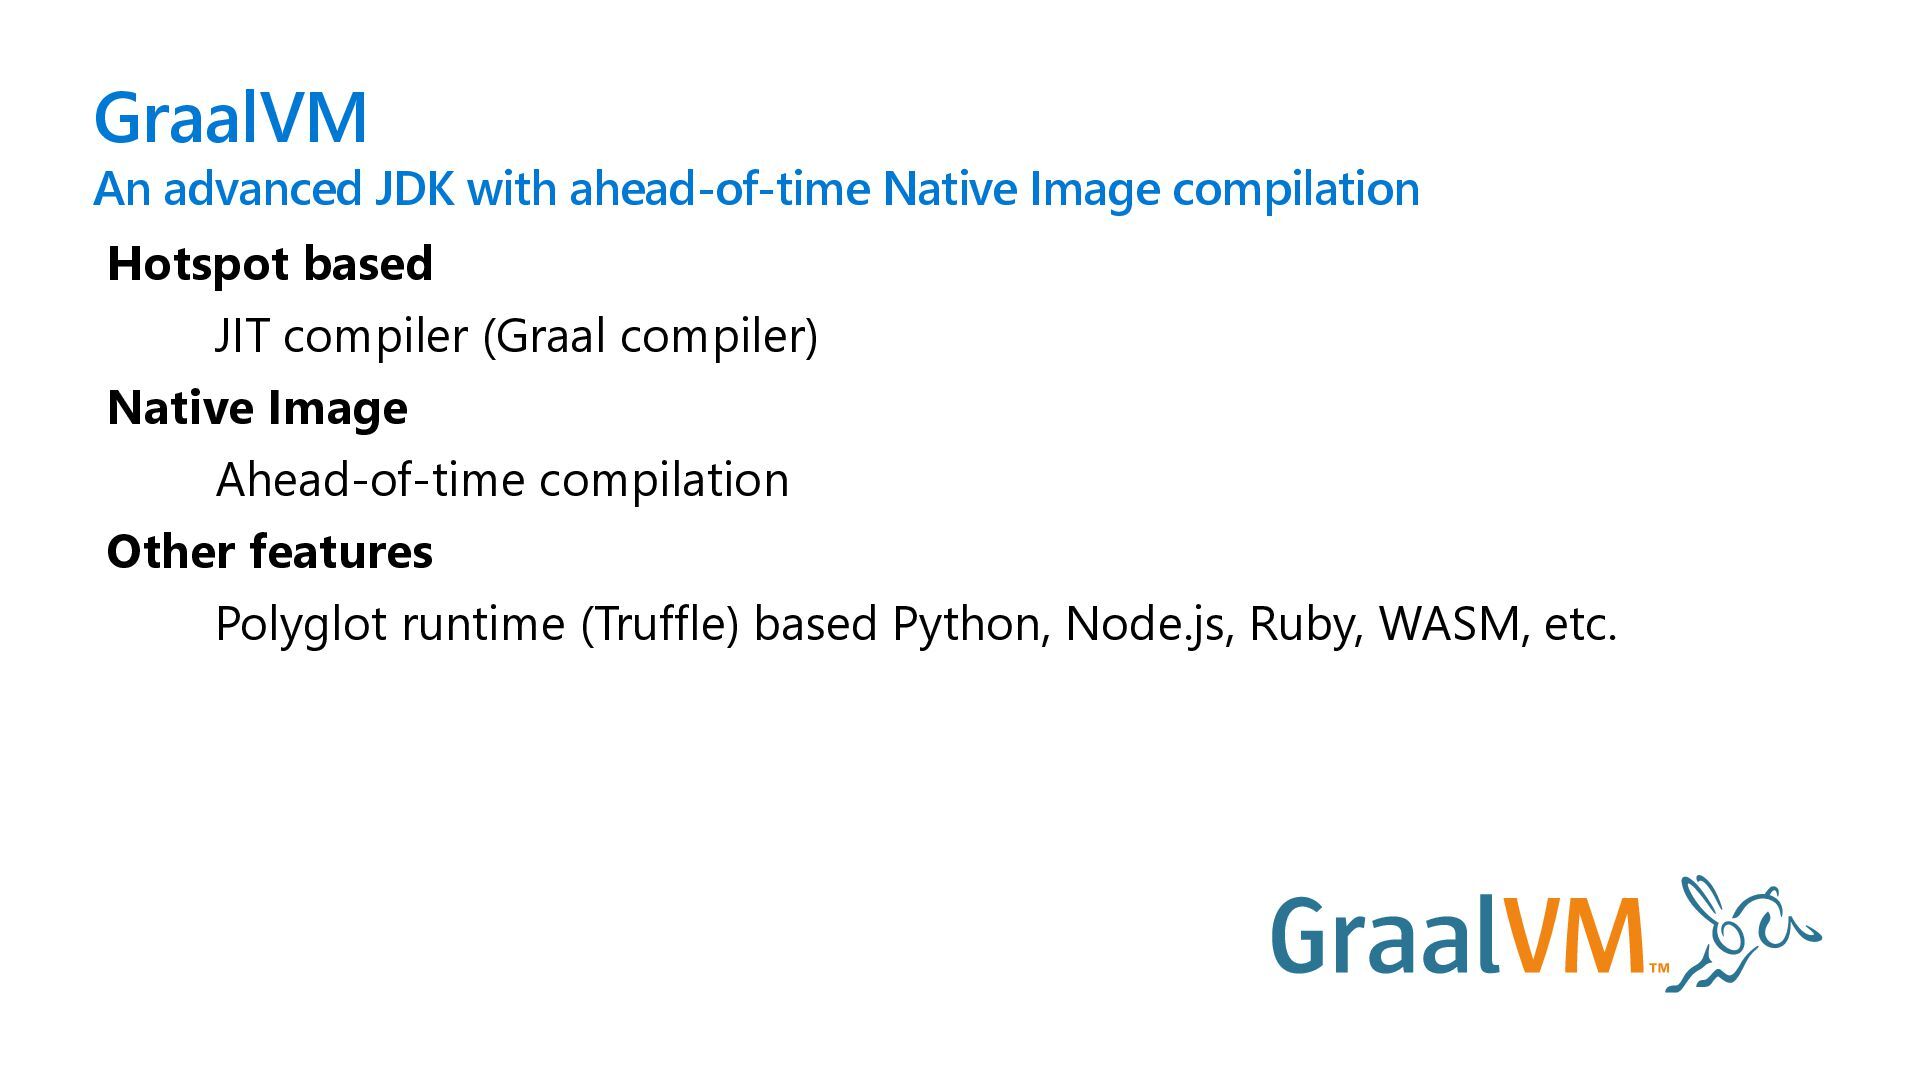
based JIT compiler (Graal compiler) Native Image Ahead-of-time compilation Other features Polyglot runtime (Truffle) based Python, Node.js, Ruby, WASM, etc.
(Auto-Instrumentation) Attaches to the JVM at runtime and uses the Java Instrumentation API to modify bytecode and collect telemetry data. OTel Java Agent Vendor APM Agents Framework Auto- Instrumentation Java applications using certain frameworks can use instrumentation without custom code. Spring Boot Starter Quarkus extension Service Mesh (sidecar proxy) Service meshes (Istio, Linkerd, etc.), which work as a proxy, provide zero-code observability at the network Istio (Envoy) Linkerd eBPF-Based Instrumentation eBPF programs can safely hook into kernel and system calls to monitor application behavior. Pixie Cilium Hybrid Approaches Use a mix of the above.
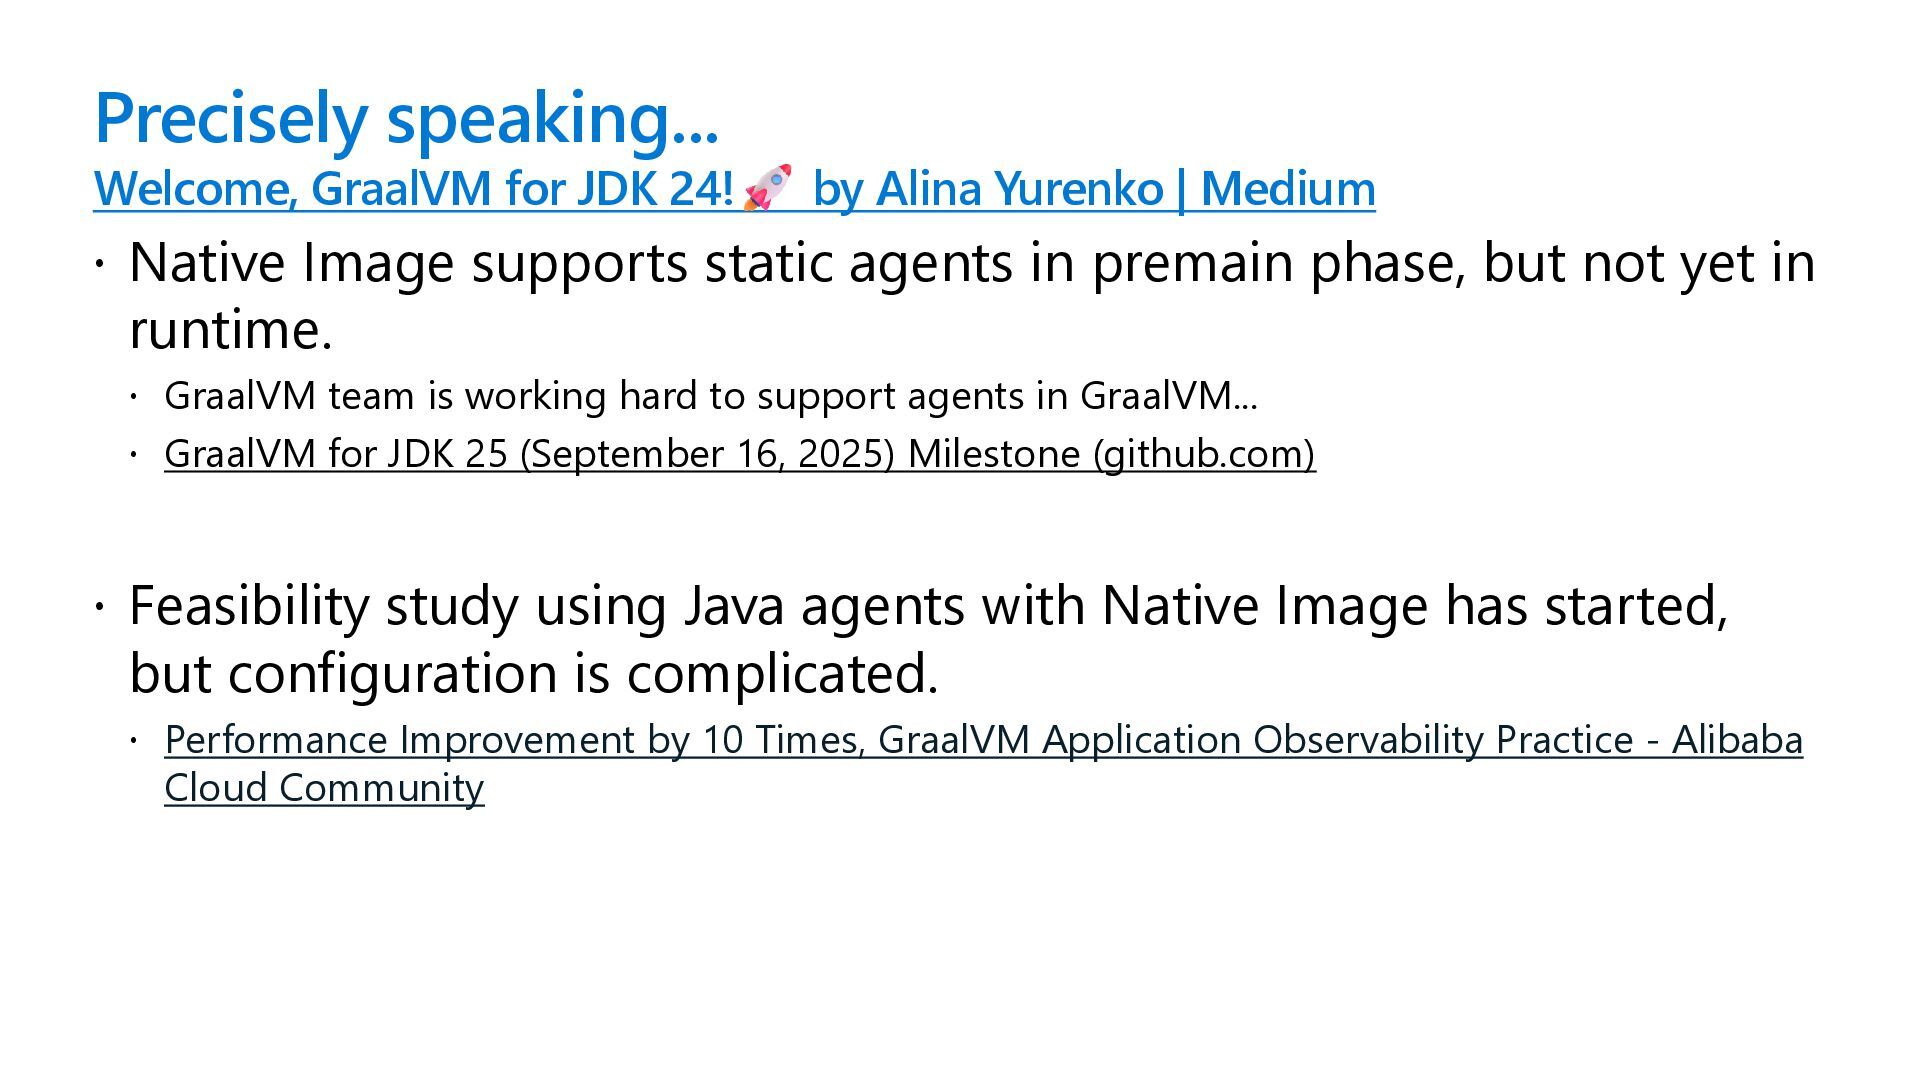
| Medium Native Image supports static agents in premain phase, but not yet in runtime. GraalVM team is working hard to support agents in GraalVM... GraalVM for JDK 25 (September 16, 2025) Milestone (github.com) Feasibility study using Java agents with Native Image has started, but configuration is complicated. Performance Improvement by 10 Times, GraalVM Application Observability Practice - Alibaba Cloud Community
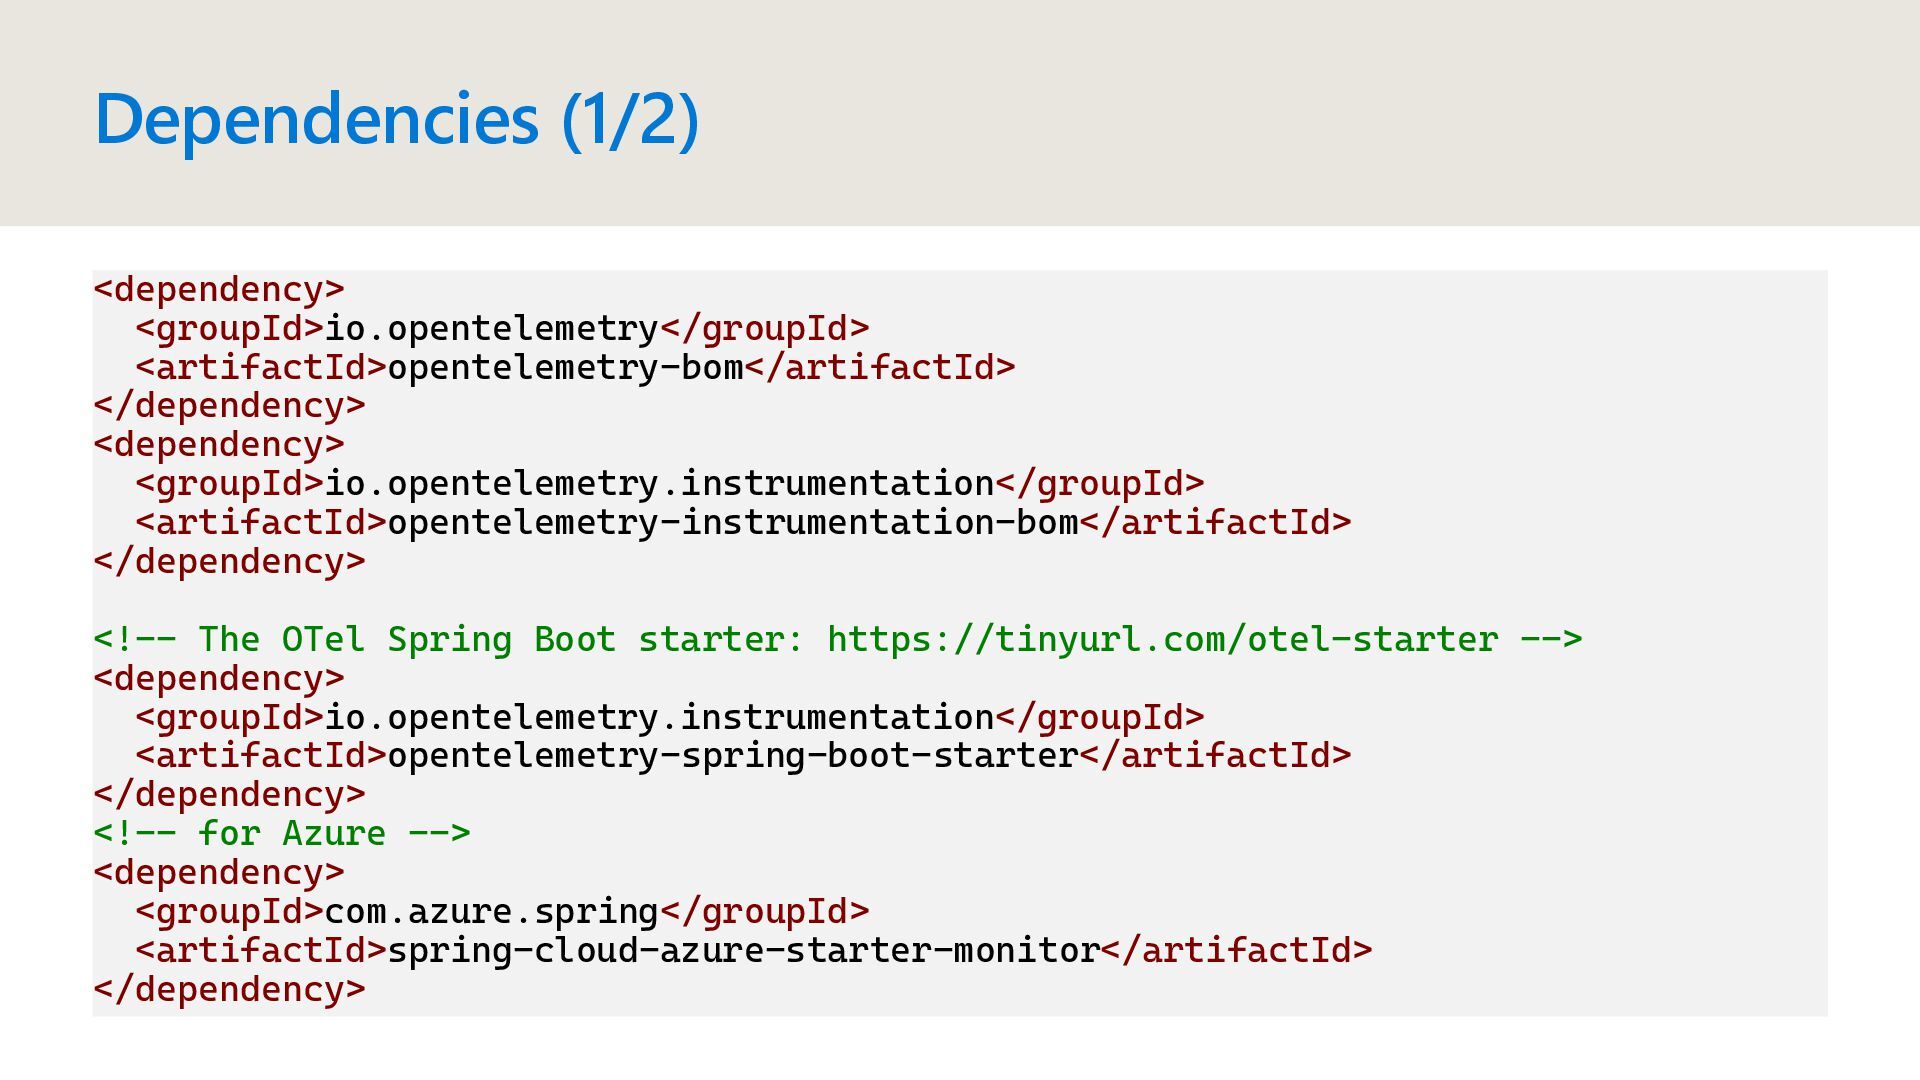
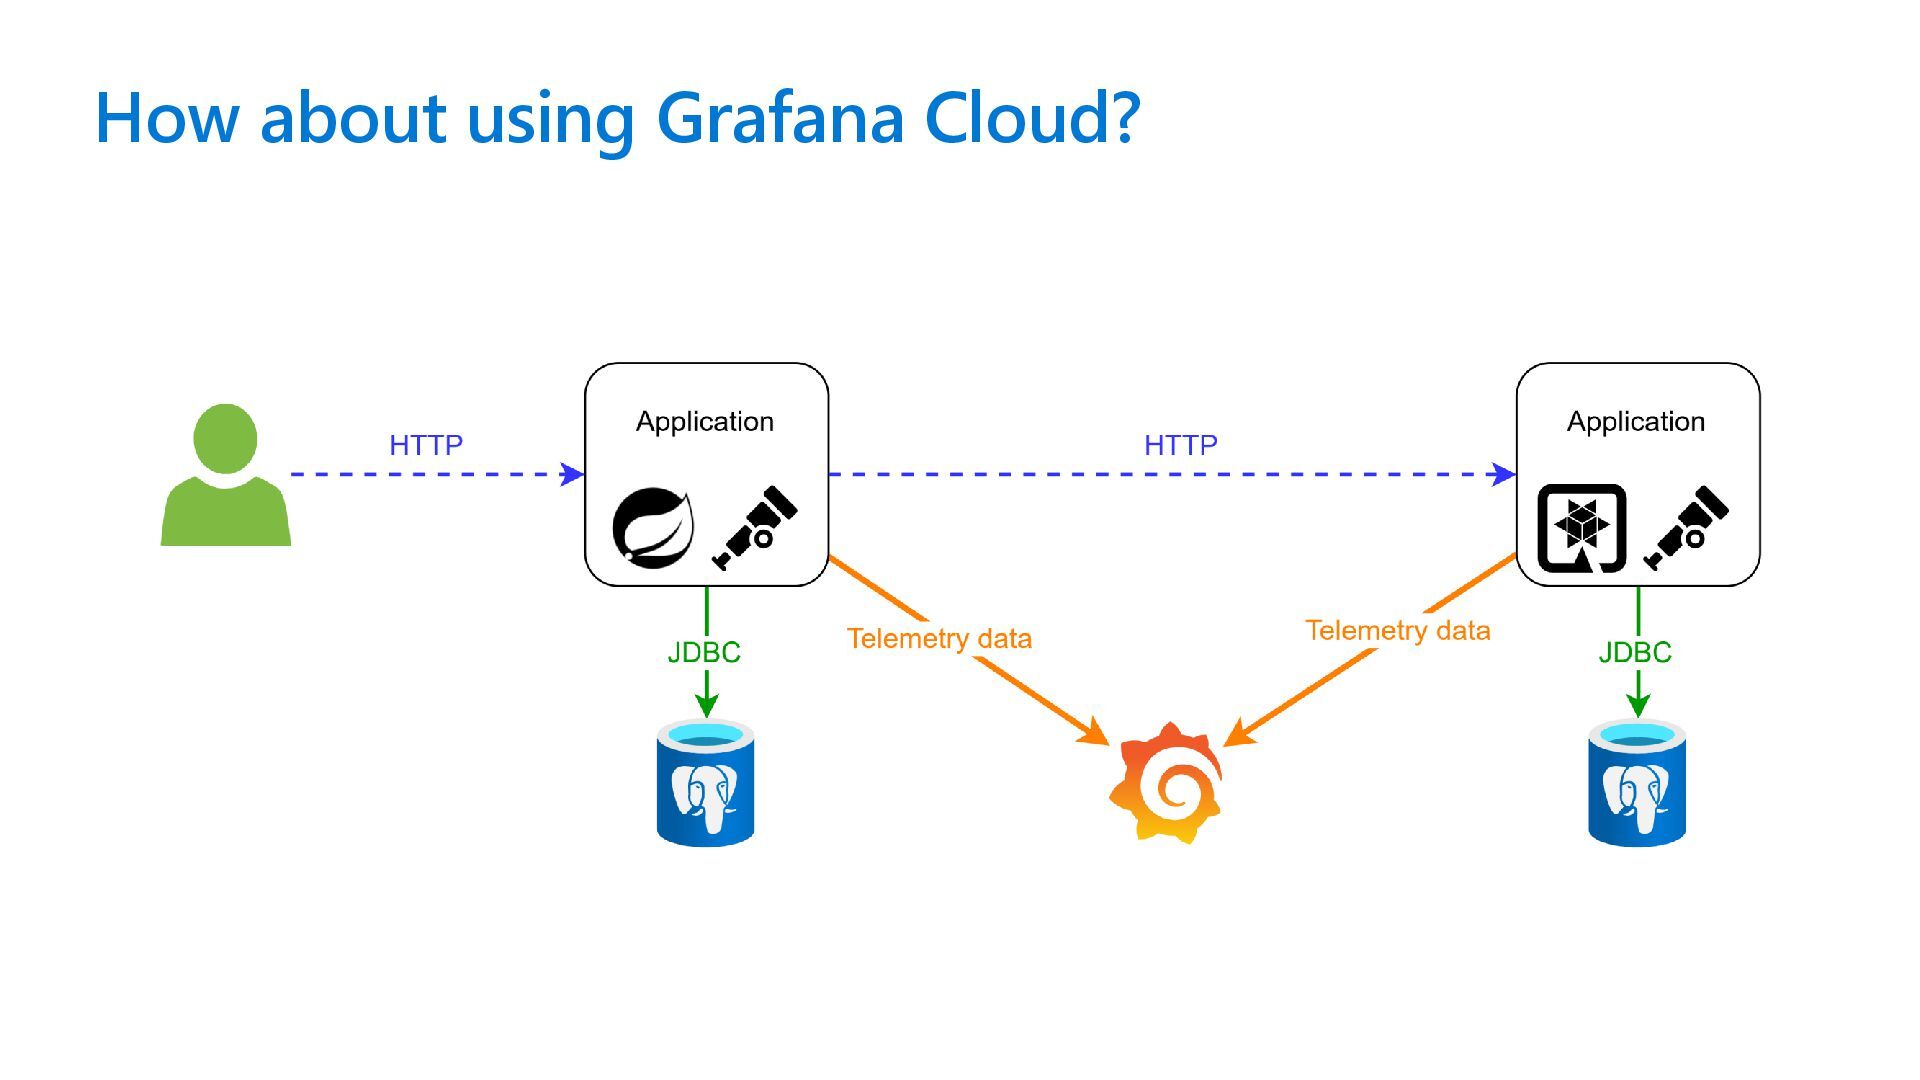
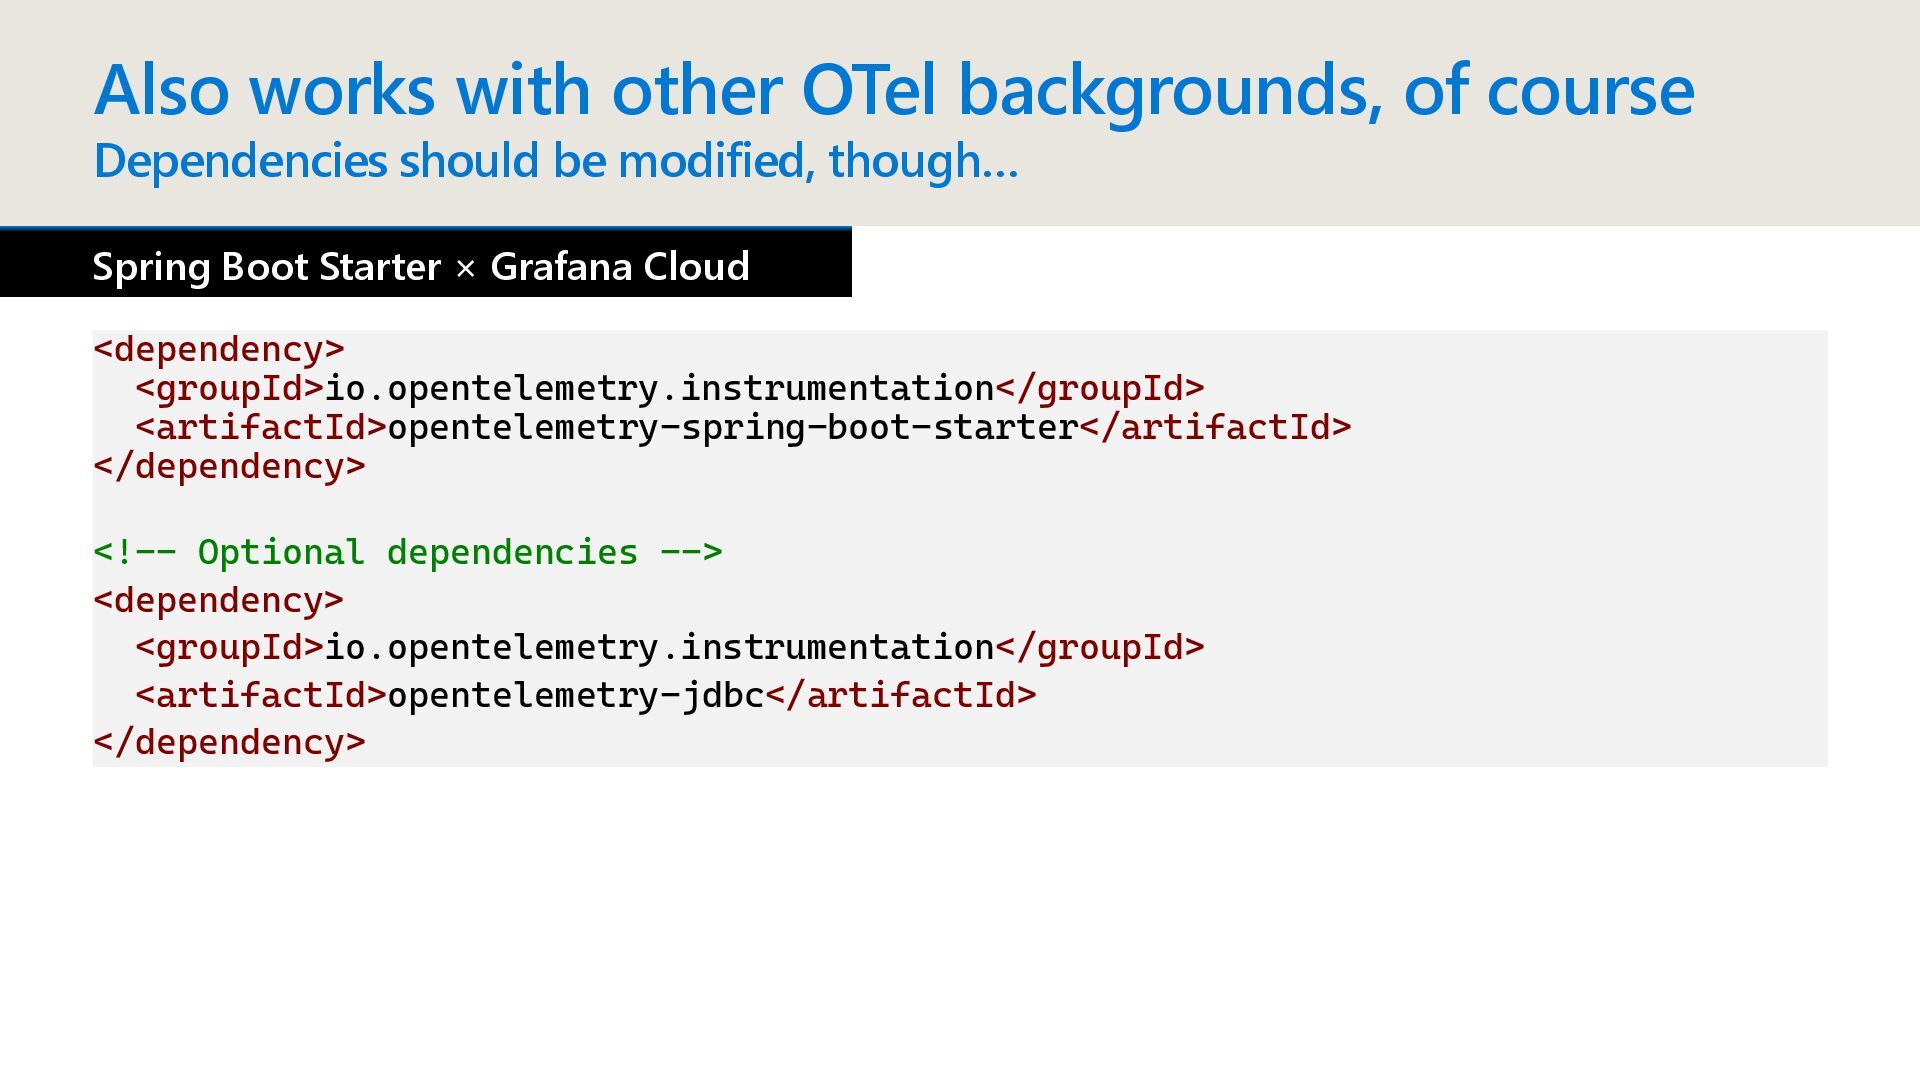
OpenTelemetry, etc. Spring Boot starter | OpenTelemetry Smaller startup overhead than OTel Java agent In CPU-restricted environments such as k8s, agents take longer to start up. Framework auto-instrumentation can co-exist along with a Java monitoring agent which has been already used. In the case of OTel Java agent, it might not work with the other agent. Can use configuration files (application.properties, application.yml) as well as environment variables. Configuration files does not work with OTel Java agent. Supports JVM metrics Agent is not the only option.
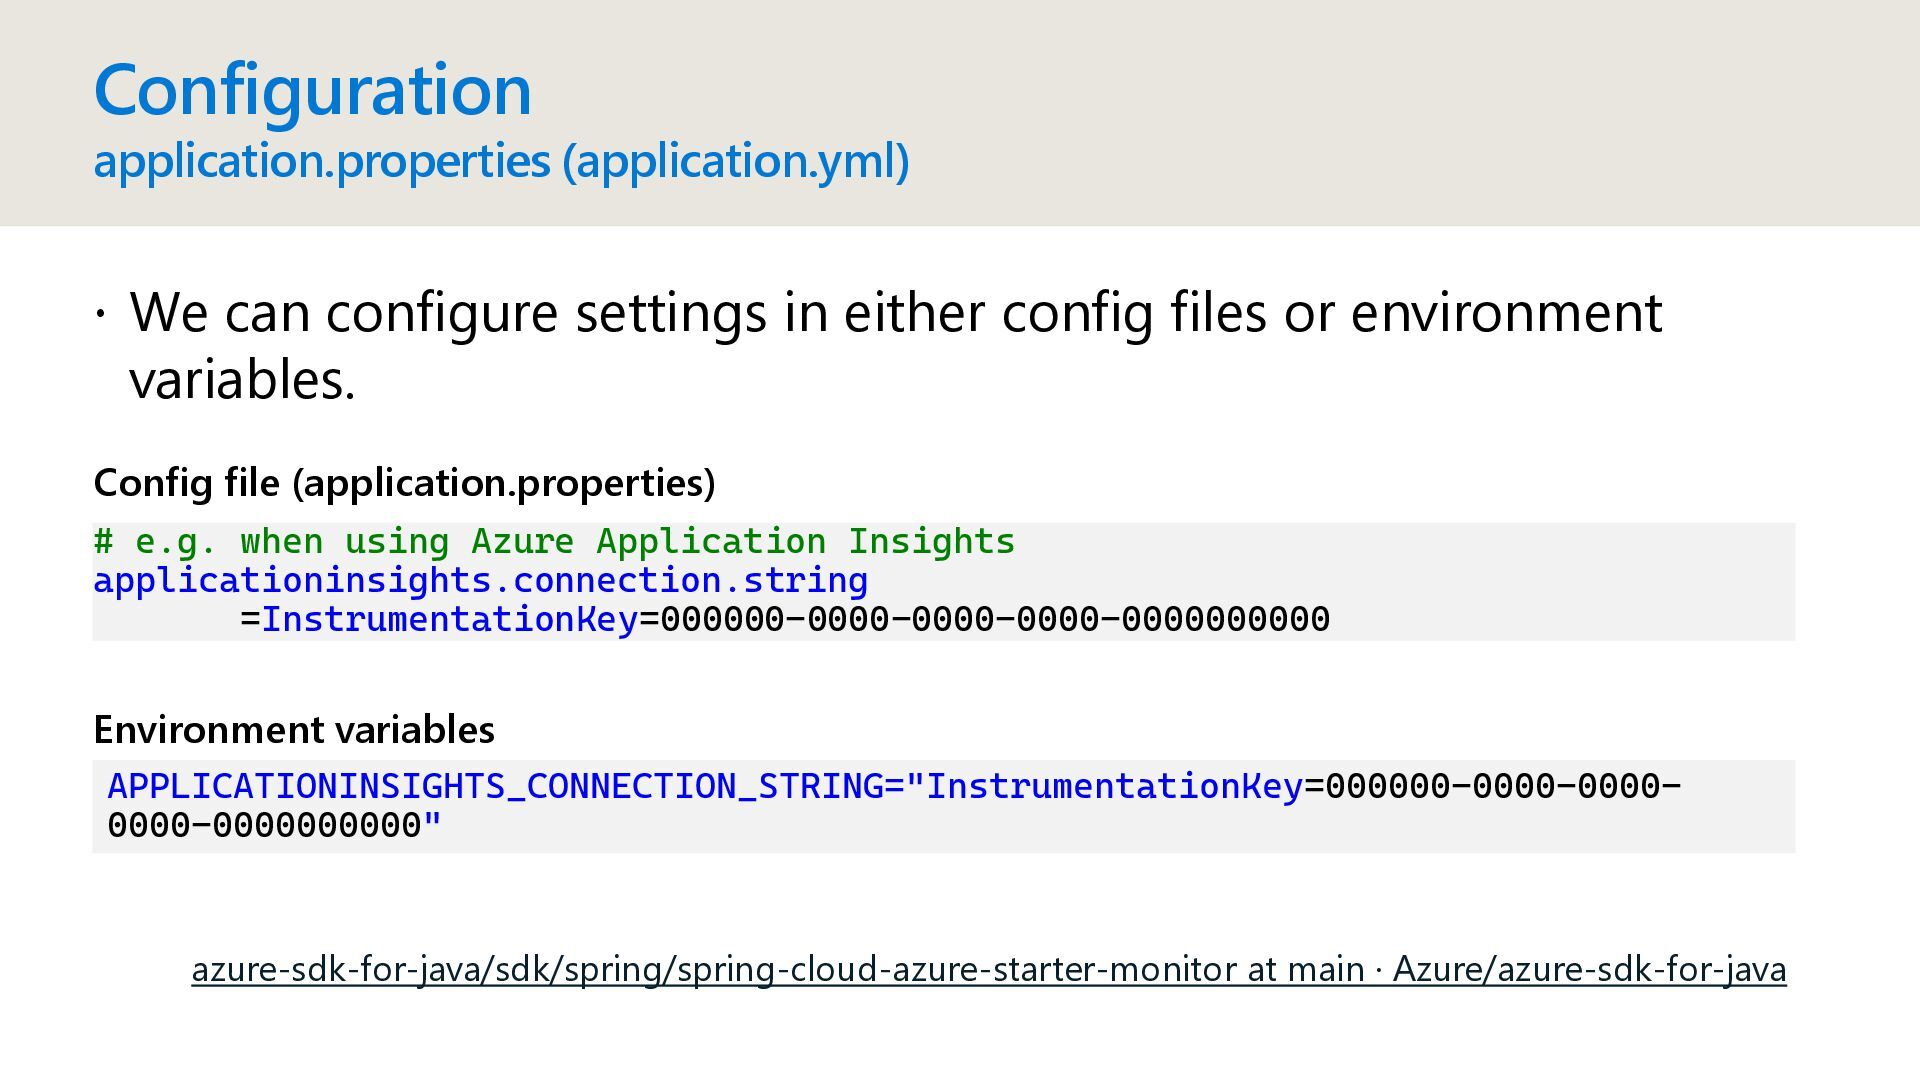
application.properties (application.yml) APPLICATIONINSIGHTS_CONNECTION_STRING="InstrumentationKey=000000-0000-0000- 0000-0000000000" azure-sdk-for-java/sdk/spring/spring-cloud-azure-starter-monitor at main · Azure/azure-sdk-for-java Environment variables We can configure settings in either config files or environment variables. Config file (application.properties)
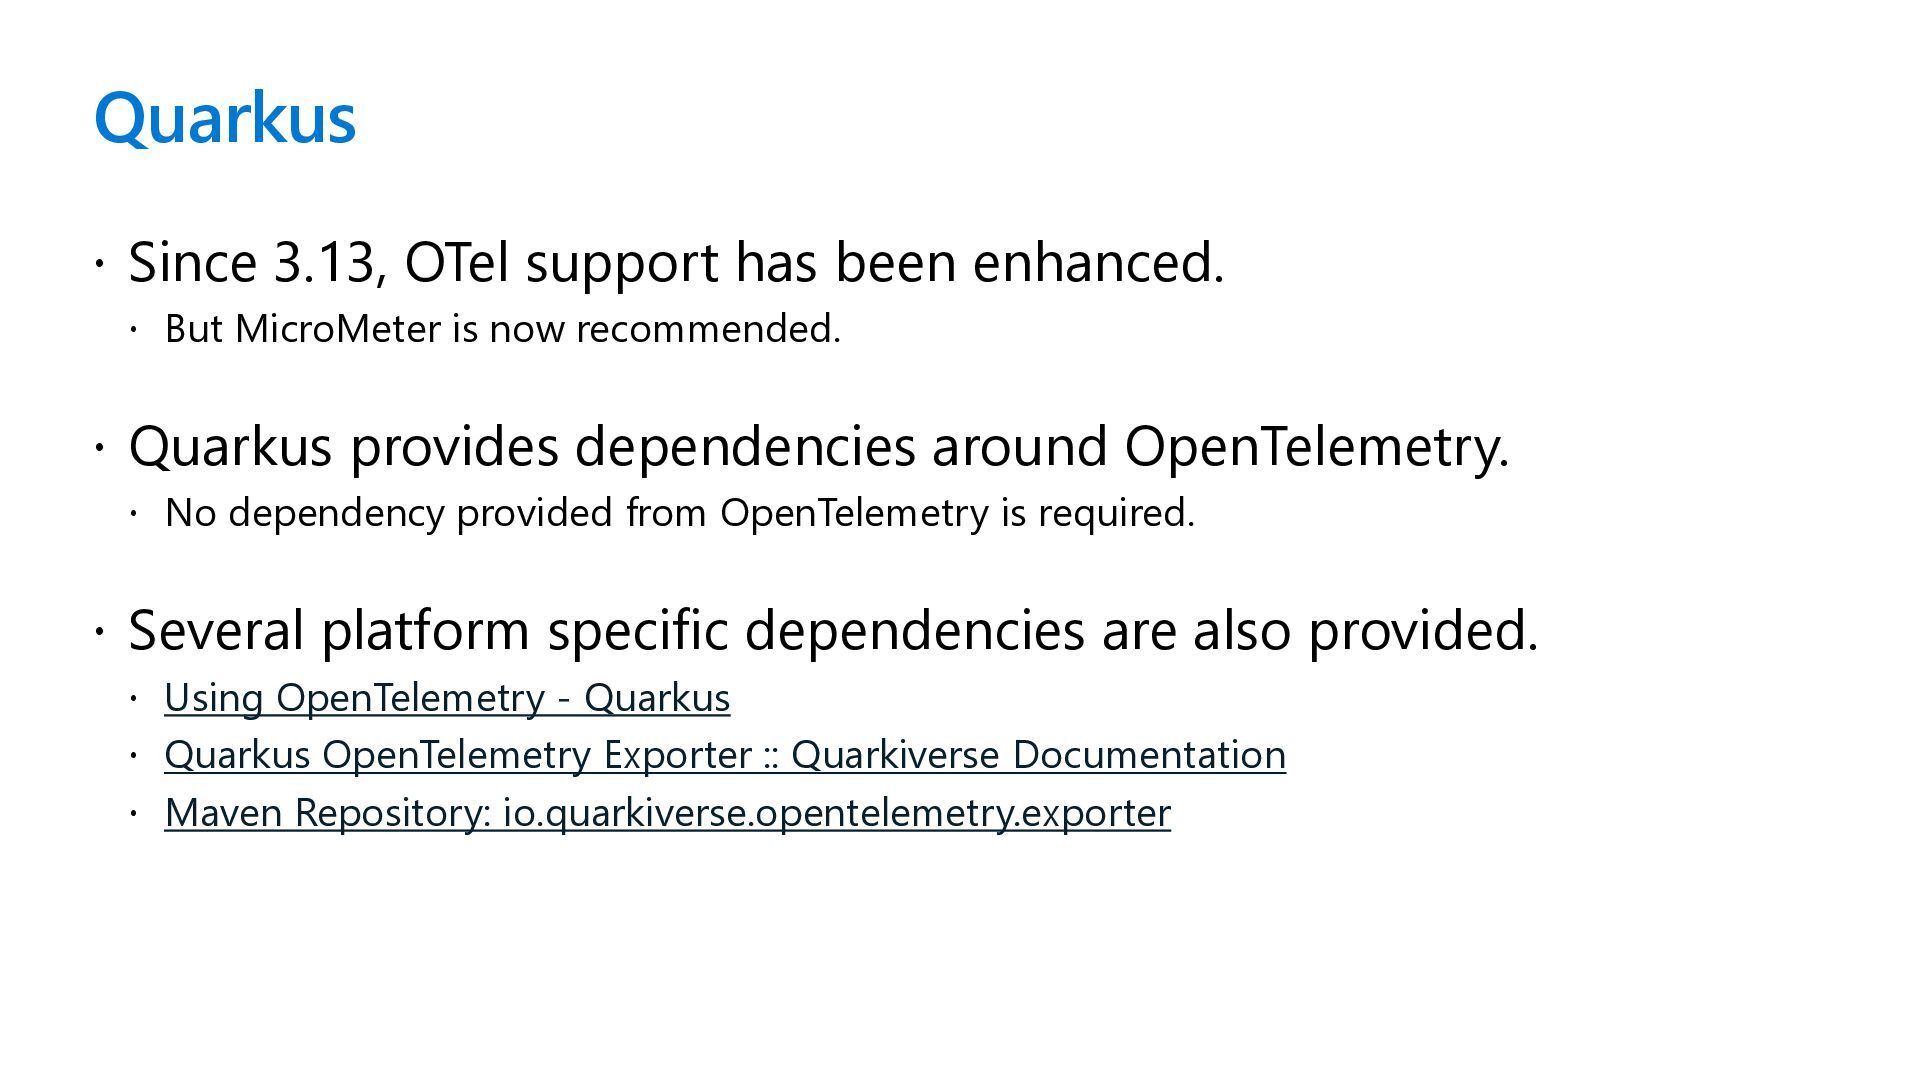
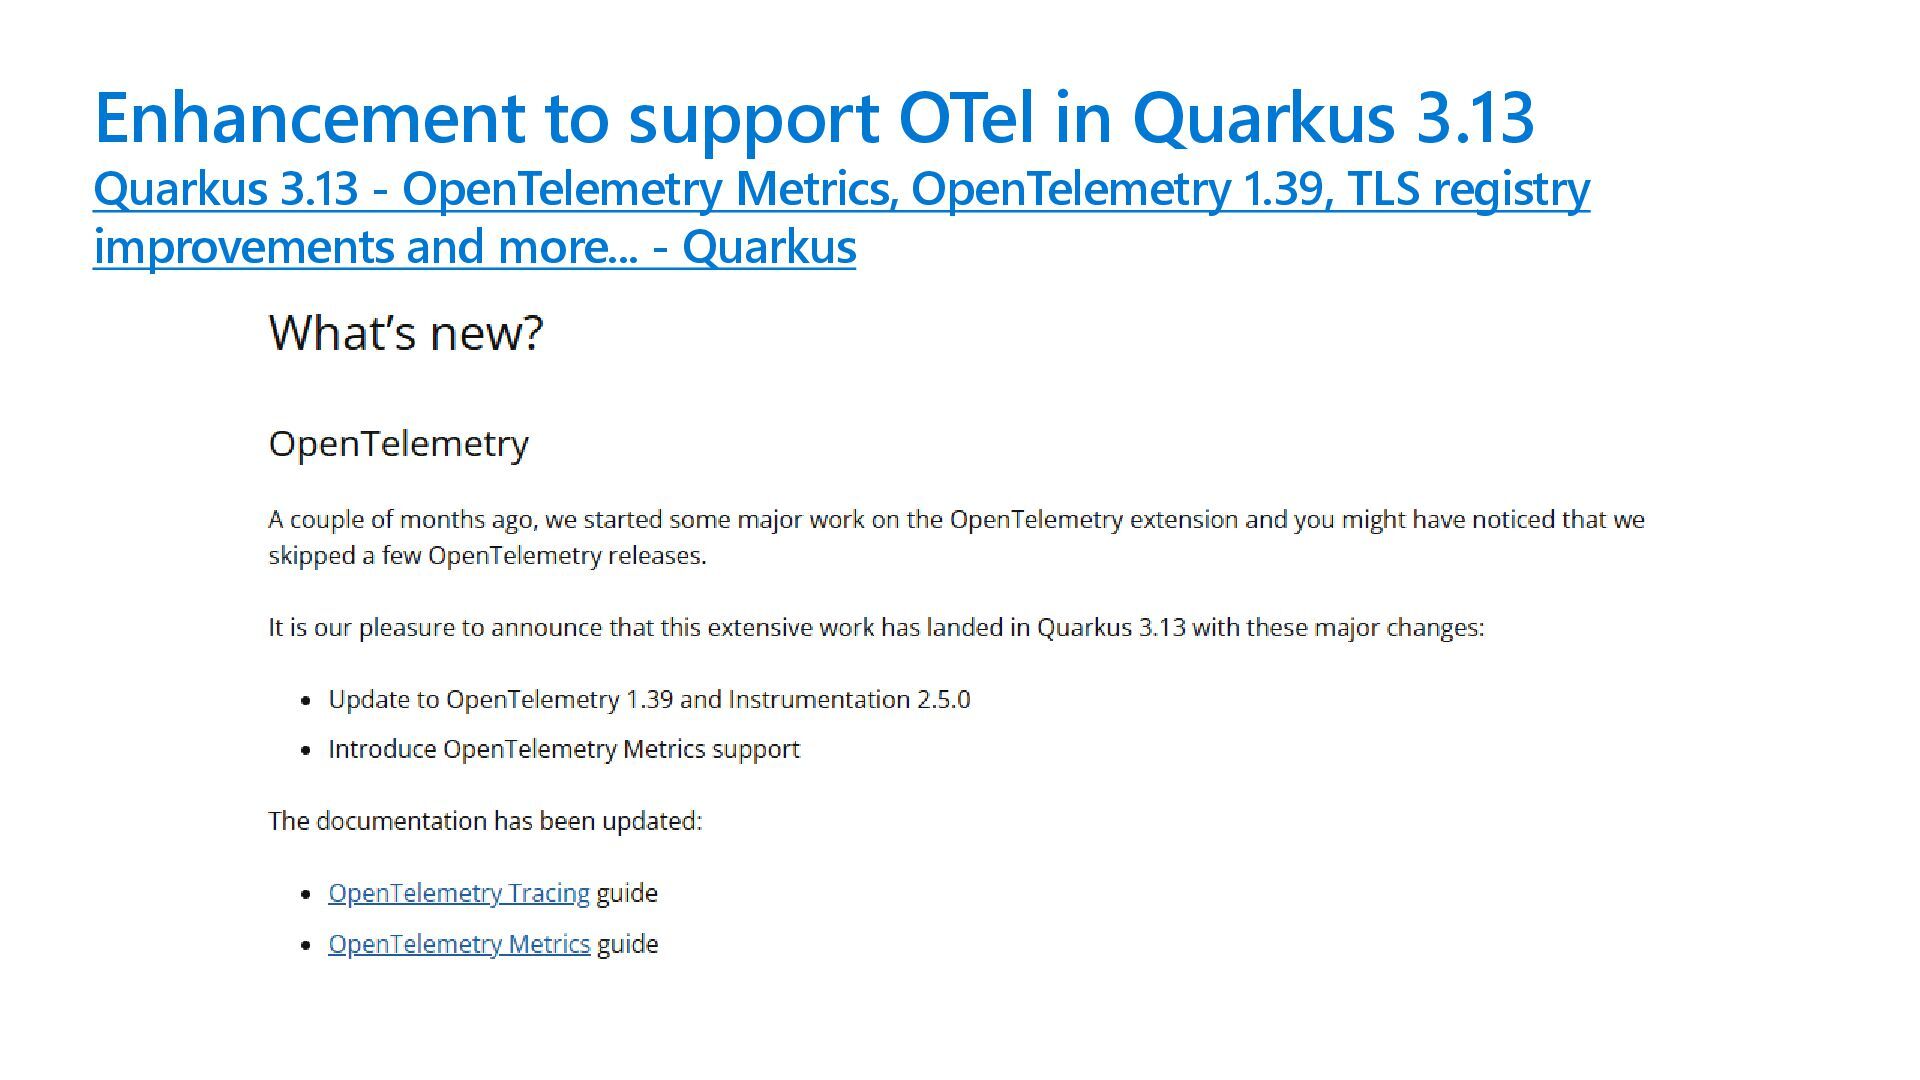
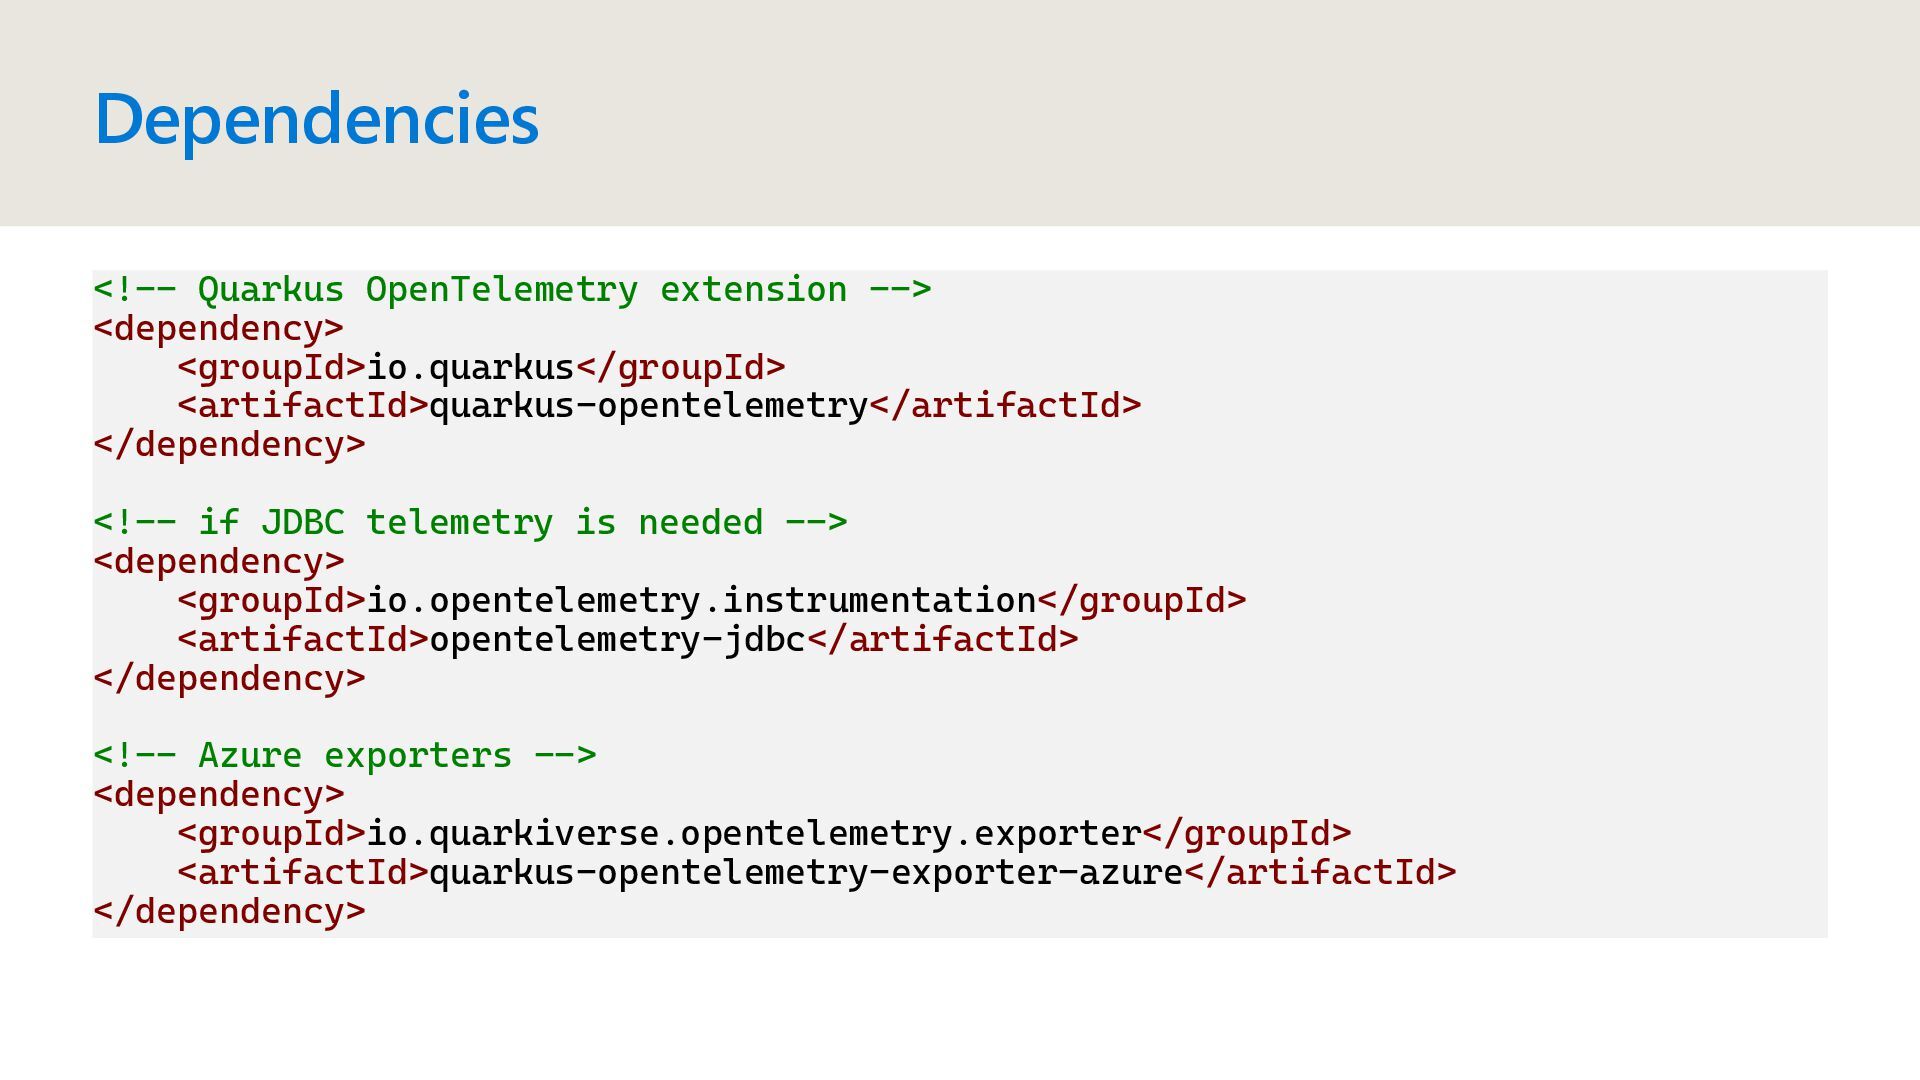
But MicroMeter is now recommended. Quarkus provides dependencies around OpenTelemetry. No dependency provided from OpenTelemetry is required. Several platform specific dependencies are also provided. Using OpenTelemetry - Quarkus Quarkus OpenTelemetry Exporter :: Quarkiverse Documentation Maven Repository: io.quarkiverse.opentelemetry.exporter
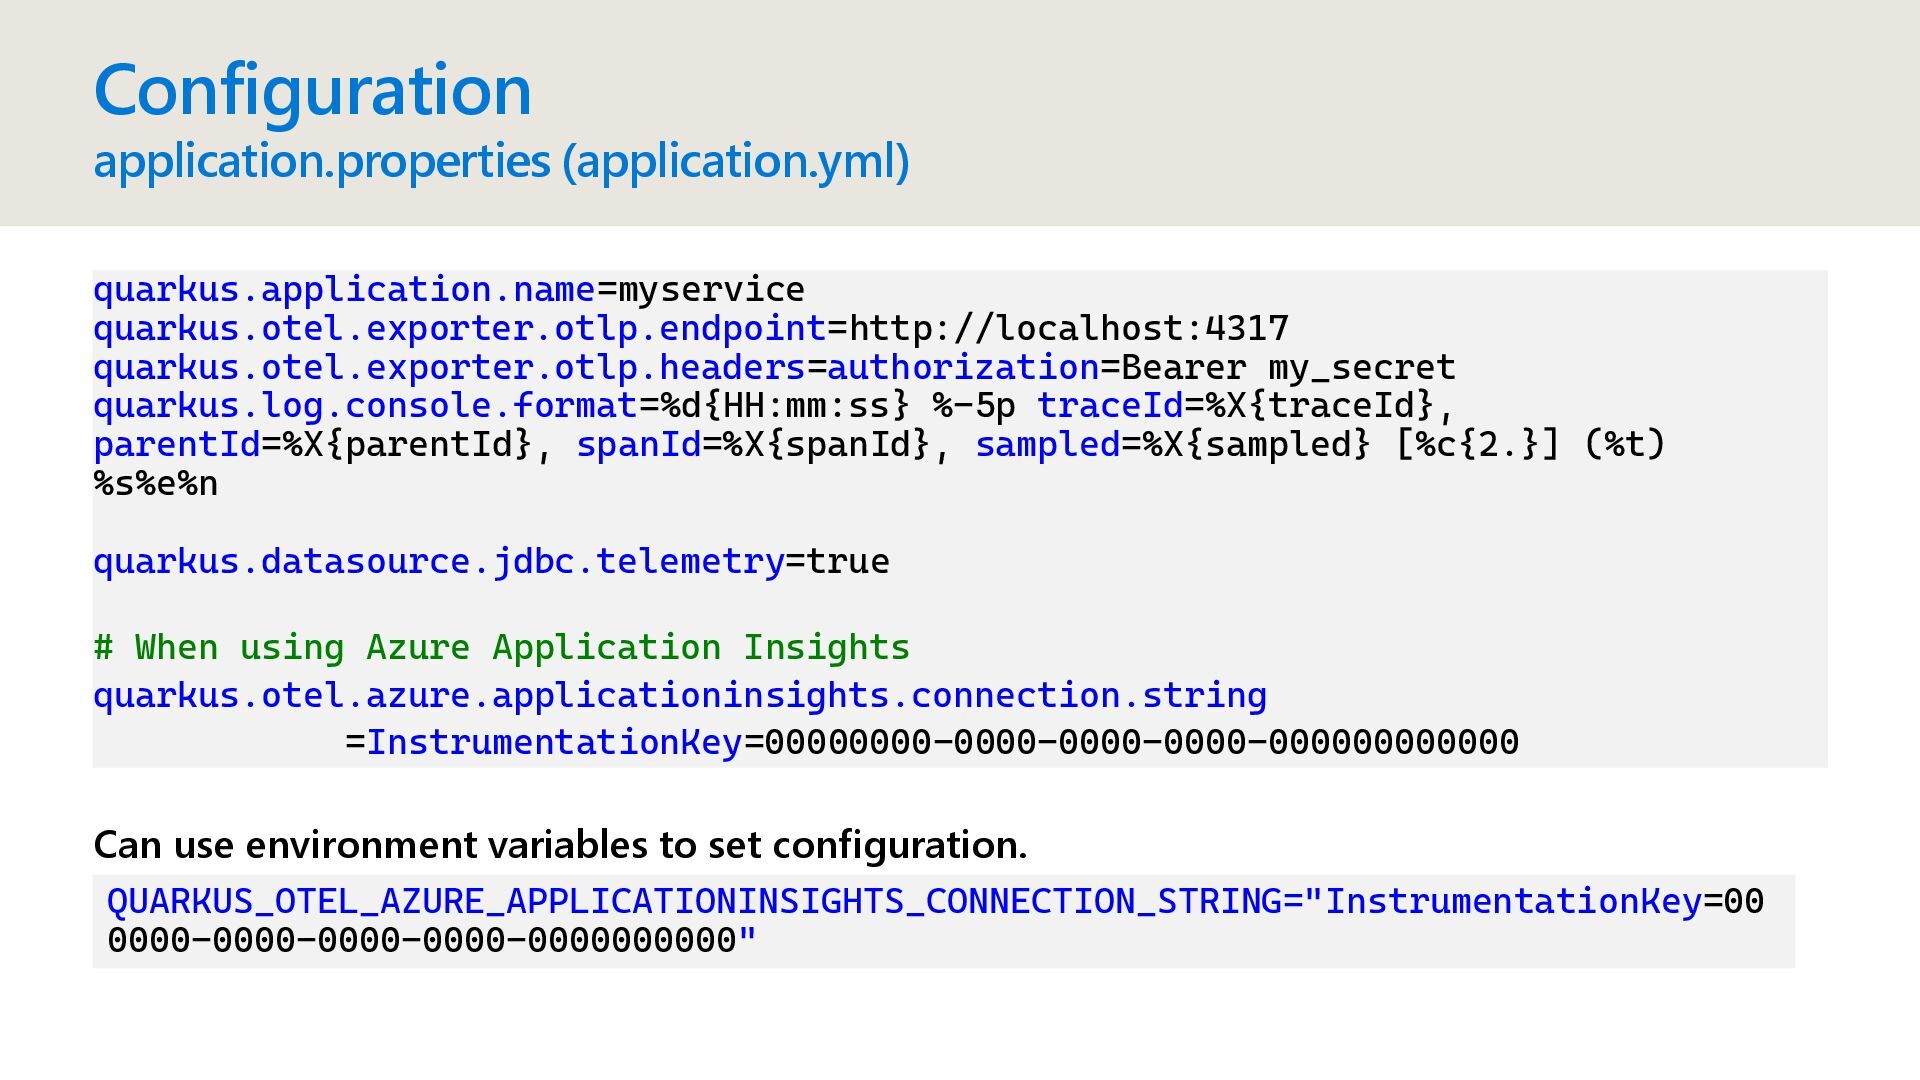
[%c{2.}] (%t) %s%e%n quarkus.datasource.jdbc.telemetry=true # When using Azure Application Insights quarkus.otel.azure.applicationinsights.connection.string =InstrumentationKey=00000000-0000-0000-0000-000000000000 Configuration application.properties (application.yml) QUARKUS_OTEL_AZURE_APPLICATIONINSIGHTS_CONNECTION_STRING="InstrumentationKey=00 0000-0000-0000-0000-0000000000" Can use environment variables to set configuration.
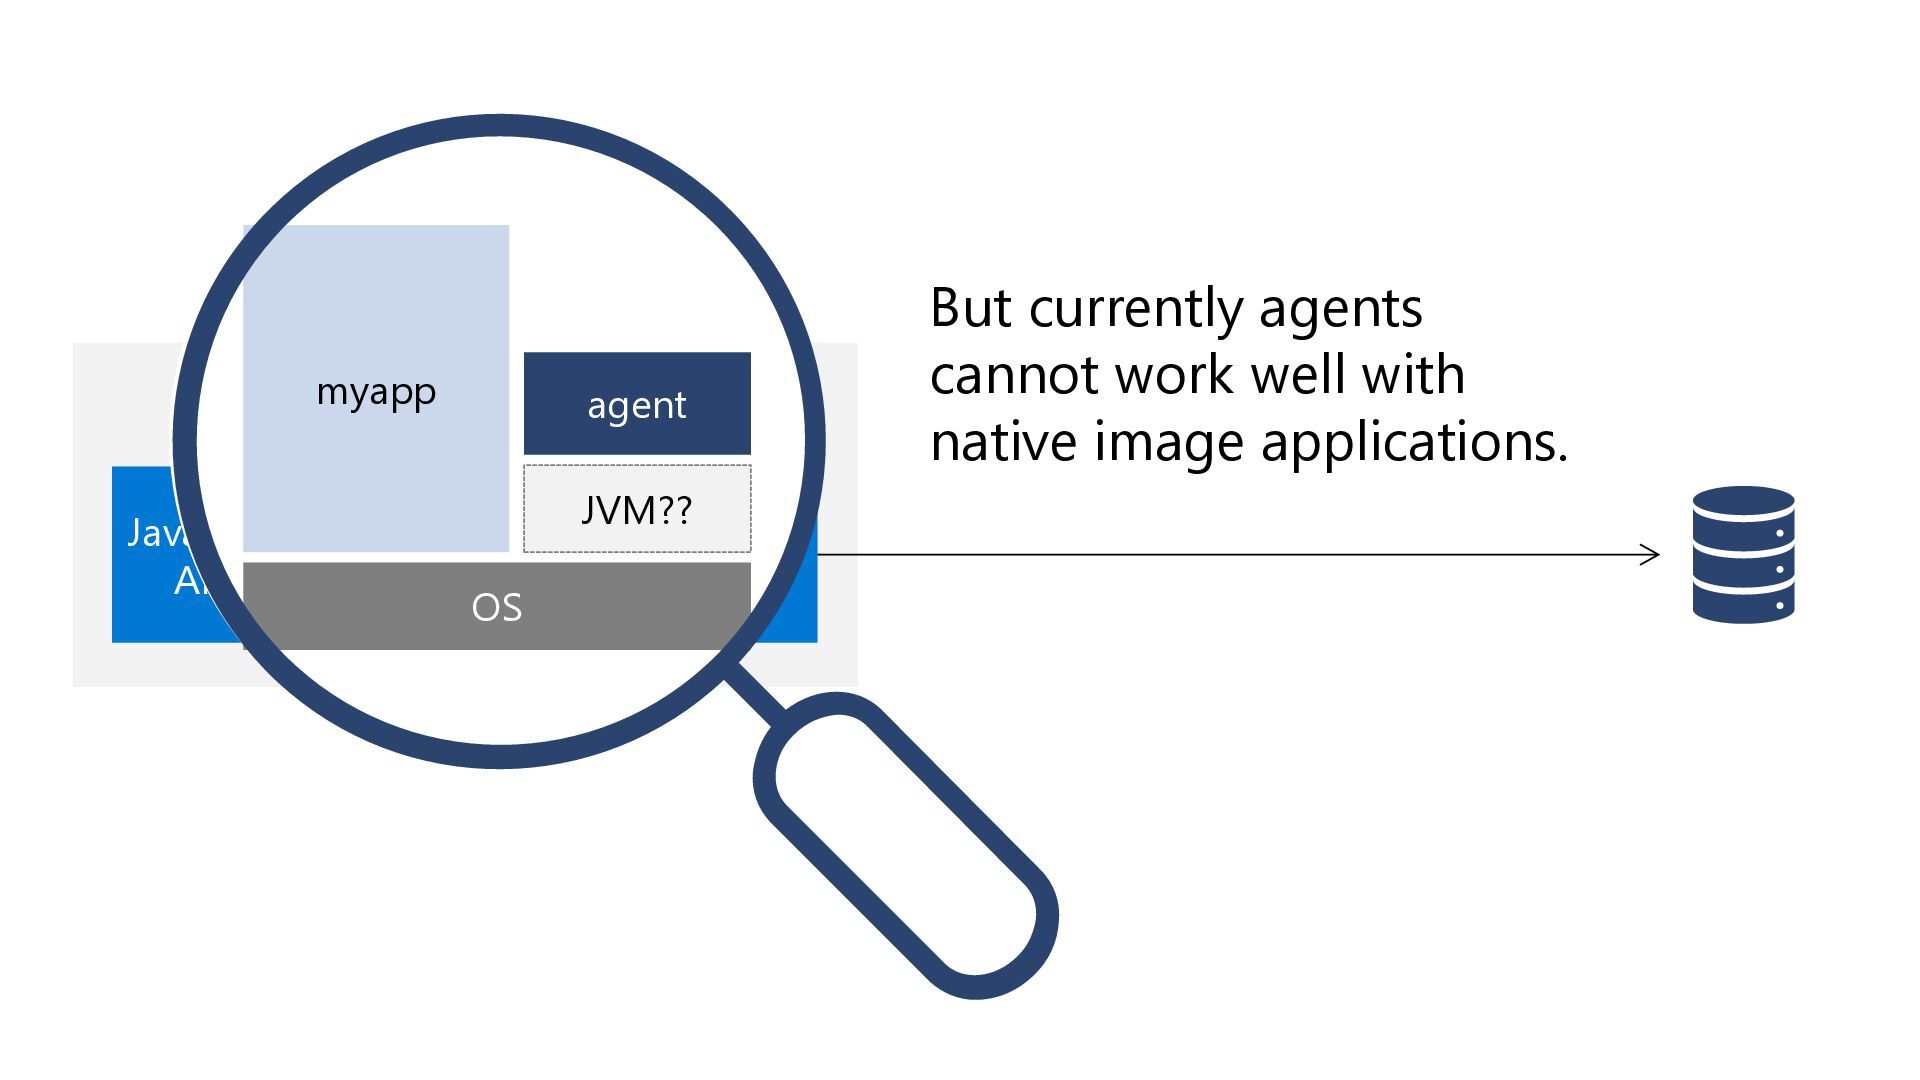
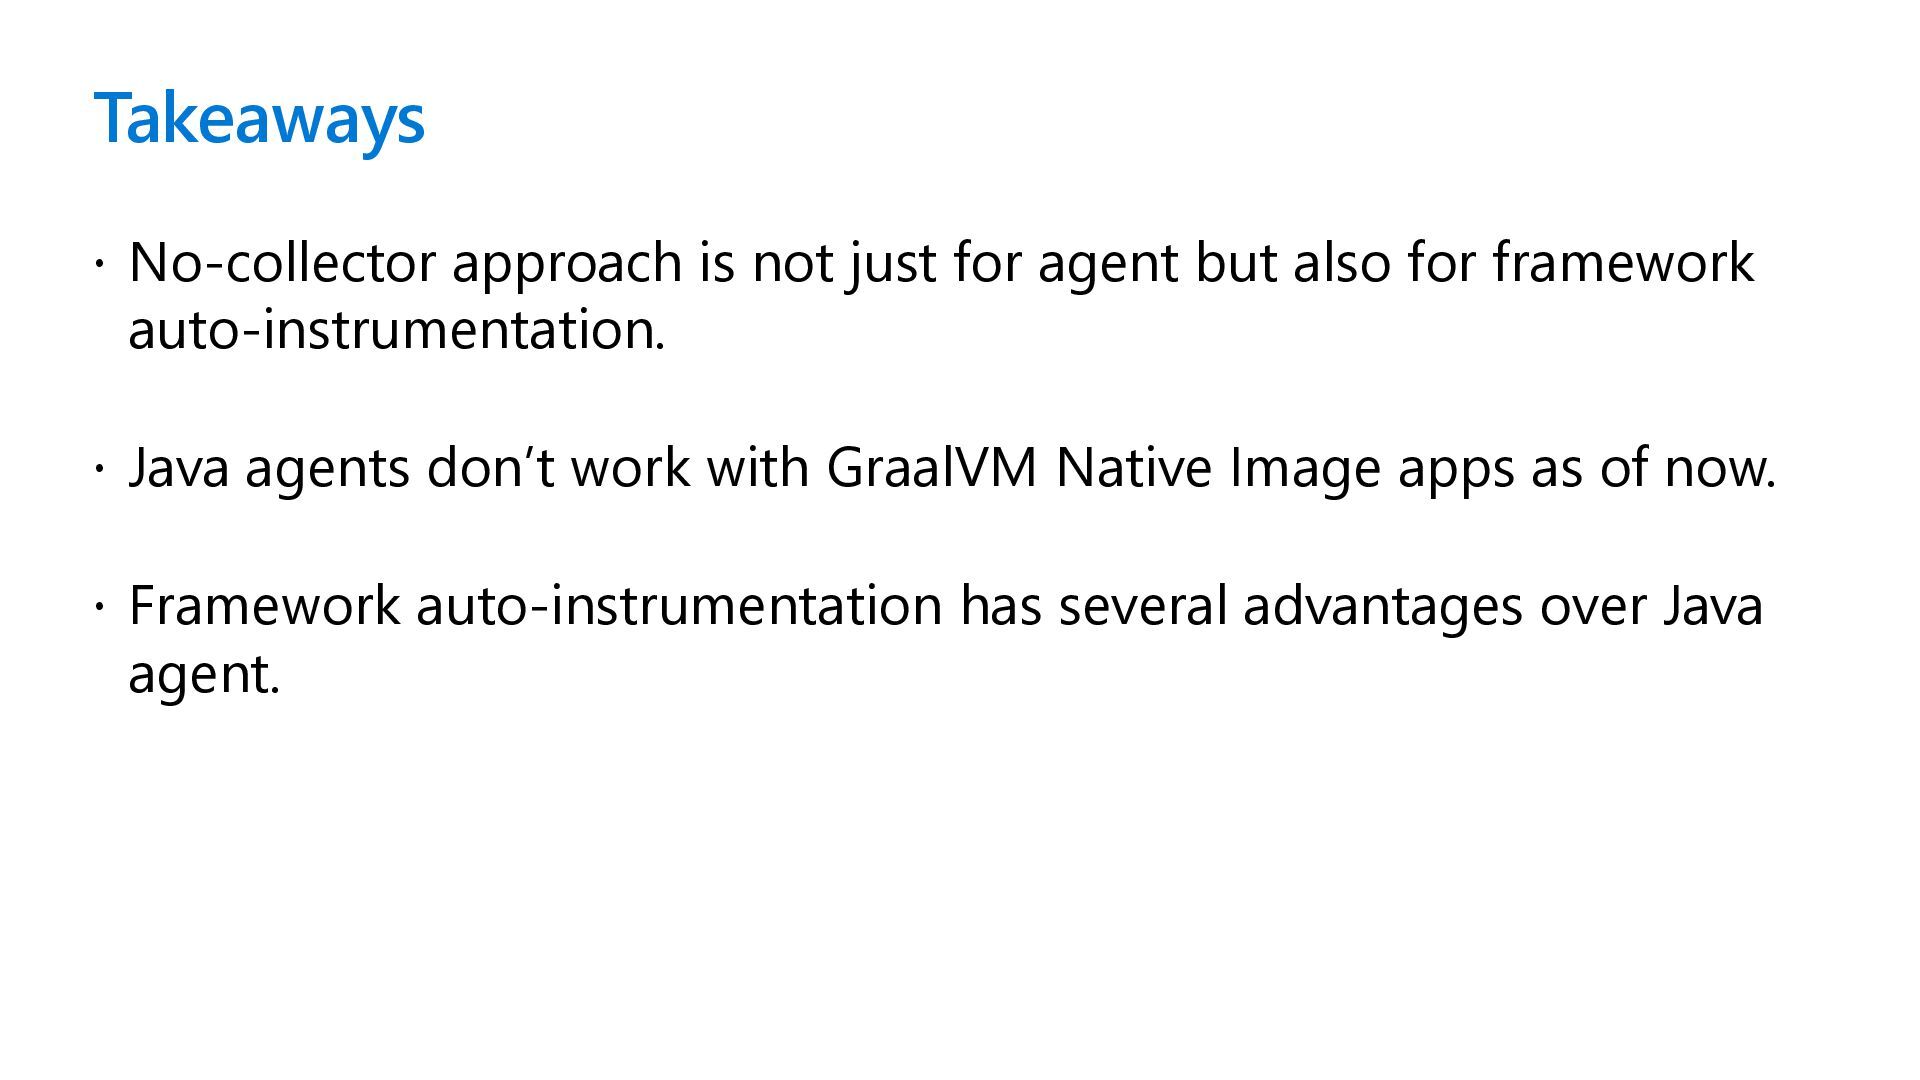
also for framework auto-instrumentation. Java agents don’t work with GraalVM Native Image apps as of now. Framework auto-instrumentation has several advantages over Java agent.
![Objectives [1] Focuses solely on collecting and delivering telemetry data.](https://files.speakerdeck.com/presentations/f1a04c1743c6432aa5b88d76194e6acf/slide_12.jpg)
![As of now, agents are not supported. [GR-55707] Java Agents](https://files.speakerdeck.com/presentations/f1a04c1743c6432aa5b88d76194e6acf/slide_32.jpg)