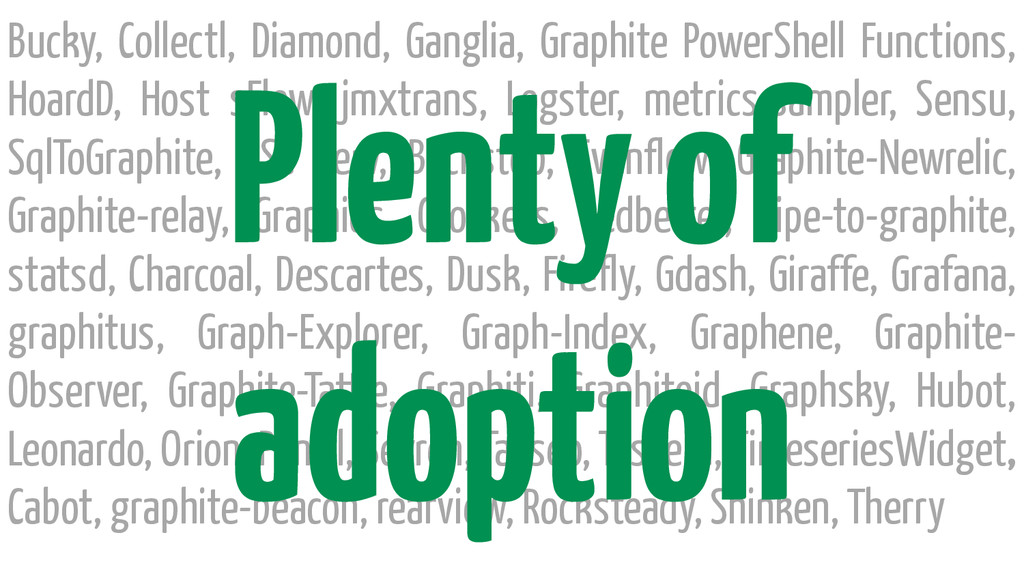
jmxtrans, Logster, metrics-sampler, Sensu, SqlToGraphite, SSC Serv, Backstop, Evenflow, Graphite-Newrelic, Graphite-relay, Graphios, Grockets, Ledbetter, pipe-to-graphite, statsd, Charcoal, Descartes, Dusk, Firefly, Gdash, Giraffe, Grafana, graphitus, Graph-Explorer, Graph-Index, Graphene, Graphite- Observer, Graphite-Tattle, Graphiti, Graphitoid, Graphsky, Hubot, Leonardo, Orion, Pencil, Seyren, Tasseo, Tessera, TimeseriesWidget, Cabot, graphite-beacon, rearview, Rocksteady, Shinken, Therry Plenty of adoption
![host.cpu-[0-7].cpu-{user,system}.value wild cards allow filtering of nodes http://graphite.readthedocs.org/en/0.9.12/terminology.html#term-series-list](https://files.speakerdeck.com/presentations/2a6dbc904da501327dcb46daf8584bb8/slide_79.jpg)