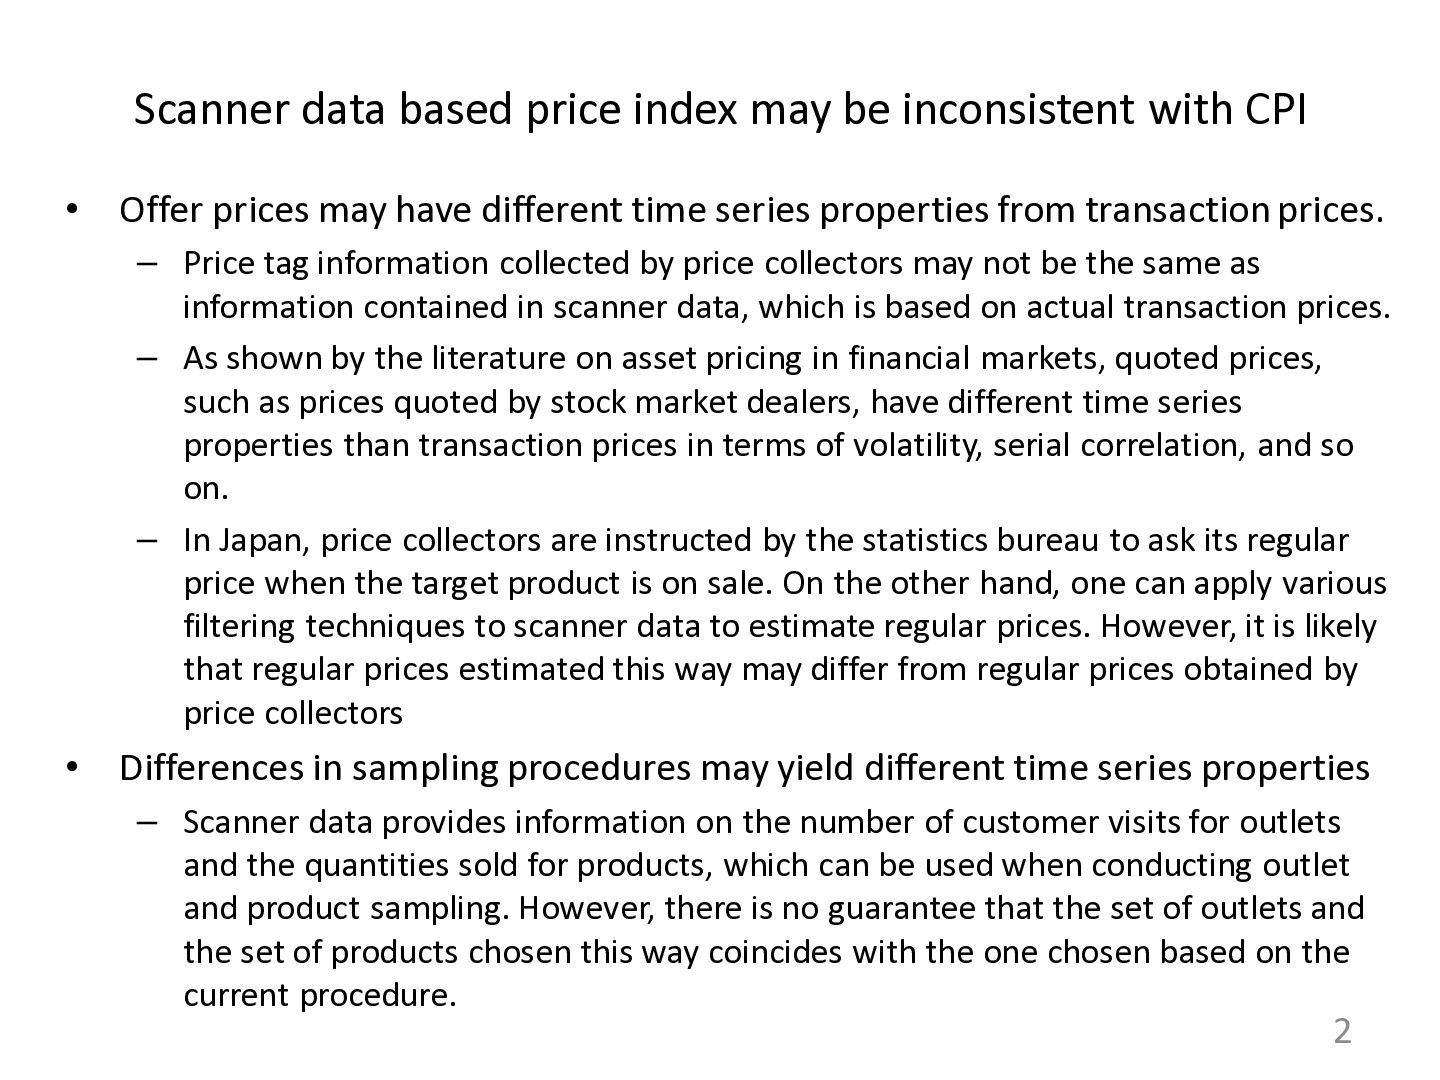
• Offer prices may have different time series properties from transaction prices. – Price tag information collected by price collectors may not be the same as information contained in scanner data, which is based on actual transaction prices. – As shown by the literature on asset pricing in financial markets, quoted prices, such as prices quoted by stock market dealers, have different time series properties than transaction prices in terms of volatility, serial correlation, and so on. – In Japan, price collectors are instructed by the statistics bureau to ask its regular price when the target product is on sale. On the other hand, one can apply various filtering techniques to scanner data to estimate regular prices. However, it is likely that regular prices estimated this way may differ from regular prices obtained by price collectors • Differences in sampling procedures may yield different time series properties – Scanner data provides information on the number of customer visits for outlets and the quantities sold for products, which can be used when conducting outlet and product sampling. However, there is no guarantee that the set of outlets and the set of products chosen this way coincides with the one chosen based on the current procedure. 2
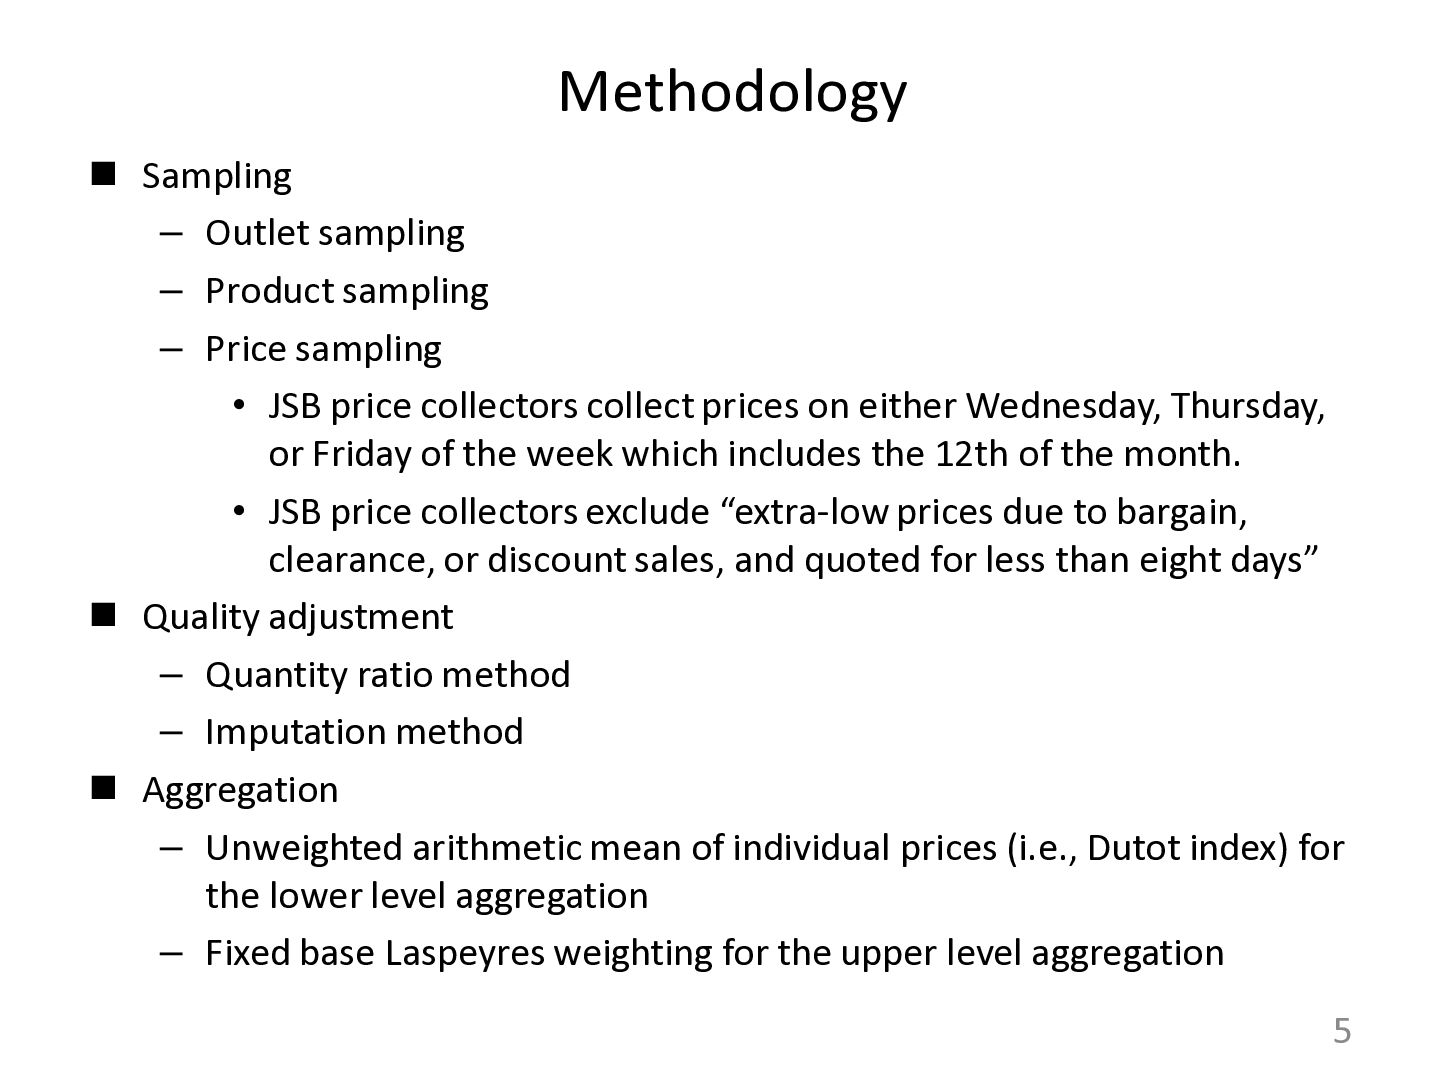
Price sampling • JSB price collectors collect prices on either Wednesday, Thursday, or Friday of the week which includes the 12th of the month. • JSB price collectors exclude “extra-low prices due to bargain, clearance, or discount sales, and quoted for less than eight days” Quality adjustment – Quantity ratio method – Imputation method Aggregation – Unweighted arithmetic mean of individual prices (i.e., Dutot index) for the lower level aggregation – Fixed base Laspeyres weighting for the upper level aggregation 5
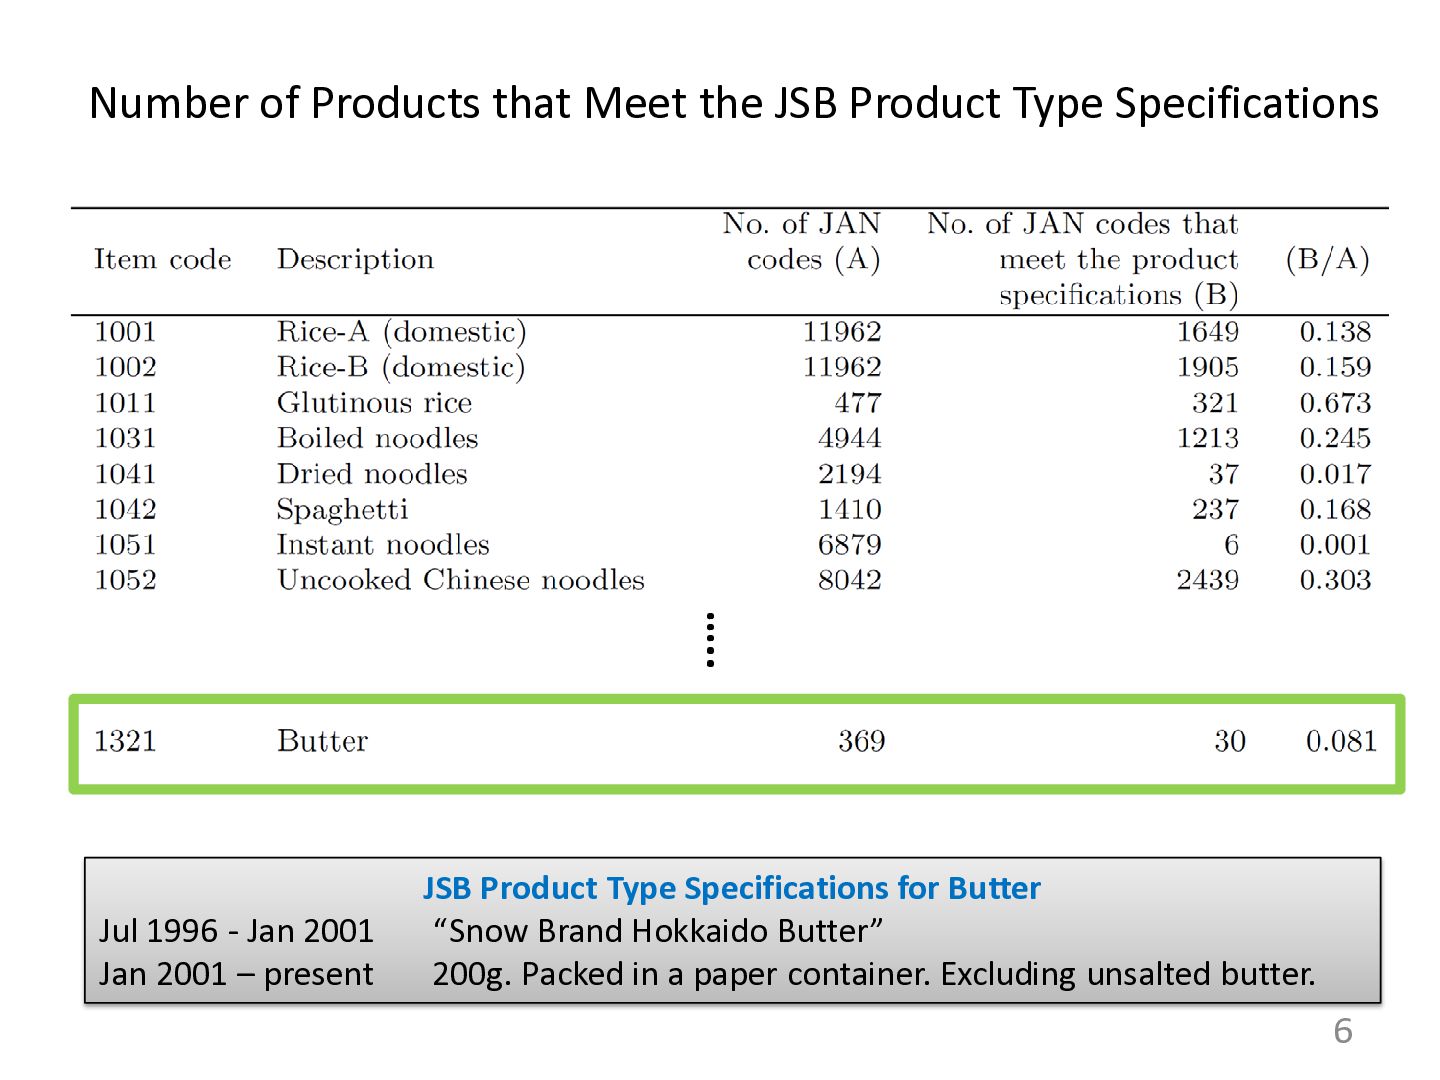
Specifications ….. JSB Product Type Specifications for Butter Jul 1996 - Jan 2001 “Snow Brand Hokkaido Butter” Jan 2001 – present 200g. Packed in a paper container. Excluding unsalted butter.
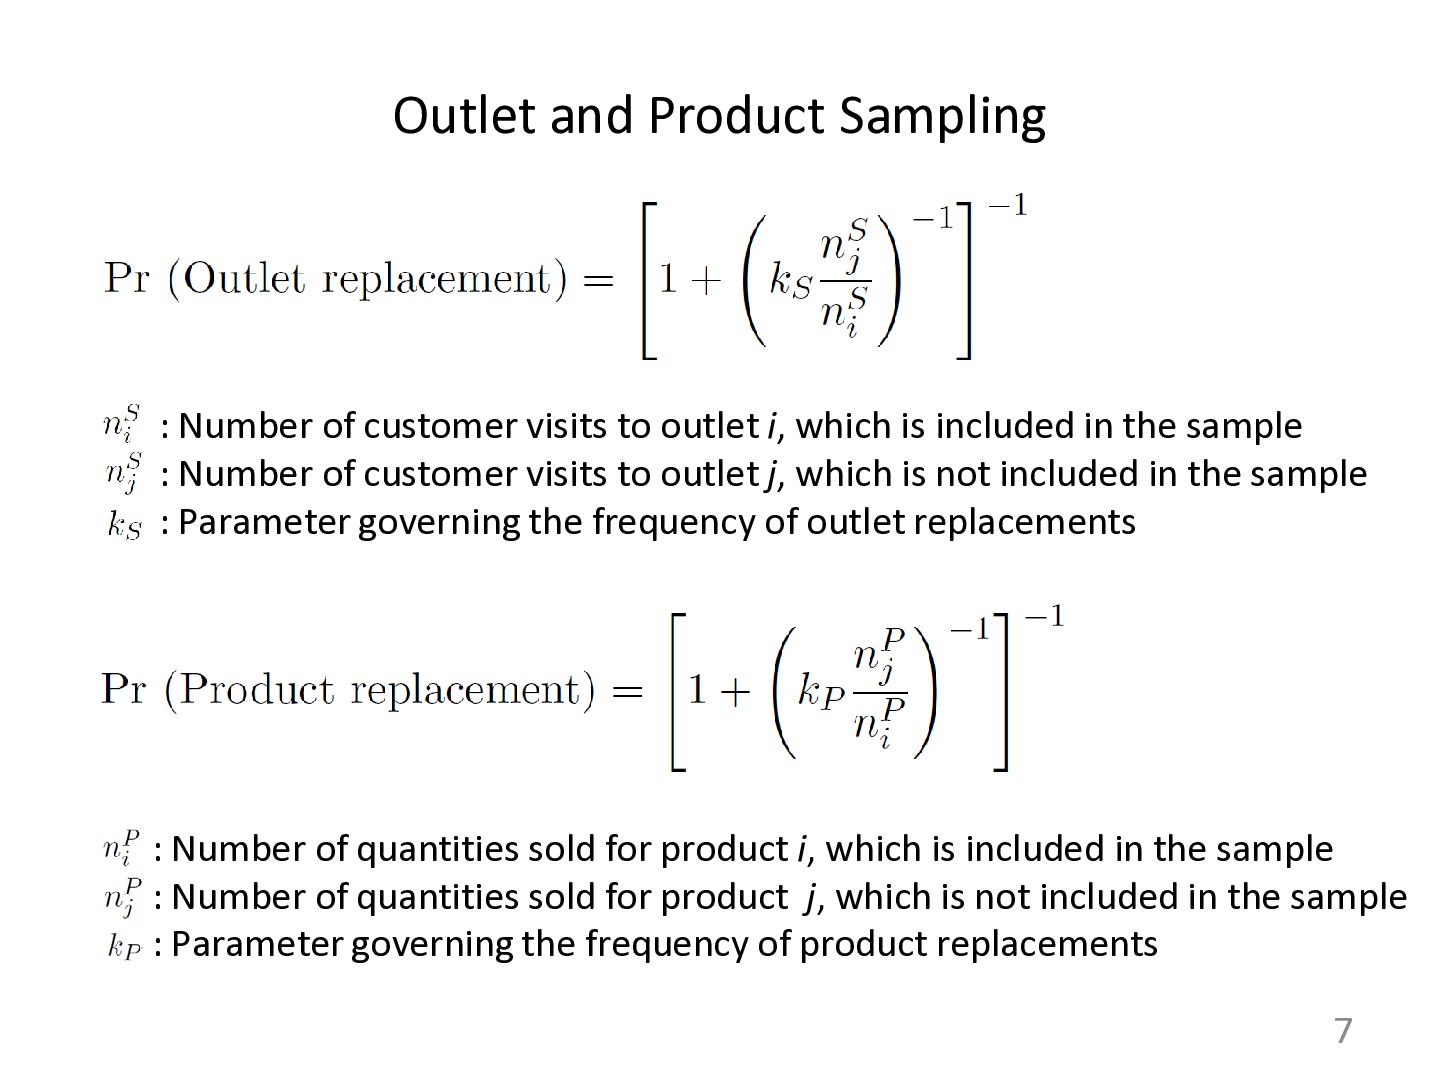
to outlet i, which is included in the sample : Number of customer visits to outlet j, which is not included in the sample : Parameter governing the frequency of outlet replacements : Number of quantities sold for product i, which is included in the sample : Number of quantities sold for product j, which is not included in the sample : Parameter governing the frequency of product replacements
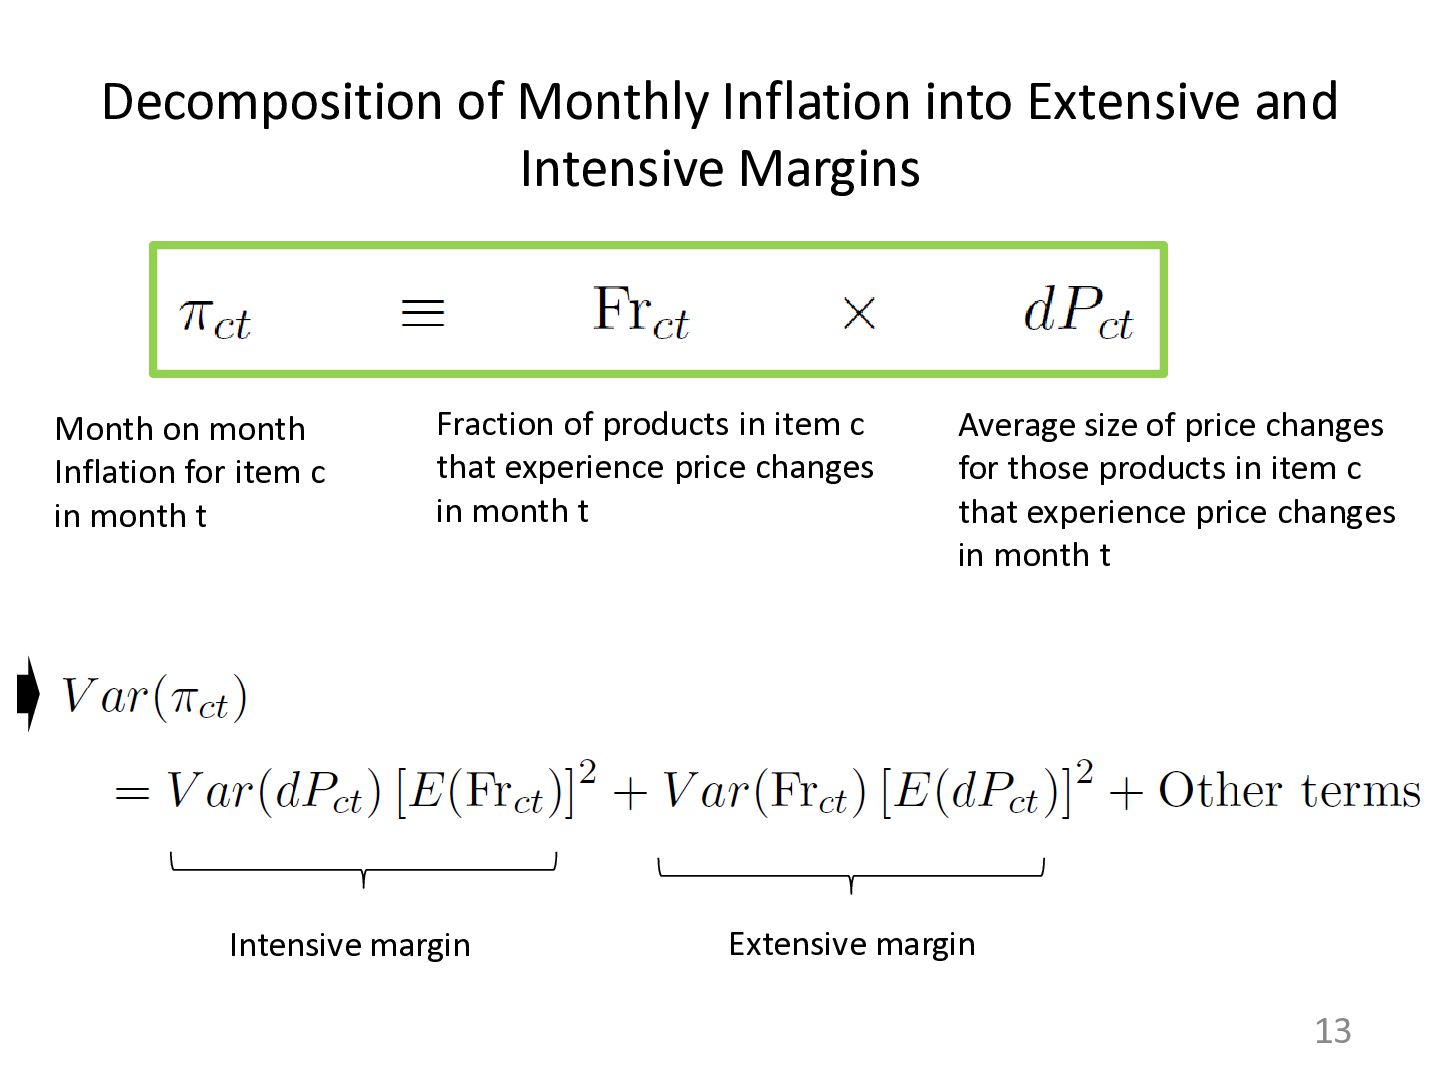
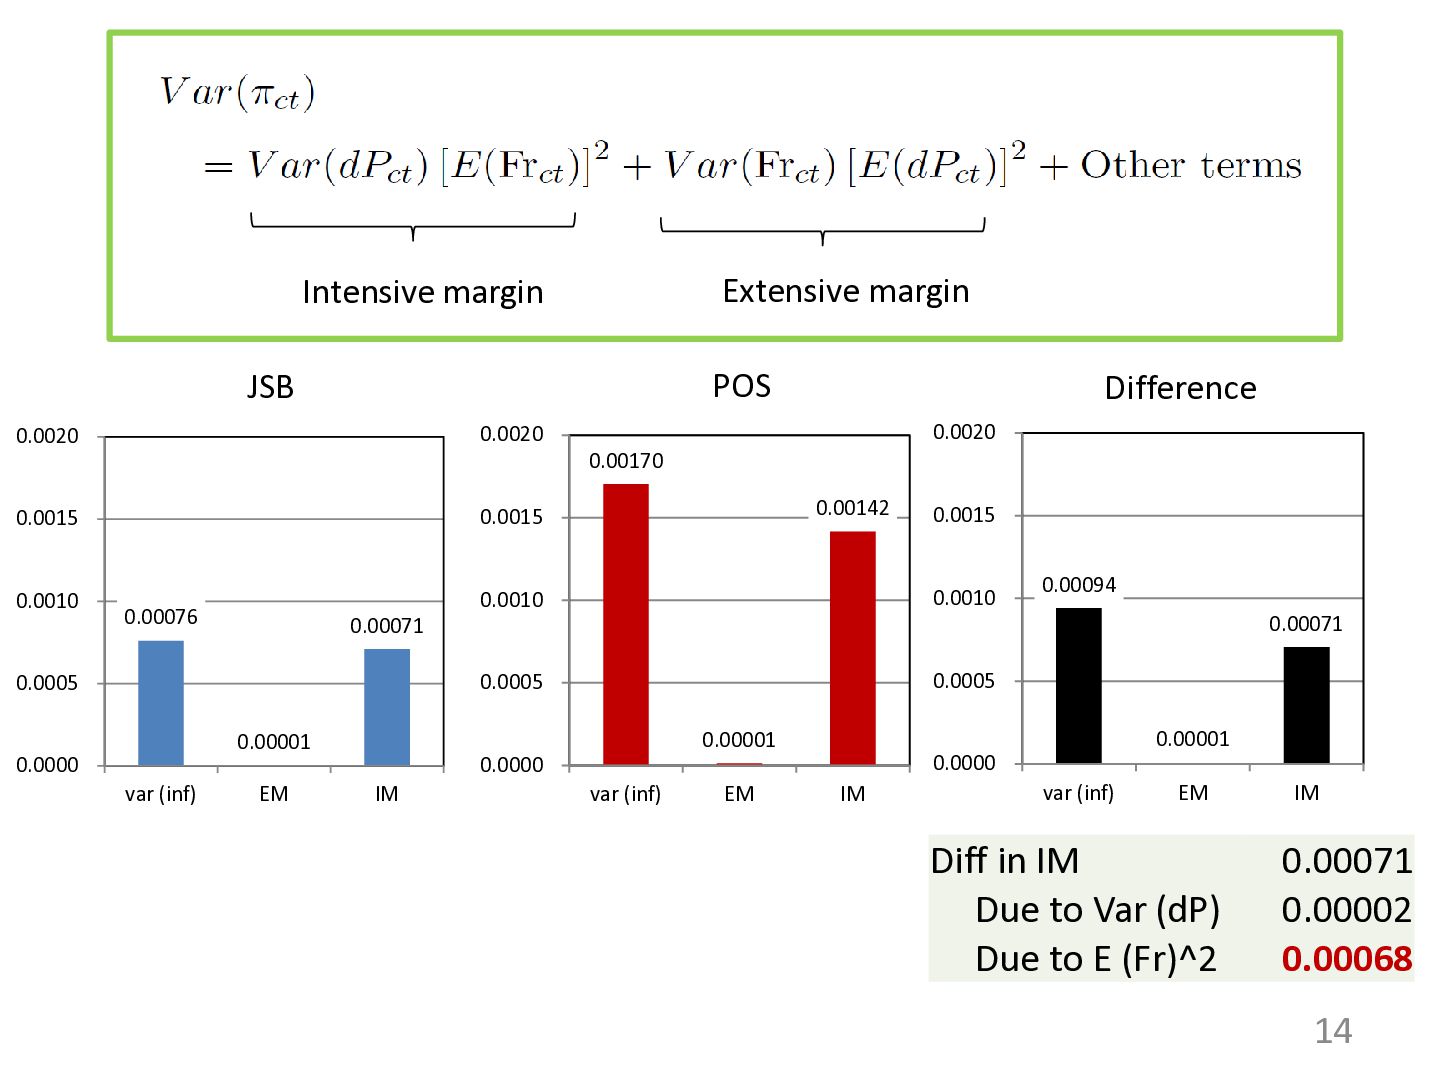
Month on month Inflation for item c in month t Fraction of products in item c that experience price changes in month t Average size of price changes for those products in item c that experience price changes in month t Intensive margin Extensive margin
(inf) EM IM JSB 0.00170 0.00001 0.00142 0.0000 0.0005 0.0010 0.0015 0.0020 var (inf) EM IM POS 0.00094 0.00001 0.00071 0.0000 0.0005 0.0010 0.0015 0.0020 var (inf) EM IM Difference Intensive margin Extensive margin Diff in IM 0.00071 Due to Var (dP) 0.00002 Due to E (Fr)^2 0.00068
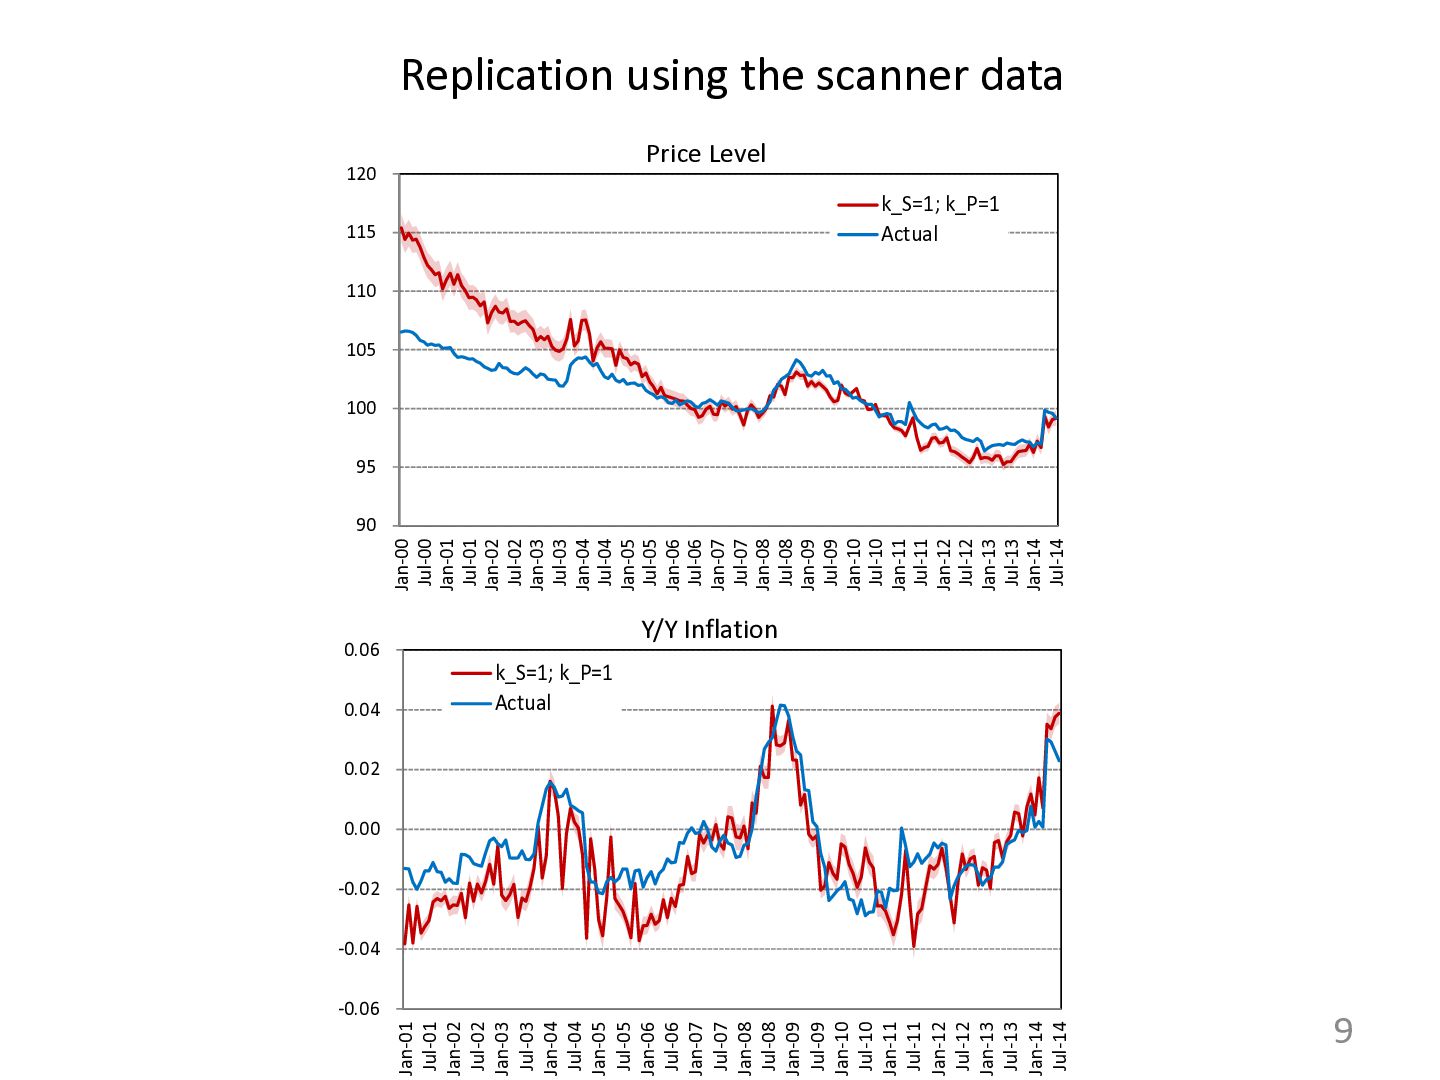
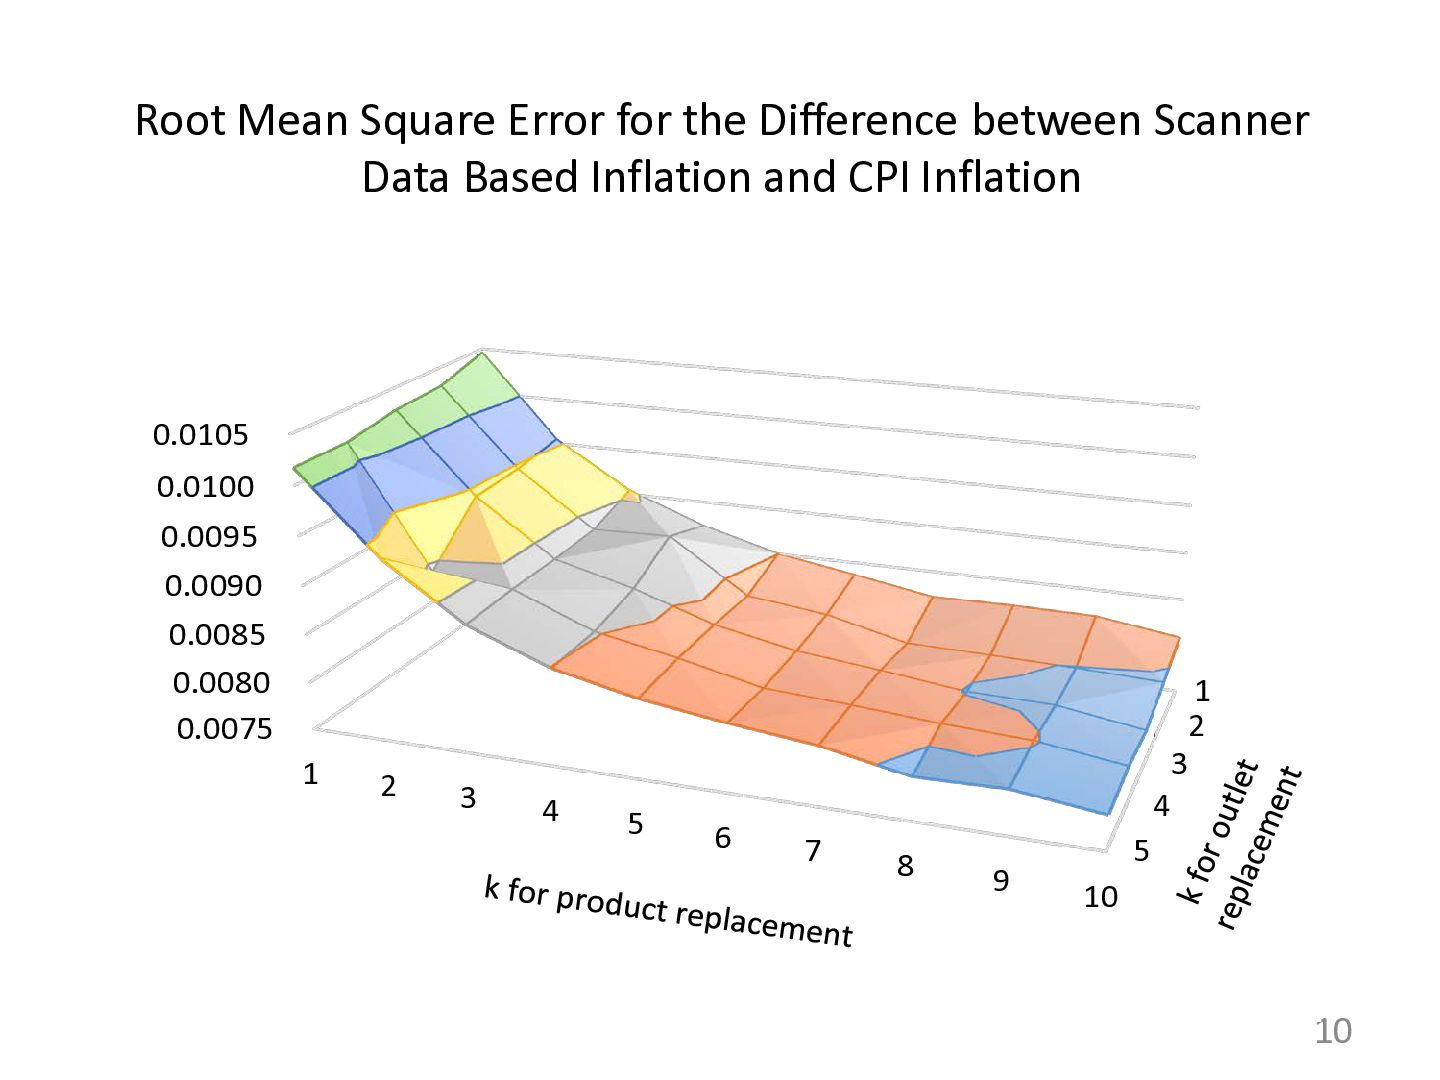
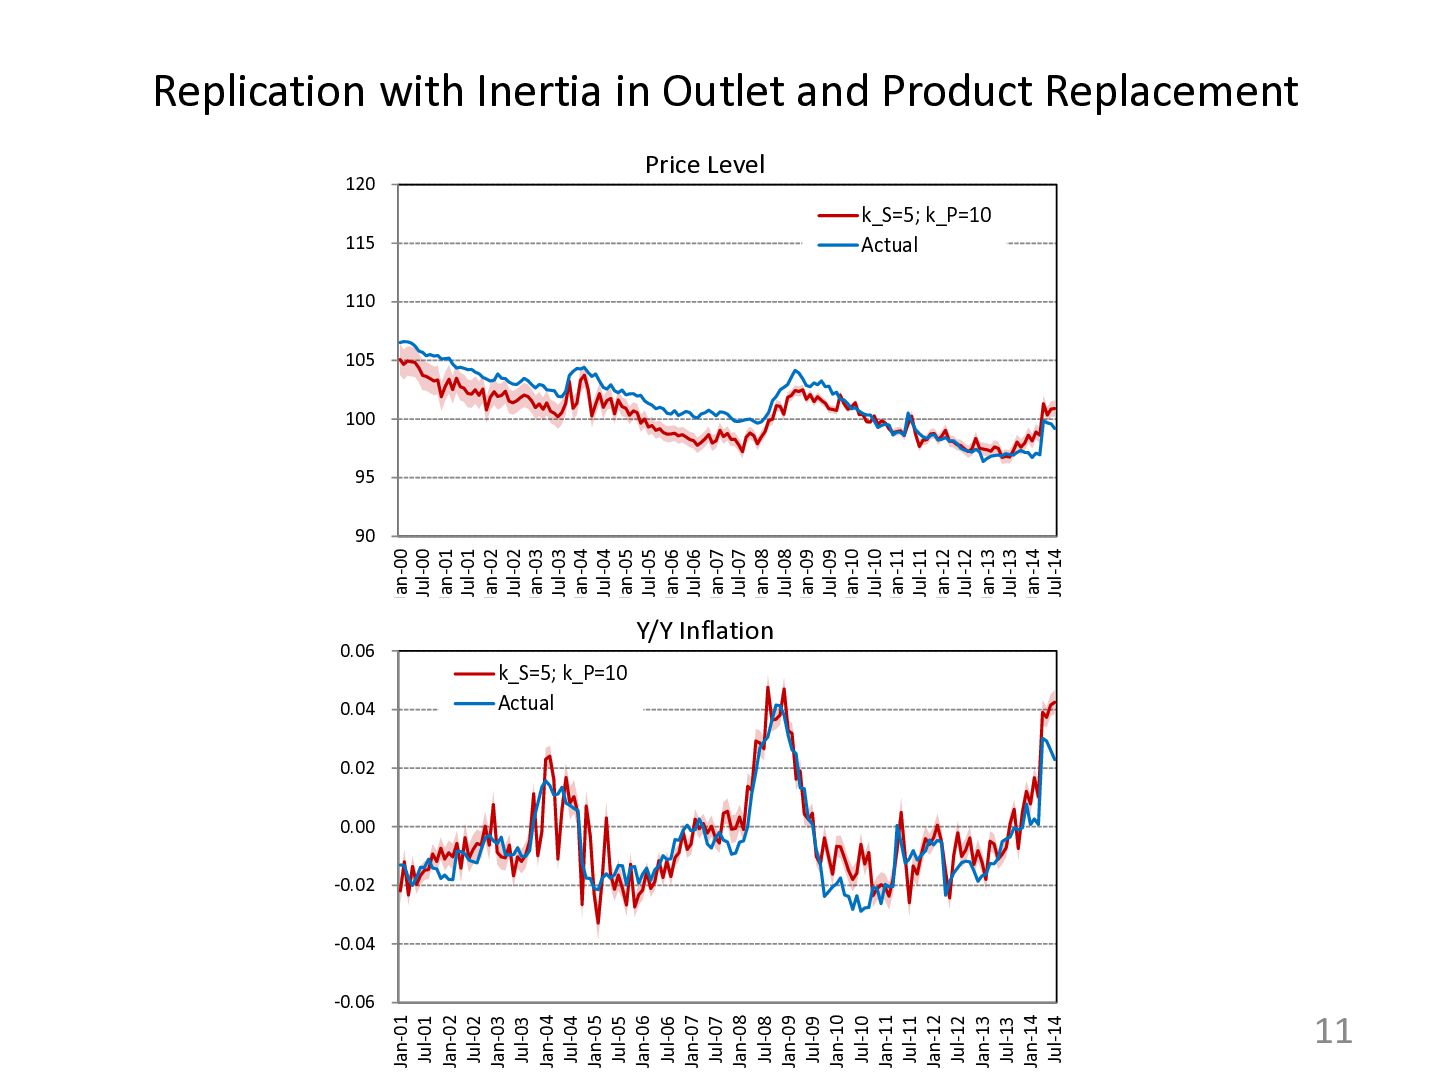
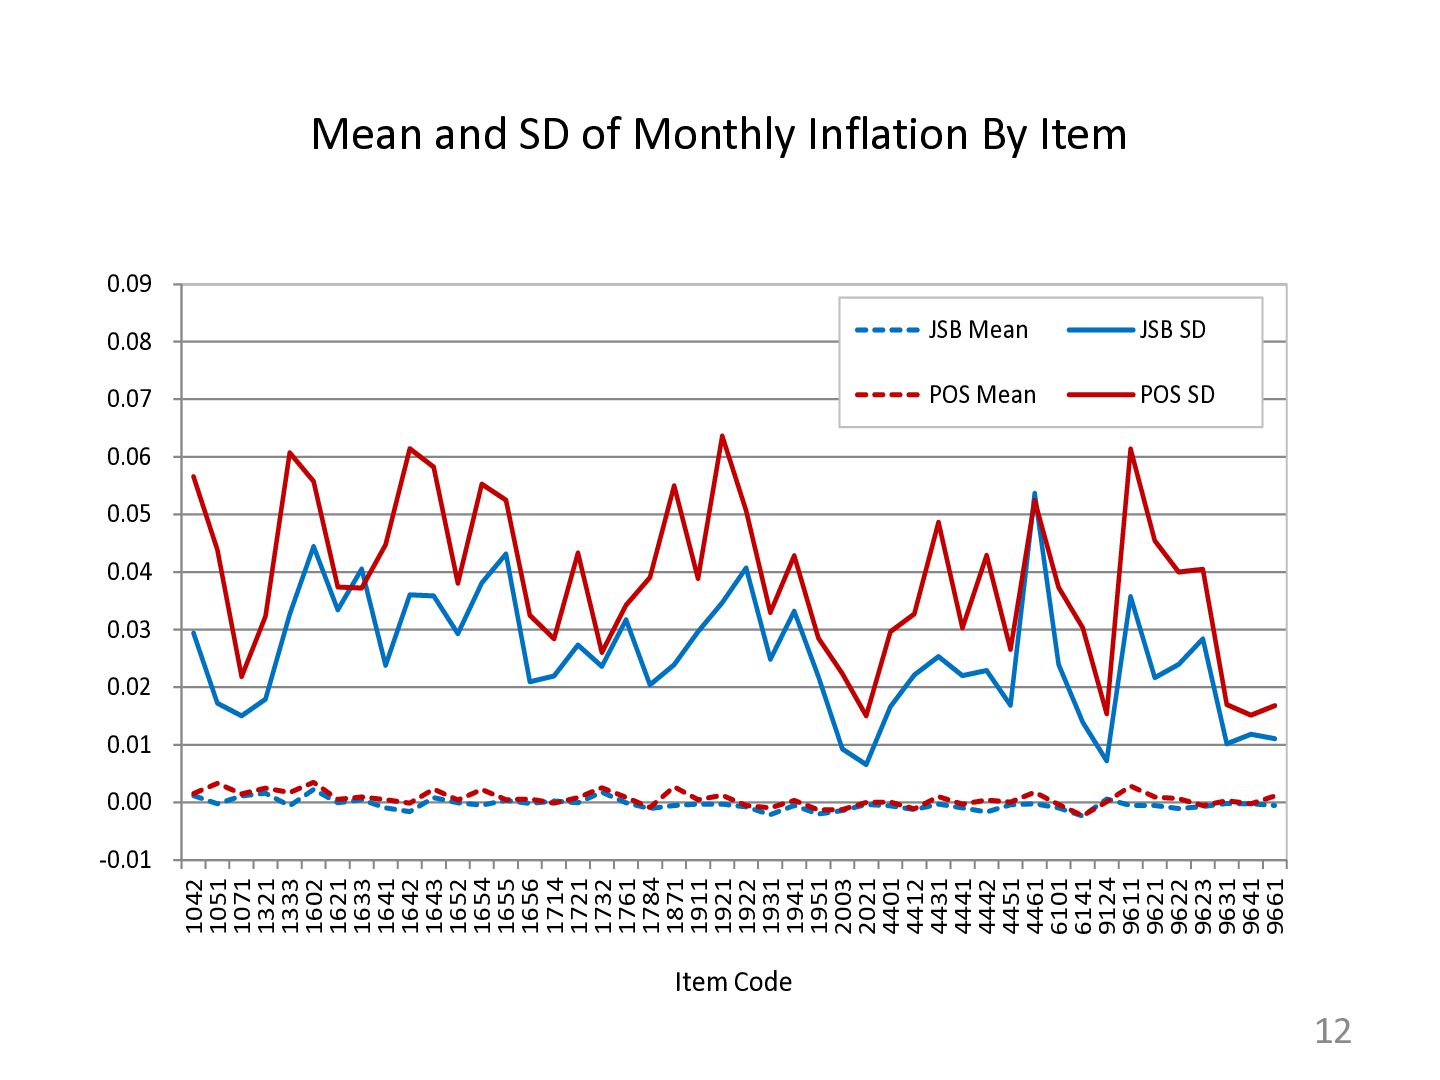
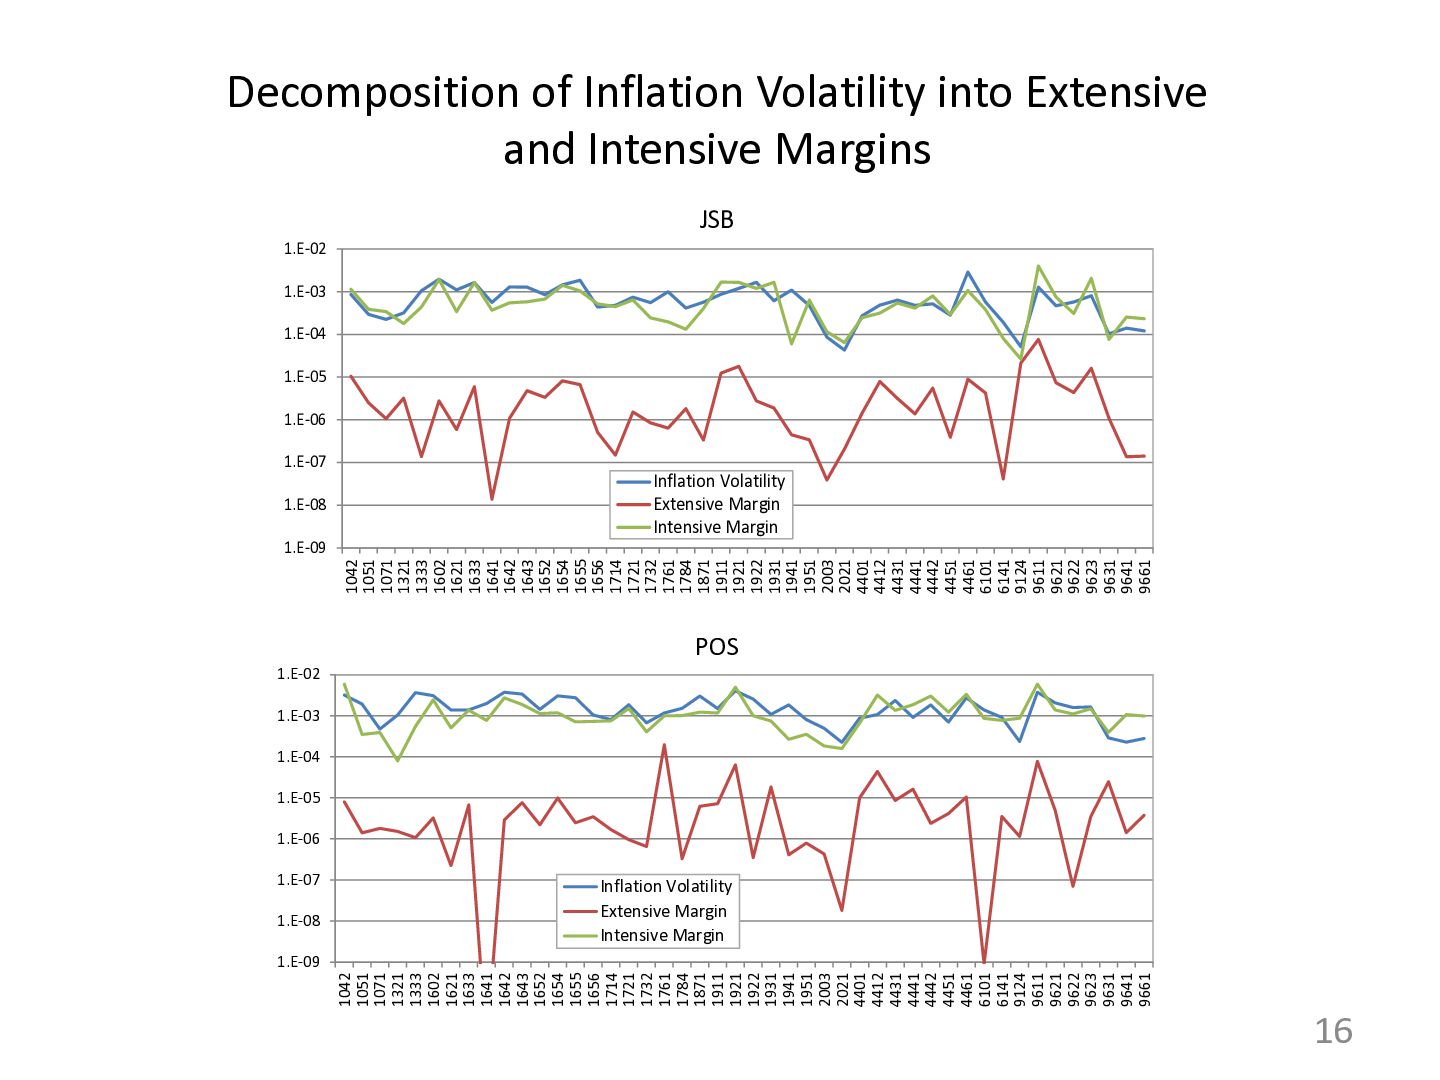
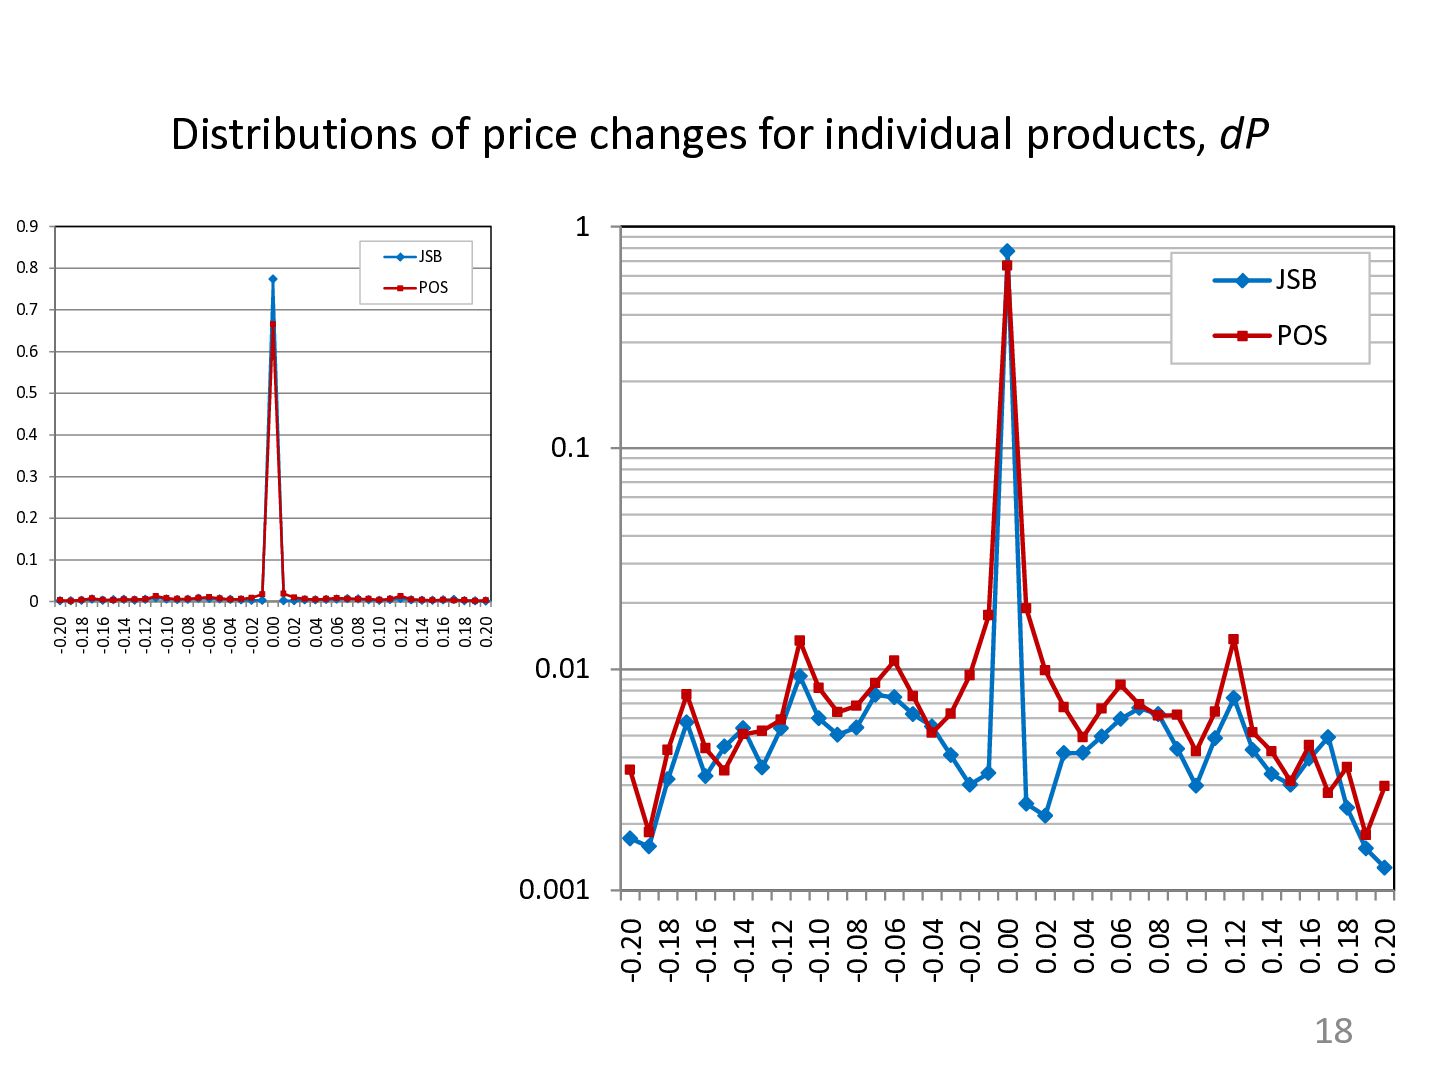
index depends crucially on how often product substitution occurs. The deviation of scanner data based price index from actual CPI is not negligible when we choose parameter values for product substitution such that substitutions occur very frequently, while it becomes smaller as we pick parameter values such that substitutions occur only infrequently. Scanner data based inflation differs significantly from actual CPI inflation in terms of volatility. We decompose the difference in the variance of monthly inflation into various factors to find that the difference in inflation volatility mainly stems from the difference in the frequency of price adjustments for individual products. Actual CPI inflation is less volatile since individual prices in the CPI data are stickier. Small-sized price changes are less likely to occur in the CPI data than in the scanner data. Together with the fact that prices are stickier in the CPI data, this suggests that menu costs play a more important role in the CPI data. 20