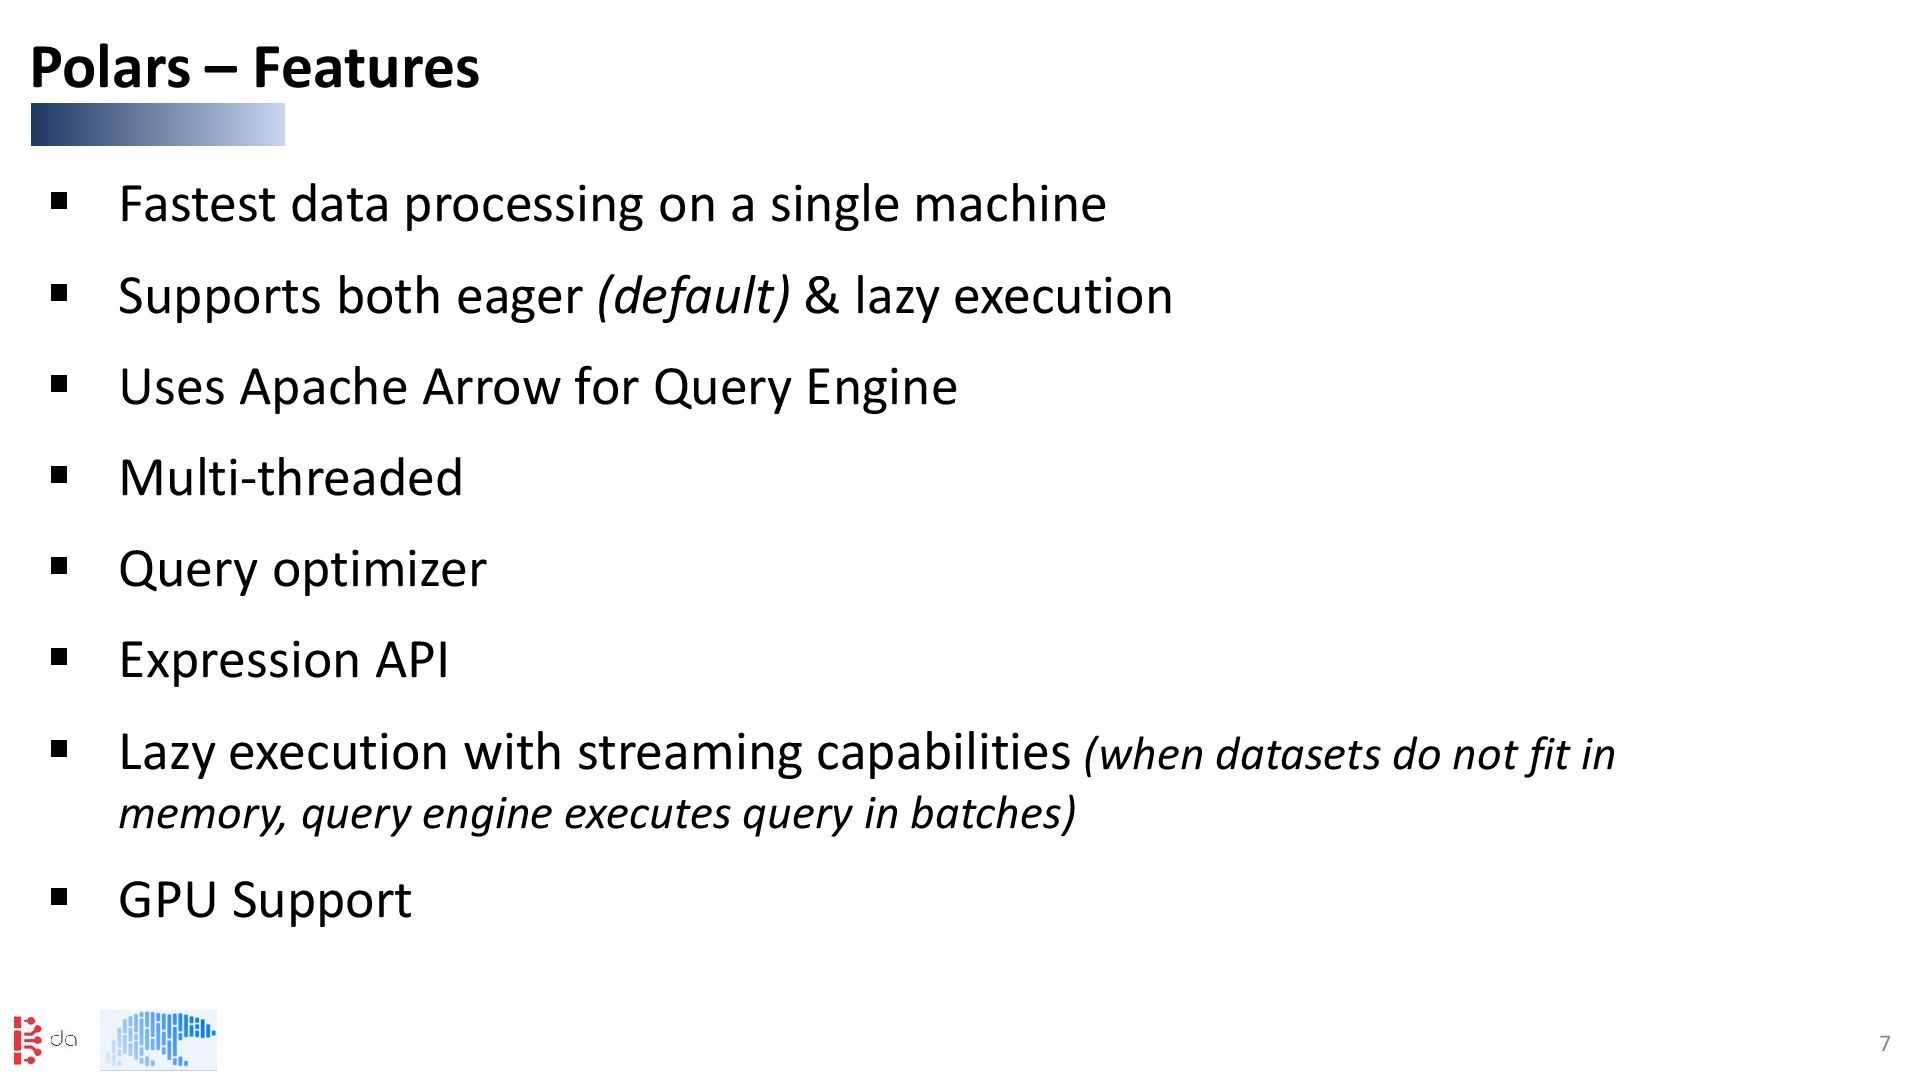
Supports both eager (default) & lazy execution ▪ Uses Apache Arrow for Query Engine ▪ Multi-threaded ▪ Query optimizer ▪ Expression API ▪ Lazy execution with streaming capabilities (when datasets do not fit in memory, query engine executes query in batches) ▪ GPU Support Polars – Features
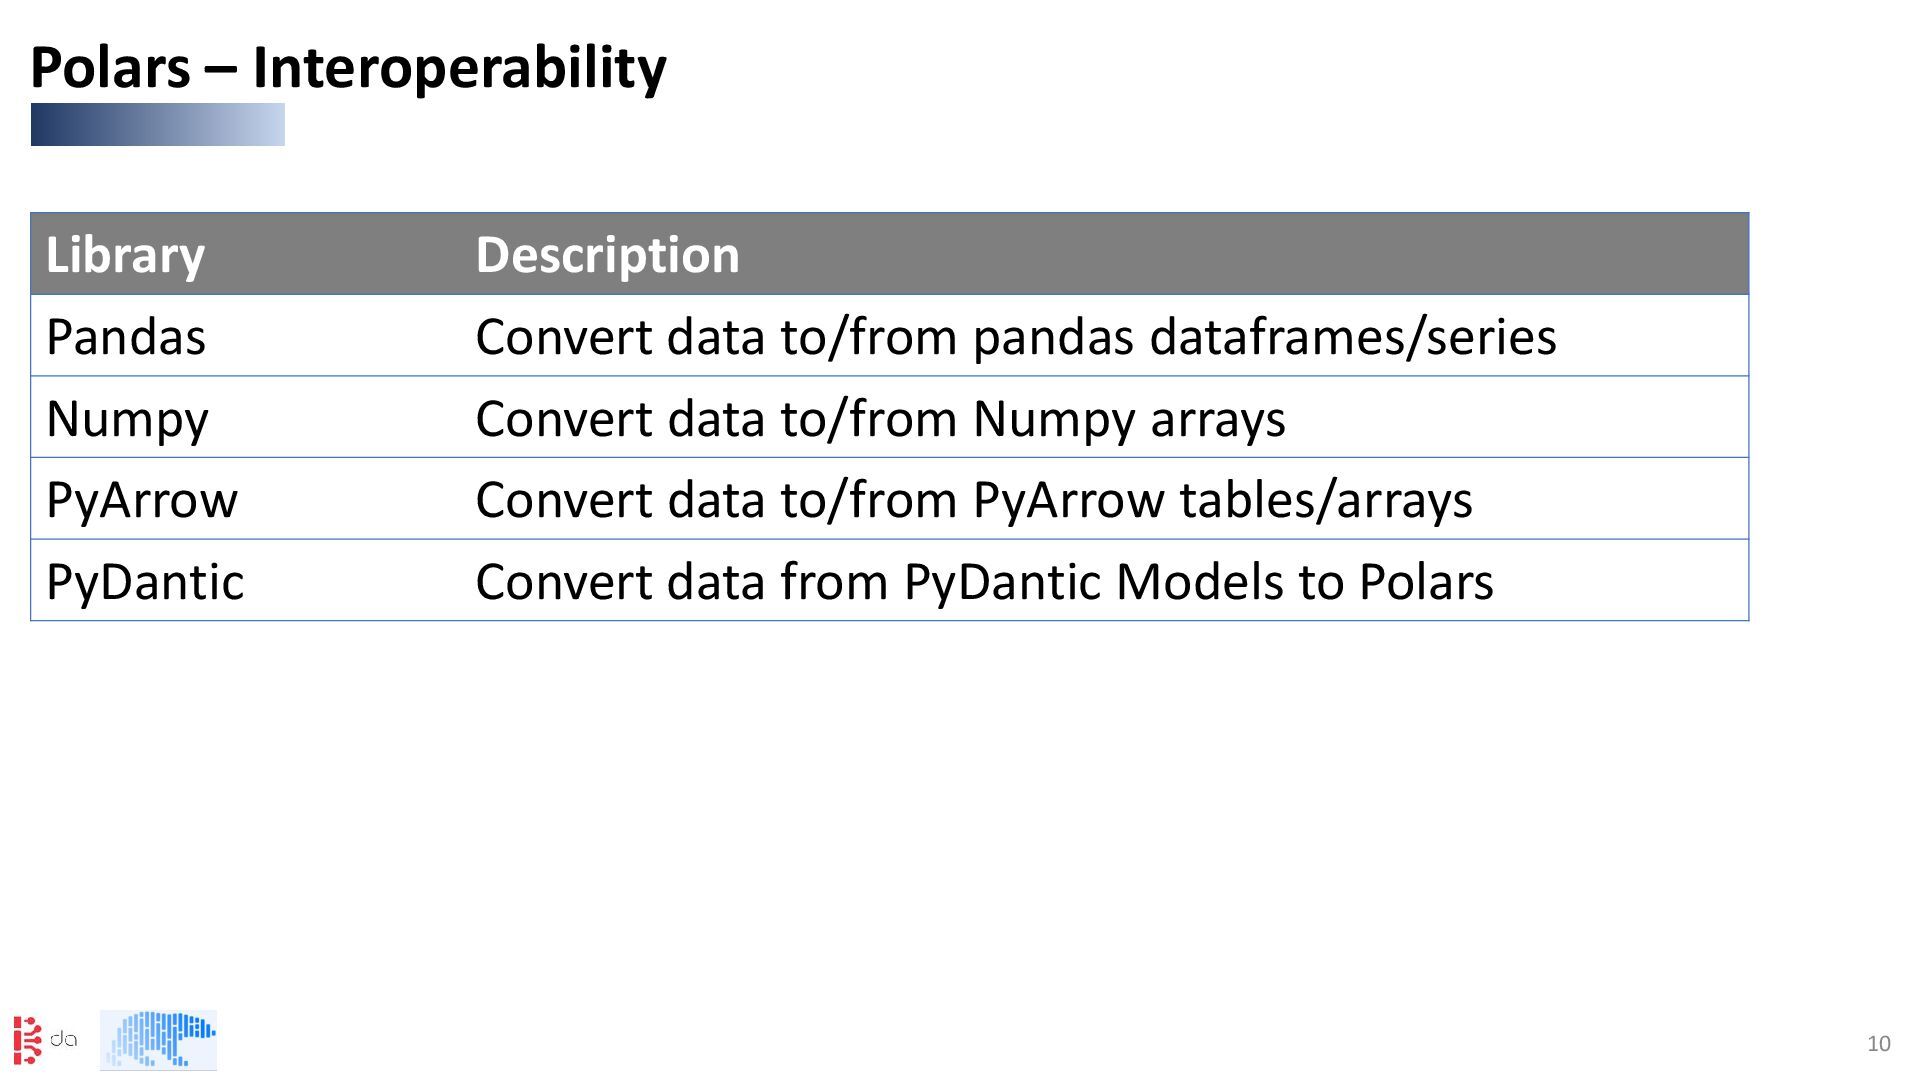
pandas dataframes/series Numpy Convert data to/from Numpy arrays PyArrow Convert data to/from PyArrow tables/arrays PyDantic Convert data from PyDantic Models to Polars
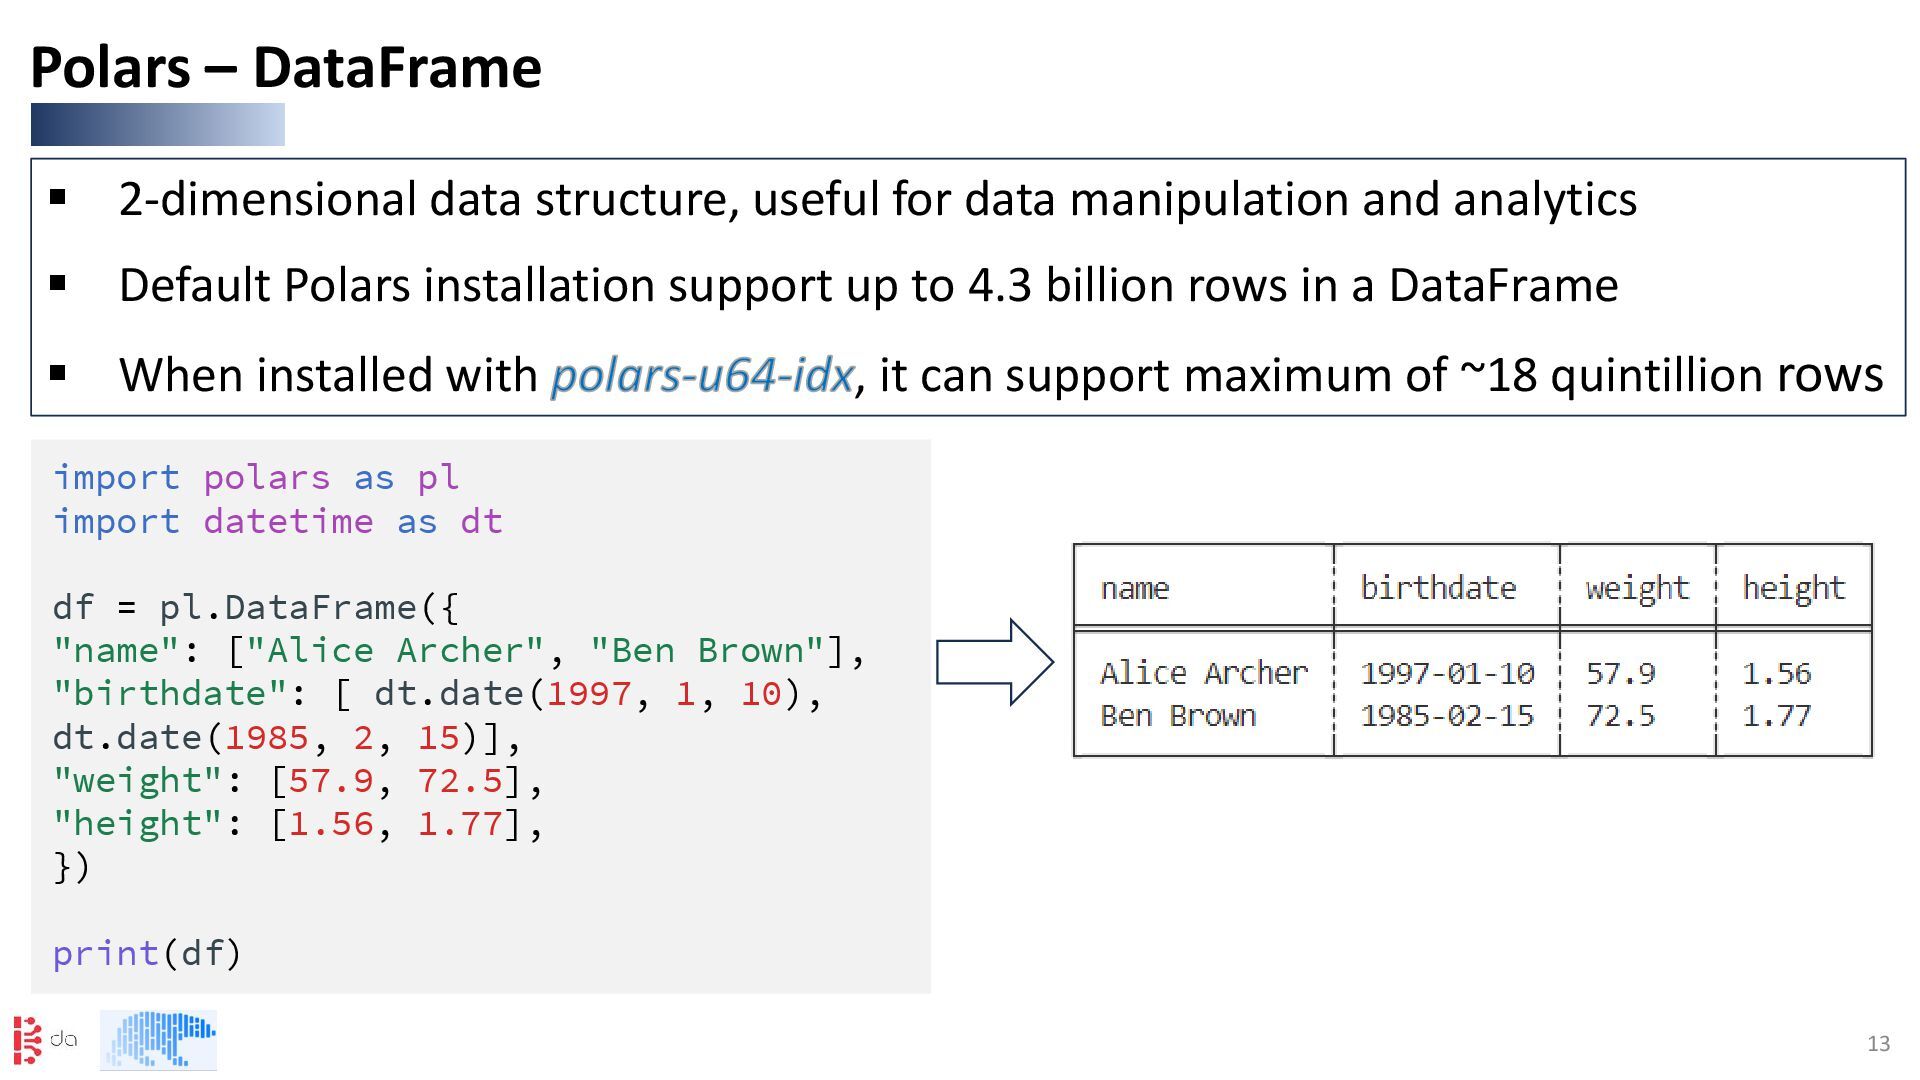
analytics ▪ Default Polars installation support up to 4.3 billion rows in a DataFrame ▪ When installed with polars-u64-idx, it can support maximum of ~18 quintillion rows Polars – DataFrame import polars as pl import datetime as dt df = pl.DataFrame({ "name": ["Alice Archer", "Ben Brown"], "birthdate": [ dt.date(1997, 1, 10), dt.date(1985, 2, 15)], "weight": [57.9, 72.5], "height": [1.56, 1.77], }) print(df)
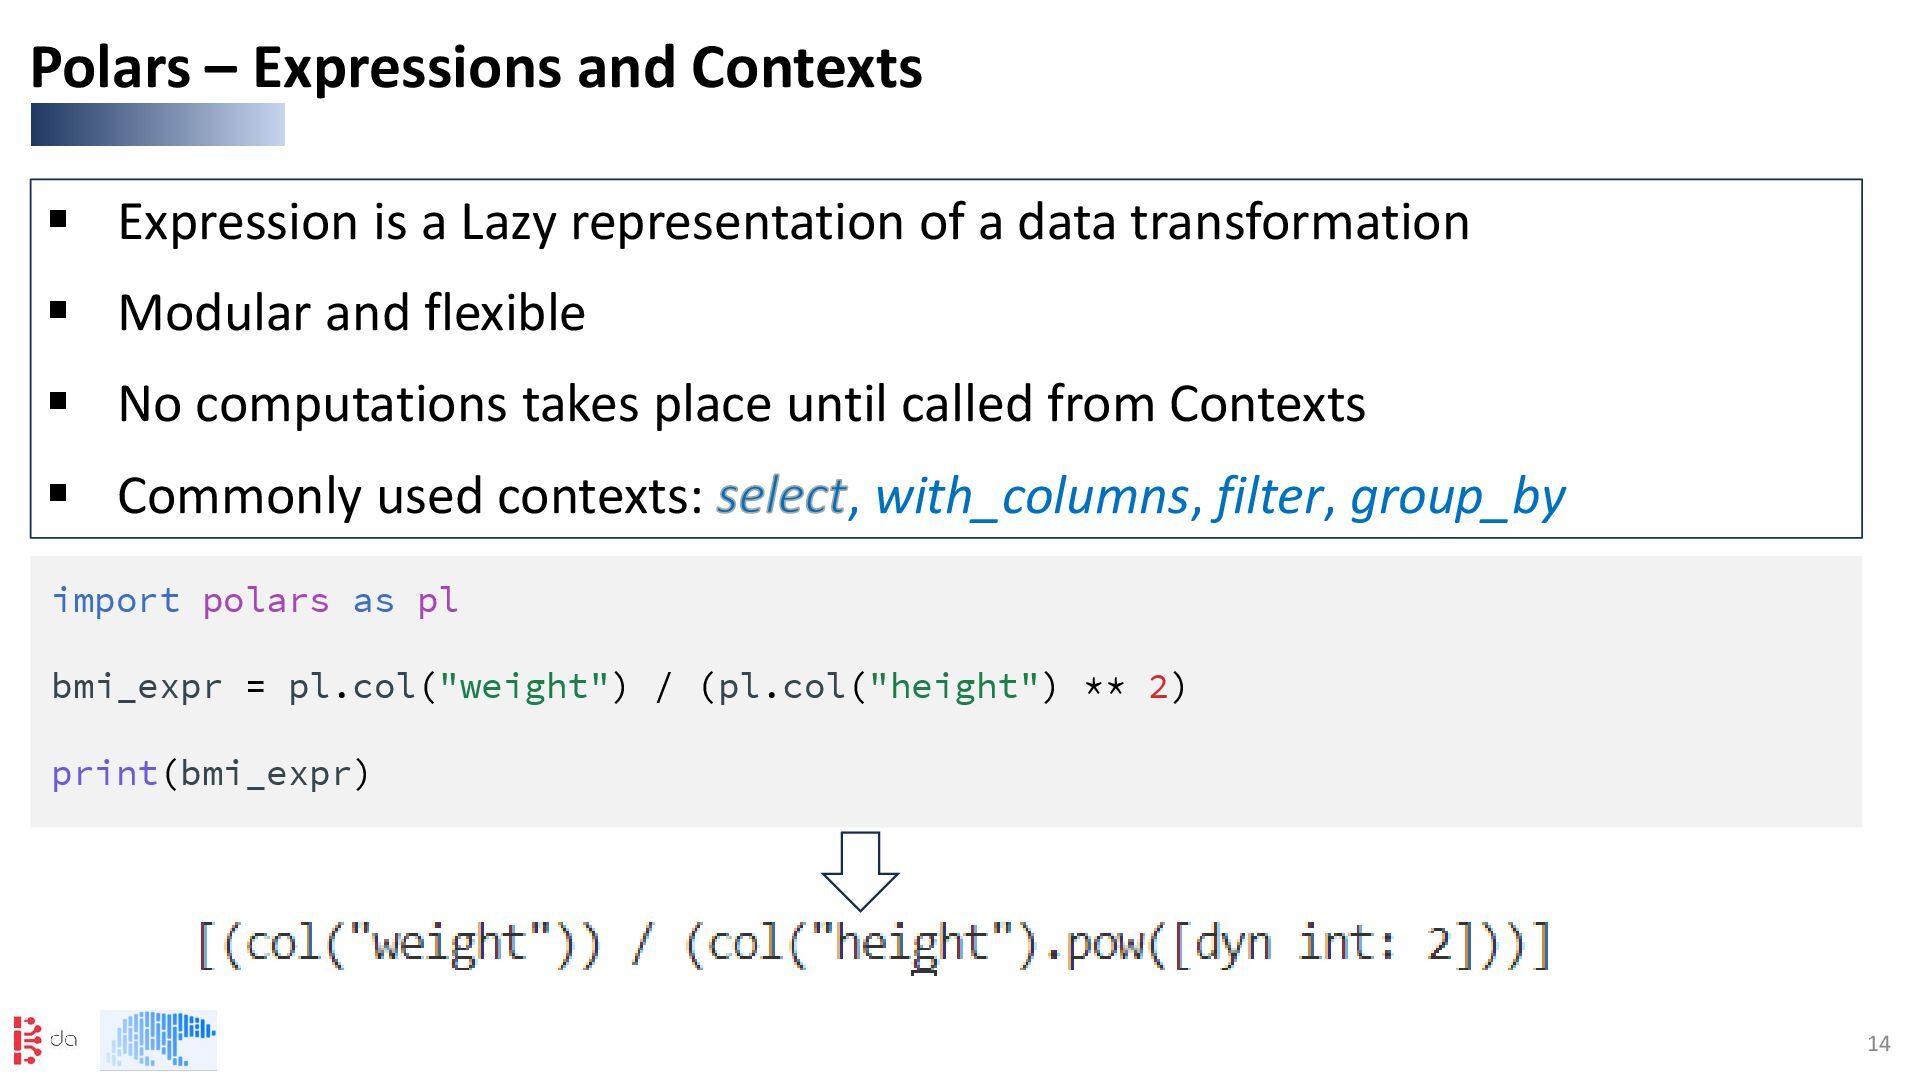
transformation ▪ Modular and flexible ▪ No computations takes place until called from Contexts ▪ Commonly used contexts: select, with_columns, filter, group_by Polars – Expressions and Contexts import polars as pl bmi_expr = pl.col("weight") / (pl.col("height") ** 2) print(bmi_expr)
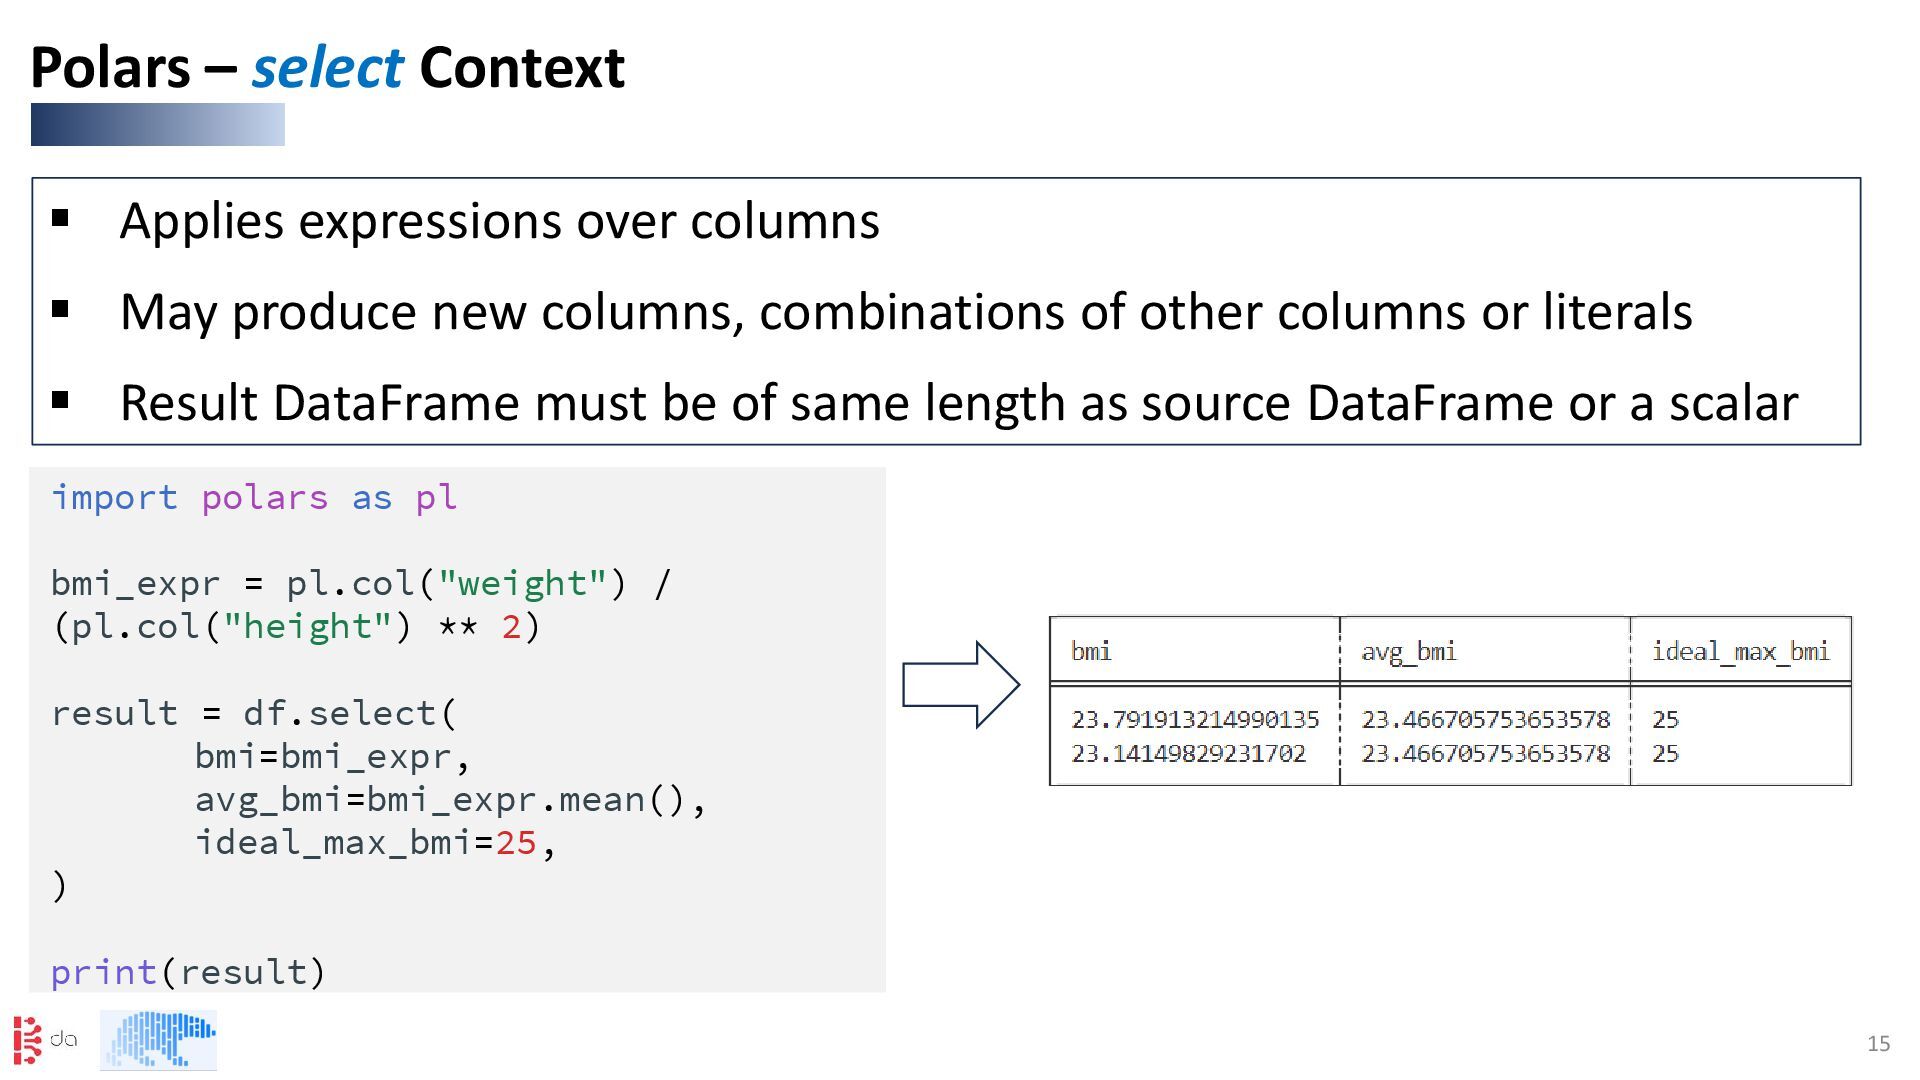
columns, combinations of other columns or literals ▪ Result DataFrame must be of same length as source DataFrame or a scalar Polars – select Context import polars as pl bmi_expr = pl.col("weight") / (pl.col("height") ** 2) result = df.select( bmi=bmi_expr, avg_bmi=bmi_expr.mean(), ideal_max_bmi=25, ) print(result)
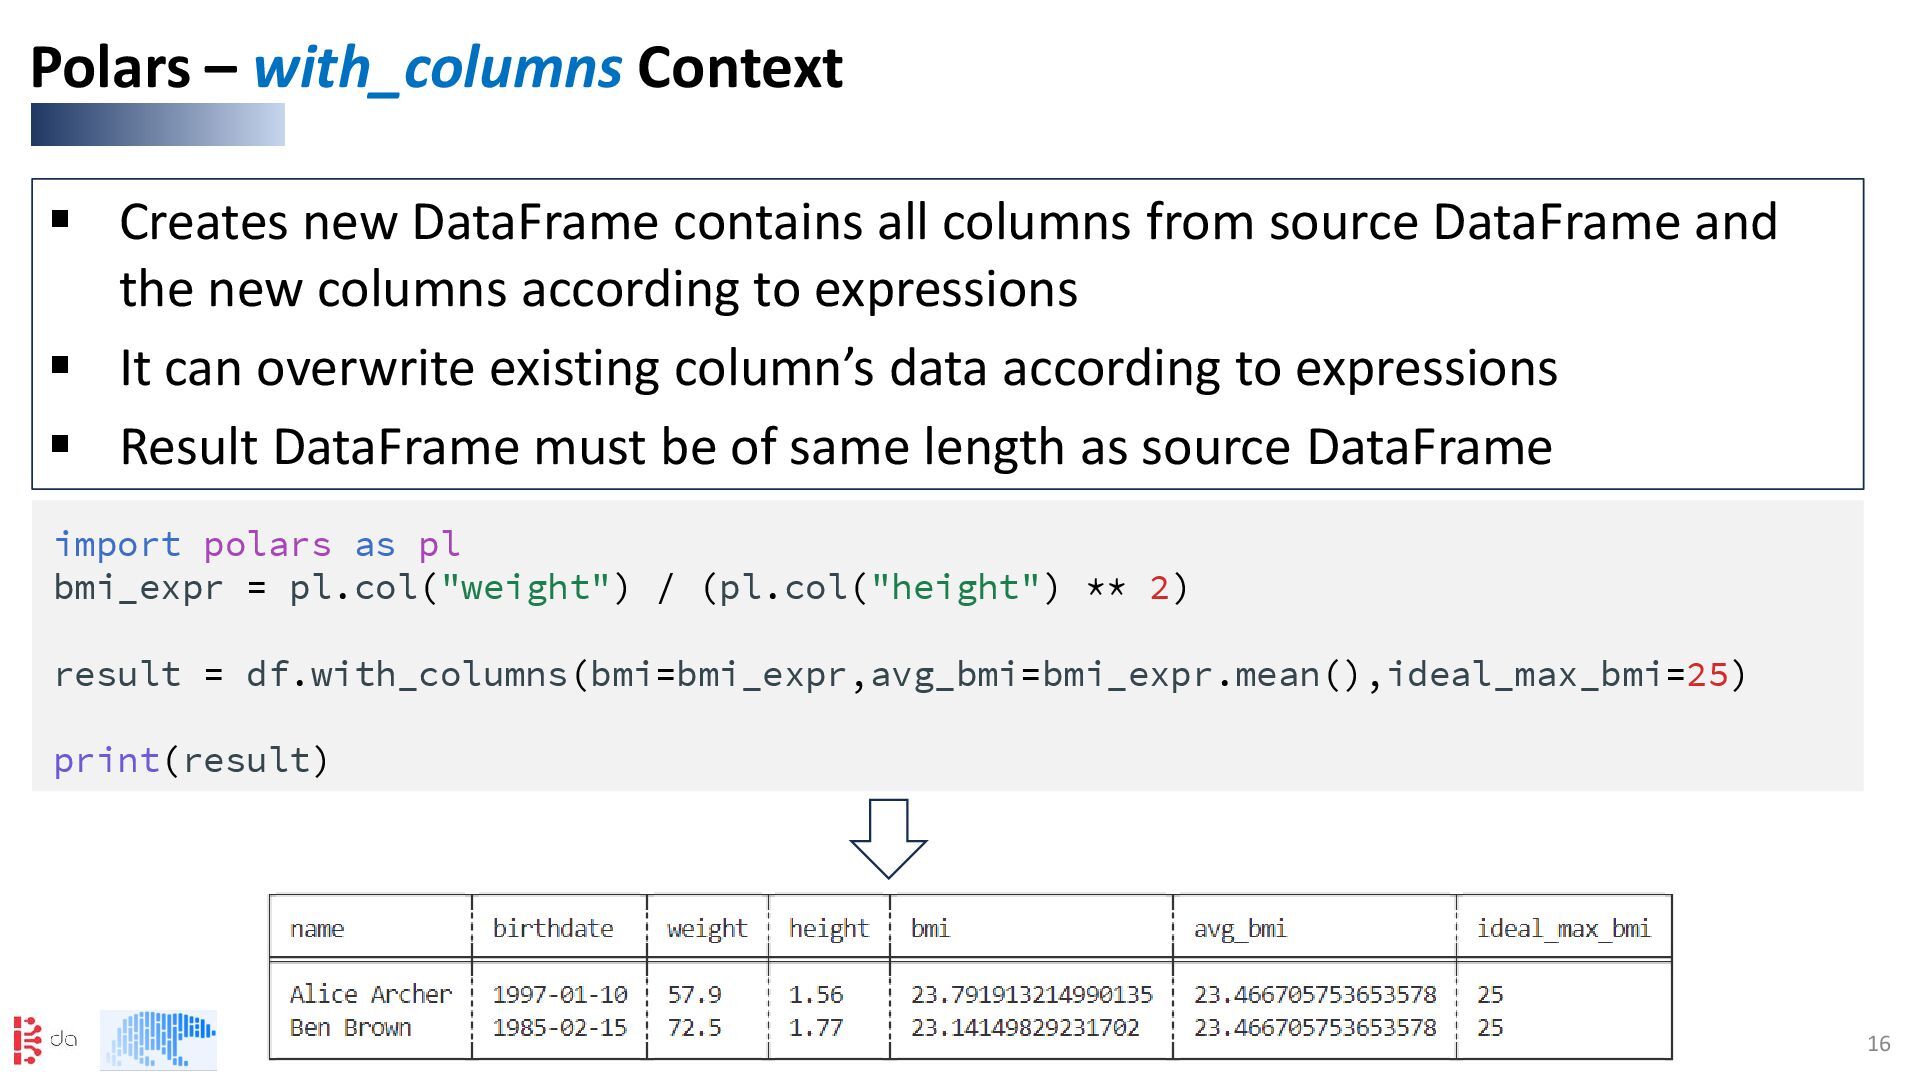
DataFrame and the new columns according to expressions ▪ It can overwrite existing column’s data according to expressions ▪ Result DataFrame must be of same length as source DataFrame Polars – with_columns Context import polars as pl bmi_expr = pl.col("weight") / (pl.col("height") ** 2) result = df.with_columns(bmi=bmi_expr,avg_bmi=bmi_expr.mean(),ideal_max_bmi=25) print(result)
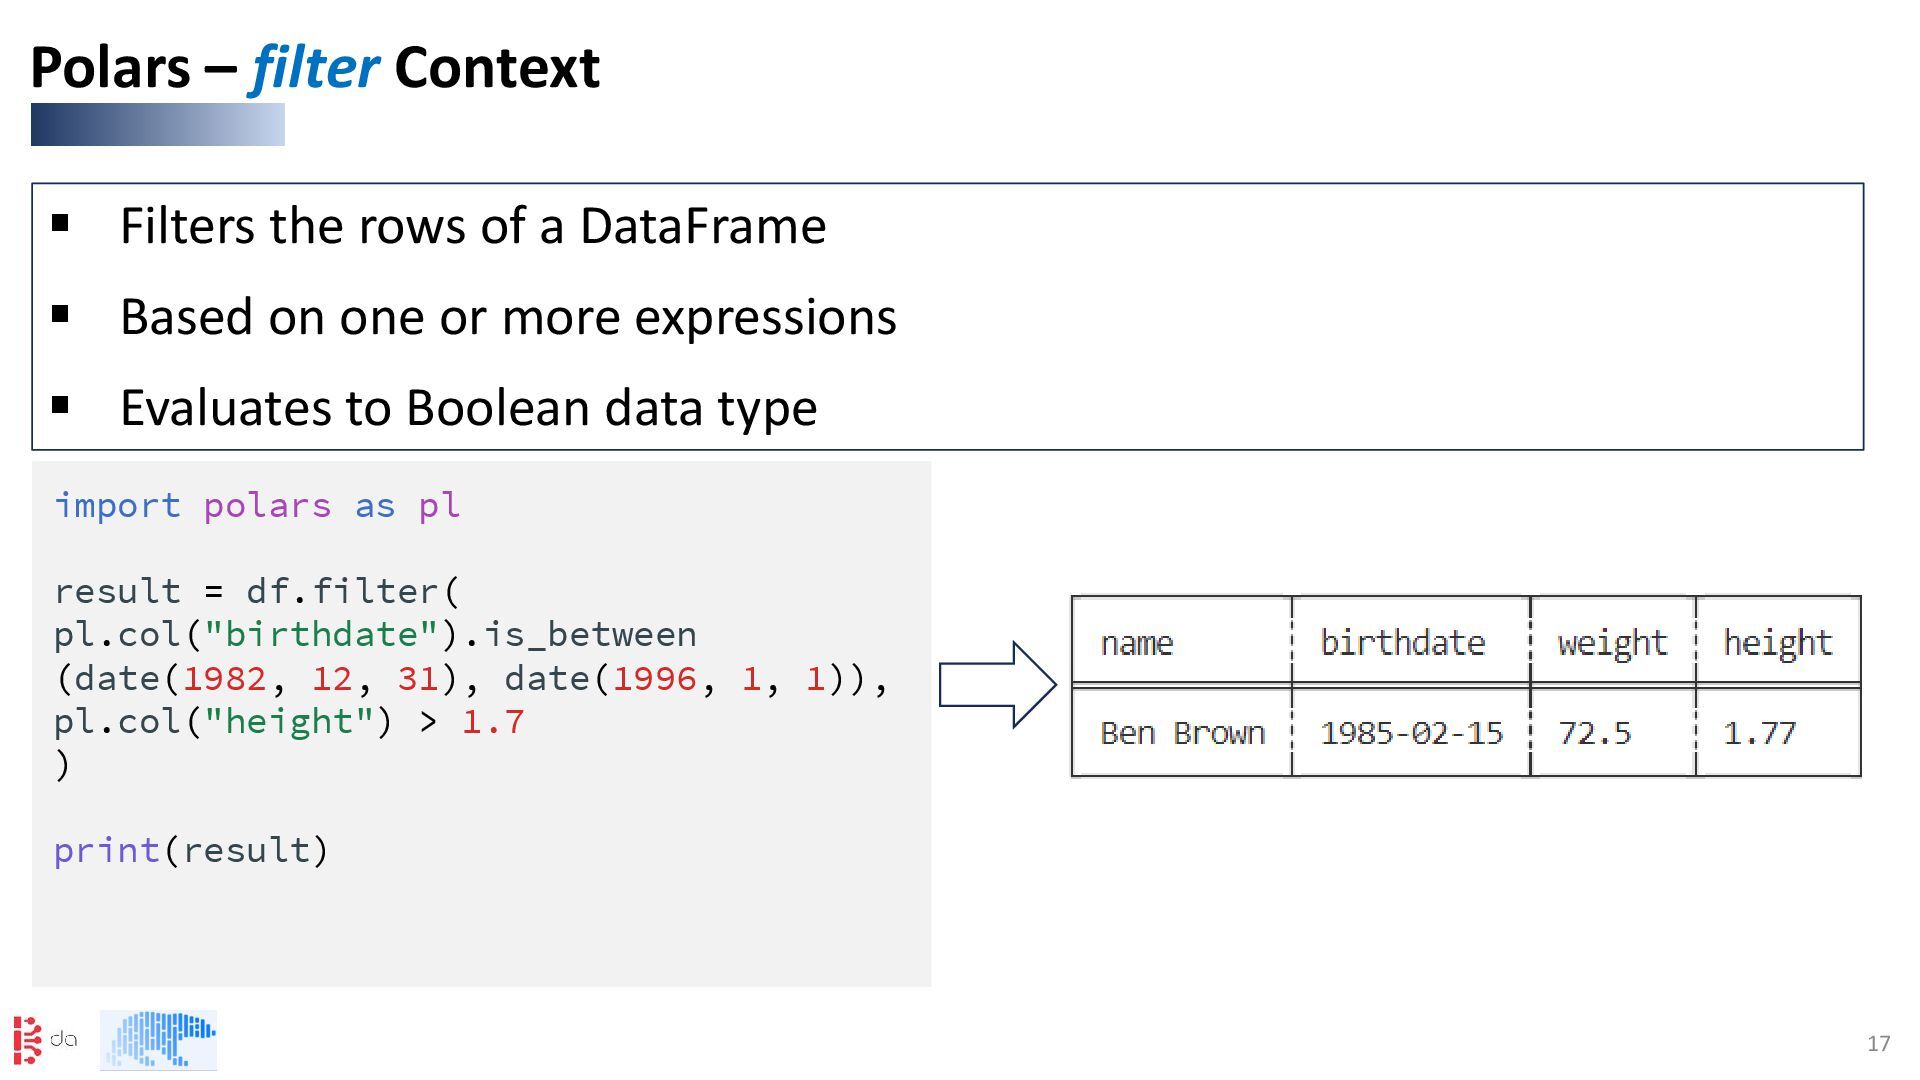
on one or more expressions ▪ Evaluates to Boolean data type Polars – filter Context import polars as pl result = df.filter( pl.col("birthdate").is_between (date(1982, 12, 31), date(1996, 1, 1)), pl.col("height") > 1.7 ) print(result)
the grouping expressions ▪ Use agg() to apply aggregating expressions to the groups Polars – group_by Context import polars as pl result = df.group_by( (pl.col("birthdate").dt.year() // 10 * 10) .alias("decade"), (pl.col("height") < 1.7).alias("short?"), ).agg(pl.col("name")) print(result)
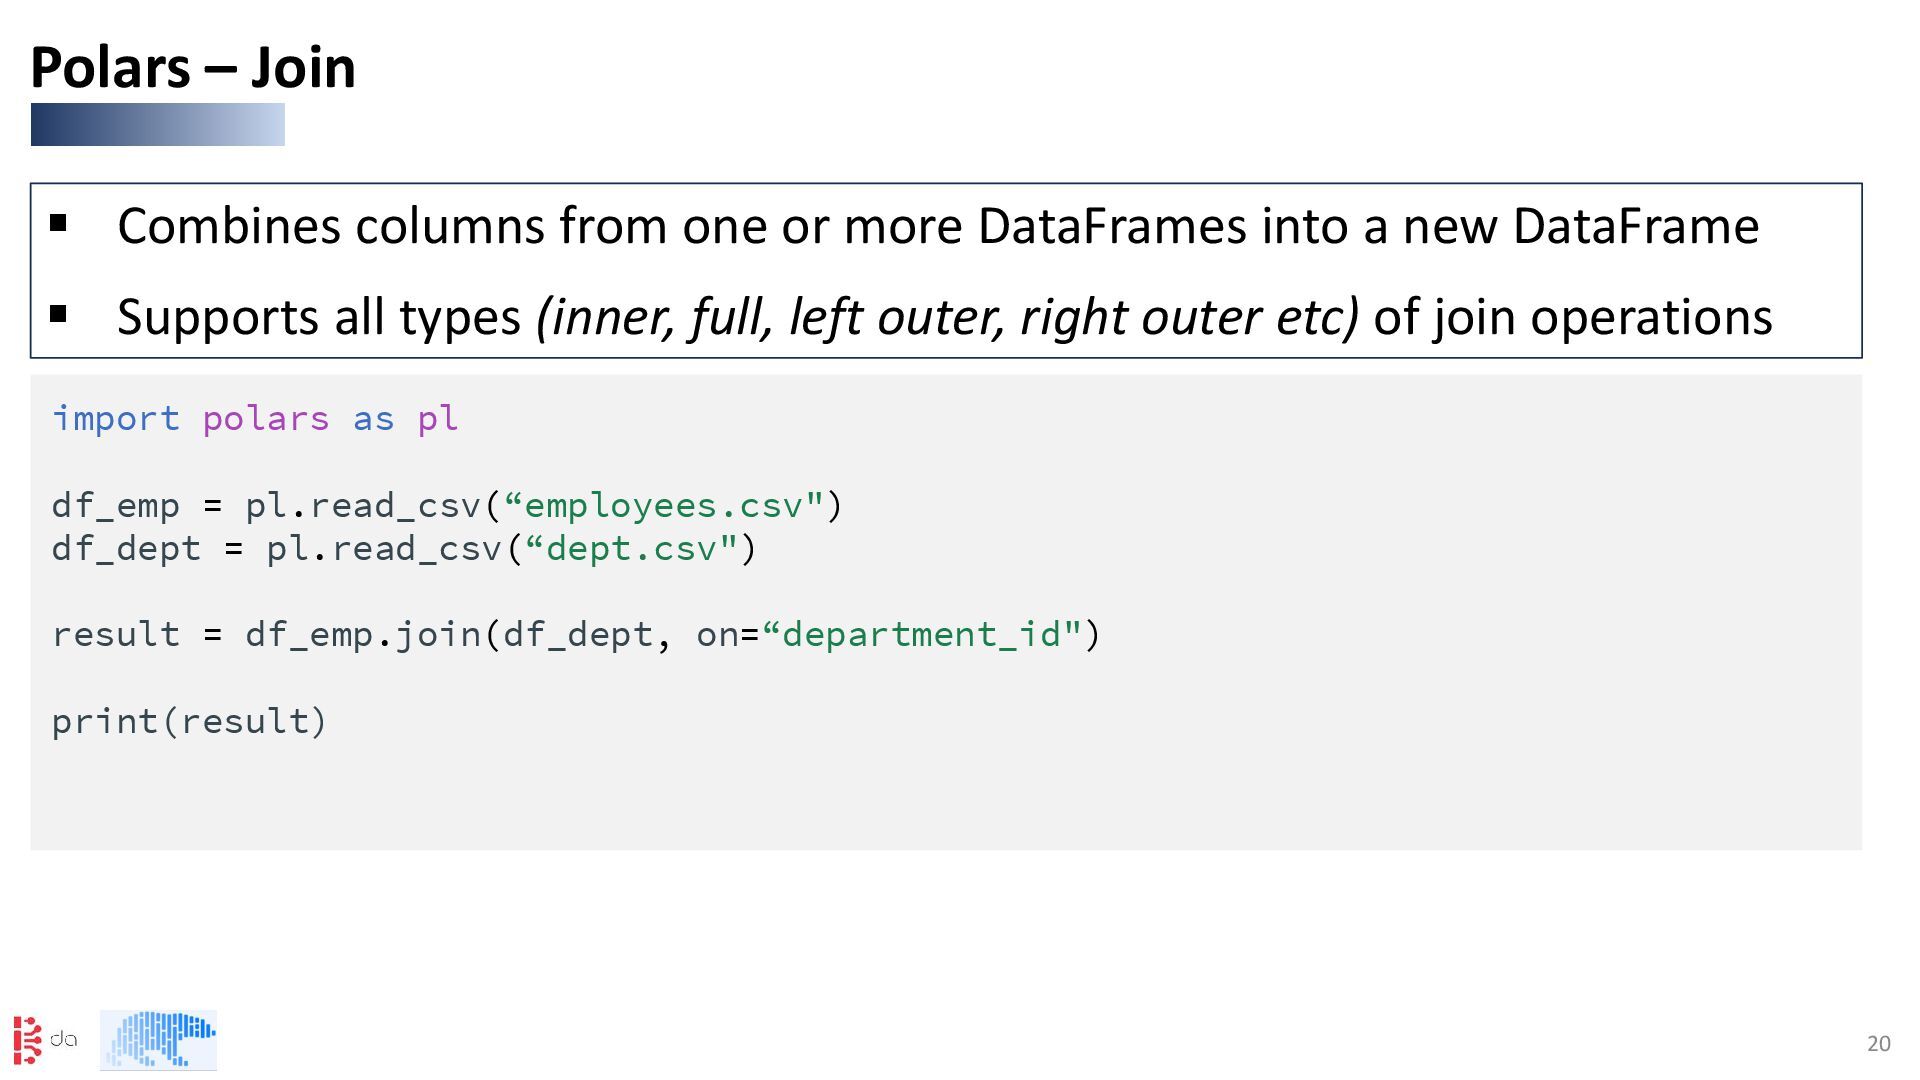
a new DataFrame ▪ Supports all types (inner, full, left outer, right outer etc) of join operations Polars – Join import polars as pl df_emp = pl.read_csv(“employees.csv") df_dept = pl.read_csv(“dept.csv") result = df_emp.join(df_dept, on=“department_id") print(result)
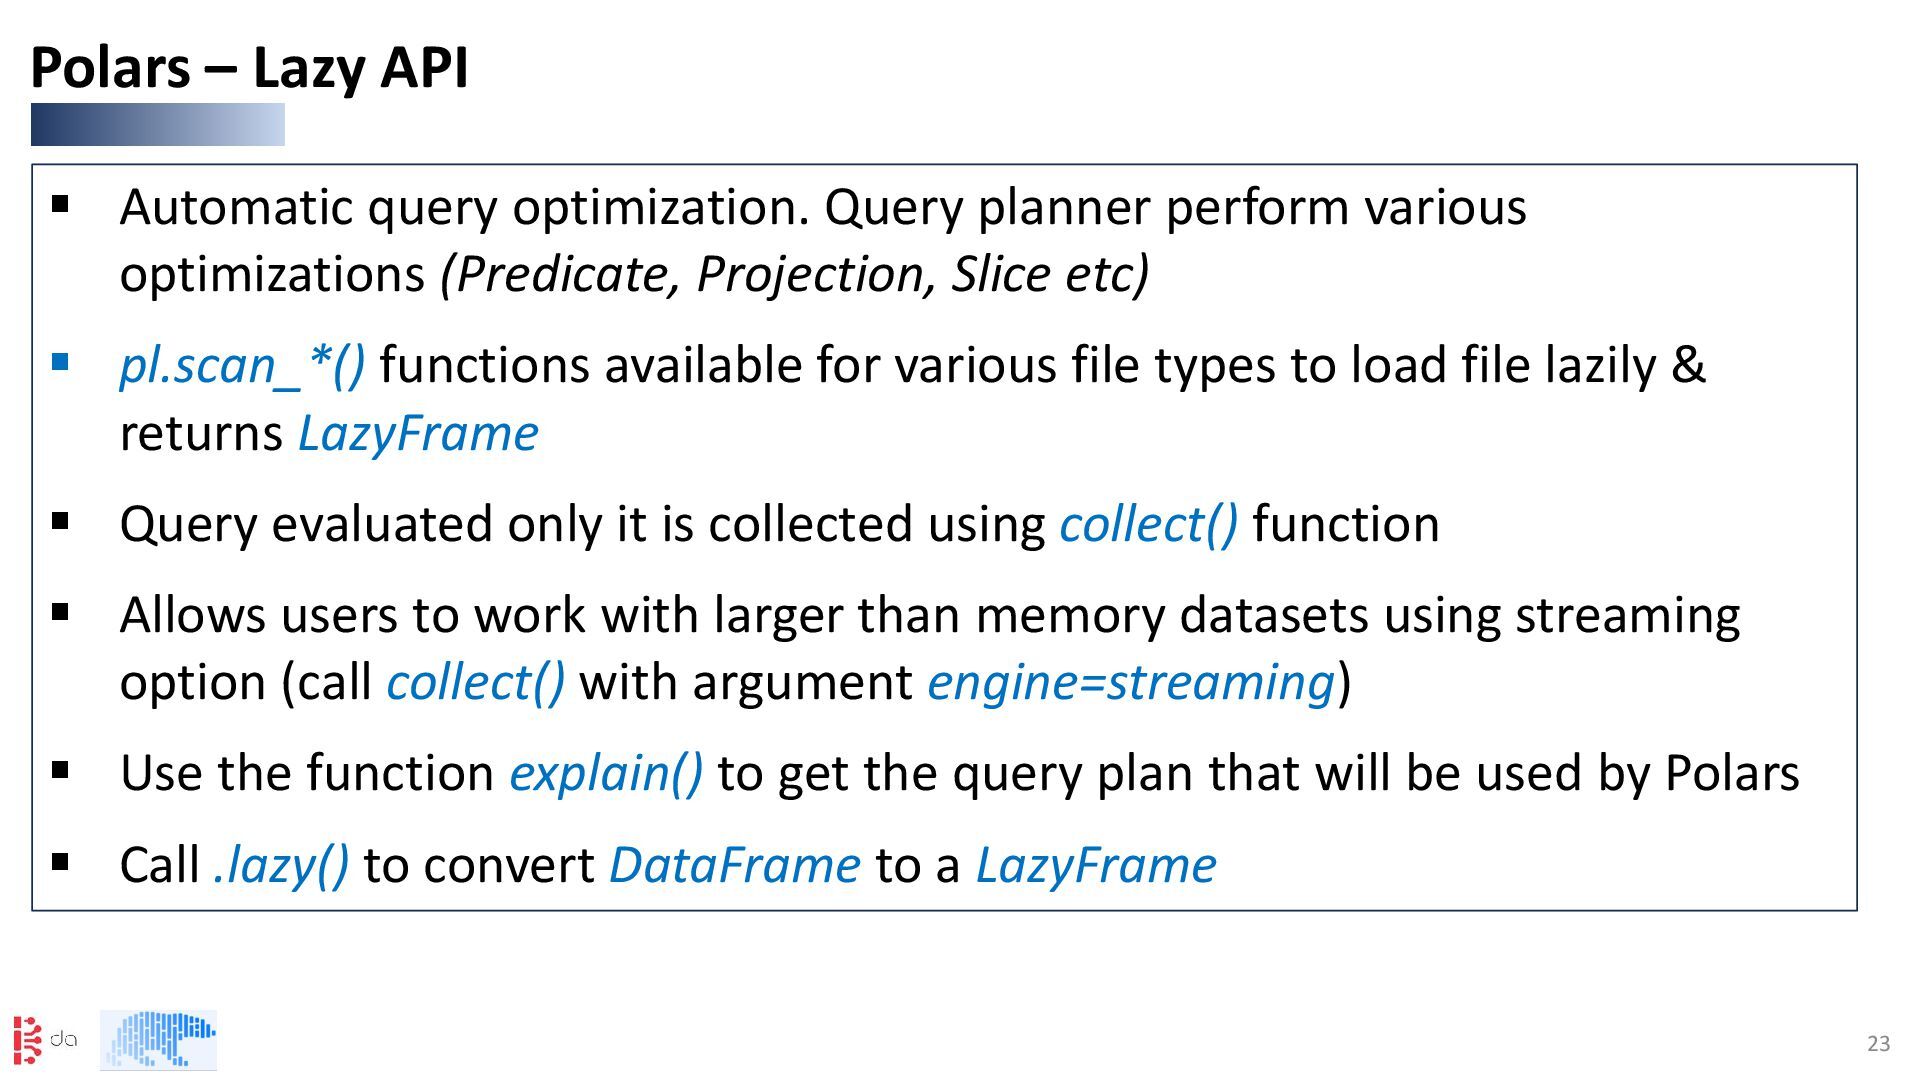
(Predicate, Projection, Slice etc) ▪ pl.scan_*() functions available for various file types to load file lazily & returns LazyFrame ▪ Query evaluated only it is collected using collect() function ▪ Allows users to work with larger than memory datasets using streaming option (call collect() with argument engine=streaming) ▪ Use the function explain() to get the query plan that will be used by Polars ▪ Call .lazy() to convert DataFrame to a LazyFrame Polars – Lazy API
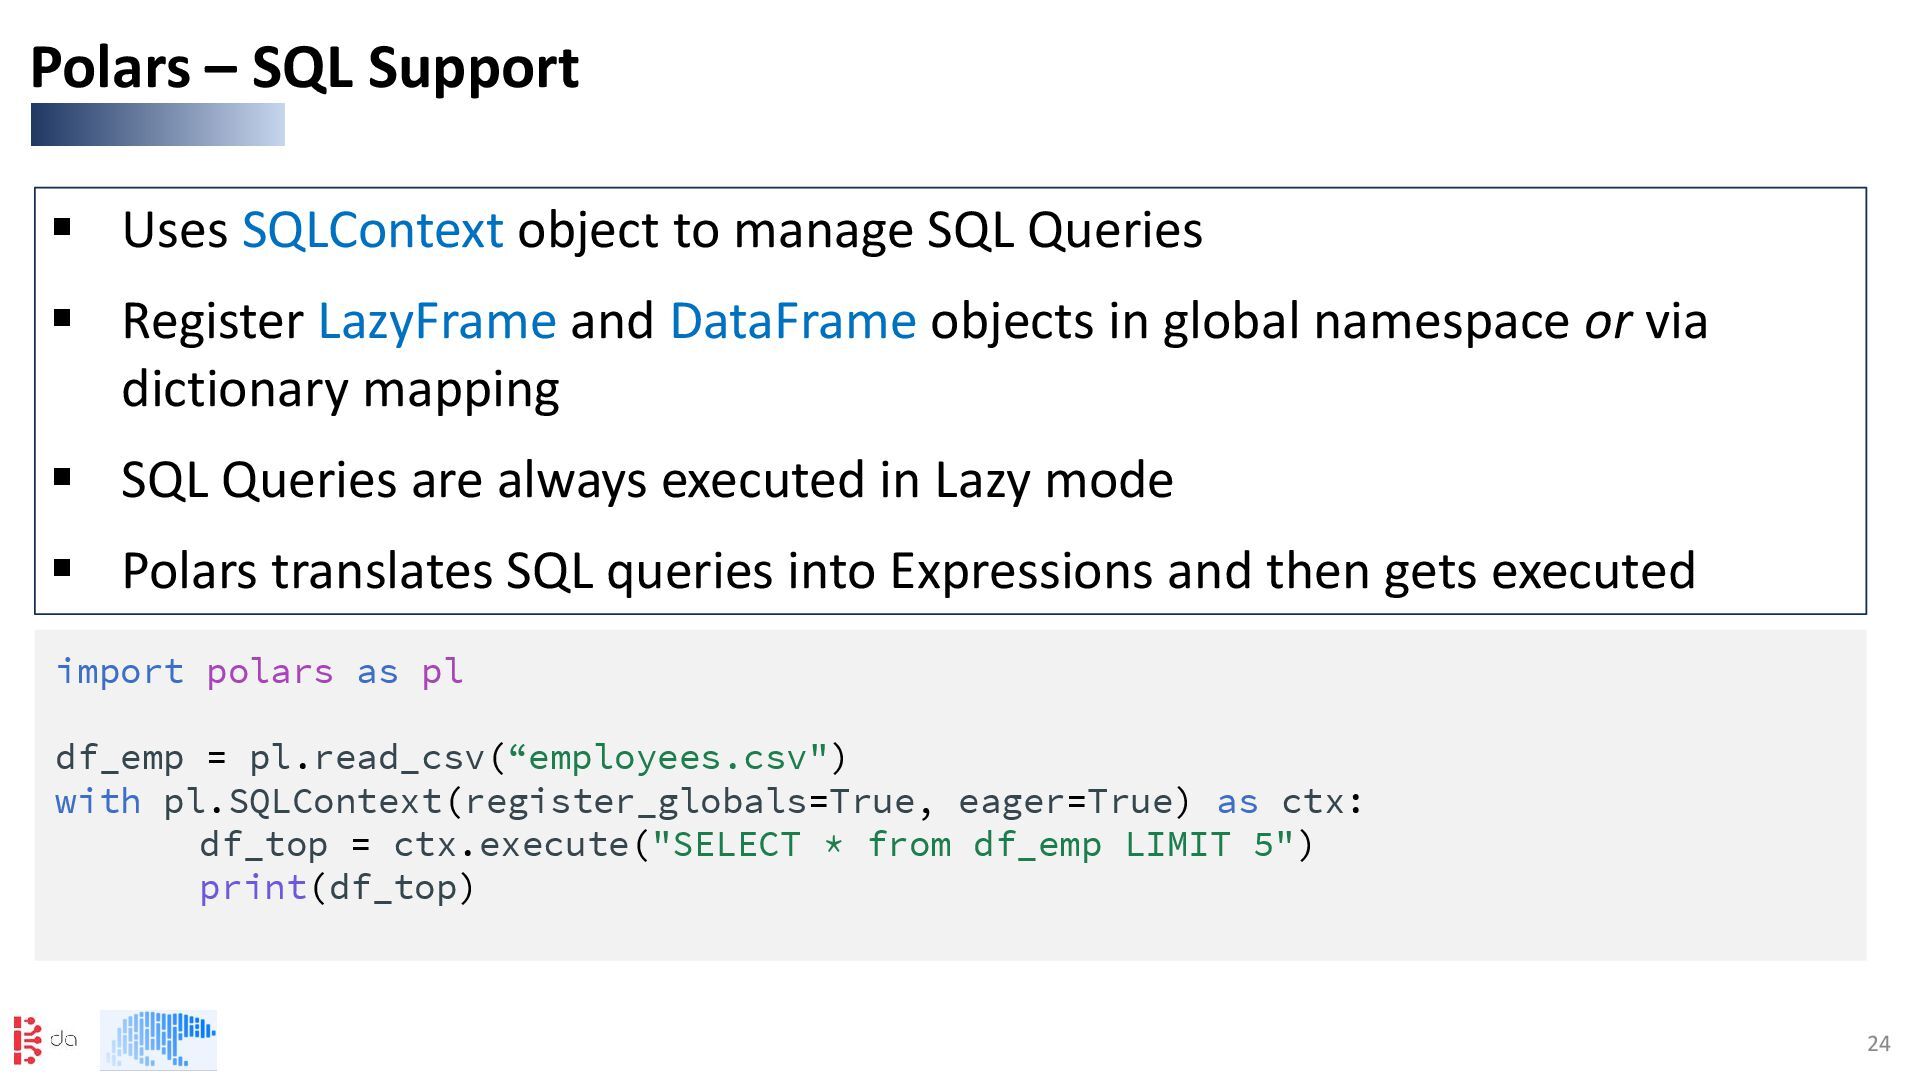
Register LazyFrame and DataFrame objects in global namespace or via dictionary mapping ▪ SQL Queries are always executed in Lazy mode ▪ Polars translates SQL queries into Expressions and then gets executed Polars – SQL Support import polars as pl df_emp = pl.read_csv(“employees.csv") with pl.SQLContext(register_globals=True, eager=True) as ctx: df_top = ctx.execute("SELECT * from df_emp LIMIT 5") print(df_top)
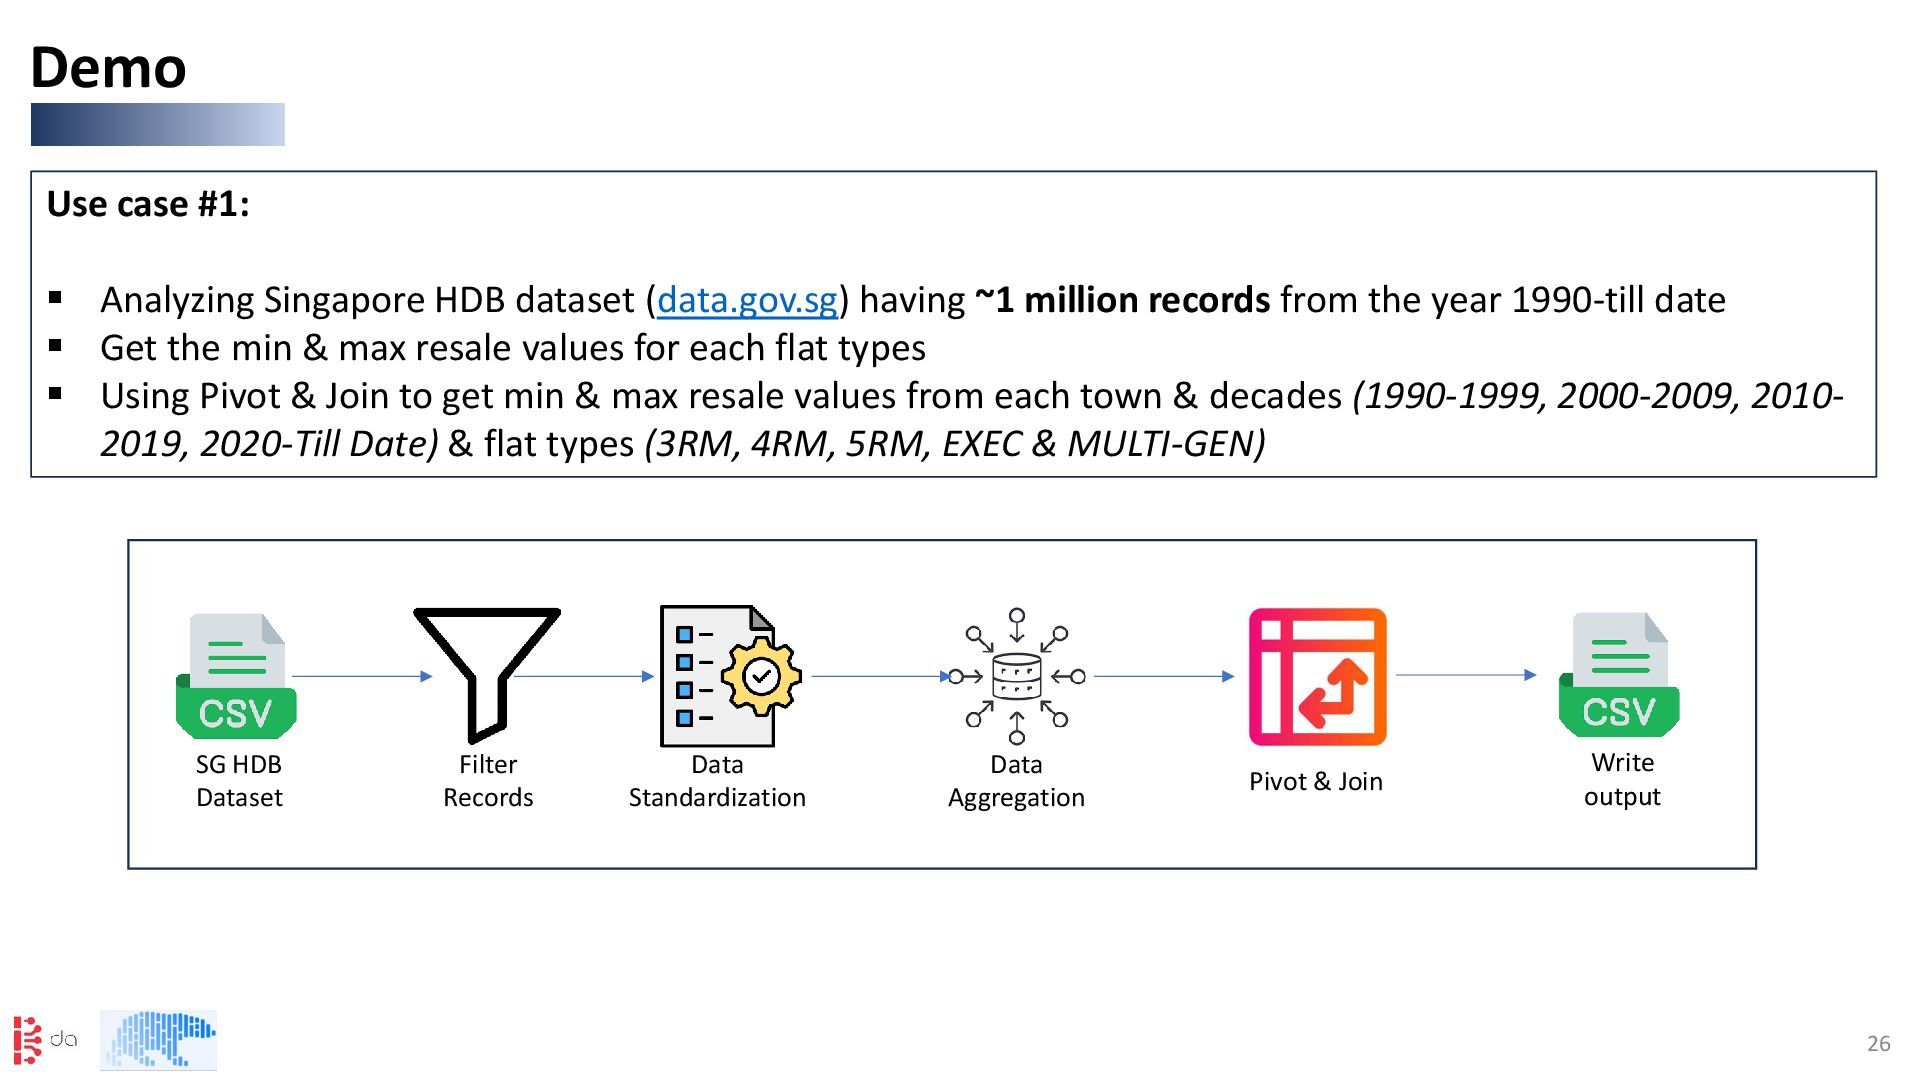
(data.gov.sg) having ~1 million records from the year 1990-till date ▪ Get the min & max resale values for each flat types ▪ Using Pivot & Join to get min & max resale values from each town & decades (1990-1999, 2000-2009, 2010- 2019, 2020-Till Date) & flat types (3RM, 4RM, 5RM, EXEC & MULTI-GEN) SG HDB Dataset Filter Records Data Standardization Data Aggregation Pivot & Join Write output