Upgrade to Pro — share decks privately, control downloads, hide ads and more …

DevOps Fom a Different Data Set (short version)

Sponsored · SiteGround - Reliable hosting with speed, security, and support you can count on.

DevOps Fom a Different Data Set (short version)

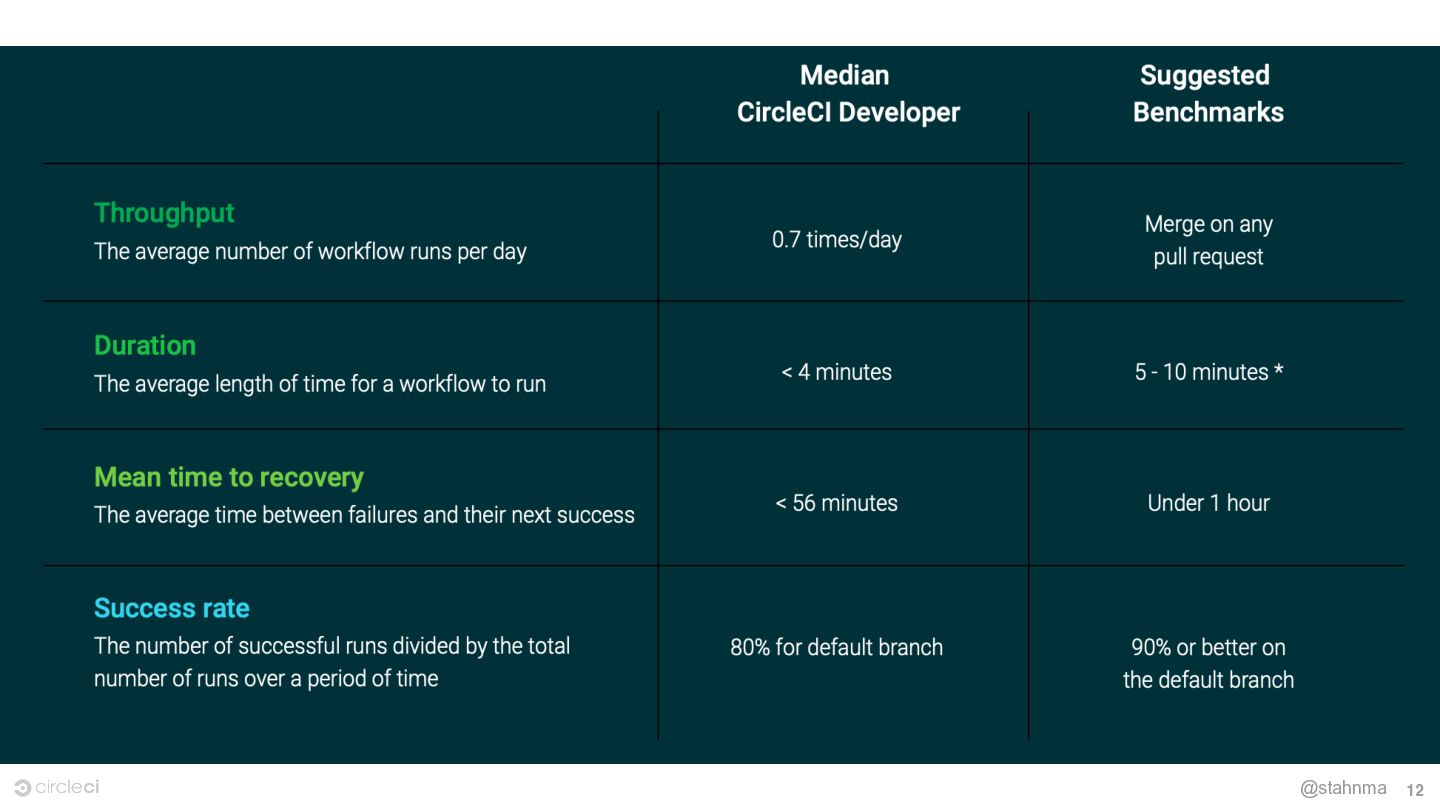
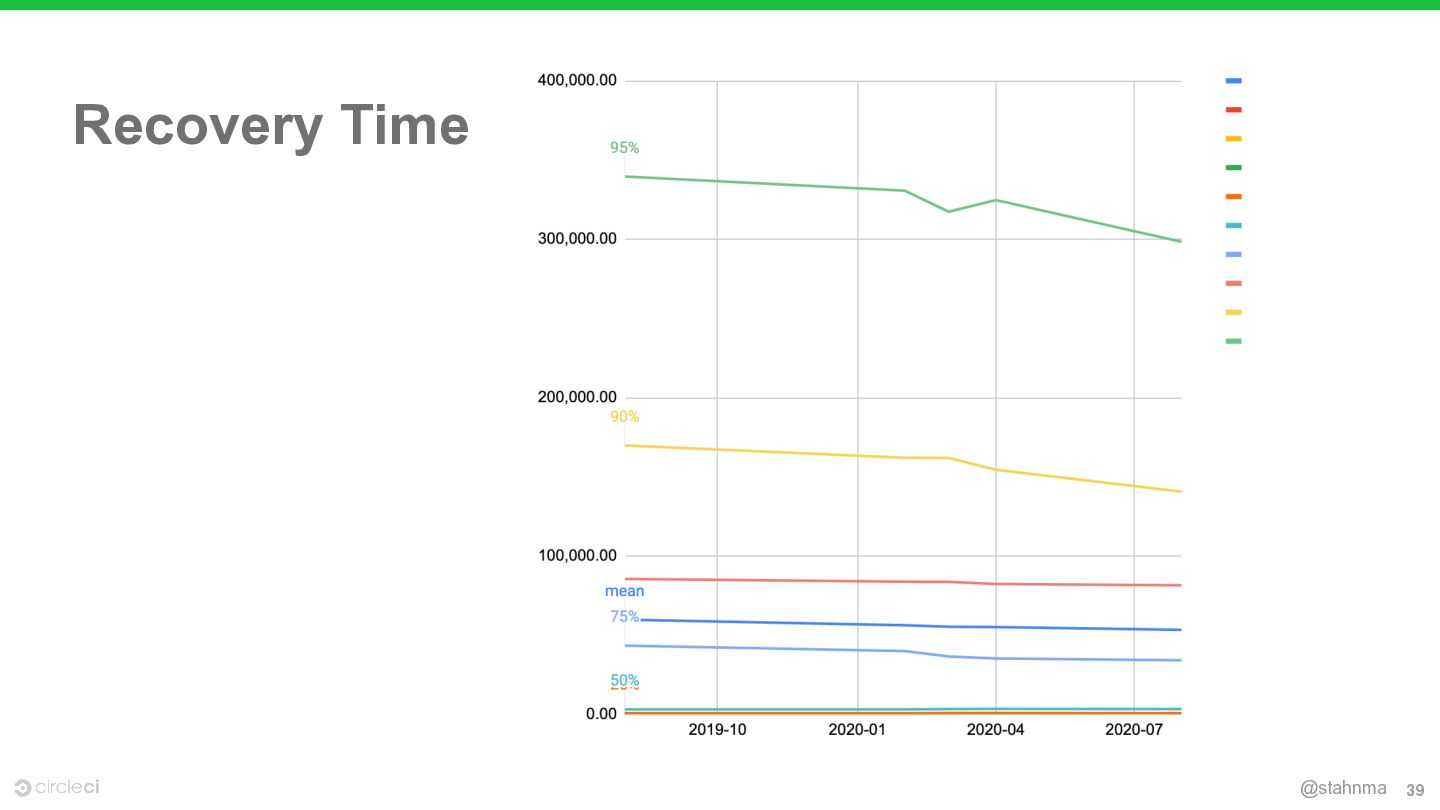
What 30 million workflows reveal about high performing teams. Michael Stahnke has been an author on Puppet's groundbreaking State of DevOps Report, but as he moved to CircleCI, he wanted to see the differences in the data when comparing survey gathered metrics vs system metrics from 30 million workflows on CircleCI.

Avatar for Michael Stahnke

Michael Stahnke

April 20, 2021

More Decks by Michael Stahnke

Other Decks in Technology

Transcript

  1. 1 DevOps from a 
 Different Data Set 
 (the

    short version) What 30 million workflows reveal about high performing teams Michael Stahnke VP Platform Engineering @stahnma
  2. 4

  3. 7 State of DevOps Report Metrics Deployment Frequency Lead time

    to Change Change Failure Rate MTTR Description when mapping to CI How often you initiate a pipeline Pipeline duration Pipeline failure rate Time from red to green Metric Mapping Metrics Throughput Duration Success Rate Recovery Time @stahnma
  4. 17 Percentile 2020 Value 2019 Value 5p 2.06 min 2.83

    min 50p 55.11 min 52.5 min 90p 39 hours 47 hours 95p 3.4 days 3.93 days Mean 14.85 hours 16.61 hours Recovery Time @stahnma
  5. Success Rate at 50p is 80% for default and 58%

    for non-default branches 32 @stahnma
  6. When mapped against survey surveying data, CI users at 50p

    show up between medium and high performers at an org level (vs project level). 42 @stahnma
  7. If you are average at using a CI platform, you’ll

    be right on the line between medium and high performer. 45 @stahnma
  8. Our most frequent CI users have better outcomes on our

    four critical metrics 46 @stahnma
  9. 49 Thank you Michael Stahnke @stahnma Special thanks to Ron

    Powell and Melissa Santos who gathered this data and were able to answer my questions about it.
  10. 50 Percentile 2020 Value 2019 Value 5p 0.03 0.03 50p

    0.70 0.80 90p 16.03 13.00 95p 32.125 25.47 Mean 8.22 5.76 Throughput @stahnma
  11. 51 Percentile 2020 Value 2019 Value 5p 12 sec 10

    sec 50p 3.96 min 3.38 min 90p 21.35 min 19.18 min 95p 34.01 min 31.73 min Mean 24.6 min 26.76 min Duration delta in a year @stahnma
  12. 52 Percentile 2020 Value 2019 Value 50p 61% 60% 75p

    89% 86% 85p 100% 98% Success Rate @stahnma
  13. 53 Percentile 2020 Value 2019 Value 5p 2.06 min 2.83

    min 50p 55.11 min 52.5 min 90p 39 hours 47 hours 95p 3.4 days 3.93 days Mean 14.85 hours 16.61 hours Recovery Time @stahnma