Upgrade to Pro
— share decks privately, control downloads, hide ads and more …
Speaker Deck
Sign up for free
Menu
Search
Features
All features
Private URLs
Password Protection
Custom URLS
Scheduled publishing
Remove Branding
Restrict embedding
Deck Collections
Notes
Features
All features
Private URLs
Password Protection
Custom URLS
Scheduled publishing
Remove Branding
Restrict embedding
Deck Collections
Notes
Explore
Featured decks
Featured speakers
Programming
Technology
Storyboards
Explore
Featured decks
Featured speakers
Programming
Technology
Storyboards
Pricing
Search
Sign in
Sign up for free
GKE で Pod の見方を変えたら、スケールアウト時の挙動を真に捉えられた話
Search
Sponsored
·
Ship Features Fearlessly
Turn features on and off without deploys. Used by thousands of Ruby developers.
→
Sota Takaki
September 04, 2026
Programming
150
0
Share
Embed
Copy iframe code
Copy JS code
Copy link
Start on current slide
GKE で Pod の見方を変えたら、スケールアウト時の挙動を真に捉えられた話
Sota Takaki
September 04, 2026
More Decks by Sota Takaki
See All by Sota Takaki
GKE アップグレード前に知っておきたい Blue/Green と PDB の関係
stkk
0
180
Terraform での Google Cloud IAM 管理 について考える
stkk
0
93
Other Decks in Programming
See All in Programming
コードレビューのボトルネックを"する側"と"される側"の両面から解消する
yub0n
2
1.6k
FactoryBotをやめればRSpecは速くなるのか?
yuta_onishi_97
0
910
ジョジョの世界をXRで再現する
mofurune
0
180
[Dev Group Paris Octobre 26] Agentforce, SIforce, Claudeforce, Slackbot… on s'y retrouve ?
nabondance
0
110
IBM Bob でAI駆動開発『QC-Playbook』
ichirokano2
0
120
複雑なUIコンポーネントとの ⻑い付き合い⽅:波及するバグからテスト戦略を経て、安全な再設計へ
mixplace
0
440
Workers Cache を知る
syumai
0
370
【加筆修正版】Laravel のアプリケーションをどこにデプロイするか #phpcon_ehime
akase244
0
150
Herb in Rails 8.2: Your ERB views, now HTML-aware @ Kaigi on Rails 2026, Tokyo, Japan
marcoroth
2
300
Optunaを作ったときにやりたかったこと、その後 (2026/10/16, Optuna Meetup #3)
iwiwi
2
1.1k
Seven New Principles of Software Engineering
yegor256
0
140
PyConTW 2026 - AI Coding 不只是工具升級, 區域醫院醫療資訊系統協作開發與資訊團隊轉型實踐
cclai999
0
110
Featured
See All Featured
What the history of the web can teach us about the future of AI
inesmontani
PRO
2
750
How Software Deployment tools have changed in the past 20 years
geshan
2
35k
Winning Ecommerce Organic Search in an AI Era - #searchnstuff2025
aleyda
2
2.2k
I Don’t Have Time: Getting Over the Fear to Launch Your Podcast
jcasabona
35
2.9k
Between Models and Reality
mayunak
4
500
Embracing the Ebb and Flow
colly
88
5.2k
No one is an island. Learnings from fostering a developers community.
thoeni
21
3.9k
Lessons Learnt from Crawling 1000+ Websites
charlesmeaden
PRO
1
1.6k
Noah Learner - AI + Me: how we built a GSC Bulk Export data pipeline
techseoconnect
PRO
0
460
Performance Is Good for Brains [We Love Speed 2024]
tammyeverts
12
1.9k
Future Trends and Review - Lecture 12 - Web Technologies (1019888BNR)
signer
PRO
0
3.8k
How To Stay Up To Date on Web Technology
chriscoyier
790
250k
Transcript
GKE で Pod の見方を変えたら、 スケールアウト時の Pod の挙動を 真に捉えられた話 株式会社スリーシェイク Sreake事業部
髙木 創太 SRE Tech Talk #15 2026-09-04 Copyright Reserved. Copyright © © 3-shake, 3-shake, Inc. Inc. All All Rights Right Reserved. 1
自己紹介 • • • Copyright © 3-shake, Inc. All Rights
Reserved. 名前 ◦ 髙木 創太 所属 ◦ 株式会社スリーシェイク SRE 一言 ◦ 全てこのアフロでプロフィール画像を統一していま す。よろしくお願いします。 ▪ X: https://x.com/stkk_12 ▪ Zenn: https://zenn.dev/stkk 2
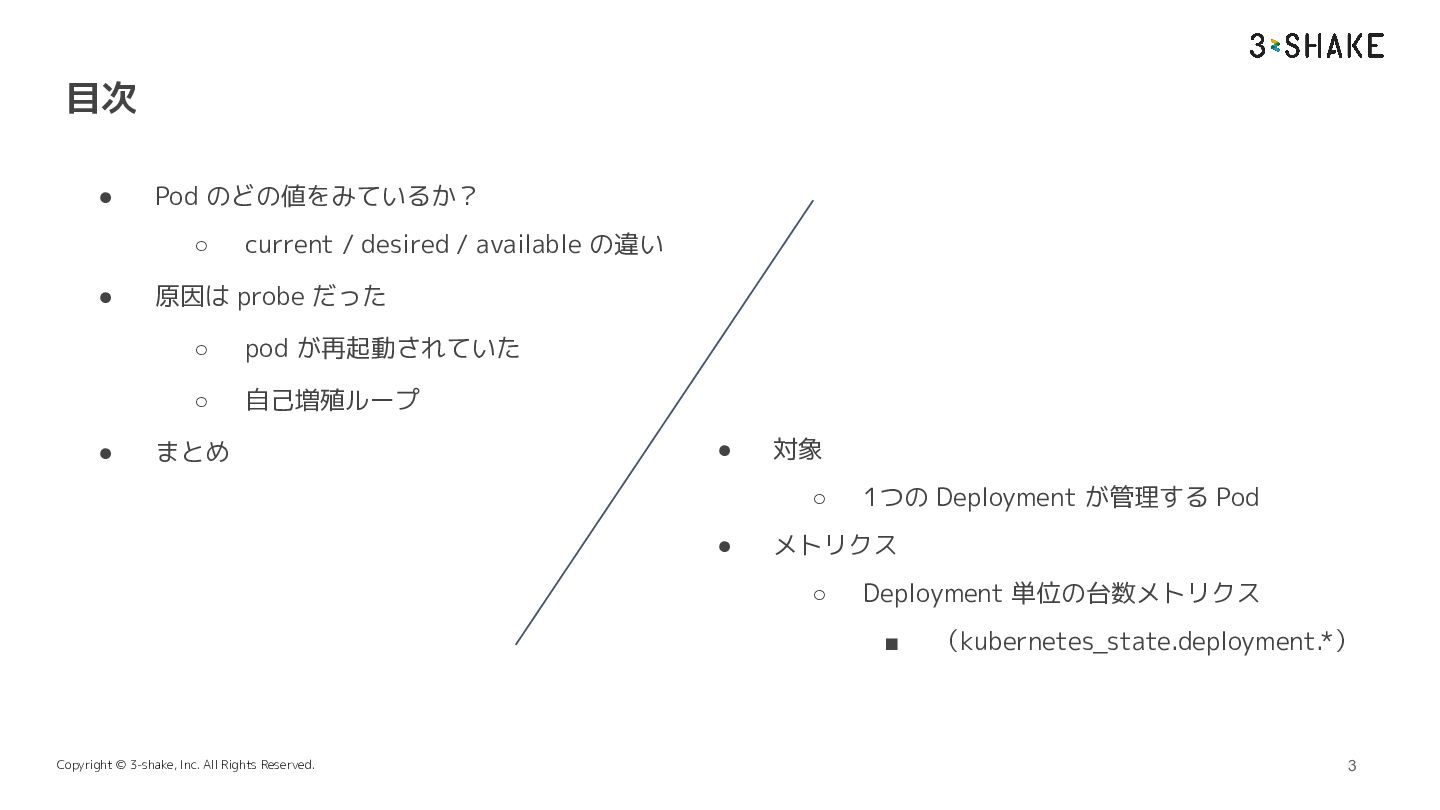
目次 • Pod のどの値をみているか? ◦ • • current / desired
/ available の違い 原因は probe だった ◦ pod が再起動されていた ◦ 自己増殖ループ まとめ • 対象 ◦ • 1つの Deployment が管理する Pod メトリクス ◦ Deployment 単位の台数メトリクス ▪ Copyright © 3-shake, Inc. All Rights Reserved. (kubernetes_state.deployment.*) 3
01 Pod のどの値をみているか? Copyright © 3-shake, Inc. All Rights Reserved.
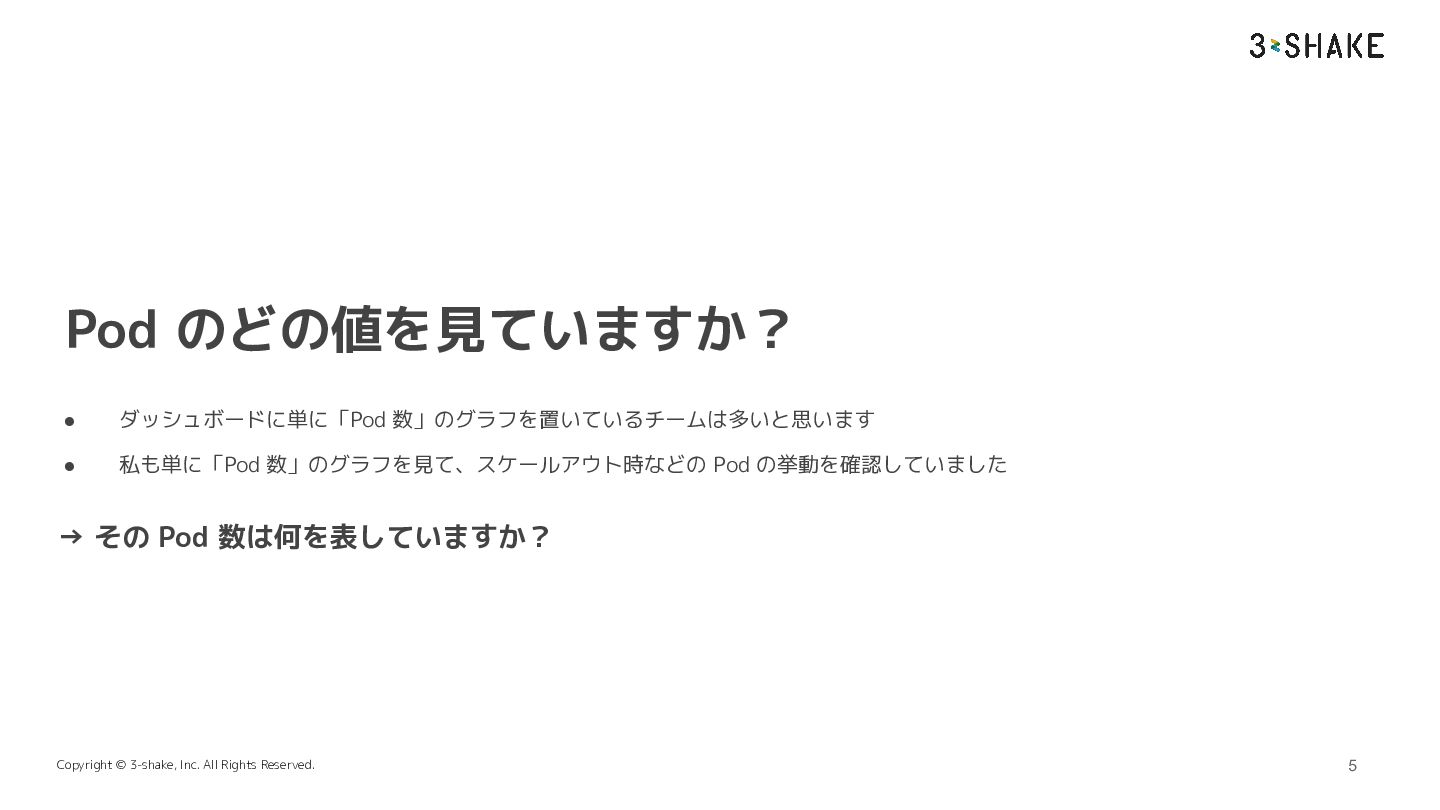
Pod のどの値を見ていますか? • ダッシュボードに単に「Pod 数」のグラフを置いているチームは多いと思います • 私も単に「Pod 数」のグラフを見て、スケールアウト時などの Pod の挙動を確認していました
→ その Pod 数は何を表していますか? Copyright © 3-shake, Inc. All Rights Reserved. 5
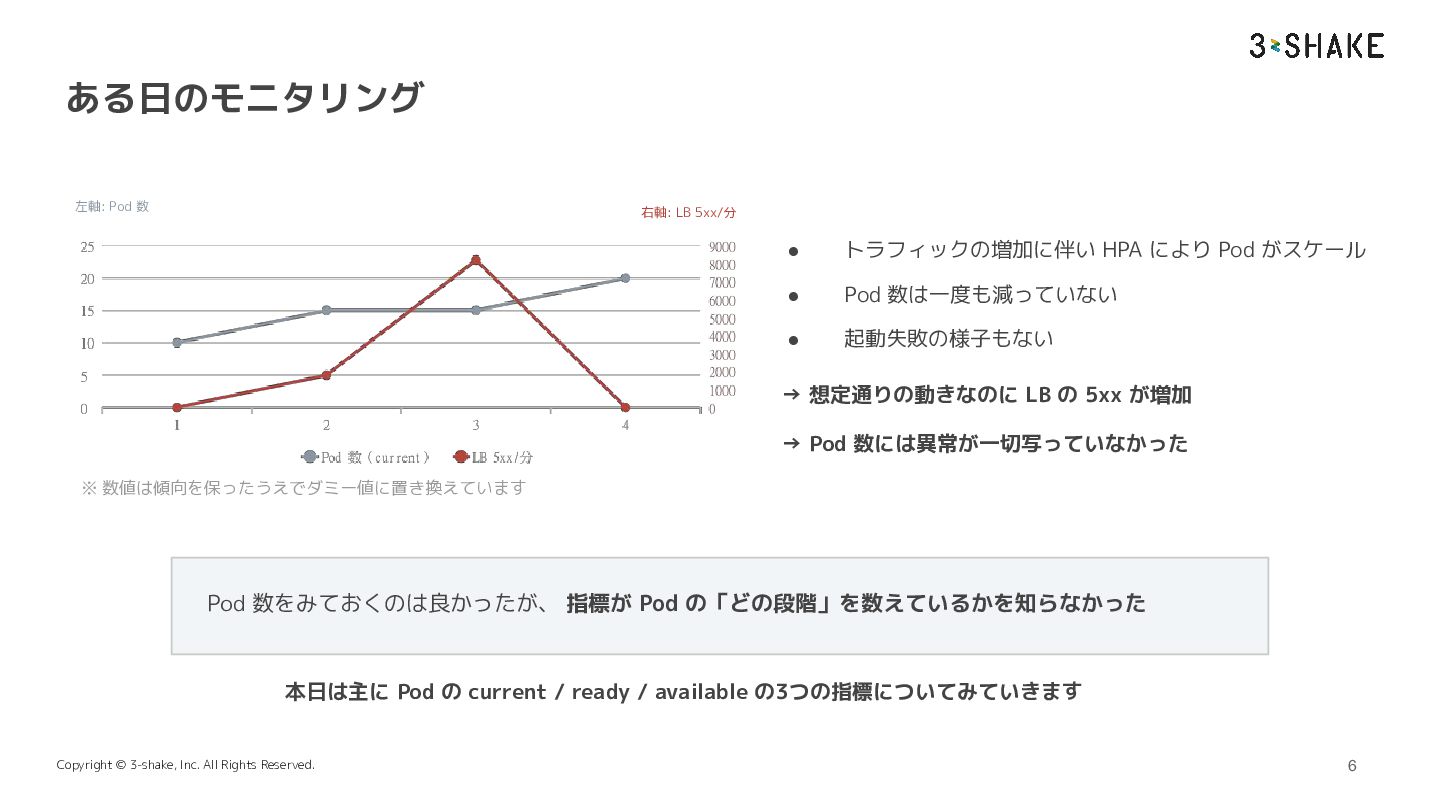
ある日のモニタリング 左軸: Pod 数 右軸: LB 5xx/分 • トラフィックの増加に伴い HPA
により Pod がスケール • Pod 数は一度も減っていない • 起動失敗の様子もない → 想定通りの動きなのに LB の 5xx が増加 → Pod 数には異常が一切写っていなかった ※ 数値は傾向を保ったうえでダミー値に置き換えています Pod 数をみておくのは良かったが、 指標が Pod の「どの段階」を数えているかを知らなかった 本日は主に Pod の current / ready / available の3つの指標についてみていきます Copyright © 3-shake, Inc. All Rights Reserved. 6
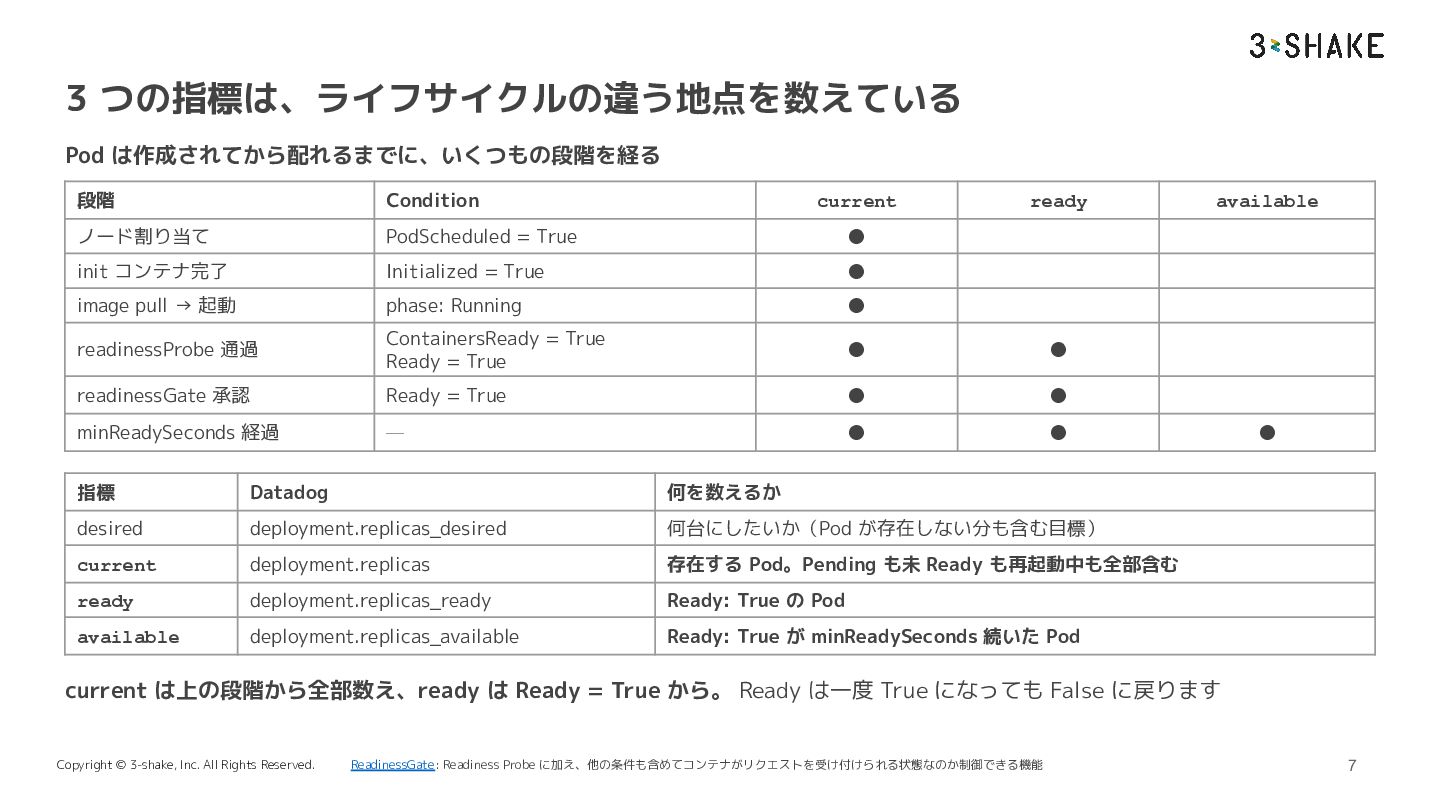
3 つの指標は、ライフサイクルの違う地点を数えている Pod は作成されてから配れるまでに、いくつもの段階を経る 段階 Condition ノード割り当て PodScheduled = True
• init コンテナ完了 Initialized = True • image pull → 起動 phase: Running • readinessProbe 通過 ContainersReady = True Ready = True • • readinessGate 承認 Ready = True • • minReadySeconds 経過 — • • current ready 指標 Datadog 何を数えるか desired deployment.replicas_desired 何台にしたいか(Pod が存在しない分も含む目標) current deployment.replicas 存在する Pod。Pending も未 Ready も再起動中も全部含む ready deployment.replicas_ready Ready: True の Pod available deployment.replicas_available Ready: True が minReadySeconds 続いた Pod available • current は上の段階から全部数え、ready は Ready = True から。 Ready は一度 True になっても False に戻ります Copyright © 3-shake, Inc. All Rights Reserved. ReadinessGate: Readiness Probe に加え、他の条件も含めてコンテナがリクエストを受け付けられる状態なのか制御できる機能 7
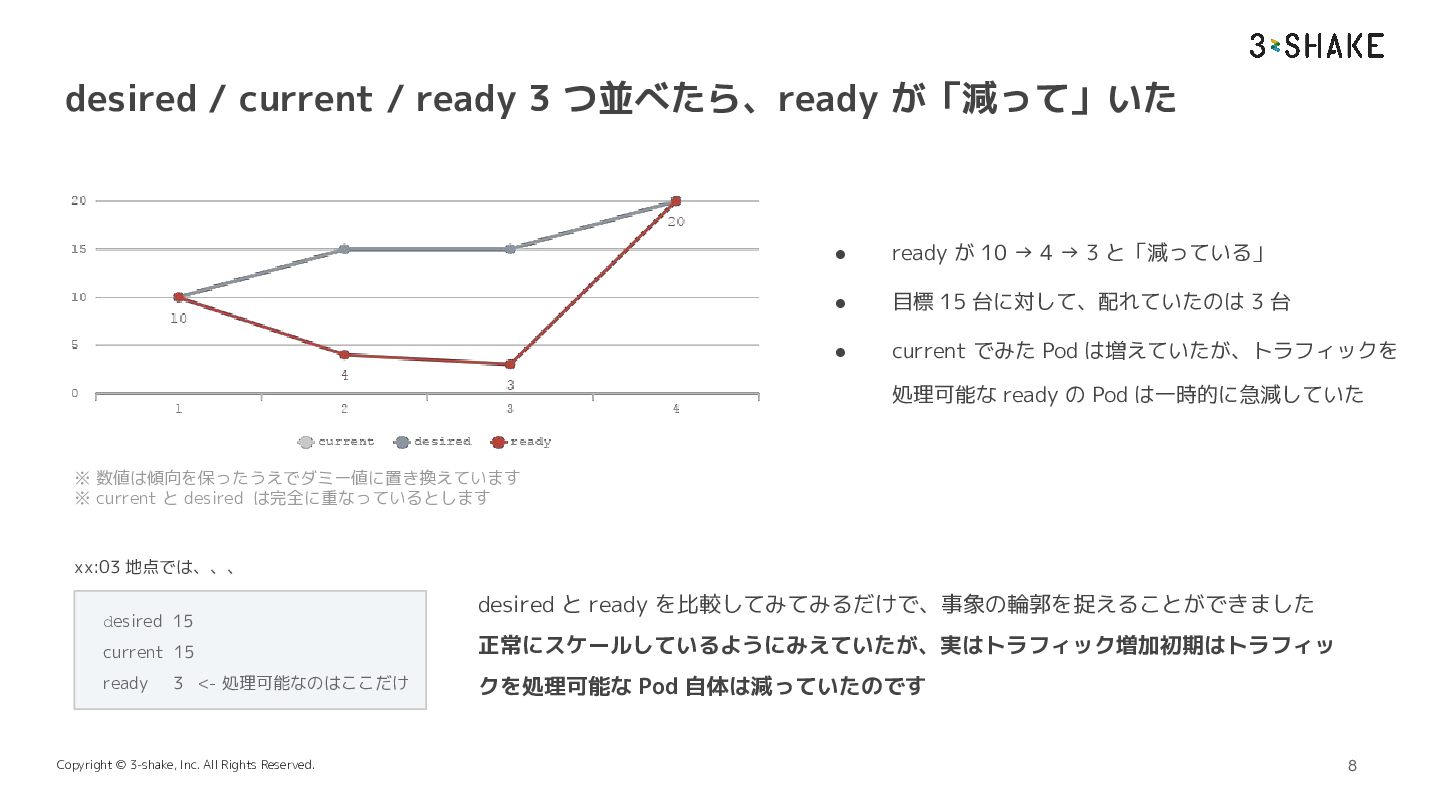
desired / current / ready 3 つ並べたら、ready が「減って」いた • ready
が 10 → 4 → 3 と「減っている」 • 目標 15 台に対して、配れていたのは 3 台 • current でみた Pod は増えていたが、トラフィックを 処理可能な ready の Pod は一時的に急減していた ※ 数値は傾向を保ったうえでダミー値に置き換えています ※ current と desired は完全に重なっているとします xx:03 地点では、、、 desired 15 desired と ready を比較してみてみるだけで、事象の輪郭を捉えることができました current 15 正常にスケールしているようにみえていたが、実はトラフィック増加初期はトラフィッ ready クを処理可能な Pod 自体は減っていたのです 3 <- 処理可能なのはここだけ Copyright © 3-shake, Inc. All Rights Reserved. 8
02 原因は probe だった Copyright © 3-shake, Inc. All Rights
Reserved.
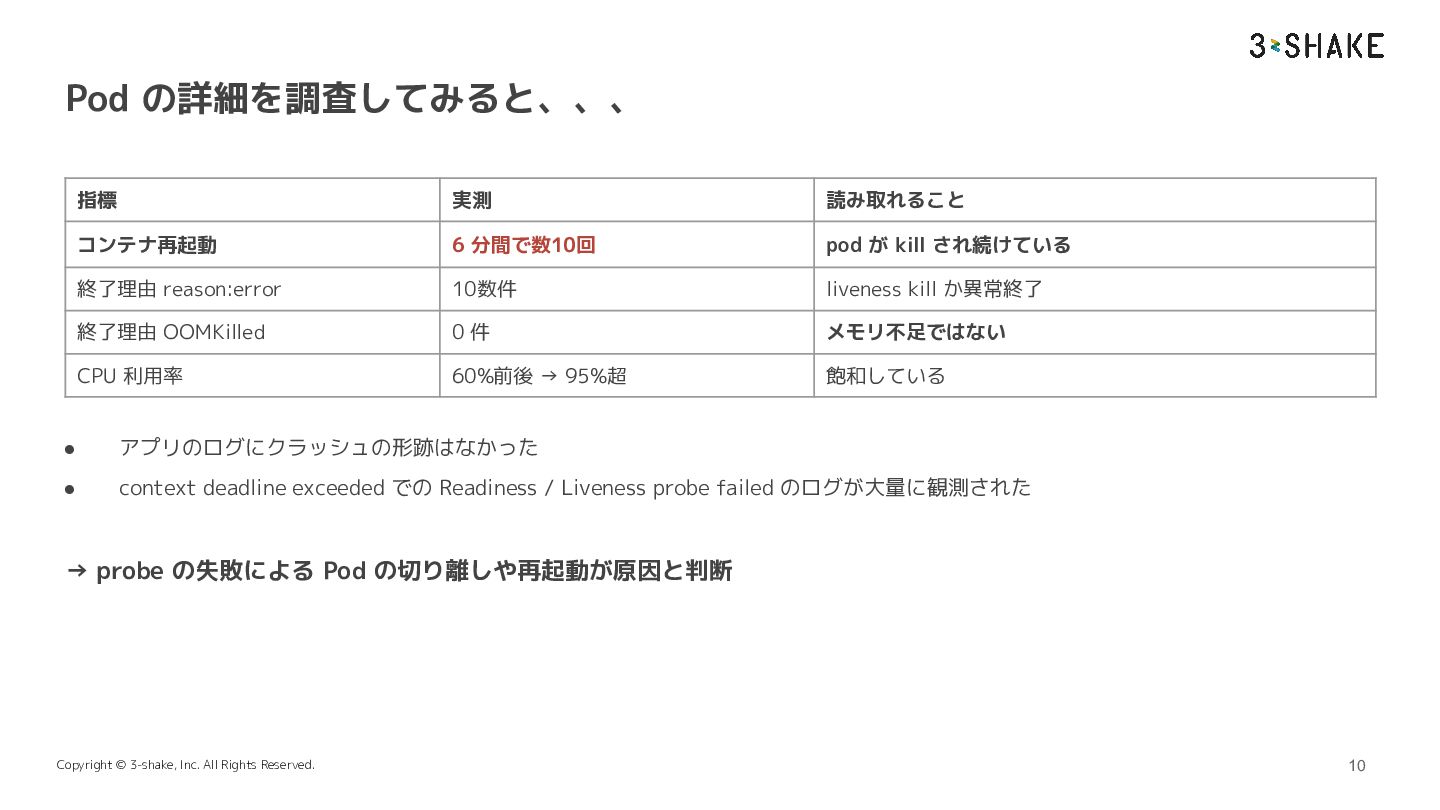
Pod の詳細を調査してみると、、、 指標 実測 読み取れること コンテナ再起動 6 分間で数10回 pod が
kill され続けている 終了理由 reason:error 10数件 liveness kill か異常終了 終了理由 OOMKilled 0件 メモリ不足ではない CPU 利用率 60%前後 → 95%超 飽和している • アプリのログにクラッシュの形跡はなかった • context deadline exceeded での Readiness / Liveness probe failed のログが大量に観測された → probe の失敗による Pod の切り離しや再起動が原因と判断 Copyright © 3-shake, Inc. All Rights Reserved. 10
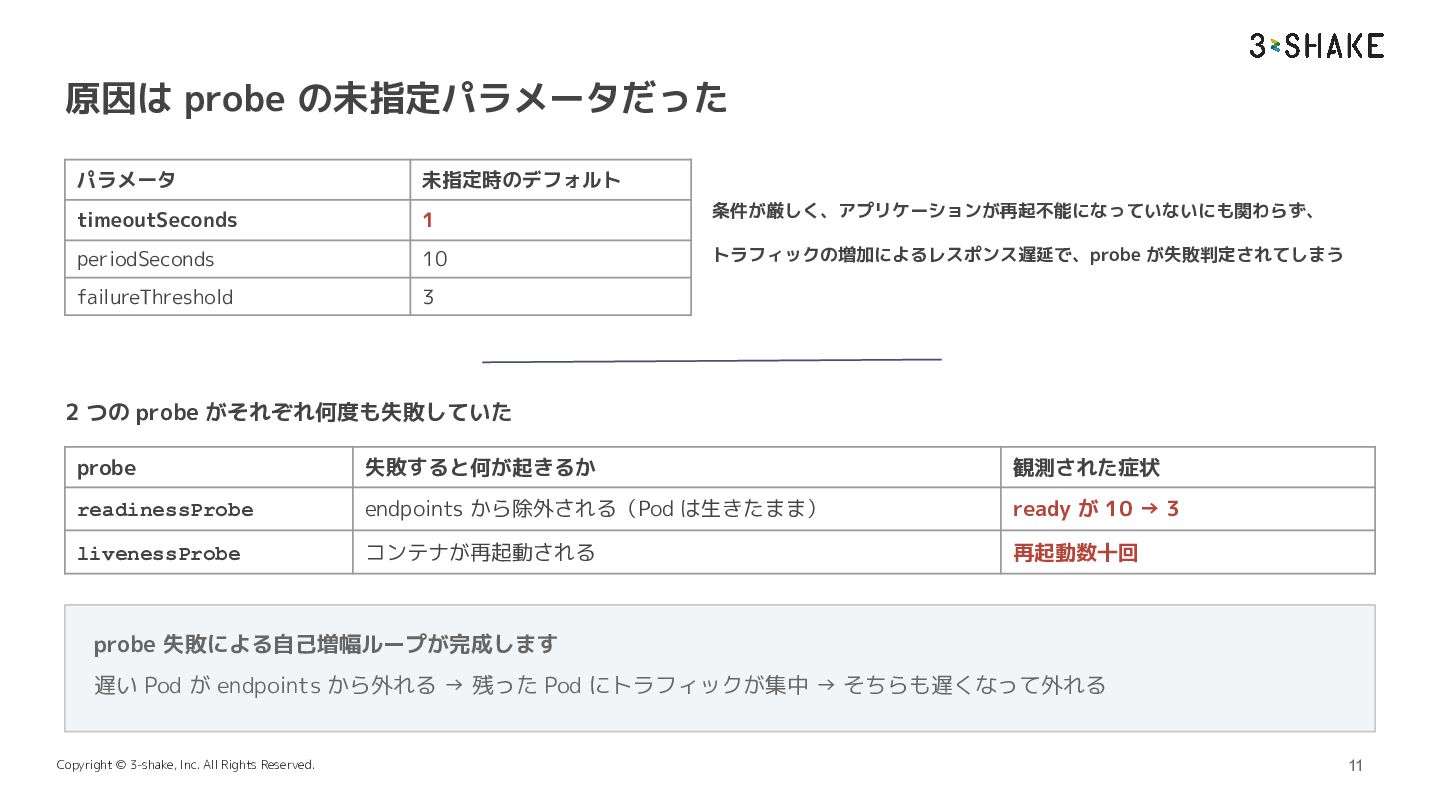
原因は probe の未指定パラメータだった パラメータ 未指定時のデフォルト timeoutSeconds 1 条件が厳しく、アプリケーションが再起不能になっていないにも関わらず、 periodSeconds 10
トラフィックの増加によるレスポンス遅延で、probe が失敗判定されてしまう failureThreshold 3 2 つの probe がそれぞれ何度も失敗していた probe 失敗すると何が起きるか 観測された症状 readinessProbe endpoints から除外される(Pod は生きたまま) ready が 10 → 3 livenessProbe コンテナが再起動される 再起動数十回 probe 失敗による自己増幅ループが完成します 遅い Pod が endpoints から外れる → 残った Pod にトラフィックが集中 → そちらも遅くなって外れる Copyright © 3-shake, Inc. All Rights Reserved. 11
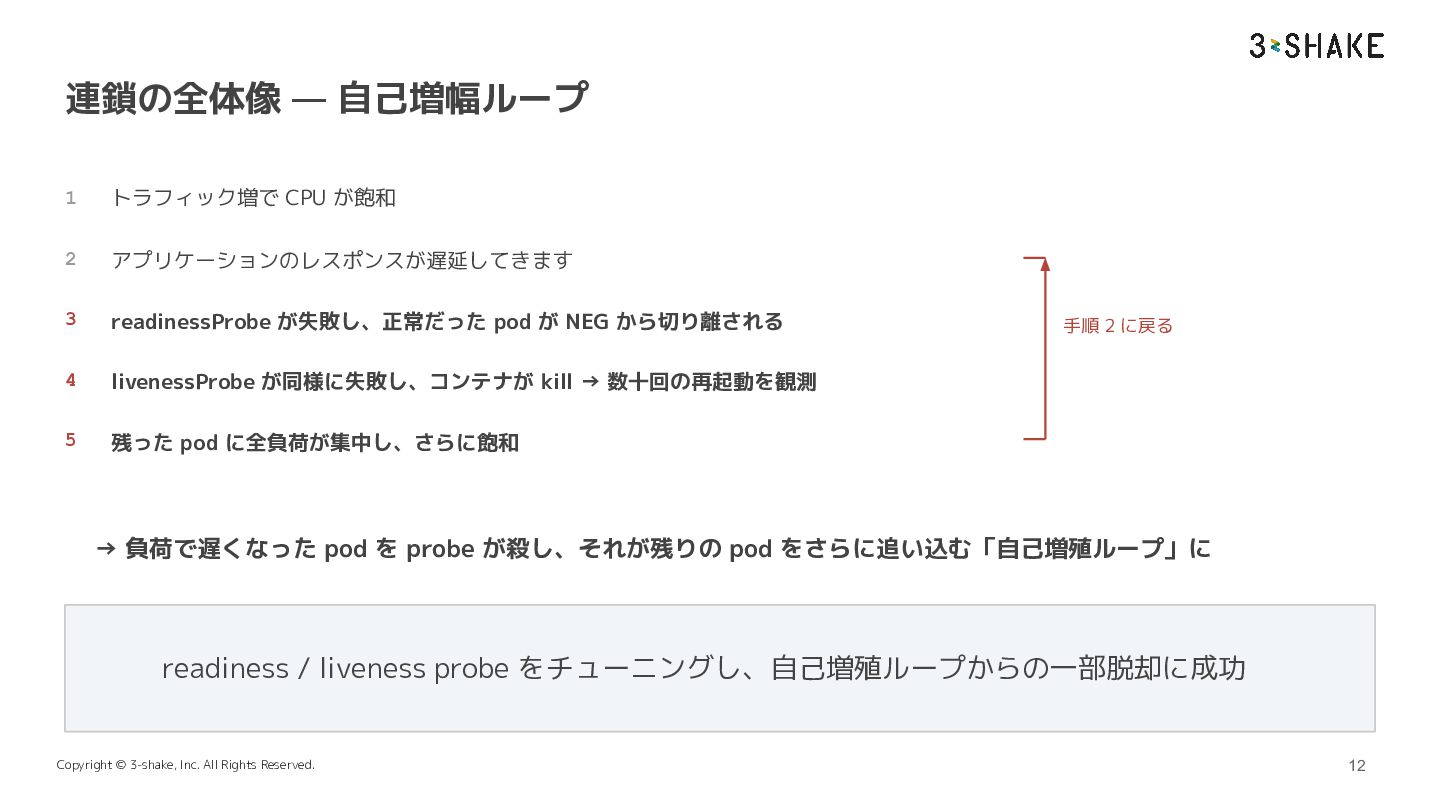
連鎖の全体像 — 自己増幅ループ 1 トラフィック増で CPU が飽和 2 アプリケーションのレスポンスが遅延してきます 3
readinessProbe が失敗し、正常だった pod が NEG から切り離される 4 livenessProbe が同様に失敗し、コンテナが kill → 数十回の再起動を観測 5 残った pod に全負荷が集中し、さらに飽和 手順 2 に戻る → 負荷で遅くなった pod を probe が殺し、それが残りの pod をさらに追い込む「自己増殖ループ」に readiness / liveness probe をチューニングし、自己増殖ループからの一部脱却に成功 Copyright © 3-shake, Inc. All Rights Reserved. 12
03 まとめ Copyright © 3-shake, Inc. All Rights Reserved.
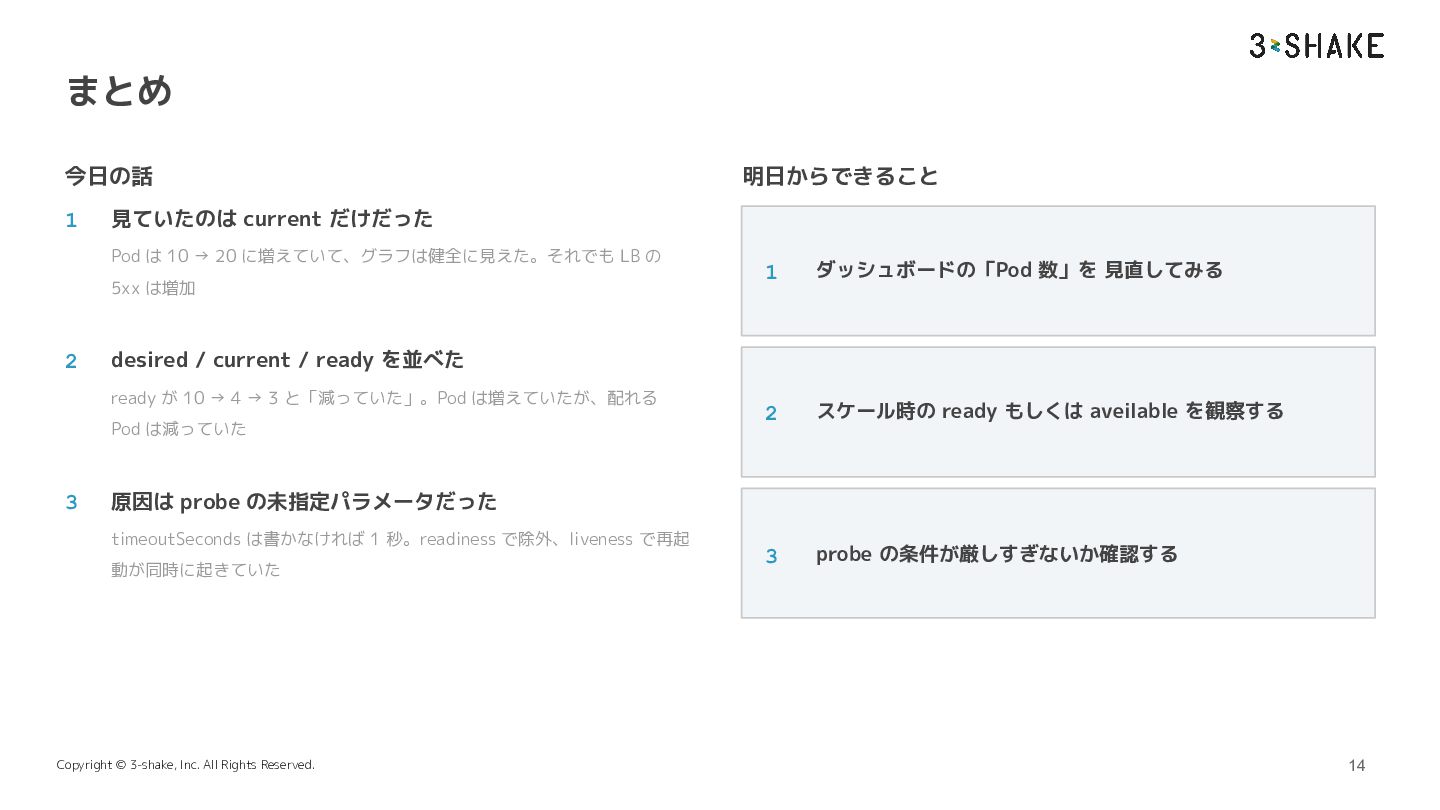
まとめ 今日の話 1 明日からできること 見ていたのは current だけだった Pod は 10
→ 20 に増えていて、グラフは健全に見えた。それでも LB の 5xx は増加 2 1 ダッシュボードの「Pod 数」を 見直してみる 2 スケール時の ready もしくは aveilable を観察する 3 probe の条件が厳しすぎないか確認する desired / current / ready を並べた ready が 10 → 4 → 3 と「減っていた」。Pod は増えていたが、配れる Pod は減っていた 3 原因は probe の未指定パラメータだった timeoutSeconds は書かなければ 1 秒。readiness で除外、liveness で再起 動が同時に起きていた Copyright © 3-shake, Inc. All Rights Reserved. 14
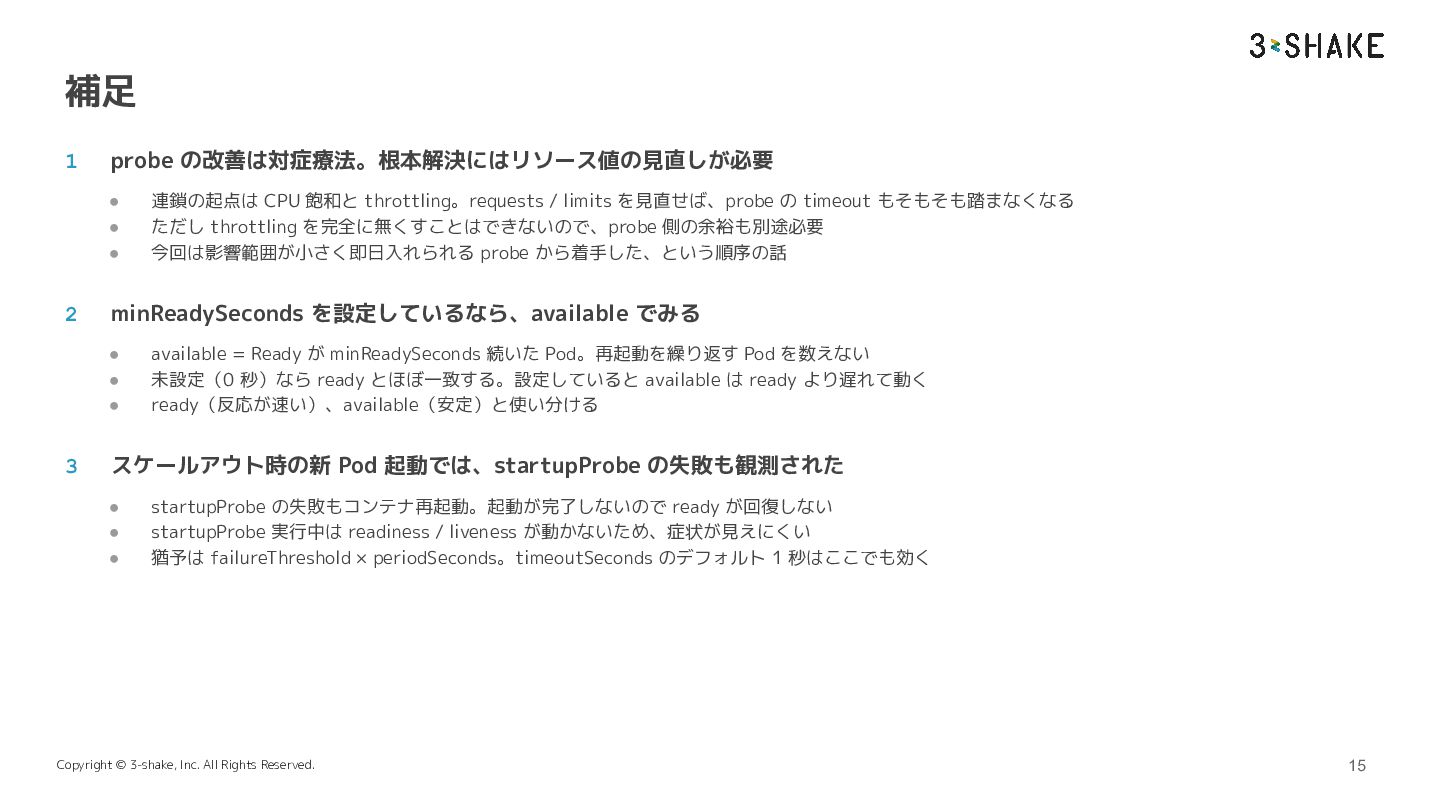
補足 1 probe の改善は対症療法。根本解決にはリソース値の見直しが必要 • • • 2 minReadySeconds を設定しているなら、available
でみる • • • 3 連鎖の起点は CPU 飽和と throttling。requests / limits を見直せば、probe の timeout もそもそも踏まなくなる ただし throttling を完全に無くすことはできないので、probe 側の余裕も別途必要 今回は影響範囲が小さく即日入れられる probe から着手した、という順序の話 available = Ready が minReadySeconds 続いた Pod。再起動を繰り返す Pod を数えない 未設定(0 秒)なら ready とほぼ一致する。設定していると available は ready より遅れて動く ready(反応が速い)、available(安定)と使い分ける スケールアウト時の新 Pod 起動では、startupProbe の失敗も観測された • • • startupProbe の失敗もコンテナ再起動。起動が完了しないので ready が回復しない startupProbe 実行中は readiness / liveness が動かないため、症状が見えにくい 猶予は failureThreshold × periodSeconds。timeoutSeconds のデフォルト 1 秒はここでも効く Copyright © 3-shake, Inc. All Rights Reserved. 15
ご清聴ありがとうございました! Copyright © 3-shake, Inc. All Rights Reserved. 16


 stkk
 yub0n
 yuta_onishi_97
 mofurune
 nabondance
 ichirokano2
 mixplace
 syumai
 akase244
 marcoroth
 iwiwi
 yegor256
 cclai999
 inesmontani
 geshan
 aleyda
 jcasabona
 mayunak
 colly
 thoeni
 charlesmeaden
 techseoconnect
 tammyeverts
 signer
 chriscoyier