Upgrade to Pro
— share decks privately, control downloads, hide ads and more …
Speaker Deck
Features
Speaker Deck
PRO
Sign in
Sign up for free
Search
Search
Diving into the Details with DTrace
Search
Colin Jones
August 18, 2016
Programming
540
3
Share
Embed
Copy iframe code
Copy JS code
Copy link
Start on current slide
Diving into the Details with DTrace
A talk from Abstractions 2016
Colin Jones
August 18, 2016
More Decks by Colin Jones
See All by Colin Jones
A Bug's Life: What if `select` is Broken After All?
trptcolin
0
190
Underestimated costs of microservice architectures
trptcolin
3
1.6k
FP vs. OOP: Beyond the Bikeshed
trptcolin
0
470
Diving into the Details with DTrace! (RubyConf 2016 edition)
trptcolin
2
540
Adopting FP: the good, the familiar, and the unknown
trptcolin
0
290
Finding out what's *really* going on, with DTrace!
trptcolin
1
410
Beyond top: Command-Line Monitoring on the JVM (ClojureRemote)
trptcolin
0
170
Beyond top: Command-Line Monitoring on the JVM (JavaOne 2015)
trptcolin
1
700
ZooKeeper: Wait-free coordination for Internet-scale systems
trptcolin
2
230
Other Decks in Programming
See All in Programming
【やさしく解説 設計編・中級 #1】一つの車に、運転手は一人 ~ある倉庫システムの事例から~
panda728
PRO
0
120
SLOをサービス品質の共通言語にするために 取り組んできたこと
wakana0222
0
380
AIを活用したE2Eテスト実装効率化のあゆみ / ebisu-mobile-14-kotetu
kotetuco
0
160
Snowflake Summitでの新機能 CoCo / CoWork / snowflake-summit-2026-overall-what-new-coco
tatsuhiro
1
220
エンジニア向け会社紹介/Findy Company Profile
findyinc
6
360k
決定論的オーケストレーションの設計と実装 / Design and Implementation of Deterministic Orchestration
nrslib
4
1.6k
壊れたパーサから始める関数型設計と構成的なパーサ #fp_matsuri
raiga0310
2
170
ローカルLLMでどこまでコードが書けるか -縮小版 / How much code can be written on a local LLM Shortened
kishida
2
180
音楽のための関数型プログラミング言語mimiumにおける多段階計算の活用
tomoyanonymous
1
280
Dataformのリポジトリを立ち上げるときにまずやること / dataform-day0-2026
snhryt
0
210
フィードバックで育てるAI開発
kotaminato
1
110
1B+ /day規模のログを管理する技術
broadleaf
0
130
Featured
See All Featured
The Organizational Zoo: Understanding Human Behavior Agility Through Metaphoric Constructive Conversations (based on the works of Arthur Shelley, Ph.D)
kimpetersen
PRO
0
380
Leveraging Curiosity to Care for An Aging Population
cassininazir
1
310
End of SEO as We Know It (SMX Advanced Version)
ipullrank
3
4.3k
Reality Check: Gamification 10 Years Later
codingconduct
0
2.2k
Large-scale JavaScript Application Architecture
addyosmani
515
110k
Marketing Yourself as an Engineer | Alaka | Gurzu
gurzu
0
260
Into the Great Unknown - MozCon
thekraken
41
2.6k
The innovator’s Mindset - Leading Through an Era of Exponential Change - McGill University 2025
jdejongh
PRO
1
220
Embracing the Ebb and Flow
colly
88
5.1k
Tell your own story through comics
letsgokoyo
1
990
Neural Spatial Audio Processing for Sound Field Analysis and Control
skoyamalab
0
370
Between Models and Reality
mayunak
4
360
Transcript
Diving into the details with DTrace! Colin Jones @trptcolin
systems applications
problems solutions
problems solutions
What even is DTrace?
DTrace is… strace
DTrace is… strace++
strace++ $ sudo dtrace -qn ' syscall:::entry { @[probefunc, execname]
= count(); } dtrace:::END { trunc(@, 10); printa(@); }'
strace++ $ sudo dtrace -qn 'syscall:::entry { @[probefunc, execname] =
count(); } dtrace:::END { trunc(@, 10); printa(@); }' ^C read Slack 1993 select Slack 2017 kevent_qos Slack 2660 kevent_qos WindowServer 2801 psynch_cvsignal Box Sync 2873 psynch_cvwait Box Sync 2873 select Box Sync 4780 madvise Slack 5783 bsdthread_ctl Slack 6910 workq_kernreturn Slack 10622
DTrace is… strace++ system resources
system resources $ sudo dtrace -qn ' vminfo:::maj_fault { @[execname]
= sum(arg0); }'
system resources $ sudo dtrace -qn 'vminfo:::maj_fault { @[execname] =
sum(arg0); }' ^C 2BUA8C4S2C.com.a 1 mdworker 2 Google Chrome 12 mds_stores 116 Google Chrome He 252
DTrace is… strace++ system resources statically-defined tracing
statically-defined tracing $ sudo dtrace -qn ' mysql*::: { @[probename]
= count(); } dtrace:::END { trunc(@, 10); printa(@); }'
$ sudo dtrace -qn 'mysql*::: { @[probename] = count(); }
dtrace:::END { trunc(@, 10); printa(@); }' ^C query-exec-start 3 query-parse-done 3 query-parse-start 3 query-start 3 select-done 3 select-start 3 net-read-done 18 net-read-start 18 net-write-done 18 net-write-start 18 statically-defined tracing
DTrace is… strace++ system resources statically-defined tracing dynamic tracing
Dynamic tracing $ sudo dtrace -qn ' fbt:mach_kernel::entry { self->in
= timestamp; } fbt:mach_kernel::return /self->in/ { @ = quantize(timestamp - self->in) self->in = 0; }'
Dynamic tracing $ sudo dtrace -n 'fbt:mach_kernel::entry { self->in =
timestamp; } fbt:mach_kernel::return /self->in/ { @ = quantize(timestamp - self->in); self->in = 0; }' dtrace: description 'fbt:mach_kernel::entry ' matched 24482 probes ^C value ------------- Distribution ------------- count 256 | 0 512 |@@@@@@@@@@@@@@@@@@ 13521 1024 |@@@@@@@@@@@@@@@@@@@ 14961 2048 |@@@ 2172 4096 | 79 8192 | 71 16384 | 7 32768 | 3 65536 | 3 131072 | 2 262144 | 0
DTrace is… strace++ system resources statically-defined tracing dynamic tracing
Weird slowness… it happens
Slooooooooow tests (…sometimes)
Multiple tests, multiple machines
Affects some teammates worse than others
annoying productivity-sapping stressful
Hypotheses?
Use DTrace!
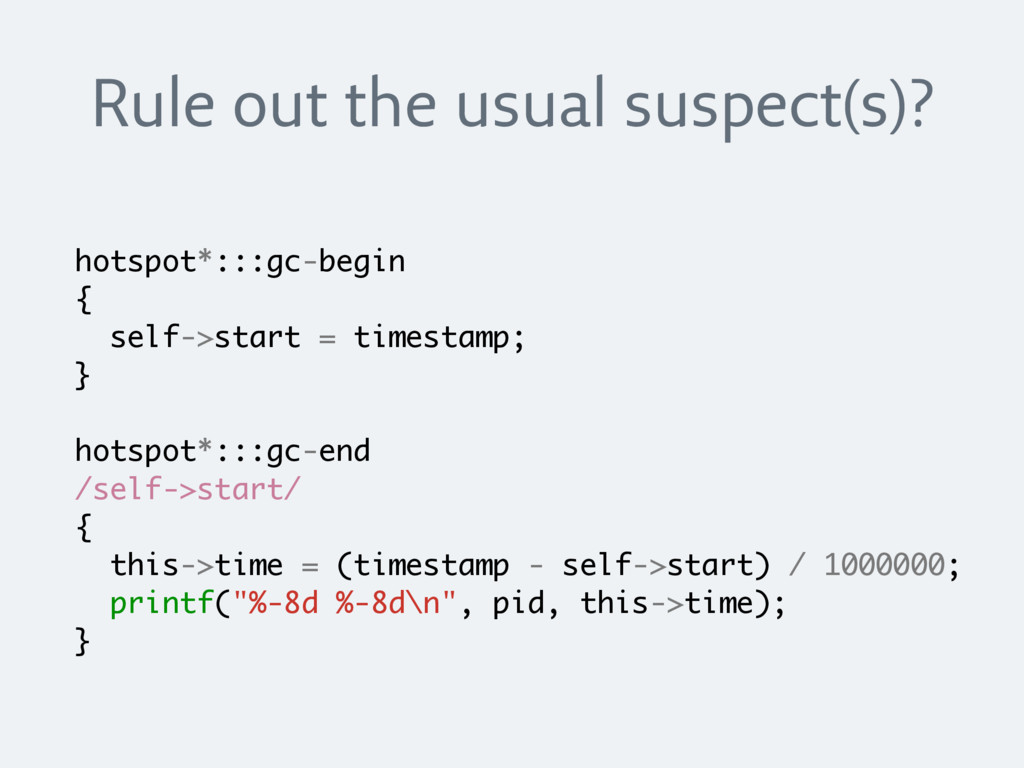
Rule out the usual suspect(s)? hotspot*:::gc-begin { self->start = timestamp;
} hotspot*:::gc-end /self->start/ { this->time = (timestamp - self->start) / 1000000; printf("%-8d %-8d\n", pid, this->time); }
Garbage Collection $ sudo gc_time.d PID GC (ms) 40320 9
40320 9 73113 1 73113 1 73113 1 40320 36 73184 1 73184 1 73184 1 40320 9 40320 160 72735 7
System resources CPU Memory Disk Network
CPU? $ sudo dtrace -qn ' profile-997 { @[execname] =
count(); } '
CPU? $ sudo dtrace -qn 'profile-997 { @[execname] = count();
}' ^C [...] Box Sync 3 Google Drive 3 java 3 Google Chrome 9 systemstatsd 11 iTerm 14 Google Chrome He 24 WindowServer 25 hidd 26 Box Sync Monitor 47 kernel_task 9527
CPU? $ sudo dtrace -qn ' profile-997 /execname=="kernel_task"/ { @[stack()]
= count(); } '
CPU? $ sudo dtrace -qn 'profile-997 /execname=="kernel_task"/ { @[stack()] =
count(); }' ^C [...] kernel`0xffffff80010f3d30+0x358 kernel`0xffffff800158d890+0x793 kernel`kevent+0x44 kernel`unix_syscall64+0x251 kernel`hndl_unix_scall64+0x16 116 kernel`processor_idle+0x107 121 kernel`machine_idle+0x2e0 kernel`call_continuation+0x17 82967
CPU $ sudo dtrace -qn 'profile-997 { @[execname] = count();
}' ^C [...] Box Sync 3 Google Drive 3 java 3 Google Chrome 9 systemstatsd 11 iTerm 14 Google Chrome He 24 WindowServer 25 hidd 26 Box Sync Monitor 47 kernel_task 9527
System resources CPU Memory Disk Network
Network connections https://github.com/brendangregg/DTrace-book-scripts/blob/master/Chap6/soconnect_mac.d
Network connections https://github.com/brendangregg/DTrace-book-scripts/blob/master/Chap6/soconnect_mac.d $ sudo soconnect_mac.d PID PROCESS FAM ADDRESS
PORT LAT(us) RESULT 88161 java 2 127.0.0.1 5432 144 Success 88161 java 2 127.0.0.1 5432 171 Success 88161 java 2 127.0.0.1 5432 150 Success 114 AirPlayXPCHelper 2 192.168.1.27 7000 1762 In progress 88161 java 2 127.0.0.1 5432 141 Success 88161 java 2 127.0.0.1 5432 179 Success 88161 java 2 127.0.0.1 5432 137 Success 88161 java 2 72.52.4.119 80 29977 Success 88161 java 2 72.52.4.119 80 42121 Success 88161 java 2 72.52.4.119 80 29471 Success 88161 java 2 72.52.4.119 80 29360 Success 88161 java 2 72.52.4.119 80 34731 Success 88161 java 2 72.52.4.119 80 28824 Success
DNS pid$target::getaddrinfo:entry { self->start = timestamp; self->host = copyinstr(arg0); }
pid$target::getaddrinfo:return /self->start/ { this->now = (timestamp - timezero) / 1000000; this->time = (timestamp - self->start) / 1000000; printf("%-8d %-8d %s\n", this->now, this->time, self->host); self->start = 0; self->host = 0; }
DNS $ sudo dns_latency.d -p 41161 Password: TICK ms HOST
74450 274 redclay.local 74734 0 redclay.local 105006 30075 someplace.com 145171 30075 someplace.com 145191 1 redclay.local 145192 0 redclay.local 177055 0 example.com 252314 2 redclay.local 252315 0 redclay.local 284392 0 example.com
Now we know what to fix!
What did we learn?
Specific vs. General
DTrace is… strace++ system resources statically-defined tracing dynamic tracing
You can do it!
Where can we learn more?
Brendan Gregg's blog: http://www.brendangregg.com/dtrace.html The DTrace guide http://dtrace.org/guide DTrace: Dynamic
Tracing in Oracle Solaris, Mac OS X, and FreeBSD http://amzn.to/2bqBczw Read
Scripts that ship with OS X find /usr/bin -name "*.d"
more DTrace scripts https://github.com/brendangregg/DTrace-book-scripts Examples
DTrace: not just performance performance: not just DTrace Extrapolate
Try it out!
DTrace & SIP on El Capitan: http://internals.exposed/blog/dtrace-vs-sip.html Julia Evans' strace
zine: http://jvns.ca/blog/2015/04/14/strace-zine/ Jeff Hodges "Notes on Distributed Systems for Young Bloods": http://bit.ly/2b2mxLf Brendan Gregg's blog: http://www.brendangregg.com/dtrace.html The DTrace guide: http://dtrace.org/guide DTrace book: http://amzn.to/2bqBczw DTrace Toolkit: https://github.com/opendtrace/toolkit DTrace book scripts: https://github.com/brendangregg/DTrace-book-scripts SystemTap (Linux): https://sourceware.org/systemtap/ bcc: https://github.com/iovisor/bcc Resources
Thanks! Colin Jones @trptcolin
[email protected]
![strace++ $ sudo dtrace -qn ' syscall:::entry { @[probefunc, execname]](https://files.speakerdeck.com/presentations/42600bd4197d48198811df29a06d9fb7/slide_7.jpg)
![strace++ $ sudo dtrace -qn 'syscall:::entry { @[probefunc, execname] =](https://files.speakerdeck.com/presentations/42600bd4197d48198811df29a06d9fb7/slide_8.jpg)
![system resources $ sudo dtrace -qn ' vminfo:::maj_fault { @[execname]](https://files.speakerdeck.com/presentations/42600bd4197d48198811df29a06d9fb7/slide_10.jpg)
![system resources $ sudo dtrace -qn 'vminfo:::maj_fault { @[execname] =](https://files.speakerdeck.com/presentations/42600bd4197d48198811df29a06d9fb7/slide_11.jpg)
![statically-defined tracing $ sudo dtrace -qn ' mysql*::: { @[probename]](https://files.speakerdeck.com/presentations/42600bd4197d48198811df29a06d9fb7/slide_13.jpg)
![$ sudo dtrace -qn 'mysql*::: { @[probename] = count(); }](https://files.speakerdeck.com/presentations/42600bd4197d48198811df29a06d9fb7/slide_14.jpg)
![CPU? $ sudo dtrace -qn ' profile-997 { @[execname] =](https://files.speakerdeck.com/presentations/42600bd4197d48198811df29a06d9fb7/slide_29.jpg)
![CPU? $ sudo dtrace -qn 'profile-997 { @[execname] = count();](https://files.speakerdeck.com/presentations/42600bd4197d48198811df29a06d9fb7/slide_30.jpg)
![CPU? $ sudo dtrace -qn ' profile-997 /execname=="kernel_task"/ { @[stack()]](https://files.speakerdeck.com/presentations/42600bd4197d48198811df29a06d9fb7/slide_31.jpg)
![CPU? $ sudo dtrace -qn 'profile-997 /execname=="kernel_task"/ { @[stack()] =](https://files.speakerdeck.com/presentations/42600bd4197d48198811df29a06d9fb7/slide_32.jpg)
![CPU $ sudo dtrace -qn 'profile-997 { @[execname] = count();](https://files.speakerdeck.com/presentations/42600bd4197d48198811df29a06d9fb7/slide_33.jpg)
![Thanks! Colin Jones @trptcolin [email protected]](https://files.speakerdeck.com/presentations/42600bd4197d48198811df29a06d9fb7/slide_50.jpg)