Upgrade to Pro — share decks privately, control downloads, hide ads and more …

Logging, Metrics, and APM: The Holy Trinity of ...

Logging, Metrics, and APM: The Holy Trinity of Operations

The Elastic Stack is used for operational analytics in many environments today. However, we see many users taking advantage of only a limited set of data sources in their Elastic deployments.

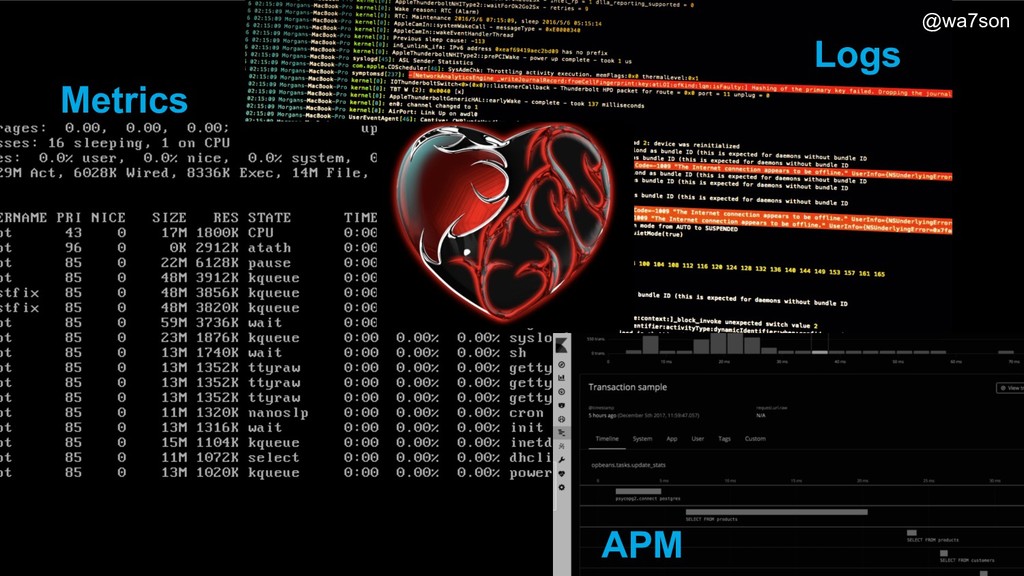
We’ll explore how the Elastic Stack can be used for a comprehensive operational analytics deployment, including infrastructure and application logging and metrics, as well as deep APM transaction analysis.

Thomas Watson

March 18, 2019
Tweet

More Decks by Thomas Watson

Other Decks in Programming

Transcript

  1. Who am I? • Thomas Watson • Open Source developer

    at github.com/watson • Principal Software Engineer at Elastic • Node.js Core Member • Tweets as @wa7son @wa7son
  2. Logs 64.242.88.10 - - [07/Mar/2017:16:10:02 -0800] "GET /mailman/listinfo/hsdivision HTTP/1.1" 200

    6291 64.242.88.10 - - [07/Mar/2017:16:11:58 -0800] "POST /twiki/bin/view/TWiki/WikiSyntax HTTP/1.1" 404 7352 64.242.88.10 - - [07/Mar/2017:16:20:55 -0800] "GET /twiki/bin/view/Main/DCCAndPostFix HTTP/1.1" 200 5253 For each event, print out what happened. Logs are chronological records of events @wa7son
  3. Making logging more turnkey with ‘modules’ • Turnkey experience for

    specific data types • Data to dashboard in just one step • Automated parsing and enrichment • Default dashboards, alerts, ML jobs @wa7son
  4. Logging modules System • Linux / MacOS • Windows Events

    Containers • Docker • Kubernetes Databases • MySQL • PostgreSQL Queues • Kafka • Redis Web servers • Apache • Nginx Audit data • Filesystem • System calls WINLOGBEAT FILEBEAT AUDITBEAT Infrastructure Applications @wa7son
  5. Metrics vs Logs 64.242.88.10 - - [07/Mar/2017:16:10:02 -0800] "GET /mailman/listinfo/hsdivision

    HTTP/1.1" 200 6291 64.242.88.10 - - [07/Mar/2017:16:11:58 -0800] "POST /twiki/bin/view/TWiki/WikiSyntax HTTP/1.1" 404 7352 64.242.88.10 - - [07/Mar/2017:16:20:55 -0800] "GET /twiki/bin/view/Main/DCCAndPostFix HTTP/1.1" 200 5253 For each event, print out what happened. Logs are chronological records of events 07/Mar/2017 16:10:00 all 2.58 0.00 0.70 1.12 0.05 95.55 server1 containerX regionA
 07/Mar/2017 16:20:00 all 2.56 0.00 0.69 1.05 0.04 95.66 server2 containerY regionB
 07/Mar/2017 16:30:00 all 2.64 0.00 0.65 1.15 0.05 95.50 server2 containerZ regionC
 
 Every x minutes, measure the CPU load and print it out, and annotate with meta-data.
 Metrics are periodic measurements of numeric KPIs @wa7son
  6. Elasticsearch beginnings Primarily used for application search Search engine Inverted

    index primary data structure, and is great for search 2010 @wa7son
  7. Elasticsearch beginnings Primarily used for application search Search engine Inverted

    index primary data structure, and is great for search 2010 @wa7son
  8. 2012 Columnar storage Structured data storage, resulting in compact storage

    and faster analytics Elasticsearch evolves to support analytics https://www.elastic.co/blog/elasticsearch-as-a-column-store Columnar Store, Built on Lucene "doc values" Search engine Inverted index primary data structure, and is great for search 2010 @wa7son
  9. 2014 Aggregation Framework Analytics features to slice and dice data

    along various dimensions Aggregation Framework Out-of-this-world aggregations https://www.elastic.co/blog/out-of-this-world-aggregations Search engine Inverted index primary data structure, and is great for search 2010 2012 Columnar storage Structured data storage, resulting in compact storage and faster analytics @wa7son
  10. BKD trees and sparse fields Data structures optimized for numbers.

    Faster analytics, lower storage footprint 2016 2014 Aggregation Framework Analytics features to slice and dice data along various dimensions Elasticsearch storage efficiencies BKD Trees & Sparse Fields https://www.elastic.co/blog/searching-numb3rs-in-5.0 1-Dimension 2-Dimensions Sparse Data Search engine Inverted index primary data structure, and is great for search 2010 2012 Columnar storage Structured data storage, resulting in compact storage and faster analytics @wa7son
  11. Rollups Roll up or aggregate older data into bigger time

    buckets and save on disk space 2018 Rollup support for long-term retention Added in Elasticsearch 6.3 https://www.elastic.co/blog/data-rollups-in-elasticsearch-you-know-for-saving-space Search engine Inverted index primary data structure, and is great for search 2010 BKD trees and sparse fields Data structures optimized for numbers. Faster analytics, lower storage footprint 2016 2014 Aggregation Framework Analytics features to slice and dice data along various dimensions 2012 Columnar storage Structured data storage, resulting in compact storage and faster analytics @wa7son
  12. Metrics modules System • Linux • MacOS • Windows •

    Perfmon Infrastructure Cloud • AWS • GCP • Azure • DigitalOcean • Alibaba Containers • Docker • Kubernetes Virtualization • vSphere PACKETBEAT METRICBEAT Network • Netflow • Packets • TLS Envelope Storage • Ceph HEARTBEAT @wa7son
  13. Applications Datastores • MySQL • PostgreSQL • MongoDB • Couchbase

    • Aerospike • Graphite Web servers • Apache • Nginx Other • HAProxy • Zookeeper Queues • Kafka • Redis • RabbitMQ Caches • Memcached Uptime • Heartbeat Custom apps • JMX/Jolokia • PHP-FPM • Golang Metrics modules PACKETBEAT METRICBEAT HEARTBEAT @wa7son
  14. • Correlate data from different sources • Ability to re-use

    analysis content • Ability to re-use Elastic-provided content Correlation between logs, metrics, and APM Benefits • v1.0.0 published: github.com/elastic/ecs • Integrating into Elastic products in progress • Community feedback welcome! Status Elastic Common Schema @wa7son
  15. How does APM work? Data processor apm-server Data storage elasticsearch

    Browser Agent Web server Agent Web server Agent Web server Agent UI kibana Browser Agent Browser Agent @wa7son
  16. • Focuses on search experience on top of APM data

    • ‘Just another index’ in Elastic Stack Elastic APM APM adds end-user experience and application-level monitoring to the stack Language support • Python
 • Node.js
 • Ruby
 • RUM 
 • Java • Go • .NET (in dev) @wa7son
  17. APM is another index in Elasticsearch Need another visualization? Build

    a dashboard, no need to wait for your vendor @wa7son
  18. Distributed tracing example Distributed Tracing Trace A Transaction 1 Span

    Span Span Transaction 2 Span Transaction 3 Span Span @wa7son
  19. Distributed Tracing Trace and map across multiple services
 • See

    the end-to-end view and navigate to individual transactions • Based on the notion of a end-to- end Trace ID across services • Investigating compatibility with OpenTracing API and aligning with W3C trace context spec @wa7son