Too trivial to test? An inverse view on defect prediction to identify methods with low fault risk
Presentation of the corresponding paper published in PeerJ Computer Science at the German-speaking Software Engineering Conference in Innsbruck, Austria.
live-blog and tweet this presentation given that you attribute it to its author and respect the rights and licences of its parts. based on slides by @SMEasterbrook und @ethanwhite
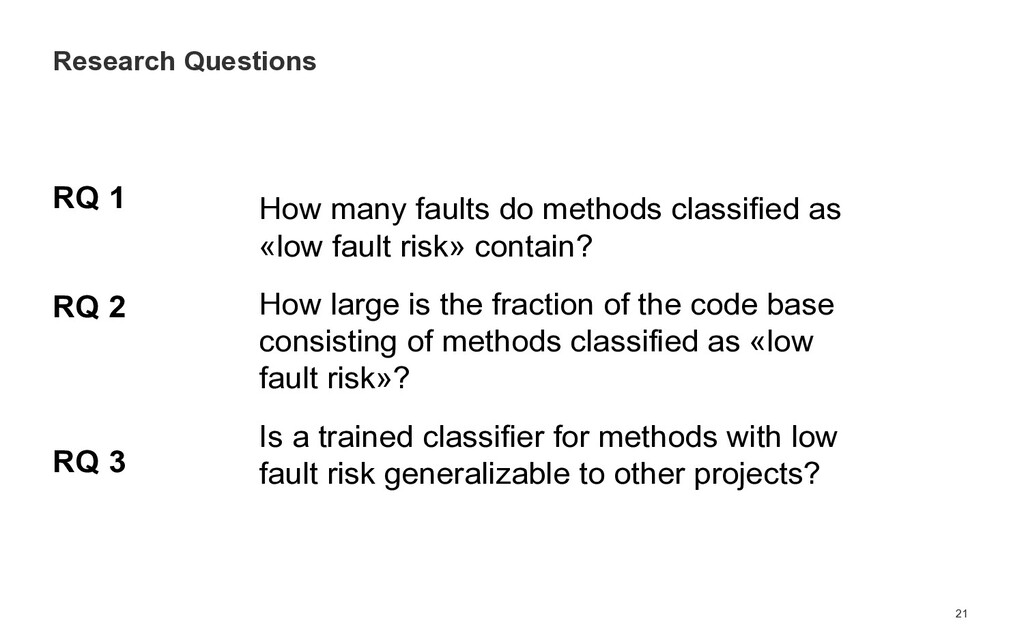
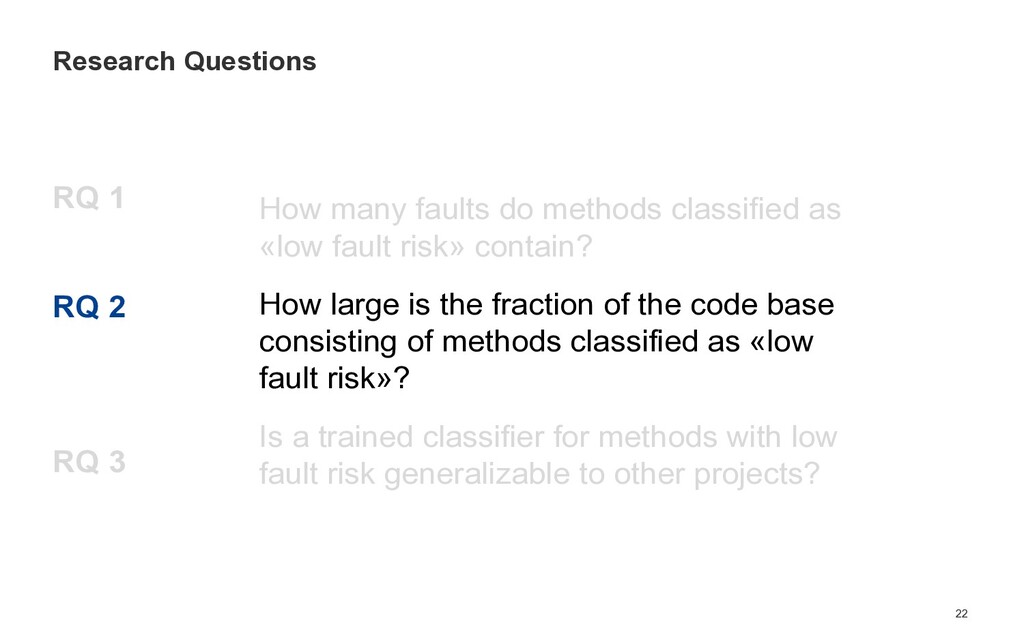
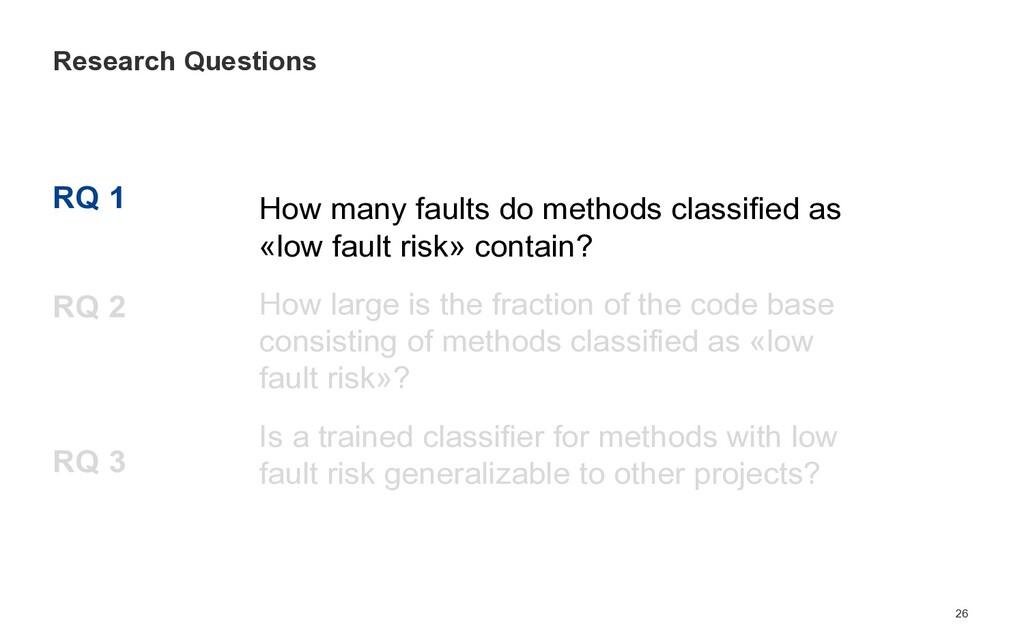
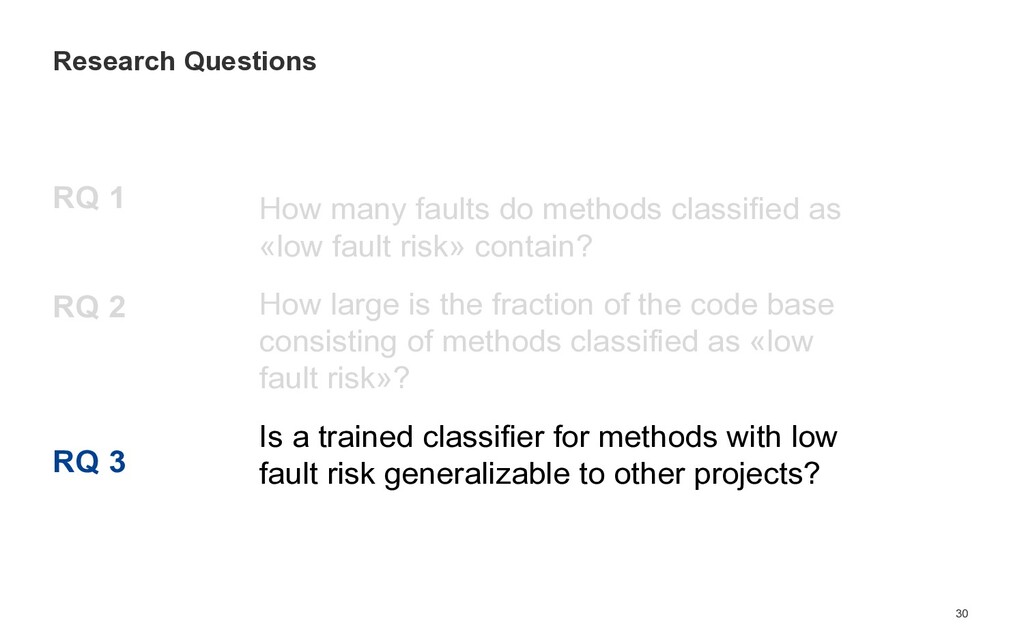
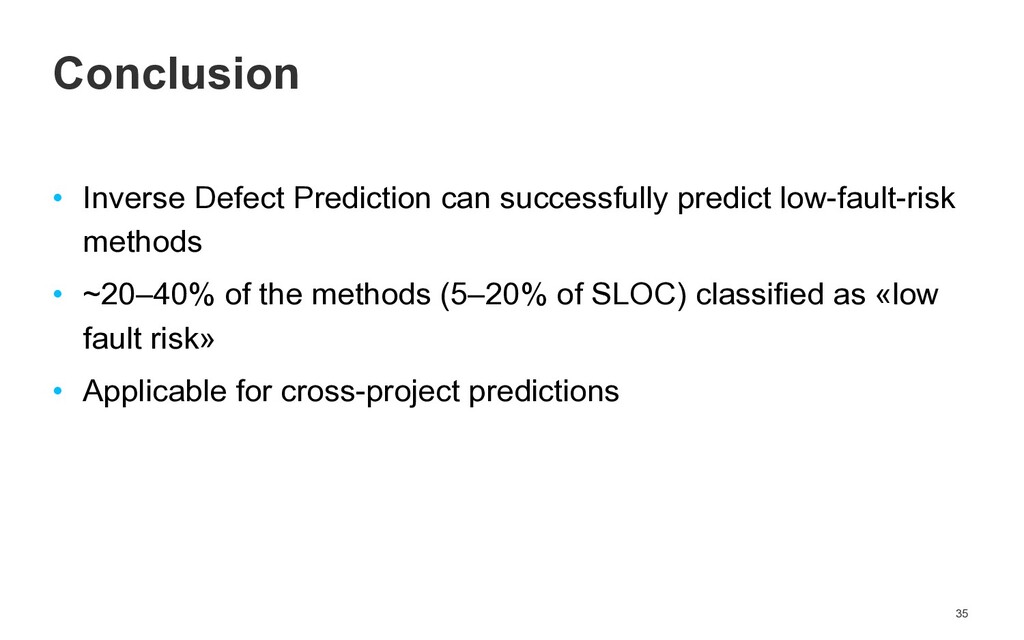
many faults do methods classified as «low fault risk» contain? How large is the fraction of the code base consisting of methods classified as «low fault risk»? Is a trained classifier for methods with low fault risk generalizable to other projects?
many faults do methods classified as «low fault risk» contain? How large is the fraction of the code base consisting of methods classified as «low fault risk»? Is a trained classifier for methods with low fault risk generalizable to other projects?
many faults do methods classified as «low fault risk» contain? How large is the fraction of the code base consisting of methods classified as «low fault risk»? Is a trained classifier for methods with low fault risk generalizable to other projects?
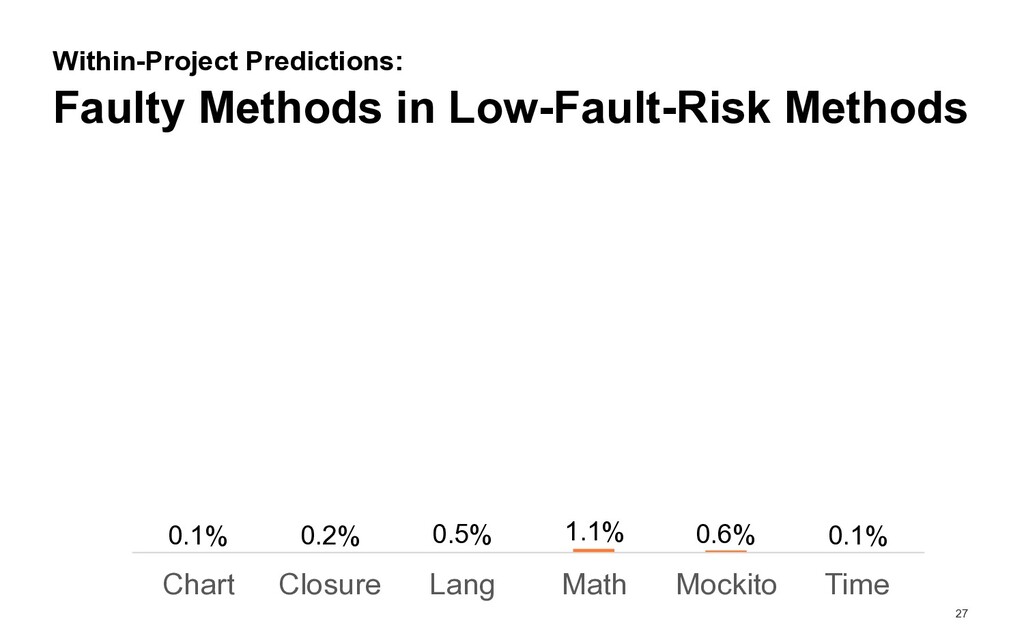
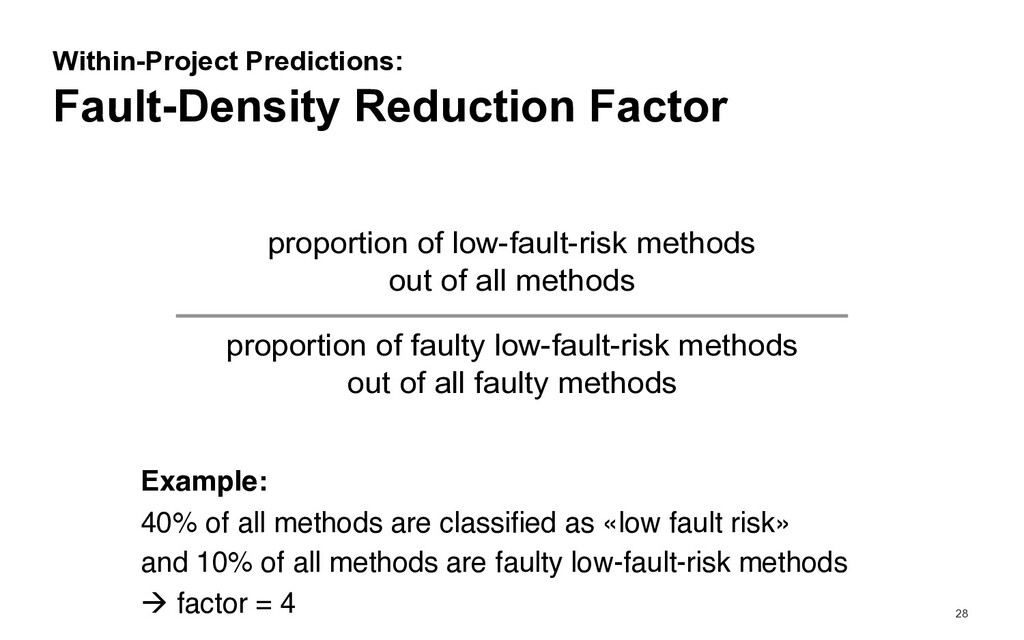
out of all methods proportion of faulty low-fault-risk methods out of all faulty methods Example: 40% of all methods are classified as «low fault risk» and 10% of all methods are faulty low-fault-risk methods ! factor = 4
many faults do methods classified as «low fault risk» contain? How large is the fraction of the code base consisting of methods classified as «low fault risk»? Is a trained classifier for methods with low fault risk generalizable to other projects?
685-88455 WWW www.iste.uni-stuttgart.de/se Twitter prof_wagnerst ORCID 0000-0002-5256-8429 Institute of Software Technology Slides are available at www.stefan-wagner.biz. Joint work with Rainer Niedermayr and Tobias Röhm
![Prof. Dr. Stefan Wagner e-mail [email protected] phone +49 (0) 711](https://files.speakerdeck.com/presentations/5f8039b986f8426bb1c3fa3e47a608f2/slide_36.jpg)