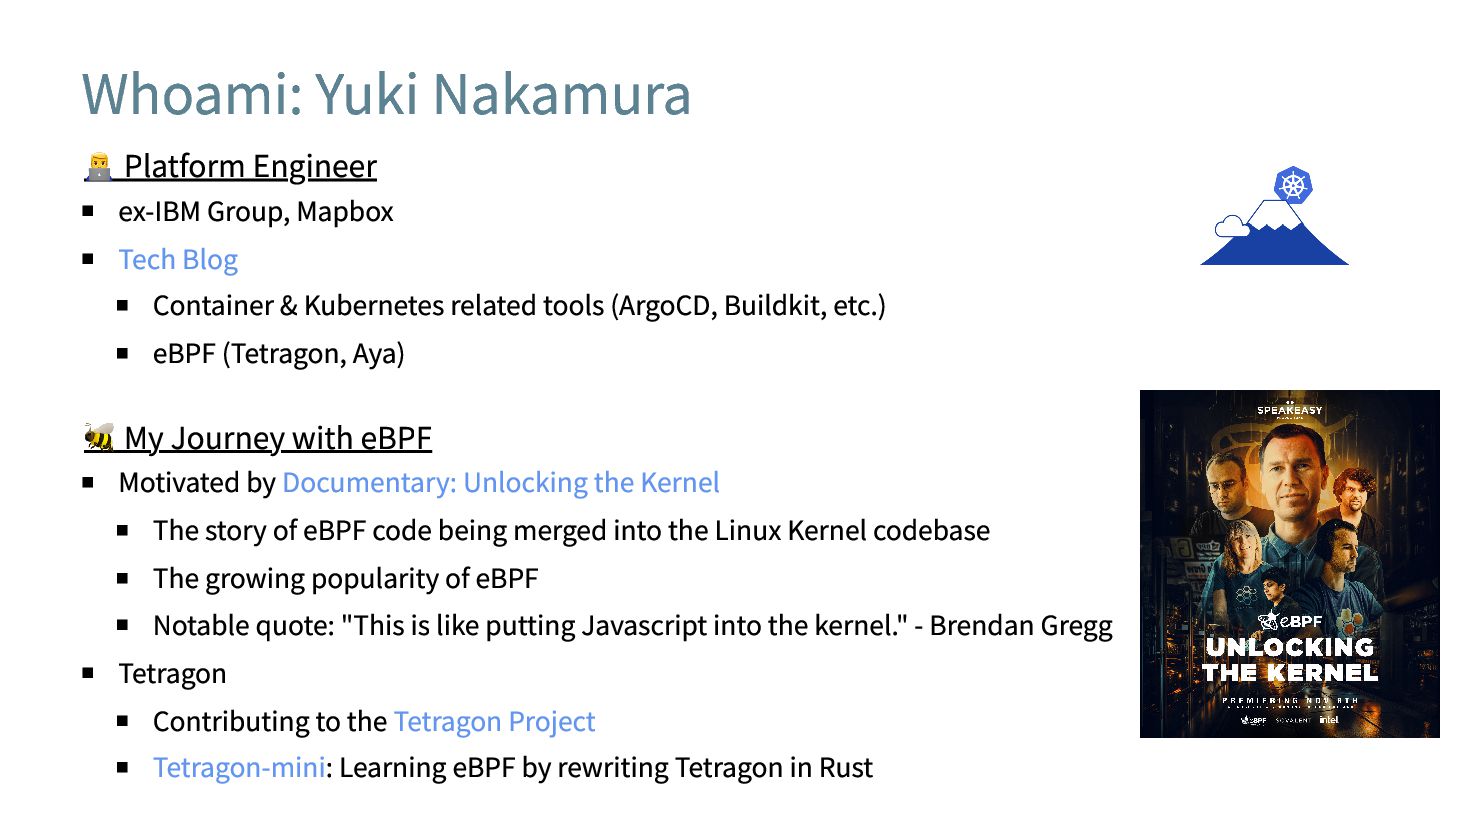
Blog Container & Kubernetes related tools (ArgoCD, Buildkit, etc.) eBPF (Tetragon, Aya) 🐝 My Journey with eBPF Motivated by Documentary: Unlocking the Kernel The story of eBPF code being merged into the Linux Kernel codebase The growing popularity of eBPF Notable quote: "This is like putting Javascript into the kernel." - Brendan Gregg Tetragon Contributing to the Tetragon Project Tetragon-mini: Learning eBPF by rewriting Tetragon in Rust
is Tetragon designed to do? How is Process Lifecycle Monitoring implemented? What kernel event hooks are being used? What code is written on the eBPF side and user space side?
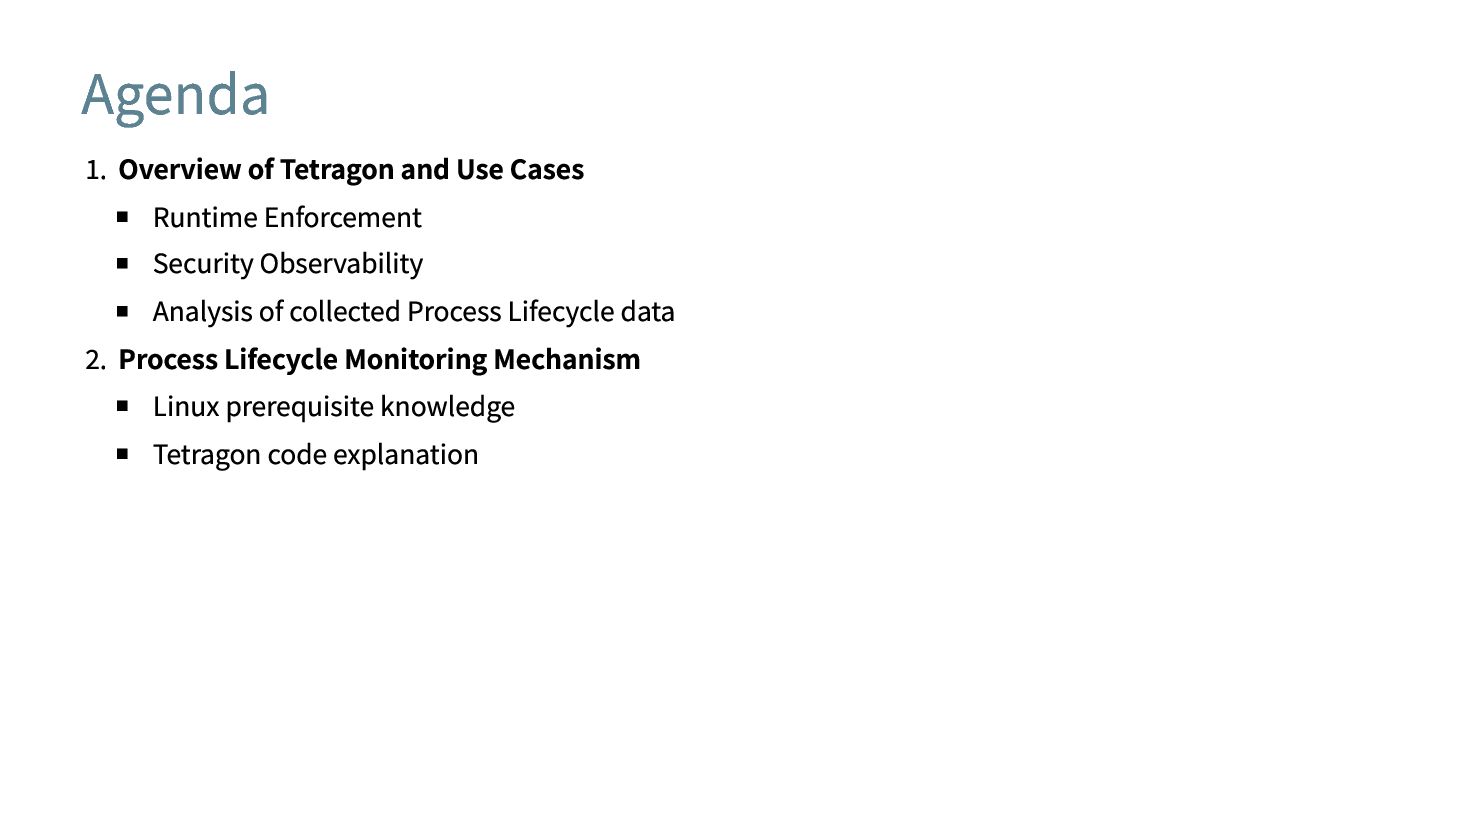
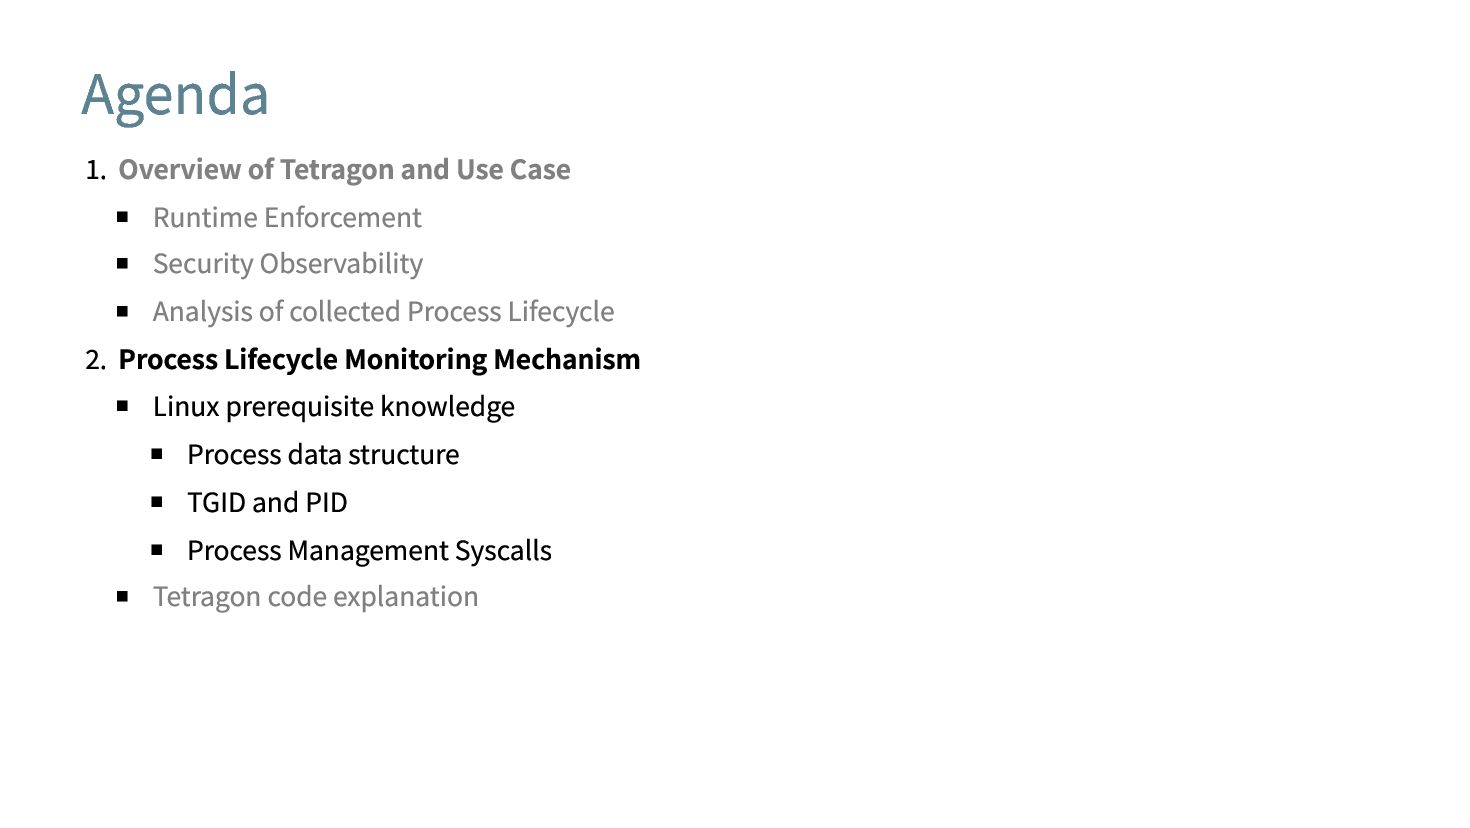
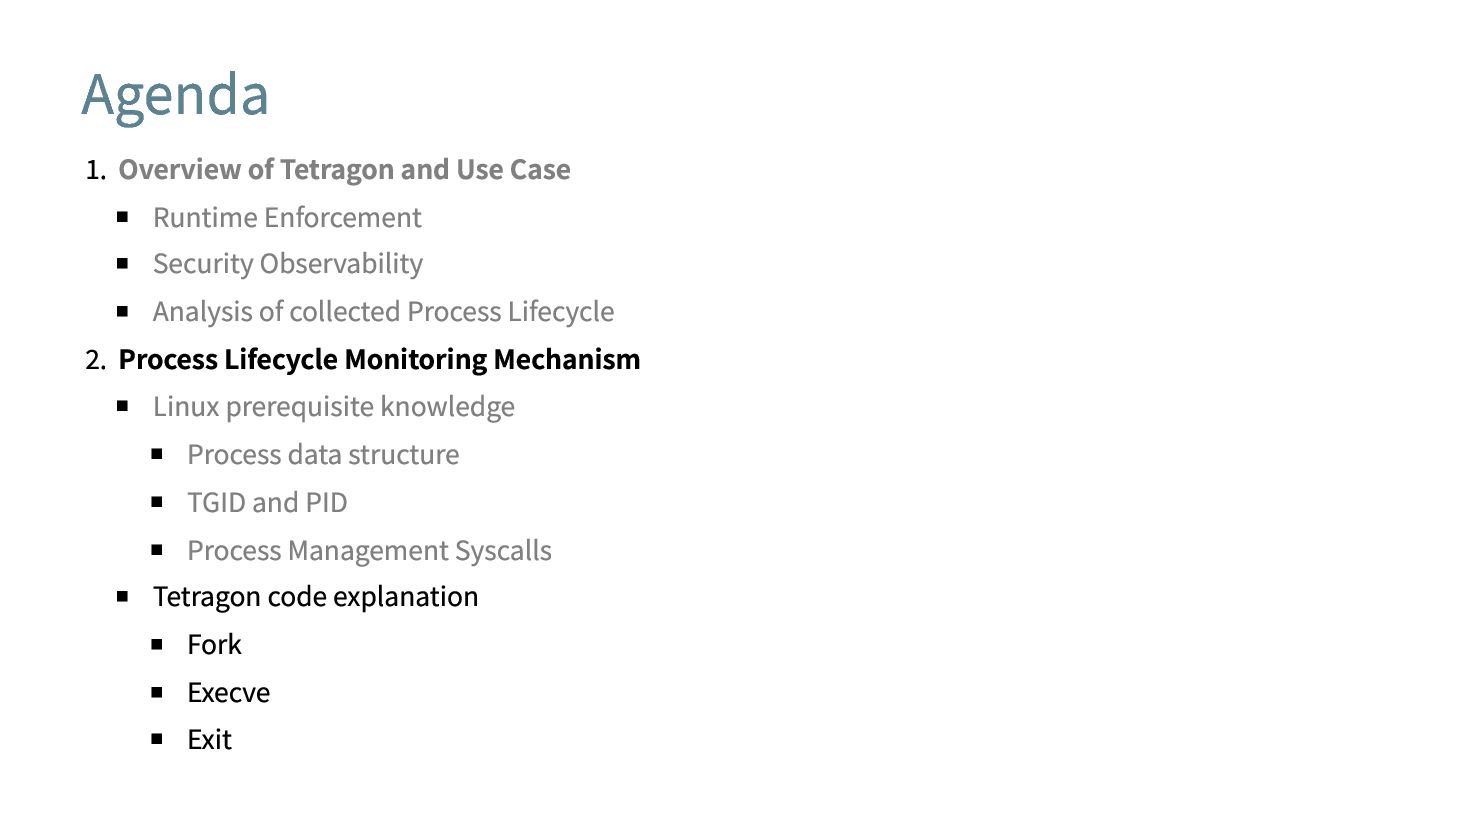
Security Observability Analysis of collected Process Lifecycle data 2. Process Lifecycle Monitoring Mechanism Linux prerequisite knowledge Tetragon code explanation
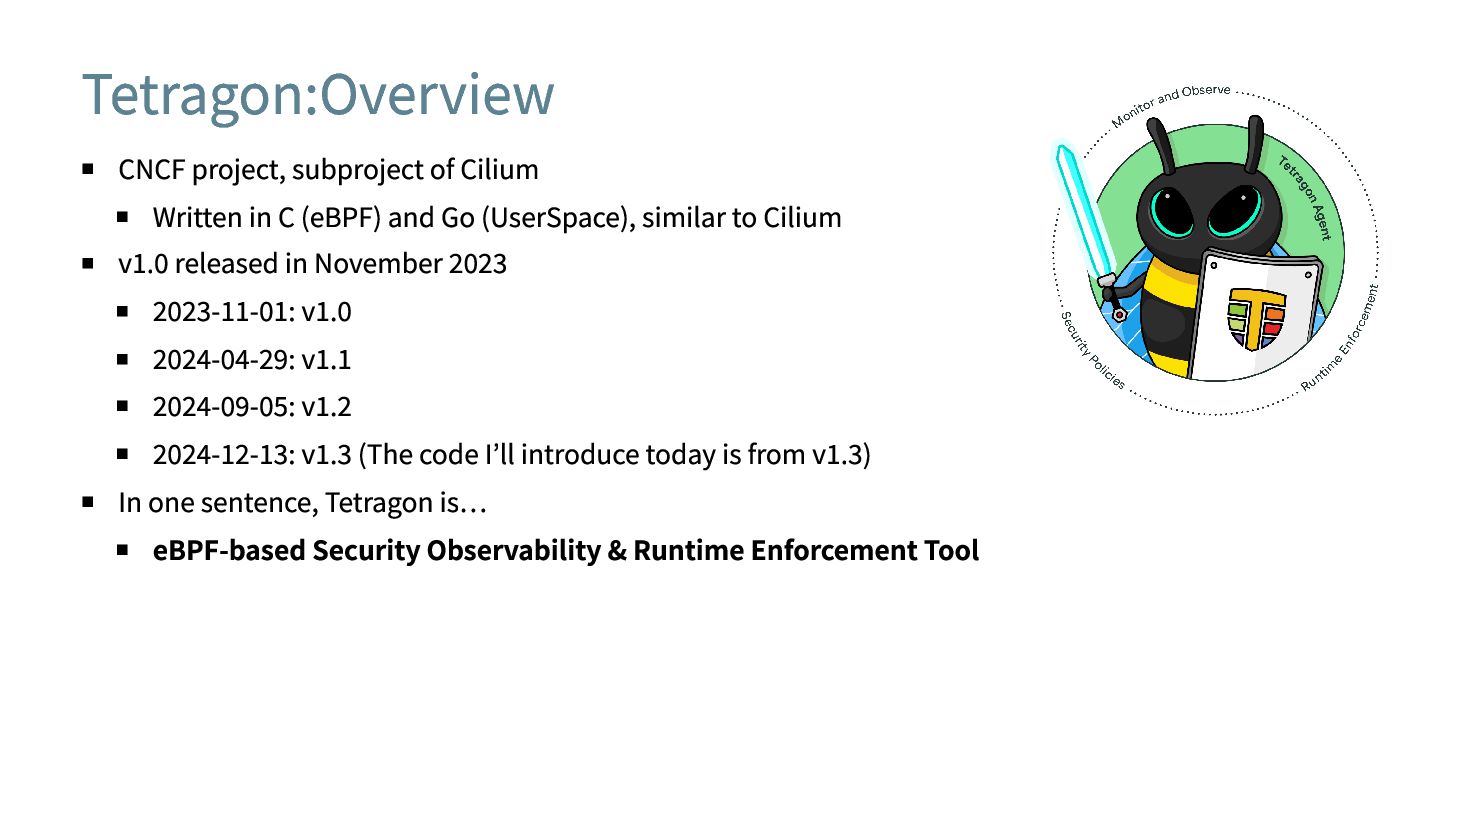
and Go (UserSpace), similar to Cilium v1.0 released in November 2023 2023-11-01: v1.0 2024-04-29: v1.1 2024-09-05: v1.2 2024-12-13: v1.3 (The code I’ll introduce today is from v1.3) In one sentence, Tetragon is… eBPF-based Security Observability & Runtime Enforcement Tool
certain rules within kernel space Tracing Policy (rules): Defines kernel events to trace and actions to take when conditions are met Example 1: Kill all sys_write calls attempting to write to /etc/passwd, except those with PID 0 or 1 Example 2: Prohibit execution of specific binary files Using eBPF allows processing to be completed without transferring events to user space. This approach enables low-latency and reliable security policy enforcement. Kernel Event eBPF Map Syscall Event eBPF Program eBPF Program eBPF Program Kill / Override eBPF Program Set up eBPF Programs/Maps Tetragon Agent Tetra CLI Tracing Policy Process eBPF Map eBPF Map
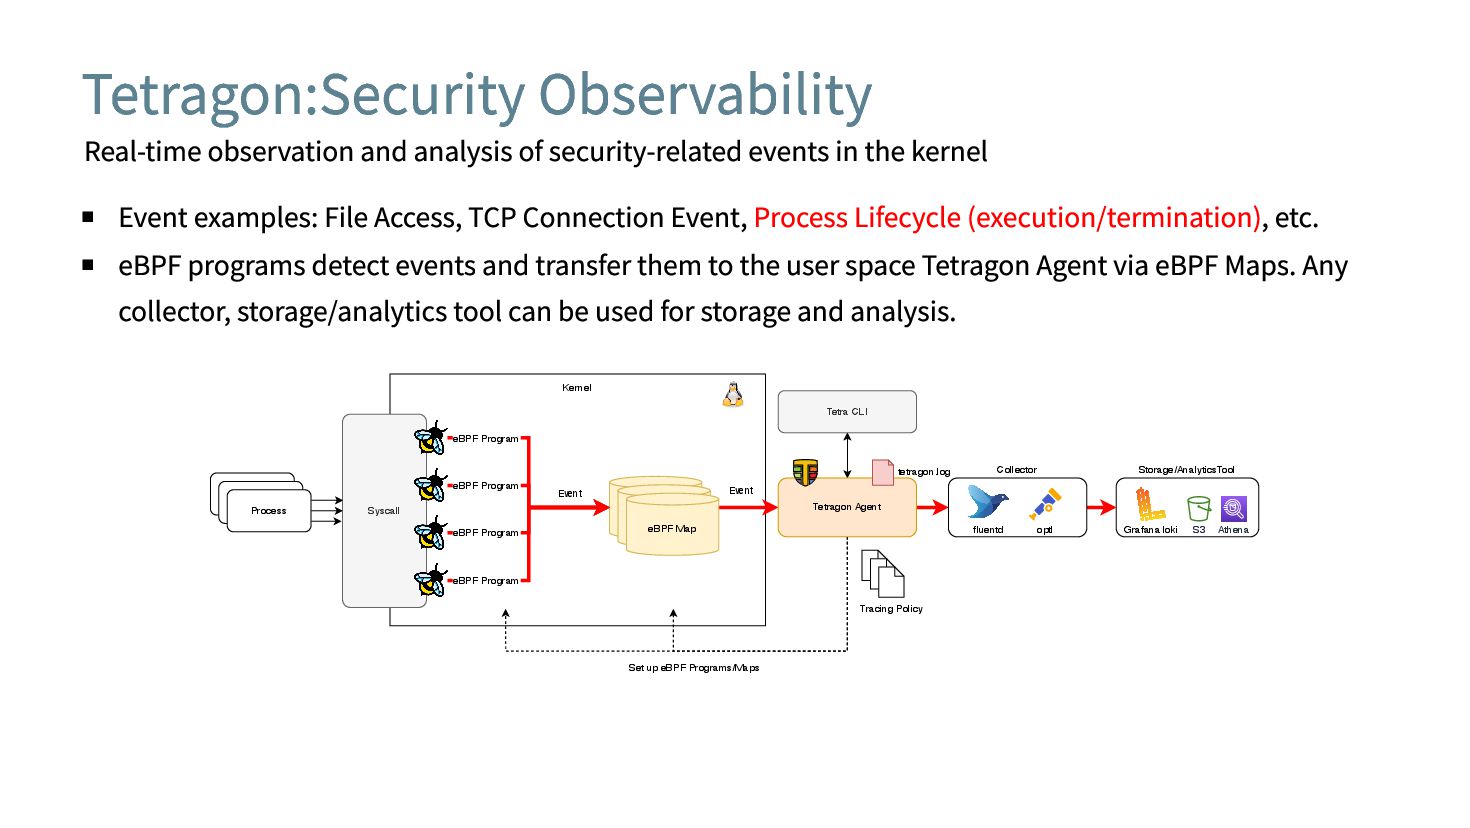
the kernel Event examples: File Access, TCP Connection Event, Process Lifecycle (execution/termination), etc. eBPF programs detect events and transfer them to the user space Tetragon Agent via eBPF Maps. Any collector, storage/analytics tool can be used for storage and analysis. Storage/AnalyticsTool Kernel Event eBPF Map Syscall Event eBPF Program eBPF Program eBPF Program eBPF Program Set up eBPF Programs/Maps Tetragon Agent Tetra CLI Tracing Policy Process eBPF Map eBPF Map Grafana loki S3 Collector fluentd optl Athena tetragon.log
Security Observability Analysis of collected Process Lifecycle 2. Process Lifecycle Monitoring Mechanism Linux prerequisite knowledge Process data structure TGID and PID Process Management Syscalls Tetragon code explanation
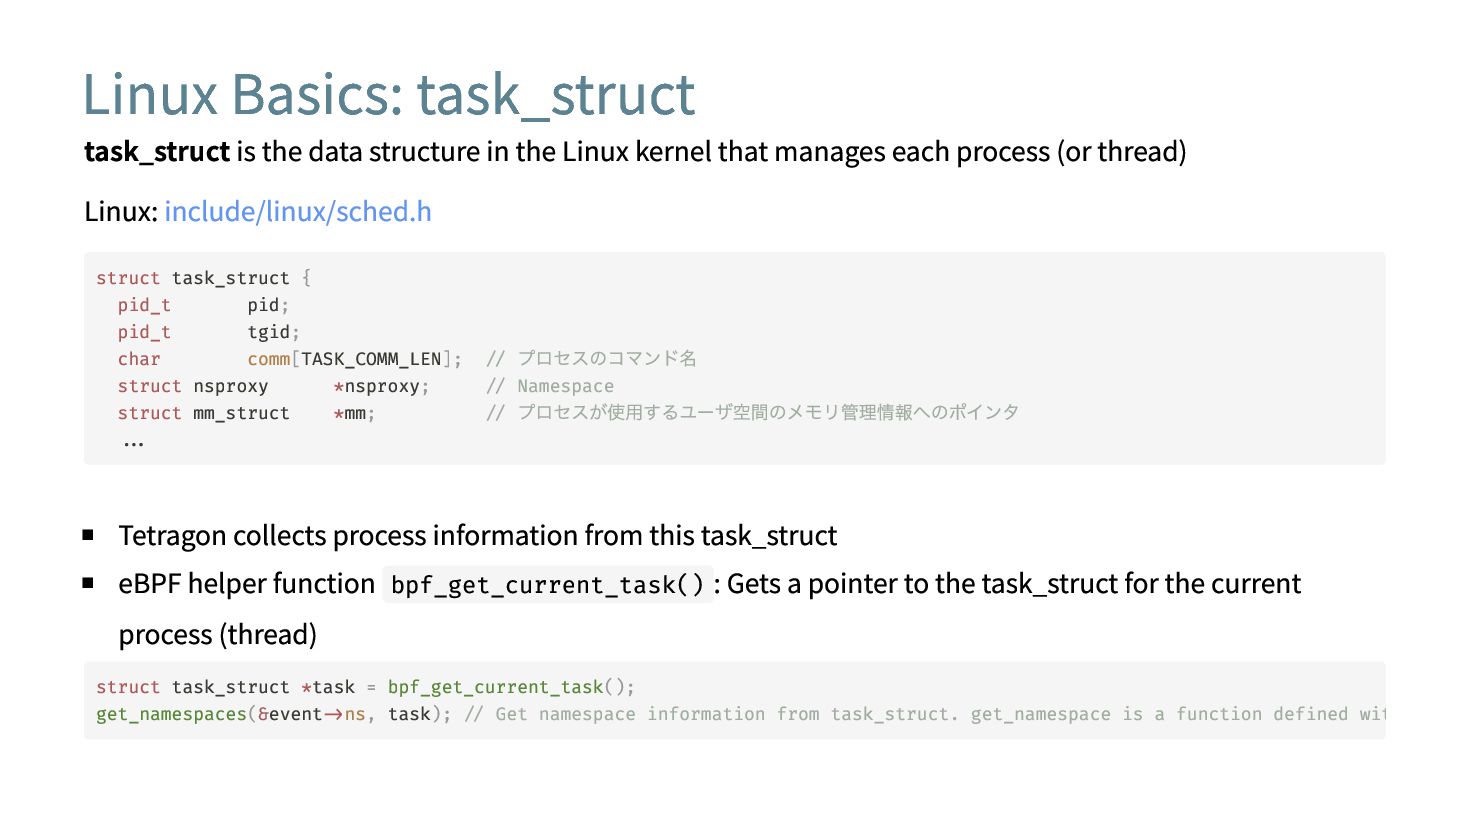
Linux kernel that manages each process (or thread) Linux: include/linux/sched.h Tetragon collects process information from this task_struct eBPF helper function bpf_get_current_task() : Gets a pointer to the task_struct for the current process (thread) struct task_struct { pid_t pid; pid_t tgid; char comm[TASK_COMM_LEN]; // プロセスのコマンド名 struct nsproxy *nsproxy; // Namespace struct mm_struct *mm; // プロセスが使用するユーザ空間のメモリ管理情報へのポインタ ... struct task_struct *task = bpf_get_current_task(); get_namespaces(&event->ns, task); // Get namespace information from task_struct. get_namespace is a function defined wit
is the thread identifier. Multi Thread task_struct tgid 200 pid 200 comm binary_2 task_struct tgid 200 pid 201 comm binary_2 task_struct tgid 200 pid 202 comm binary_2 Single Thread task_struct tgid 100 pid 100 comm binary_1 ⚠️PID is not a process identifier⚠️ Tetragon monitors events at the process level. Creation/deletion of threads (multithreading) within a process is ignored. eBPF helper function bpf_get_current_pid_tgid() : Gets pid and tgid u64 pid_tgid = bpf_get_current_pid_tgid(); u32 tgid = pid_tgid >> 32; // Get TGID from upper 32 bits u32 pid = pid_tgid & 0xFFFFFFFF; // Get PID from lower 32 bits
through the following steps: 1. The parent process creates a child process by calling fork() , clone() , or similar syscalls. 2. The child process executes a program by calling execve() or similar syscalls. 3. When execution is complete, the child process terminates by calling exit() or similar syscalls. Parent Child fork() execve() exit() wait()
Security Observability Analysis of collected Process Lifecycle 2. Process Lifecycle Monitoring Mechanism Linux prerequisite knowledge Process data structure TGID and PID Process Management Syscalls Tetragon code explanation Fork Execve Exit
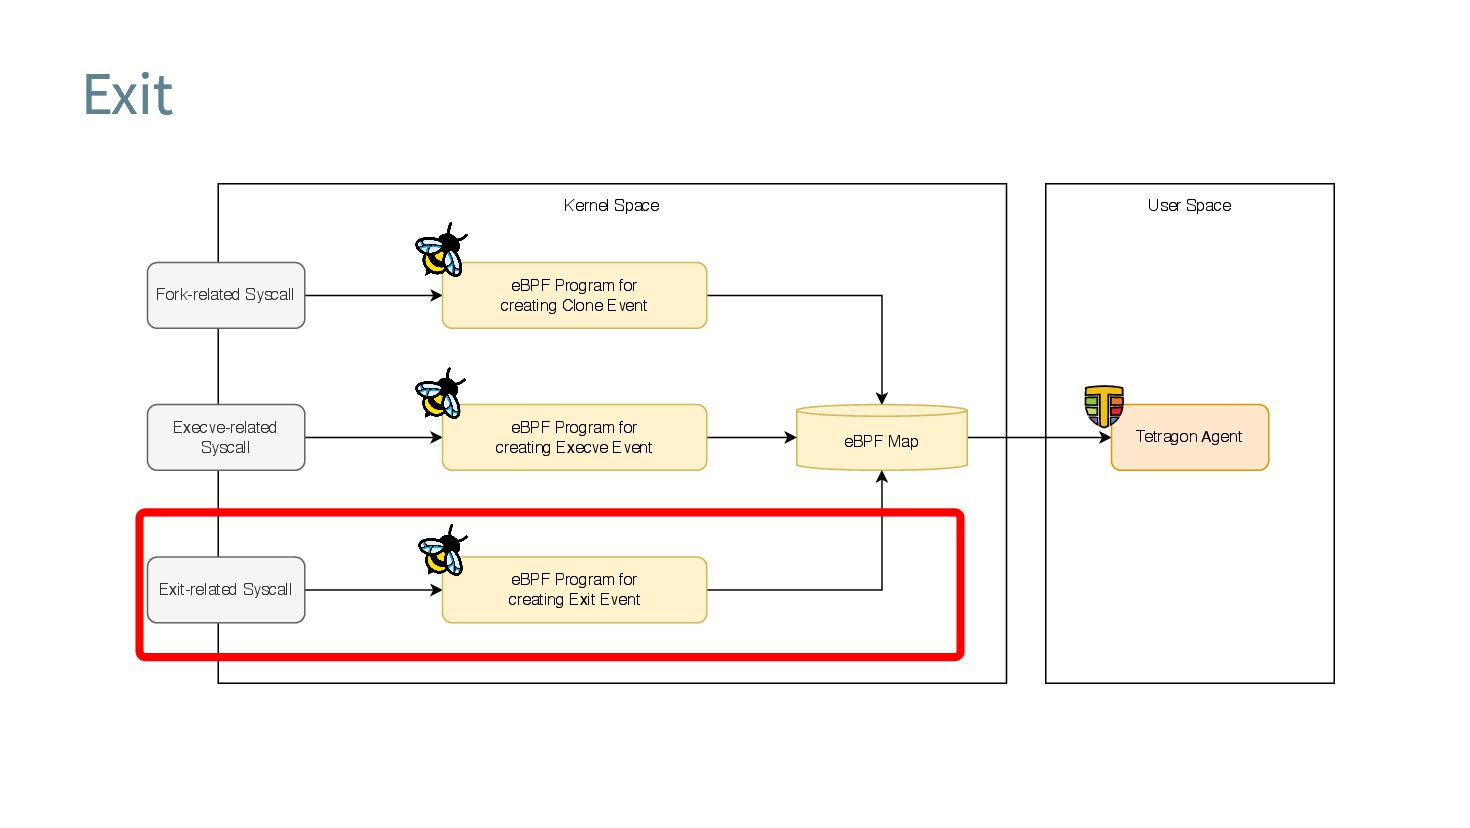
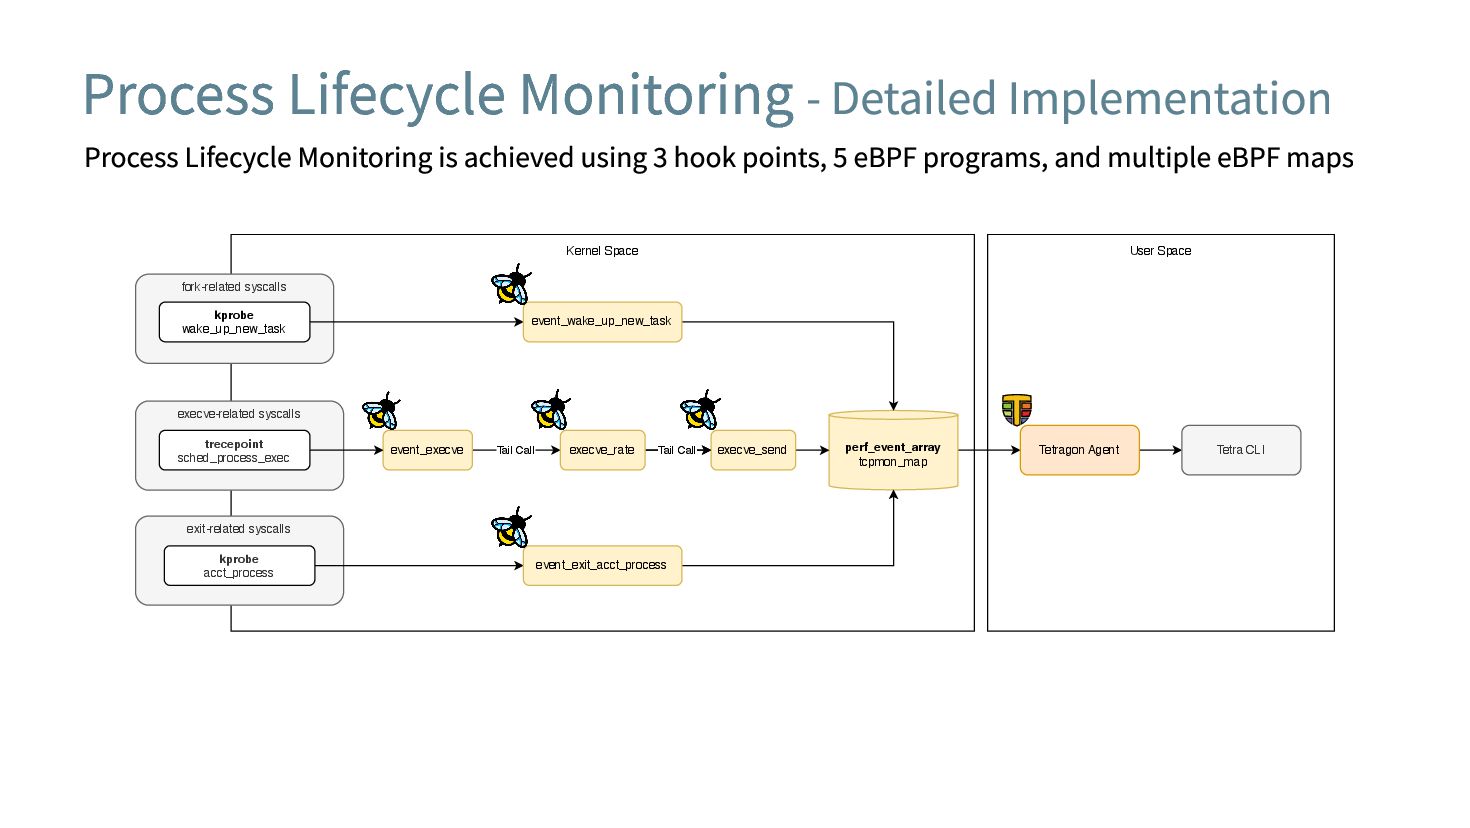
create Process Lifecycle Events to hooks of each Process Management Syscall. The eBPF programs transfer the created events to user space via eBPF Maps. User Space Kernel Space Exit-related Syscall eBPF Map Fork-related Syscall eBPF Program for creating Clone Event Execve-related Syscall eBPF Program for creating Exit Event eBPF Program for creating Execve Event Tetragon Agent
section name: kprobe/wake_up_new_task is attached to the kprobe of wake_up_new_task Tetragon UserSpace: base.go User Space Kernel Space Tetragon Agent fork-related syscalls event_wake_up_new_task kprobe wake_up_new_task perf_event_array tcpmon_map 47 Fork = program.Builder( 48 "bpf_fork.o", // the name of the BPF object file 49 "wake_up_new_task", // the hook point 50 "kprobe/wake_up_new_task", // the program section name 51 "kprobe_pid_clear", // the name of pin 52 "kprobe", // the type of BPF program 53 ).SetPolicy(basePolicy)
kernel_clone(), which is the main routine of fork Linux: kernel/fork.c -> kernel_clone() pid_t kernel_clone(struct kernel_clone_args *args) { struct task_struct *p; wake_up_new_task(p); ...
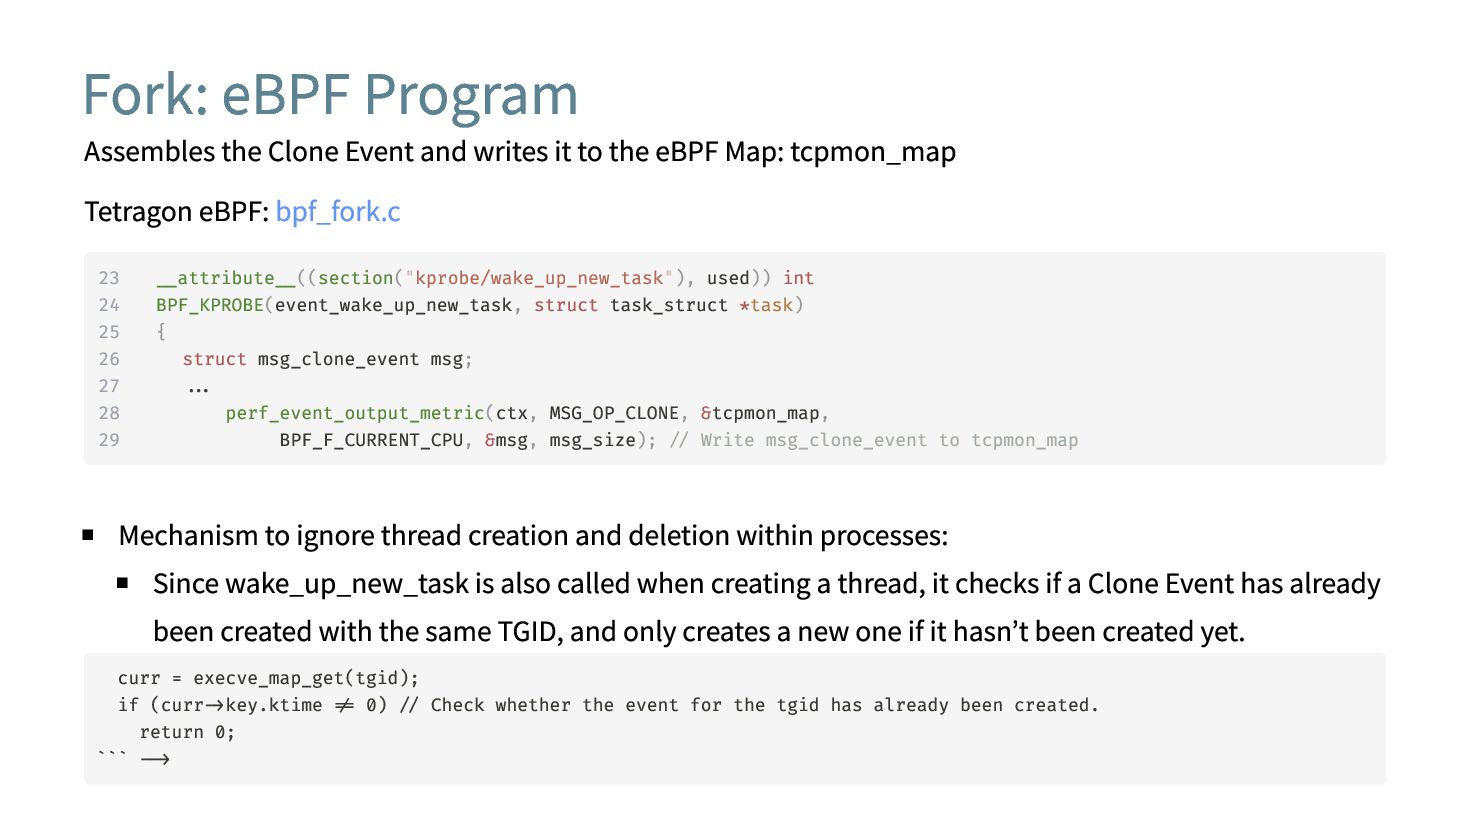
to the eBPF Map: tcpmon_map Tetragon eBPF: bpf_fork.c Mechanism to ignore thread creation and deletion within processes: Since wake_up_new_task is also called when creating a thread, it checks if a Clone Event has already been created with the same TGID, and only creates a new one if it hasn’t been created yet. curr = execve_map_get(tgid); if (curr->key.ktime != 0) // Check whether the event for the tgid has already been created. return 0; ``` --> 23 __attribute__((section("kprobe/wake_up_new_task"), used)) int 24 BPF_KPROBE(event_wake_up_new_task, struct task_struct *task) 25 { 26 struct msg_clone_event msg; 27 ... 28 perf_event_output_metric(ctx, MSG_OP_CLONE, &tcpmon_map, 29 BPF_F_CURRENT_CPU, &msg, msg_size); // Write msg_clone_event to tcpmon_map
Syscall eBPF Program for creating Clone Event Execve-related Syscall eBPF Program for creating Exit Event eBPF Program for creating Execve Event Tetragon Agent
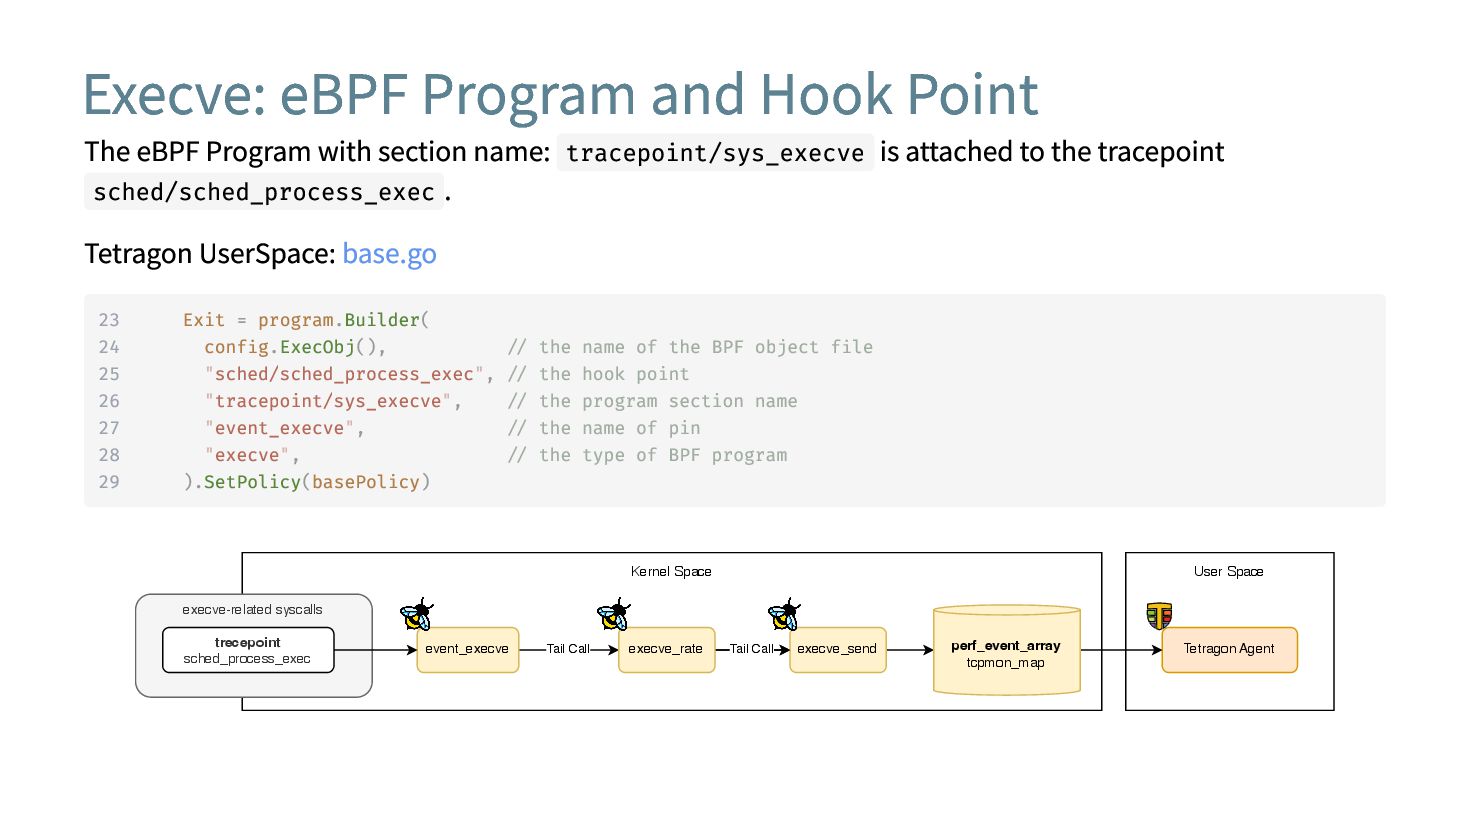
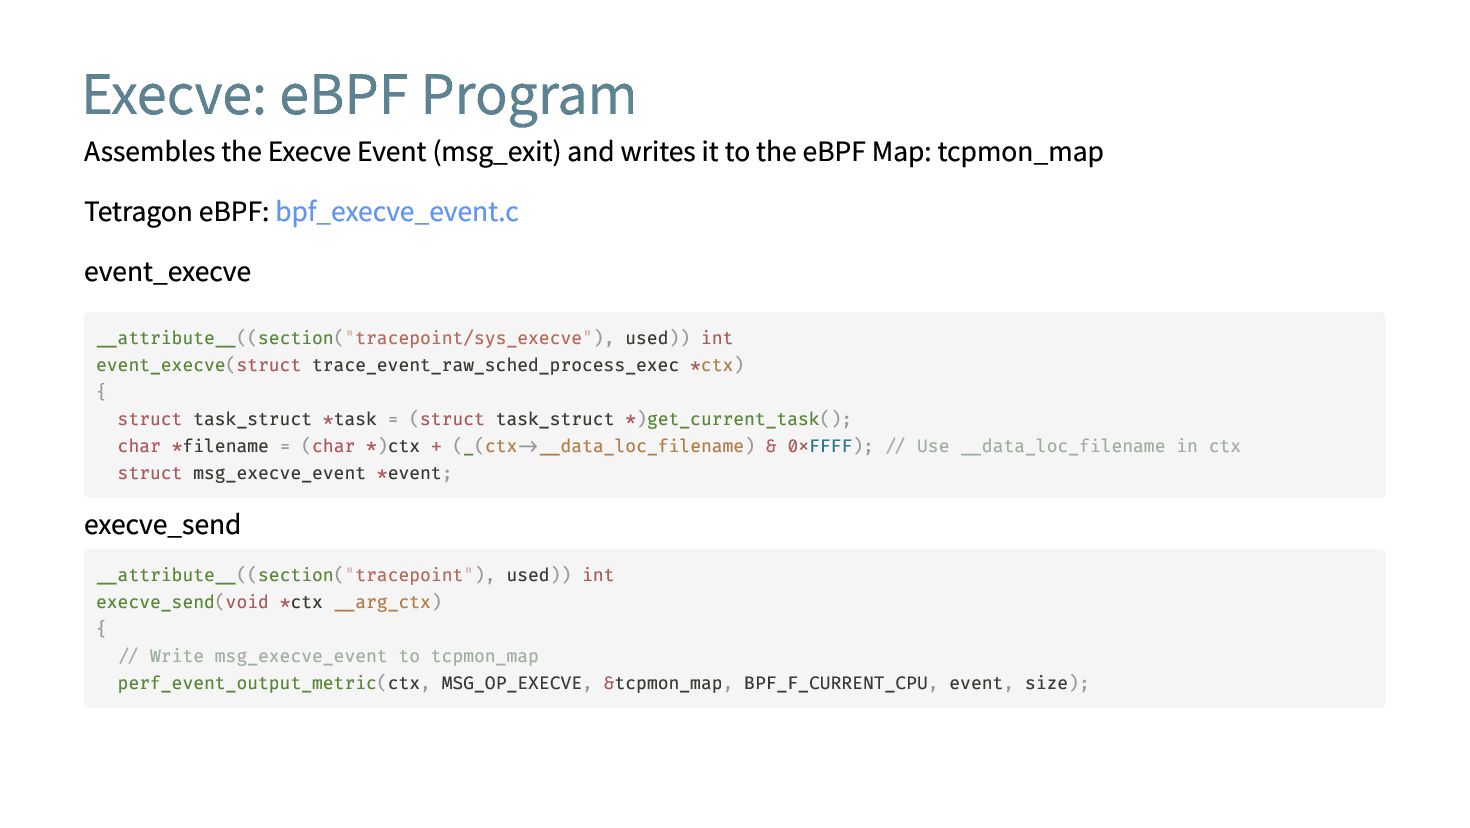
section name: tracepoint/sys_execve is attached to the tracepoint sched/sched_process_exec . Tetragon UserSpace: base.go Kernel Space Tail Call event_execve execve_send Tail Call execve_rate execve-related syscalls trecepoint sched_process_exec User Space Tetragon Agent perf_event_array tcpmon_map 23 Exit = program.Builder( 24 config.ExecObj(), // the name of the BPF object file 25 "sched/sched_process_exec", // the hook point 26 "tracepoint/sys_execve", // the program section name 27 "event_execve", // the name of pin 28 "execve", // the type of BPF program 29 ).SetPolicy(basePolicy)
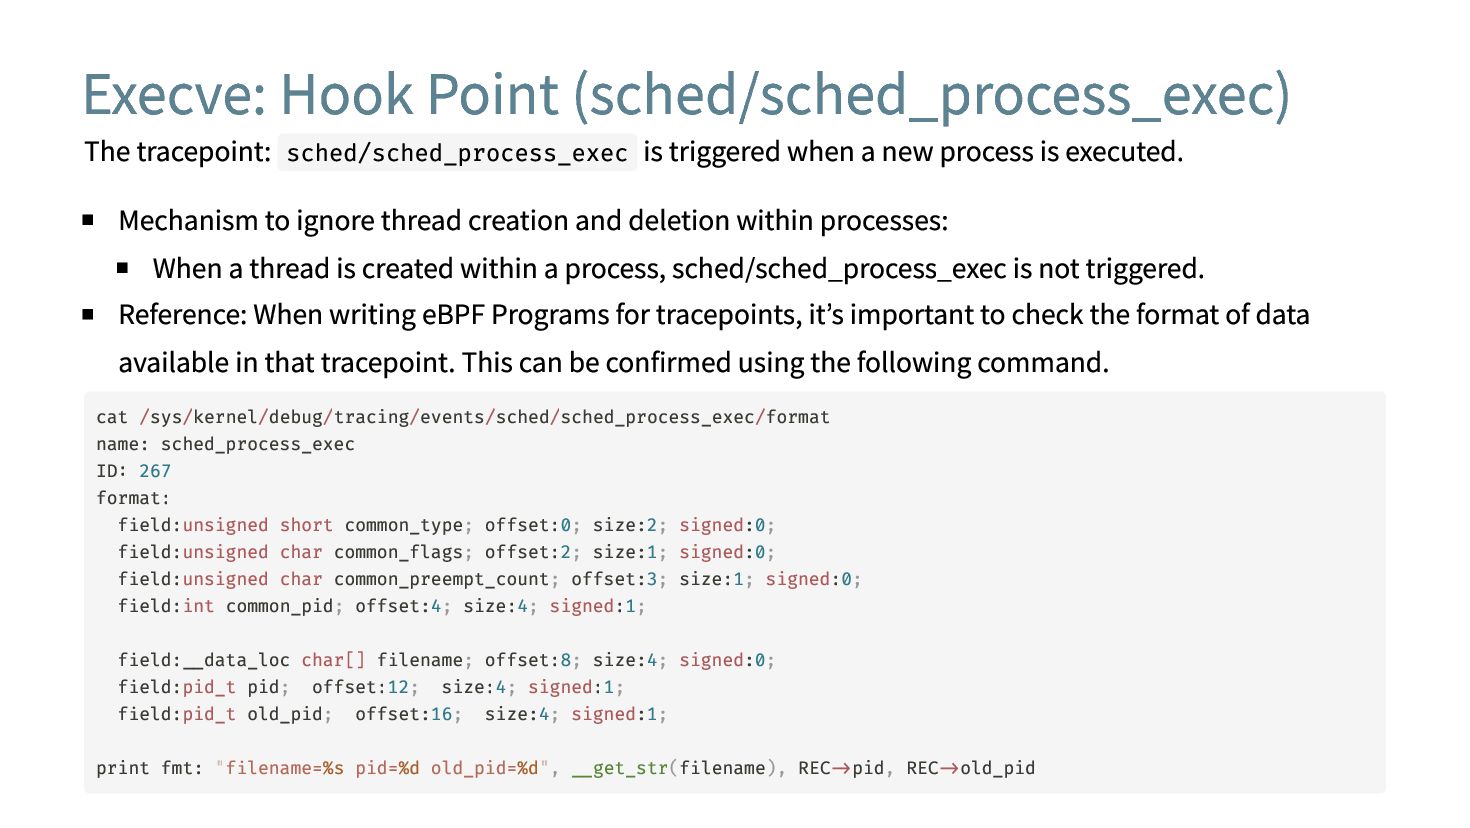
a new process is executed. Mechanism to ignore thread creation and deletion within processes: When a thread is created within a process, sched/sched_process_exec is not triggered. Reference: When writing eBPF Programs for tracepoints, it’s important to check the format of data available in that tracepoint. This can be confirmed using the following command. cat /sys/kernel/debug/tracing/events/sched/sched_process_exec/format name: sched_process_exec ID: 267 format: field:unsigned short common_type; offset:0; size:2; signed:0; field:unsigned char common_flags; offset:2; size:1; signed:0; field:unsigned char common_preempt_count; offset:3; size:1; signed:0; field:int common_pid; offset:4; size:4; signed:1; field:__data_loc char[] filename; offset:8; size:4; signed:0; field:pid_t pid; offset:12; size:4; signed:1; field:pid_t old_pid; offset:16; size:4; signed:1; print fmt: "filename=%s pid=%d old_pid=%d", __get_str(filename), REC->pid, REC->old_pid
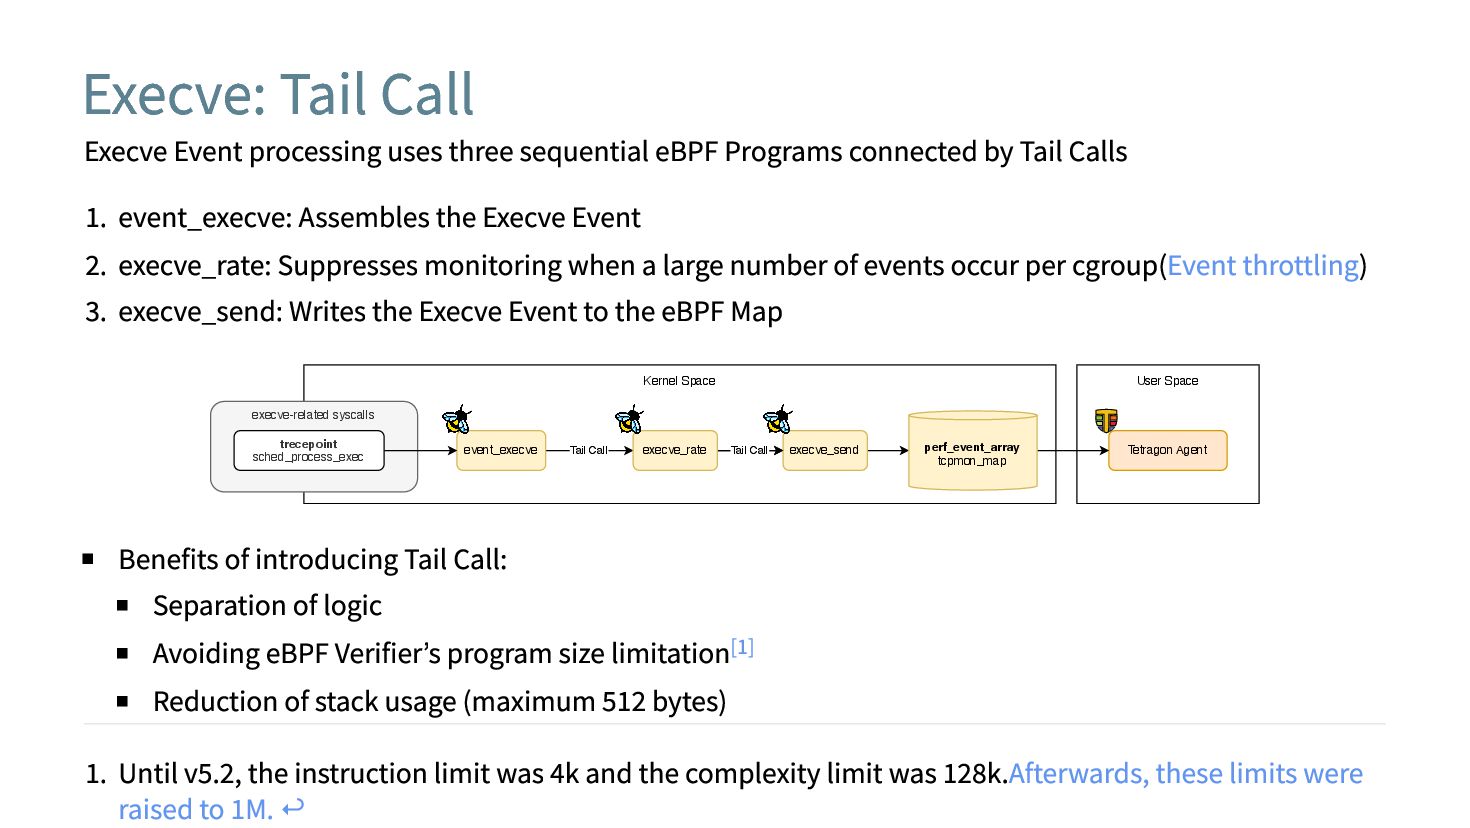
Programs connected by Tail Calls 1. event_execve: Assembles the Execve Event 2. execve_rate: Suppresses monitoring when a large number of events occur per cgroup(Event throttling) 3. execve_send: Writes the Execve Event to the eBPF Map Kernel Space Tail Call event_execve execve_send Tail Call execve_rate execve-related syscalls trecepoint sched_process_exec User Space Tetragon Agent perf_event_array tcpmon_map Benefits of introducing Tail Call: Separation of logic Avoiding eBPF Verifier’s program size limitation Reduction of stack usage (maximum 512 bytes) 1. Until v5.2, the instruction limit was 4k and the complexity limit was 128k.Afterwards, these limits were raised to 1M.↩︎ [1]
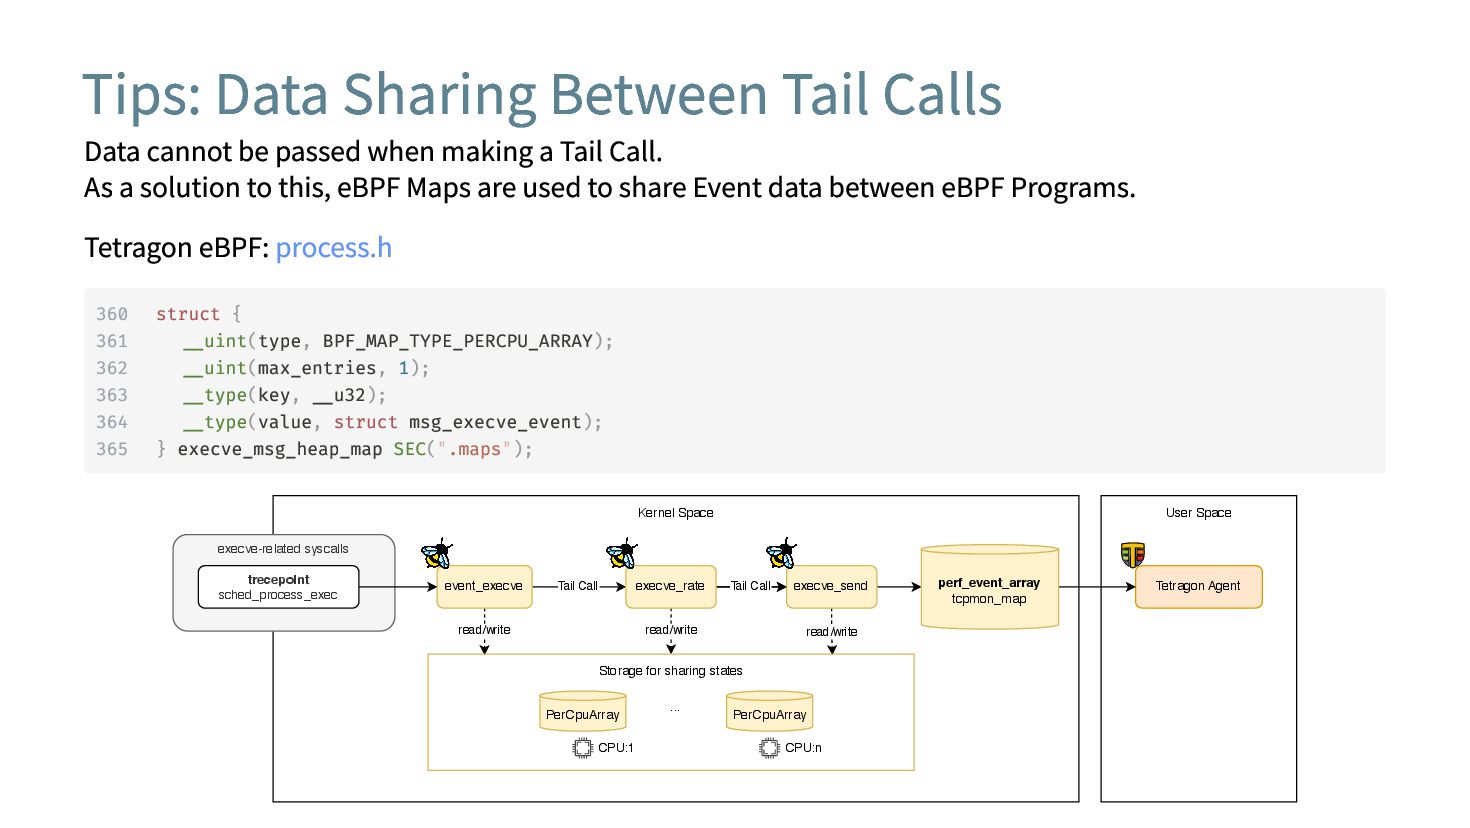
when making a Tail Call. As a solution to this, eBPF Maps are used to share Event data between eBPF Programs. Tetragon eBPF: process.h Kernel Space Tail Call read/write event_execve read/write execve_send Tail Call read/write execve_rate execve-related syscalls trecepoint sched_process_exec User Space Tetragon Agent perf_event_array tcpmon_map Storage for sharing states PerCpuArray CPU:1 CPU:n PerCpuArray ... 360 struct { 361 __uint(type, BPF_MAP_TYPE_PERCPU_ARRAY); 362 __uint(max_entries, 1); 363 __type(key, __u32); 364 __type(value, struct msg_execve_event); 365 } execve_msg_heap_map SEC(".maps");
Syscall eBPF Program for creating Clone Event Execve-related Syscall eBPF Program for creating Exit Event eBPF Program for creating Execve Event Tetragon Agent
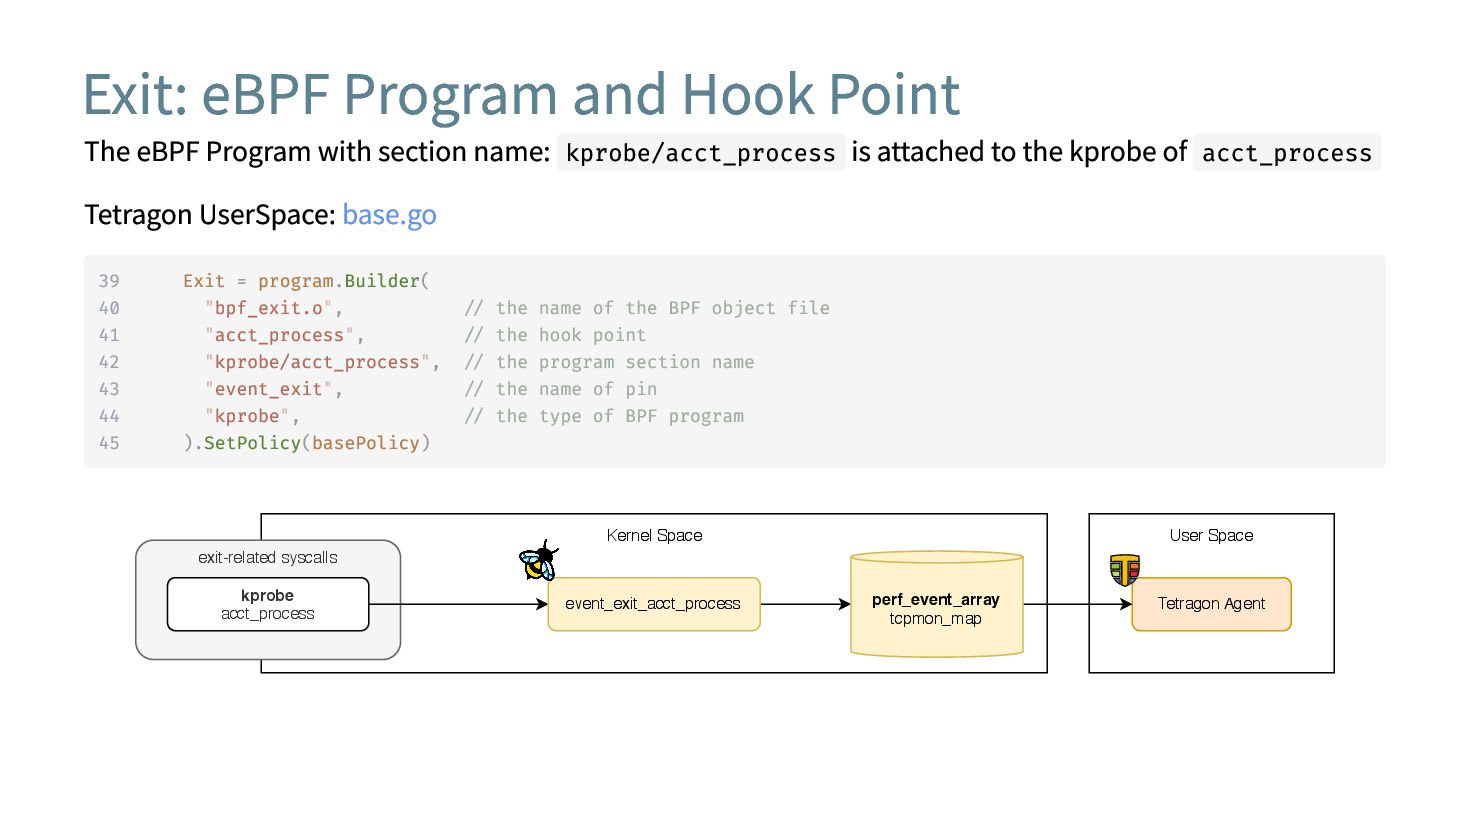
section name: kprobe/acct_process is attached to the kprobe of acct_process Tetragon UserSpace: base.go User Space Kernel Space Tetragon Agent exit-related syscalls event_exit_acct_process kprobe acct_process perf_event_array tcpmon_map 39 Exit = program.Builder( 40 "bpf_exit.o", // the name of the BPF object file 41 "acct_process", // the hook point 42 "kprobe/acct_process", // the program section name 43 "event_exit", // the name of pin 44 "kprobe", // the type of BPF program 45 ).SetPolicy(basePolicy)
do_exit() when a Thread Group is removed Linux: kernel/exit.c -> do_exit() Mechanism to ignore thread creation and deletion within processe: acct_process runs only once when a process terminates. For kernels without acct_process, disassociate_ctty is used instead. Reference: Previously, the tracepoint sched/sched_process_exit or kprobe kprobe/__put_task_struct was used. tetragon: Switch exit tracepoint to __put_task_struct kprobe #558 tetragon: Hook exit sensor on acct_process #1509 void __noreturn do_exit(long code) { if (group_dead) acct_process();
2. Explained Linux fundamentals (task_struct, TGID and PID, Process-related Syscalls) 3. Introduced portions of Tetragon/Kernel code (Hook Points and eBPF Programs for Fork/Execve/Exit) 4. Presented eBPF tips (Tracepoint Data Format, Tail Call, data sharing using Per-CPU Maps)