Upgrade to Pro
— share decks privately, control downloads, hide ads and more …
Speaker Deck
Features
Speaker Deck
PRO
Sign in
Sign up for free
Search
Search
Democratize Metrics with Grafana
Search
Alexander Zobnin
July 14, 2017
Programming
660
3
Share
Embed
Copy iframe code
Copy JS code
Copy link
Start on current slide
Democratize Metrics with Grafana
Alexander Zobnin
July 14, 2017
Other Decks in Programming
See All in Programming
act2-costs.pdf
sumedhbala
0
120
symfony/aiとlaravel/boost
77web
0
140
FDEが実現するAI駆動経営の現在地
gonta
1
110
JAWS-UG横浜 #102 AWSサ終供養LT会 成仏できない AWS サービスたち 〜本日、三体供養します〜
maroon1st
0
210
【やさしく解説 設計編・中級 #4】ルールの寿命と、システムの年輪
panda728
PRO
2
150
共通化で考えるべきは、実装より公開する型だった
codeegg
0
250
どこまでゆるくて許されるのか
tk3fftk
0
510
PHP に部分適用が来るぞ!……ところで何それ?おいしいの? #phpcon / phpcon-2026
shogogg
0
290
SREの積み重ねがAI駆動開発のガードレールになった ― 7つの実践/SRE Guardrails The 7
tomoyakitaura
8
4.8k
壊れたパーサから始める関数型設計と構成的なパーサ #fp_matsuri
raiga0310
2
360
SREは、MCPとSRE Agentをこう使え!
kazumax55
0
150
AI 輔助遺留系統現代化的經驗分享
jame2408
1
1.2k
Featured
See All Featured
How to Get Subject Matter Experts Bought In and Actively Contributing to SEO & PR Initiatives.
livdayseo
0
150
Fight the Zombie Pattern Library - RWD Summit 2016
marcelosomers
234
17k
The Success of Rails: Ensuring Growth for the Next 100 Years
eileencodes
47
8.2k
The Myth of the Modular Monolith - Day 2 Keynote - Rails World 2024
eileencodes
28
3.6k
Breaking role norms: Why Content Design is so much more than writing copy - Taylor Woolridge
uxyall
0
350
Unsuck your backbone
ammeep
672
58k
Future Trends and Review - Lecture 12 - Web Technologies (1019888BNR)
signer
PRO
0
3.6k
We Are The Robots
honzajavorek
0
280
Embracing the Ebb and Flow
colly
88
5.1k
How to Ace a Technical Interview
jacobian
281
24k
Ruling the World: When Life Gets Gamed
codingconduct
0
280
The SEO identity crisis: Don't let AI make you average
varn
0
520
Transcript
Democratize Metrics with Grafana
• Metrics everyone can see • Visualizations anyone can build
• Mix and match data sources • In an open source platform
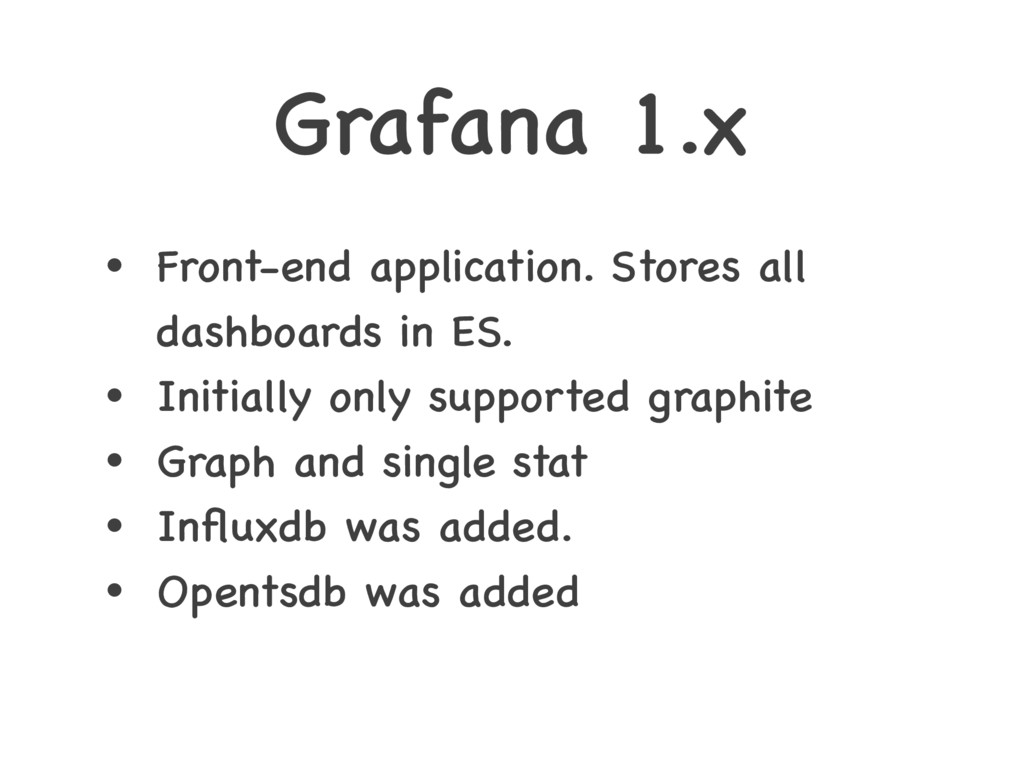
Grafana 1.x • Front-end application. Stores all dashboards in ES.
• Initially only supported graphite • Graph and single stat • Influxdb was added. • Opentsdb was added
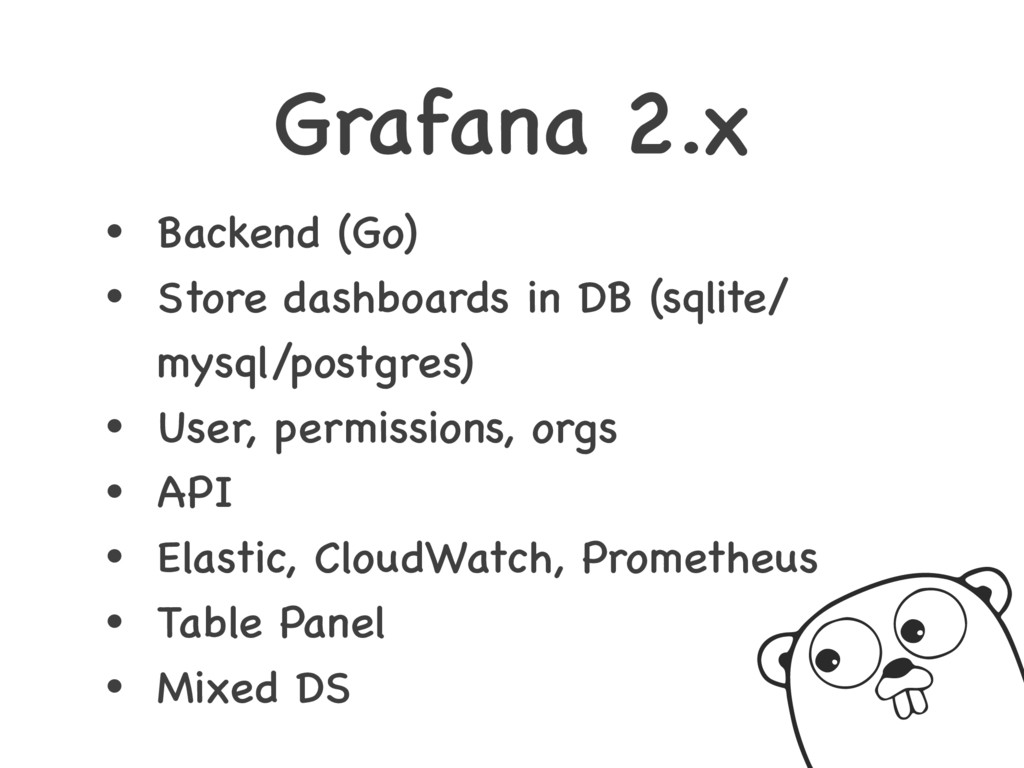
Grafana 2.x • Backend (Go) • Store dashboards in DB
(sqlite/ mysql/postgres) • User, permissions, orgs • API • Elastic, CloudWatch, Prometheus • Table Panel • Mixed DS
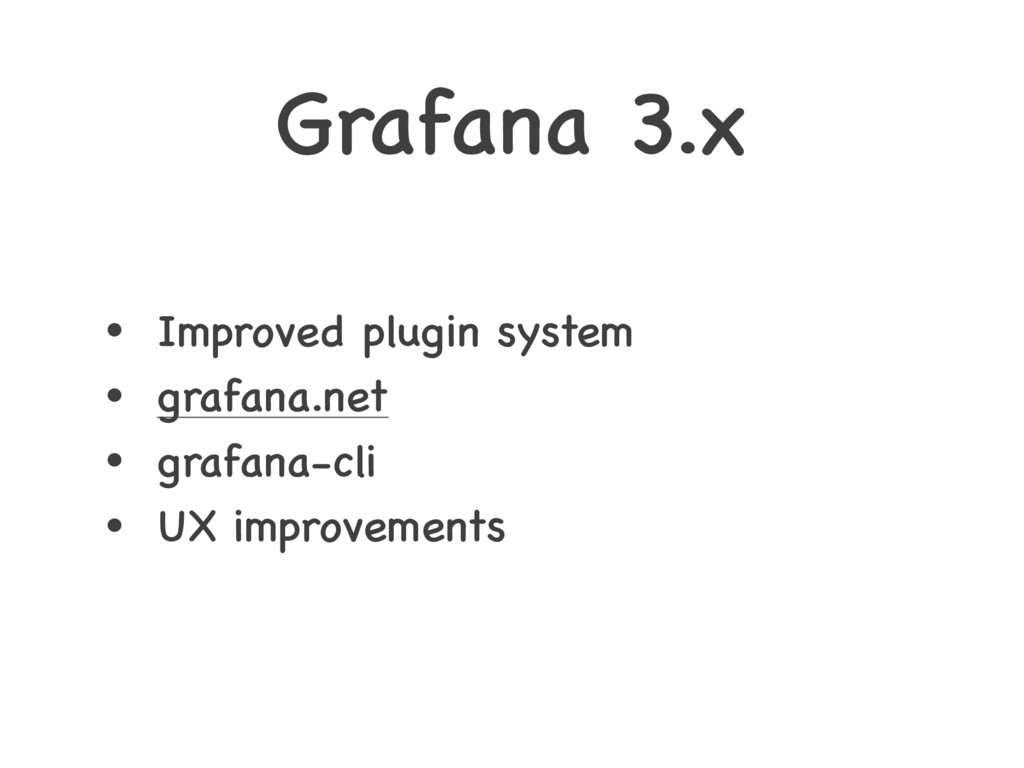
Grafana 3.x • Improved plugin system • grafana.net • grafana-cli
• UX improvements
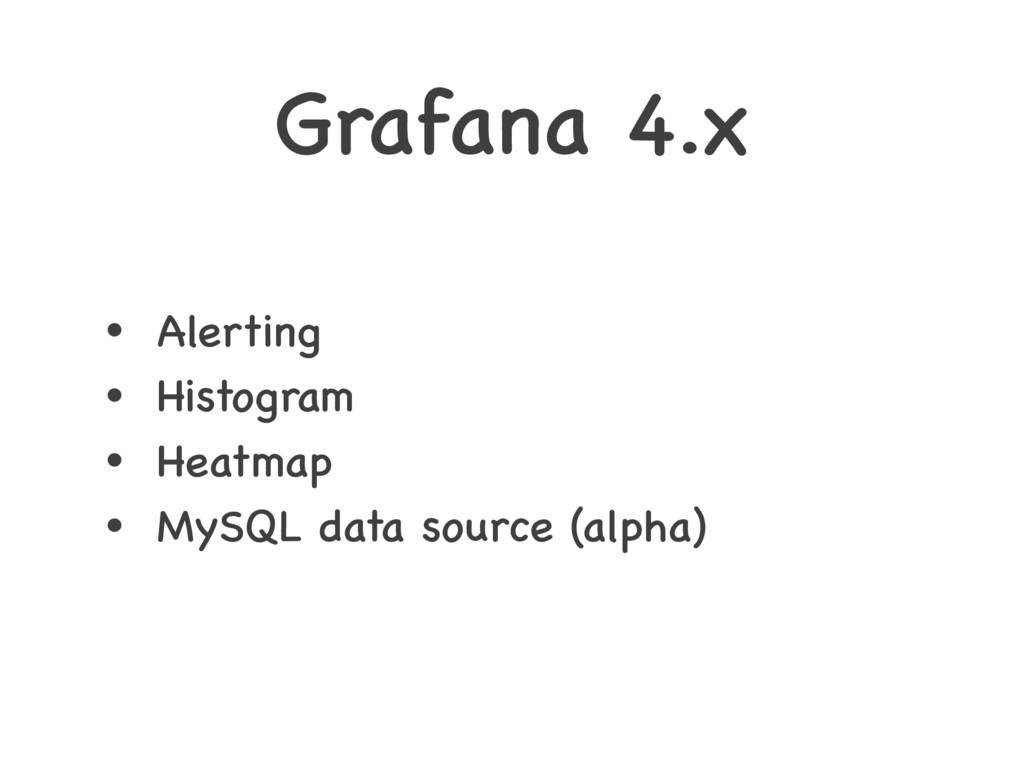
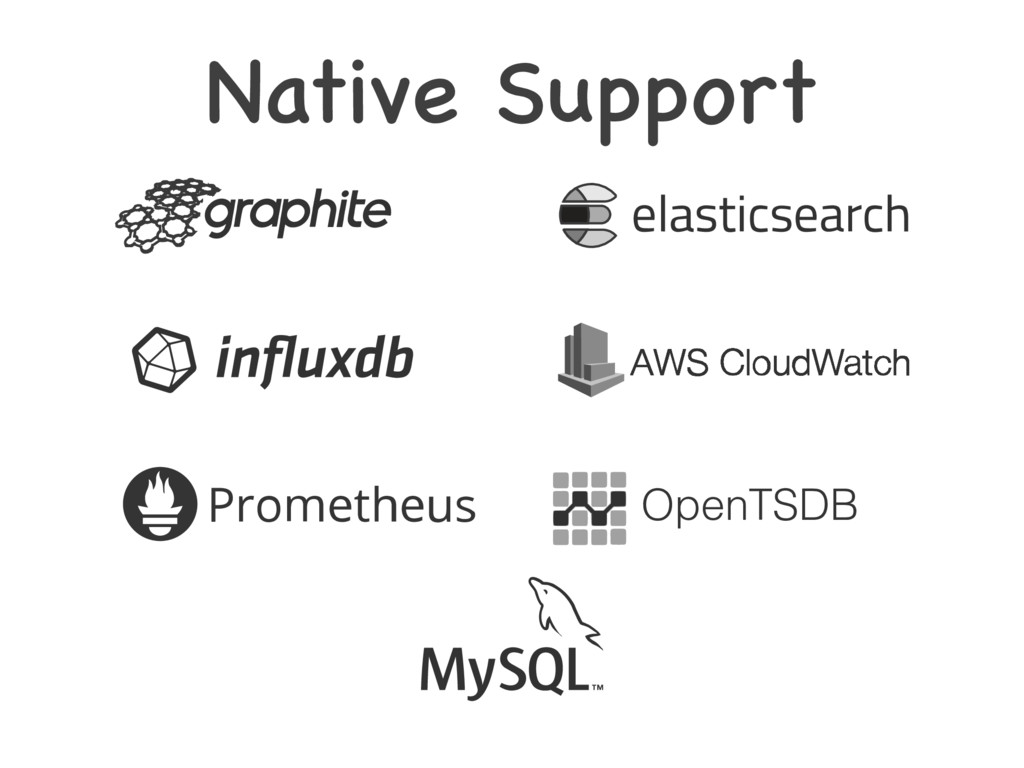
Grafana 4.x • Alerting • Histogram • Heatmap • MySQL
data source (alpha)
None
None
None
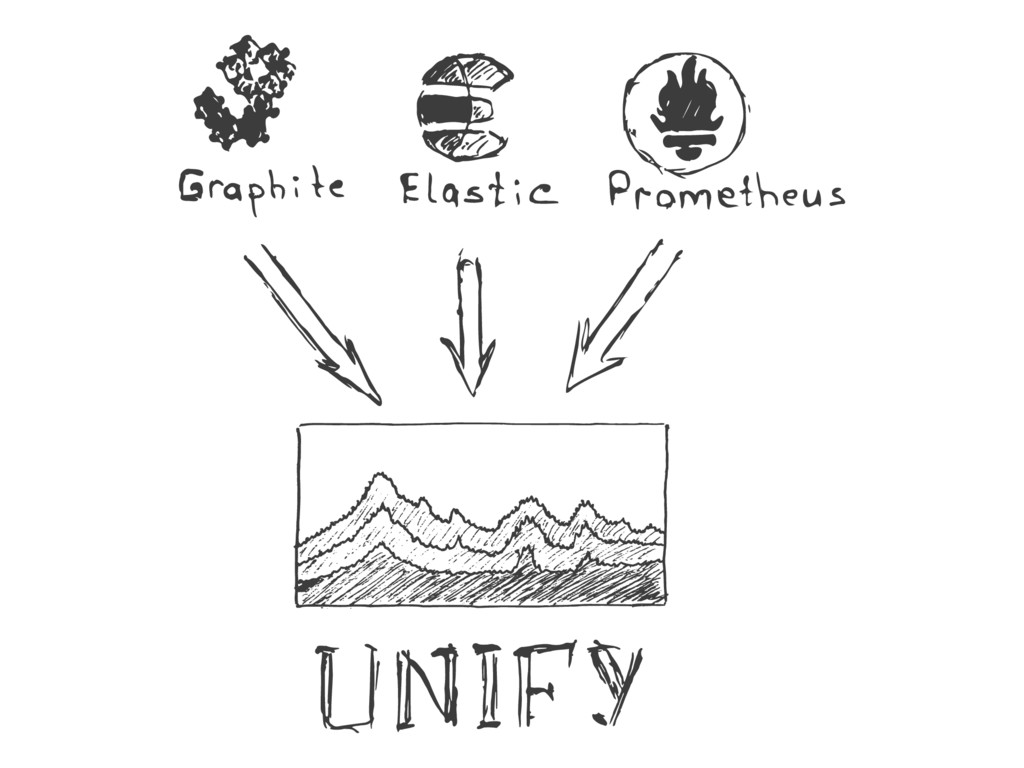
UNIFY • 30+ data sources • Mixed data sources
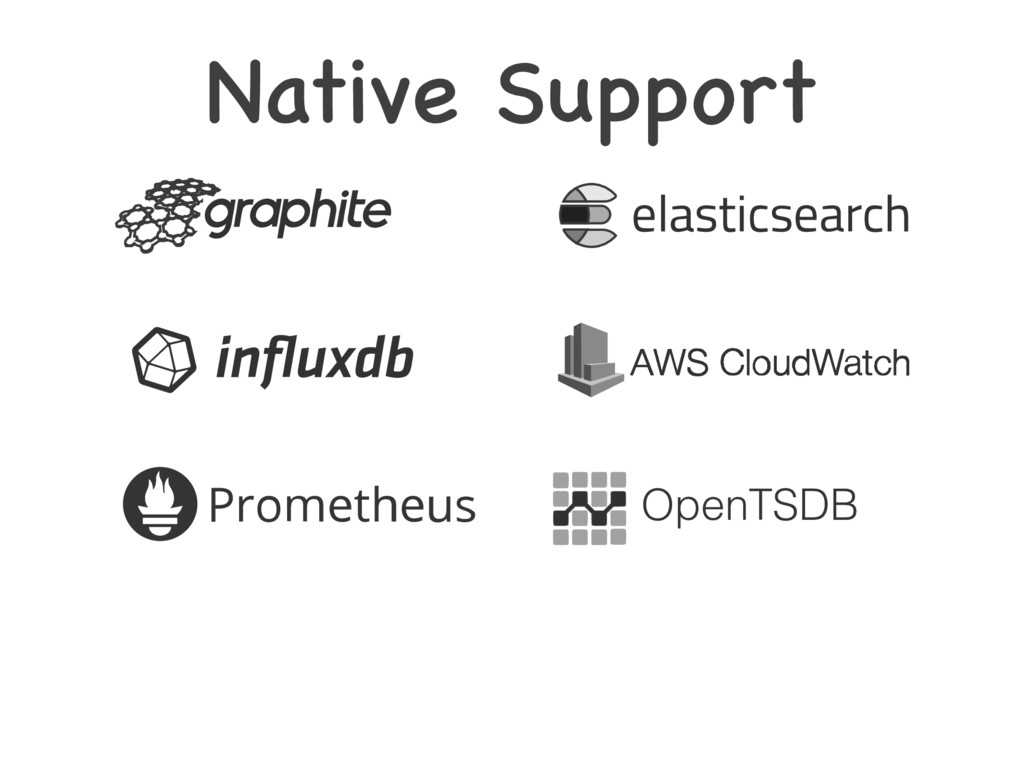
Native Support OpenTSDB
Native Support OpenTSDB
None
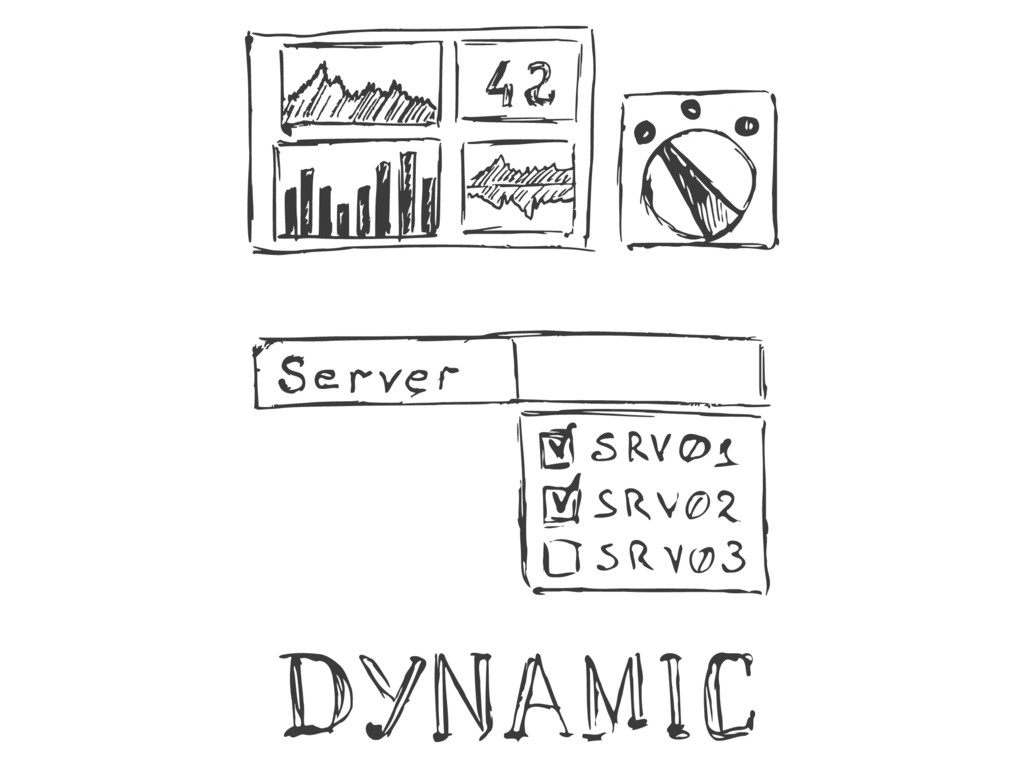
DYNAMIC • Template Variables • Ad hoc filters • Scripted
dashboards
None
COLLABORATE • Share dashboard snapshots • Share dashboard on grafana.com
• Contribute to Grafana • Open issue on github • Write your own plugin
None
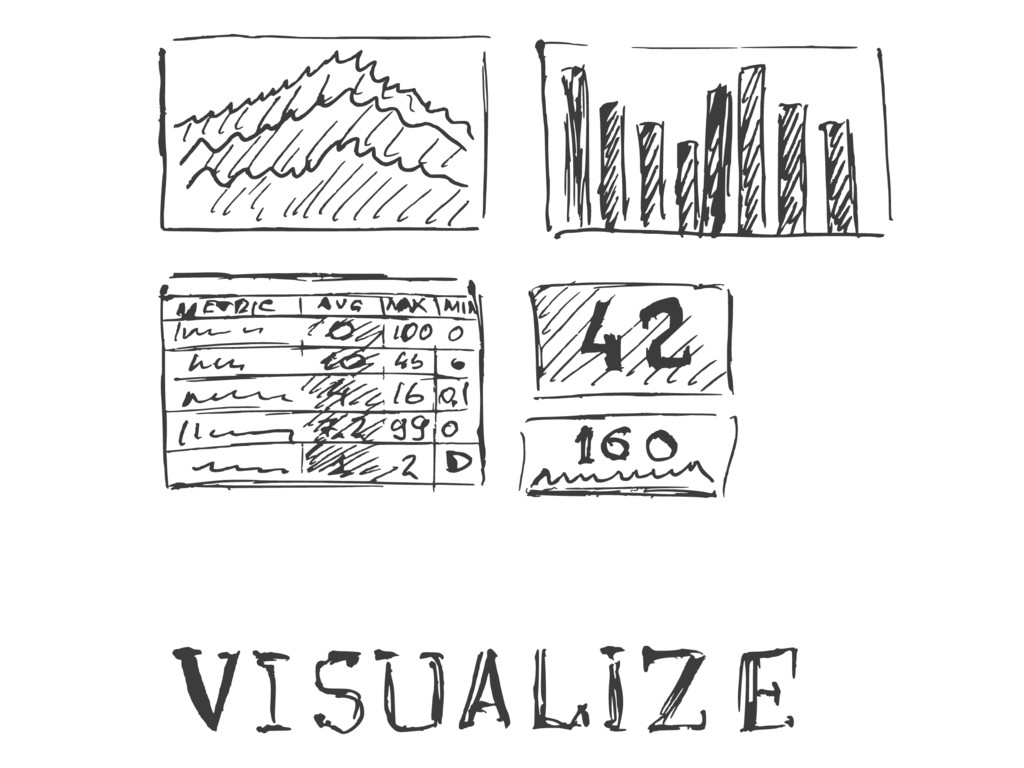
VISUALIZE
None
None
ES heatmap • Built on ES backend • 1 Series
for each bucket
• Prometheus histogram ? • StatsD ?
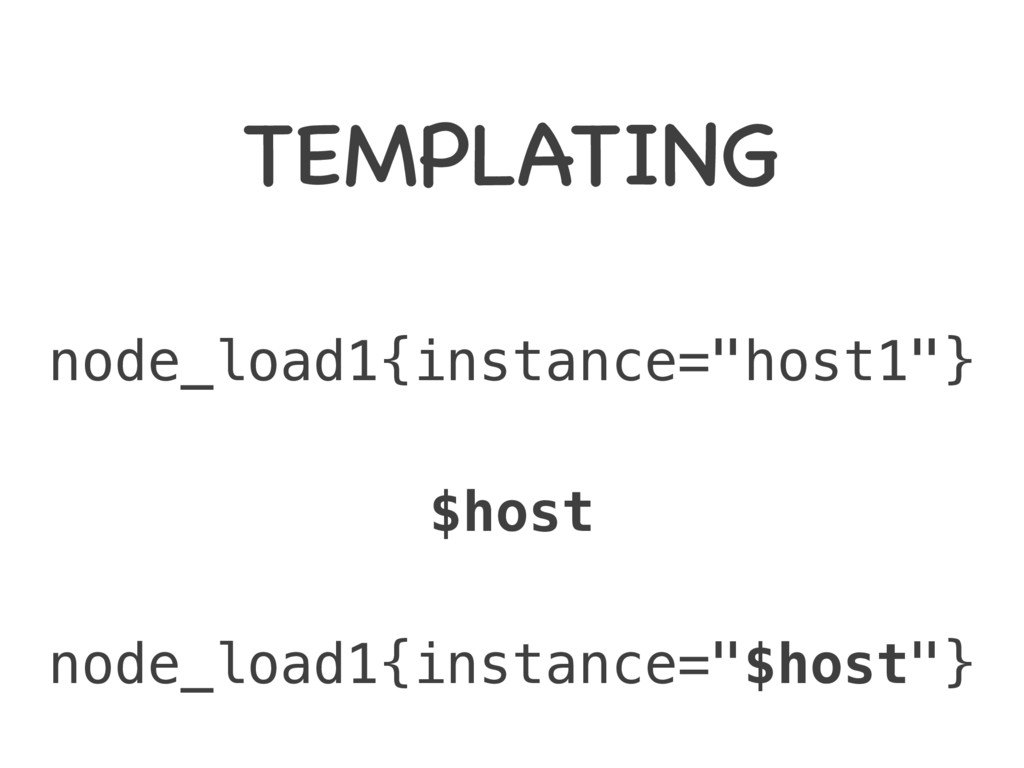
TEMPLATING
TEMPLATING node_load1{instance="host1"} node_load1{instance="$host"} $host
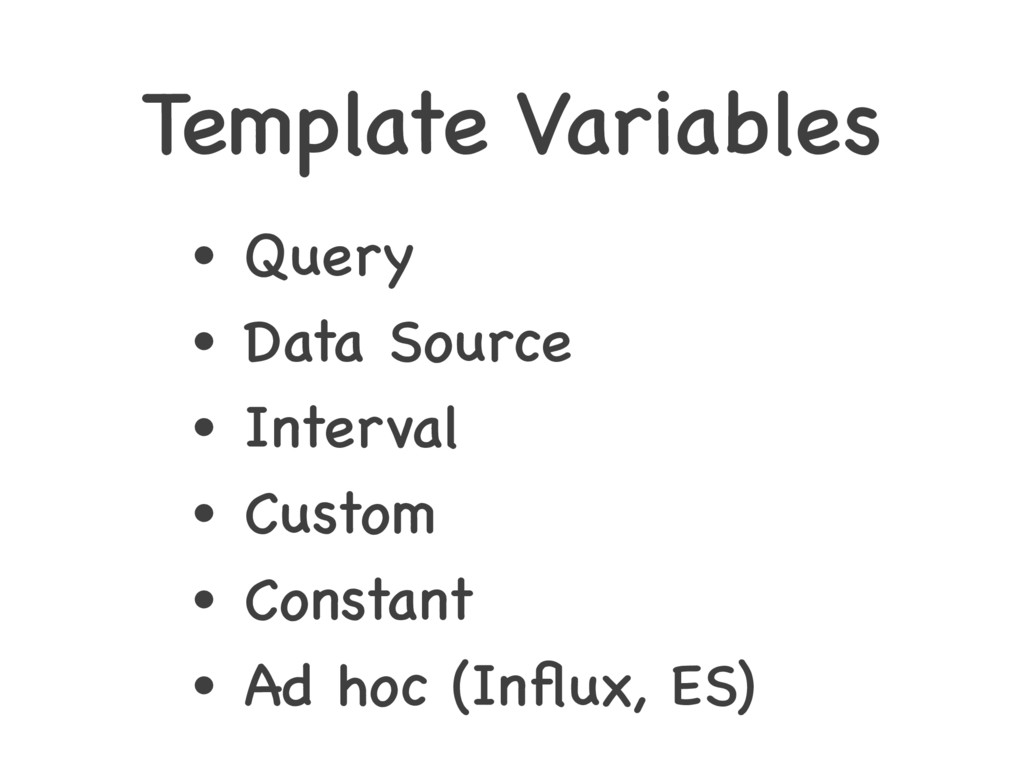
Template Variables • Query • Data Source • Interval •
Custom • Constant • Ad hoc (Influx, ES)
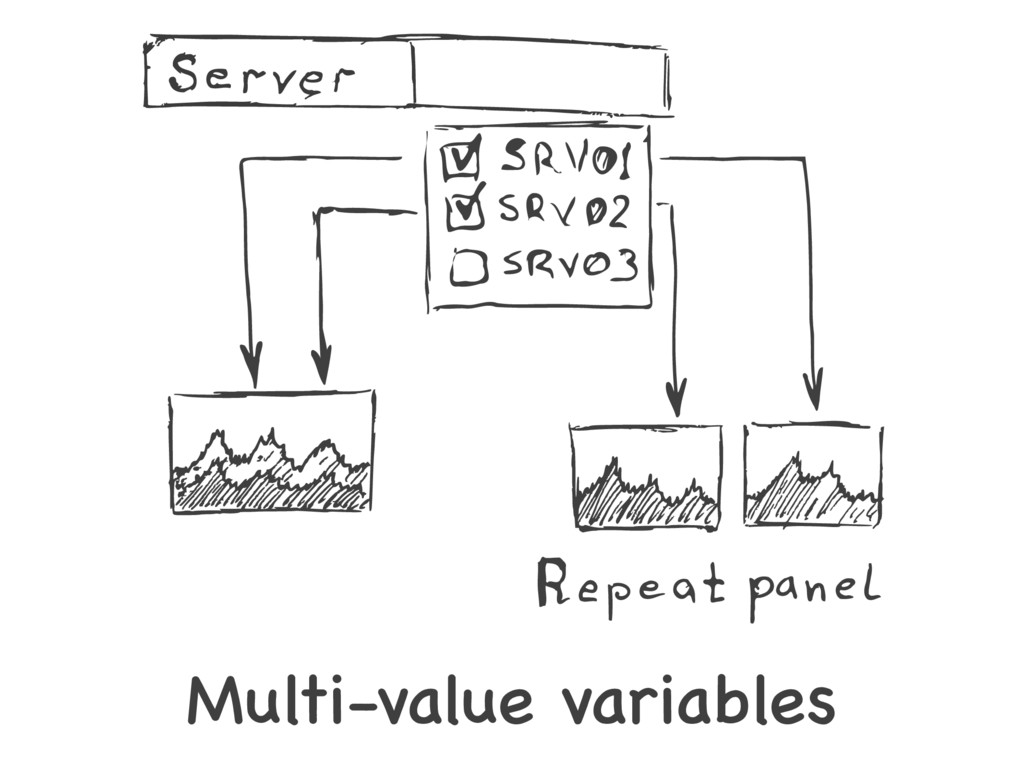
Multi-value variables
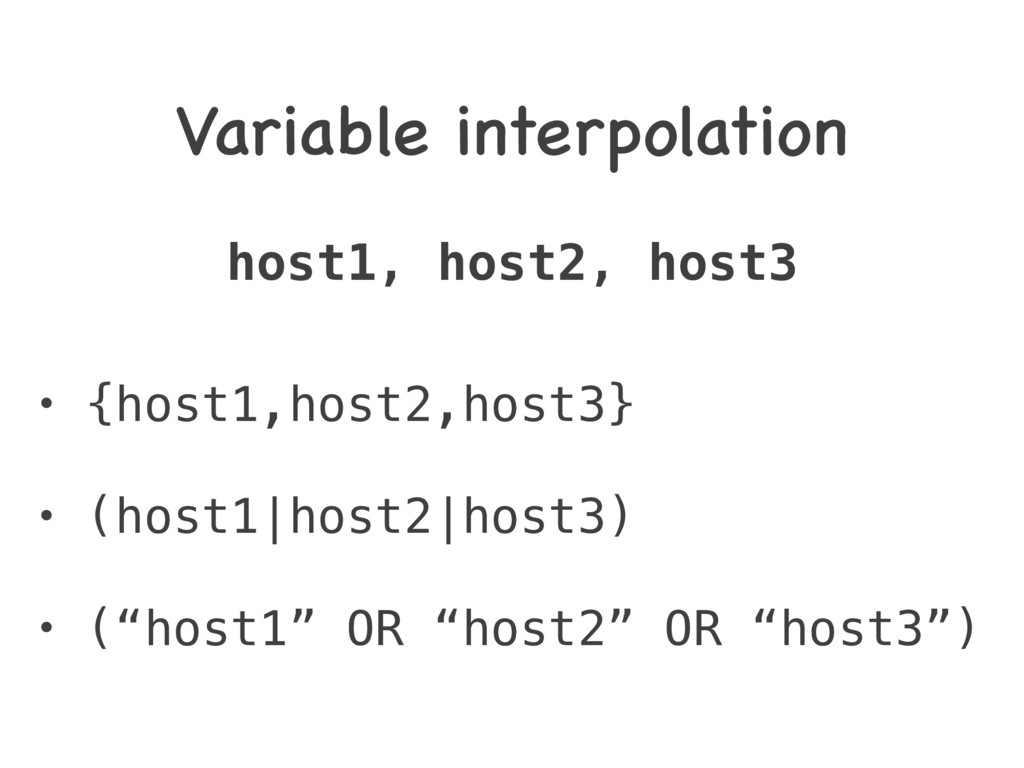
Variable interpolation host1, host2, host3 • {host1,host2,host3} • (host1|host2|host3) •
(“host1” OR “host2” OR “host3”)
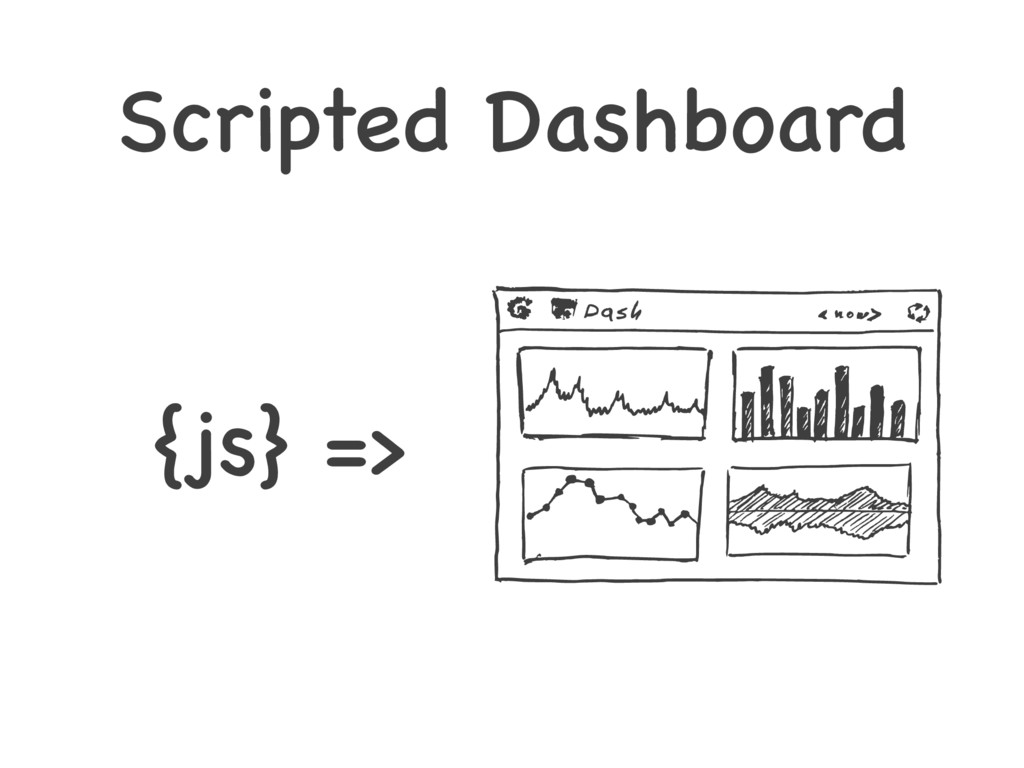
Scripted Dashboard {js} =>
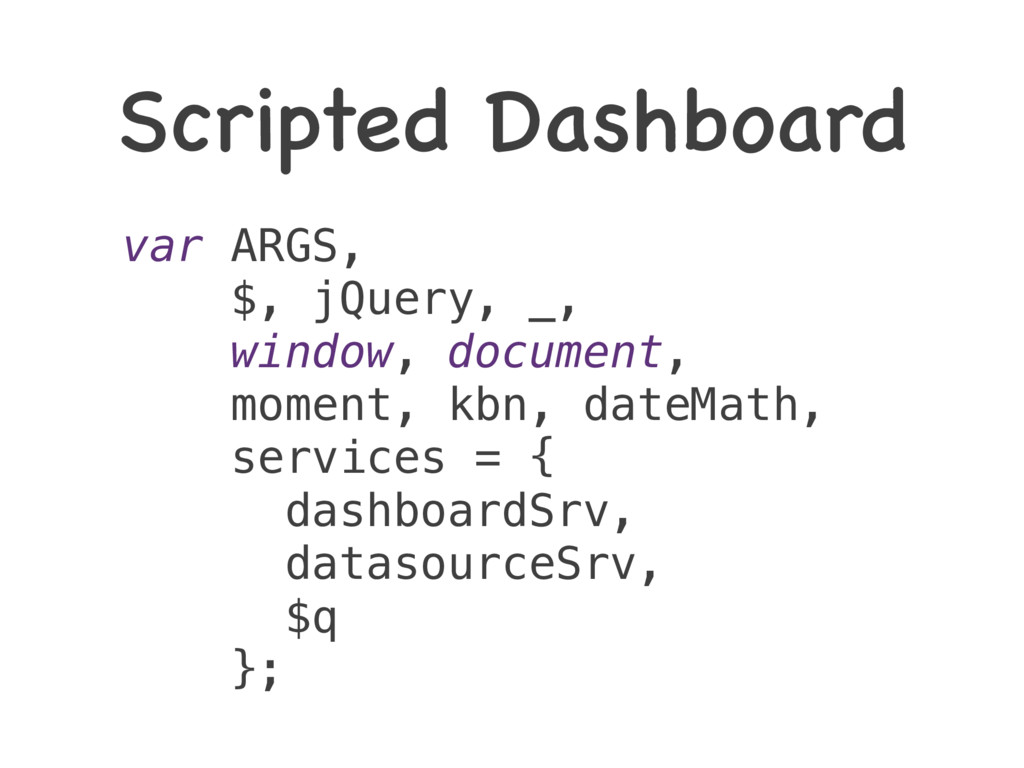
Scripted Dashboard var ARGS, $, jQuery, _, window, document, moment,
kbn, dateMath, services = { dashboardSrv, datasourceSrv, $q };
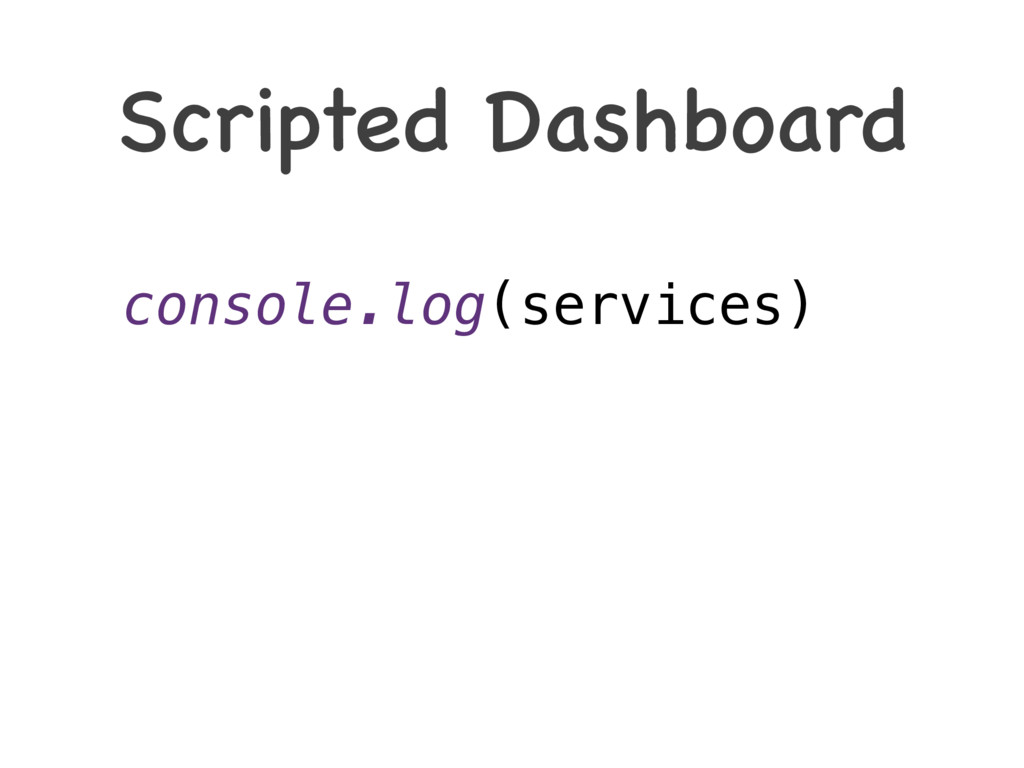
Scripted Dashboard console.log(services)
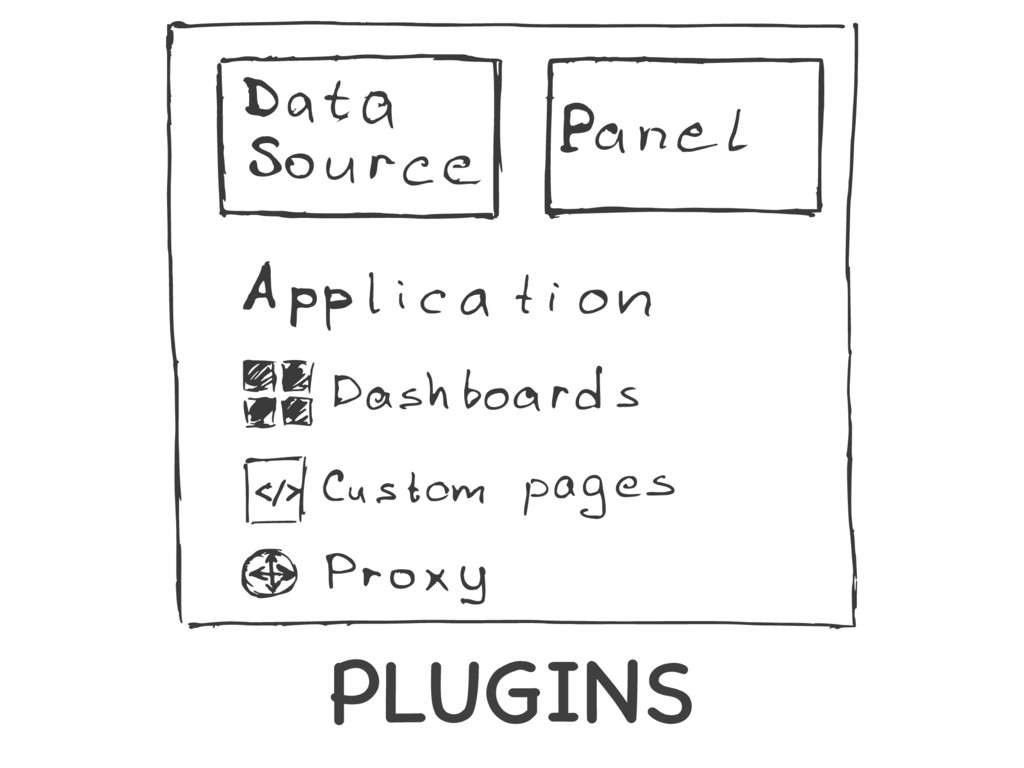
PLUGINS
PLUGINS
DS Plugin
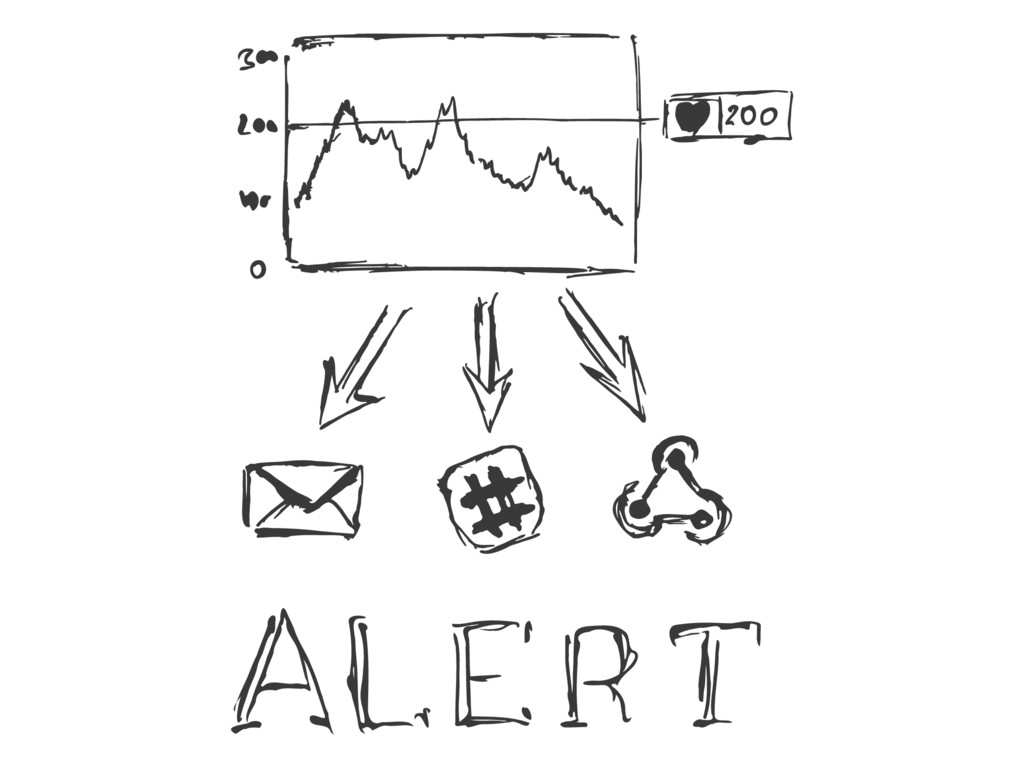
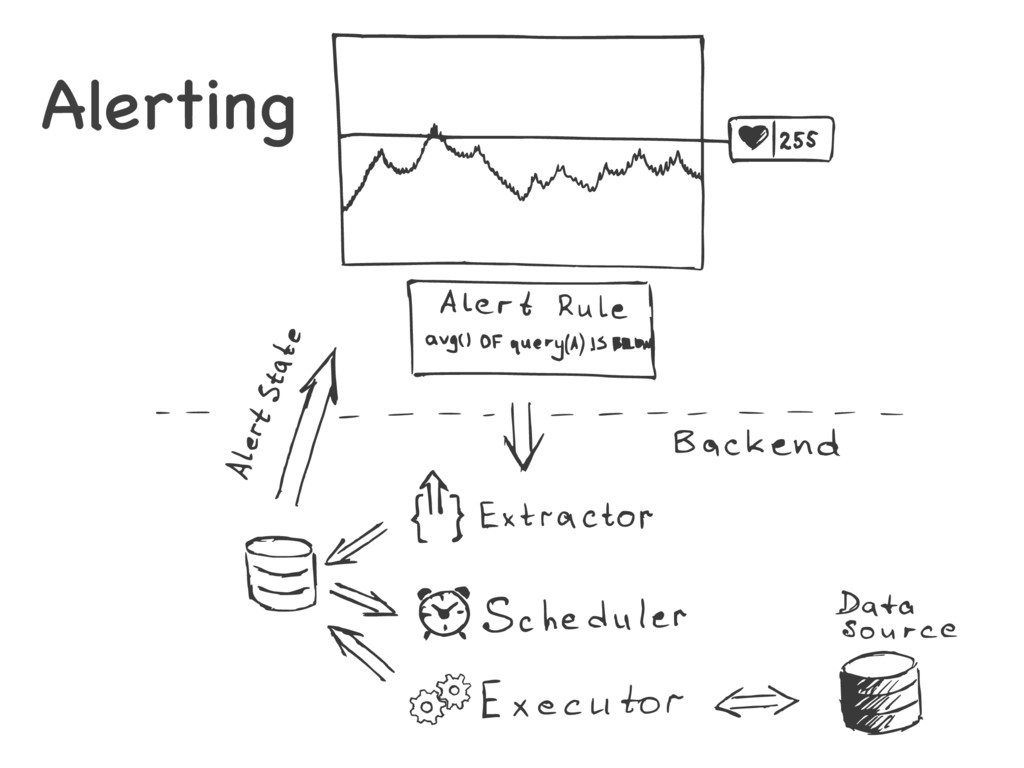
ALERTING
Alerting
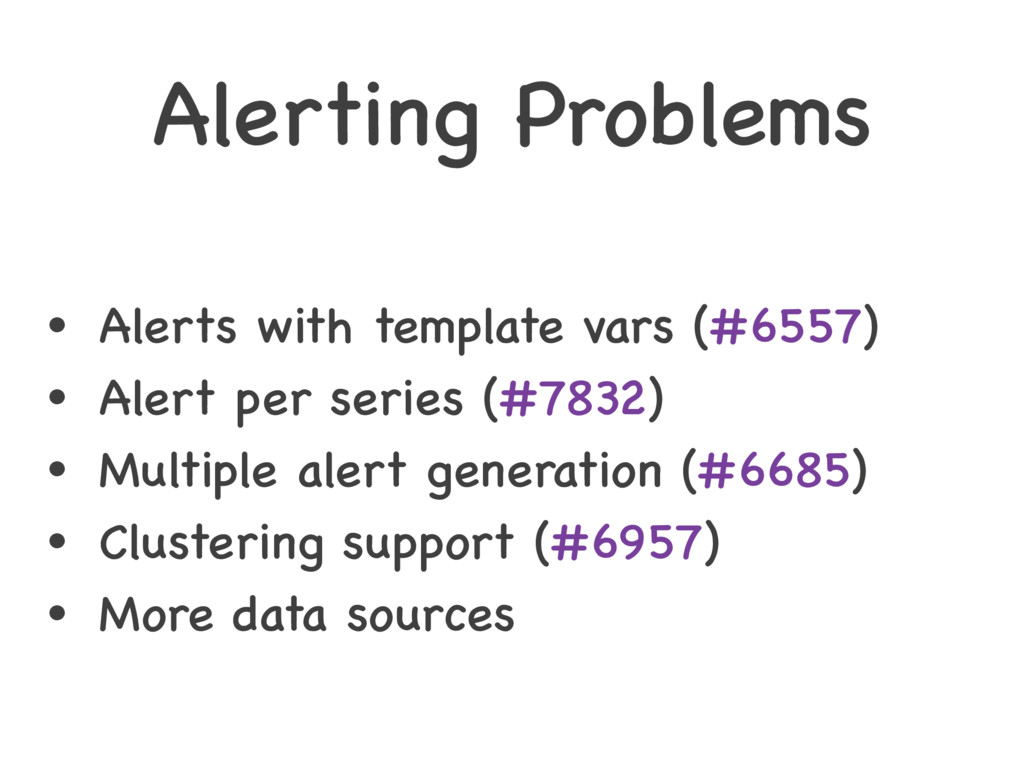
Alerting Problems • Alerts with template vars (#6557) • Alert
per series (#7832) • Multiple alert generation (#6685) • Clustering support (#6957) • More data sources
COLLABORATE
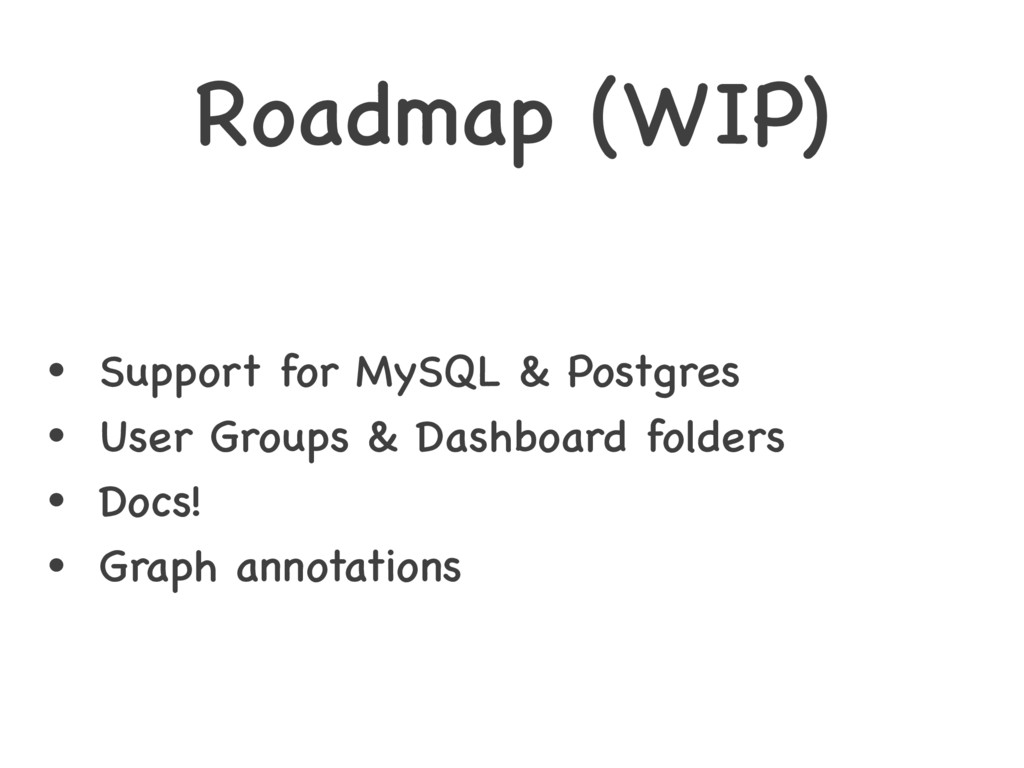
Roadmap (WIP) • Support for MySQL & Postgres • User
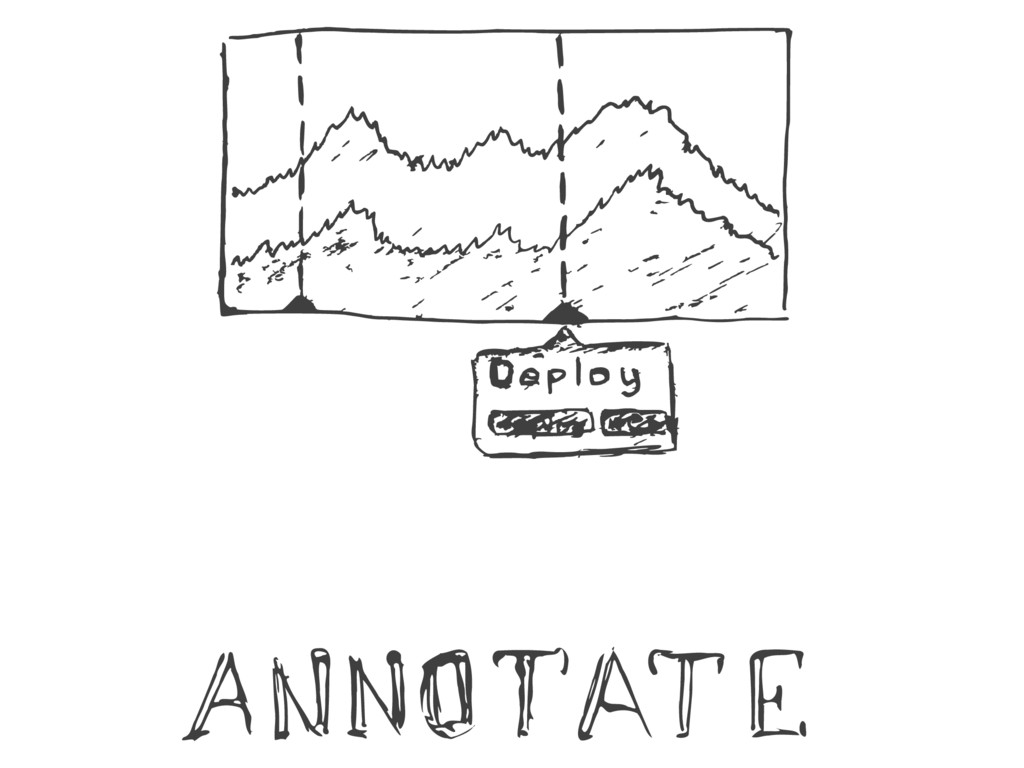
Groups & Dashboard folders • Docs! • Graph annotations
Roadmap • Improved panel layout • Backend plugins • Time
series transformations • Reporting • Web socket & live data streams • Migrate to Angular2
Roadmap • Dashboard revisions (done!) • Clustering for alert engine
(WIP)
timeShift • Weekly • Articles, links • Plugins and Dashboards
updates • This week’s Most Valuable Contributor
Александр Зобнин
[email protected]
github.com/alexanderzobnin grafana.com
![Александр Зобнин [email protected] github.com/alexanderzobnin grafana.com](https://files.speakerdeck.com/presentations/9a77a49625de455abff0b4fa2c241d76/slide_41.jpg)