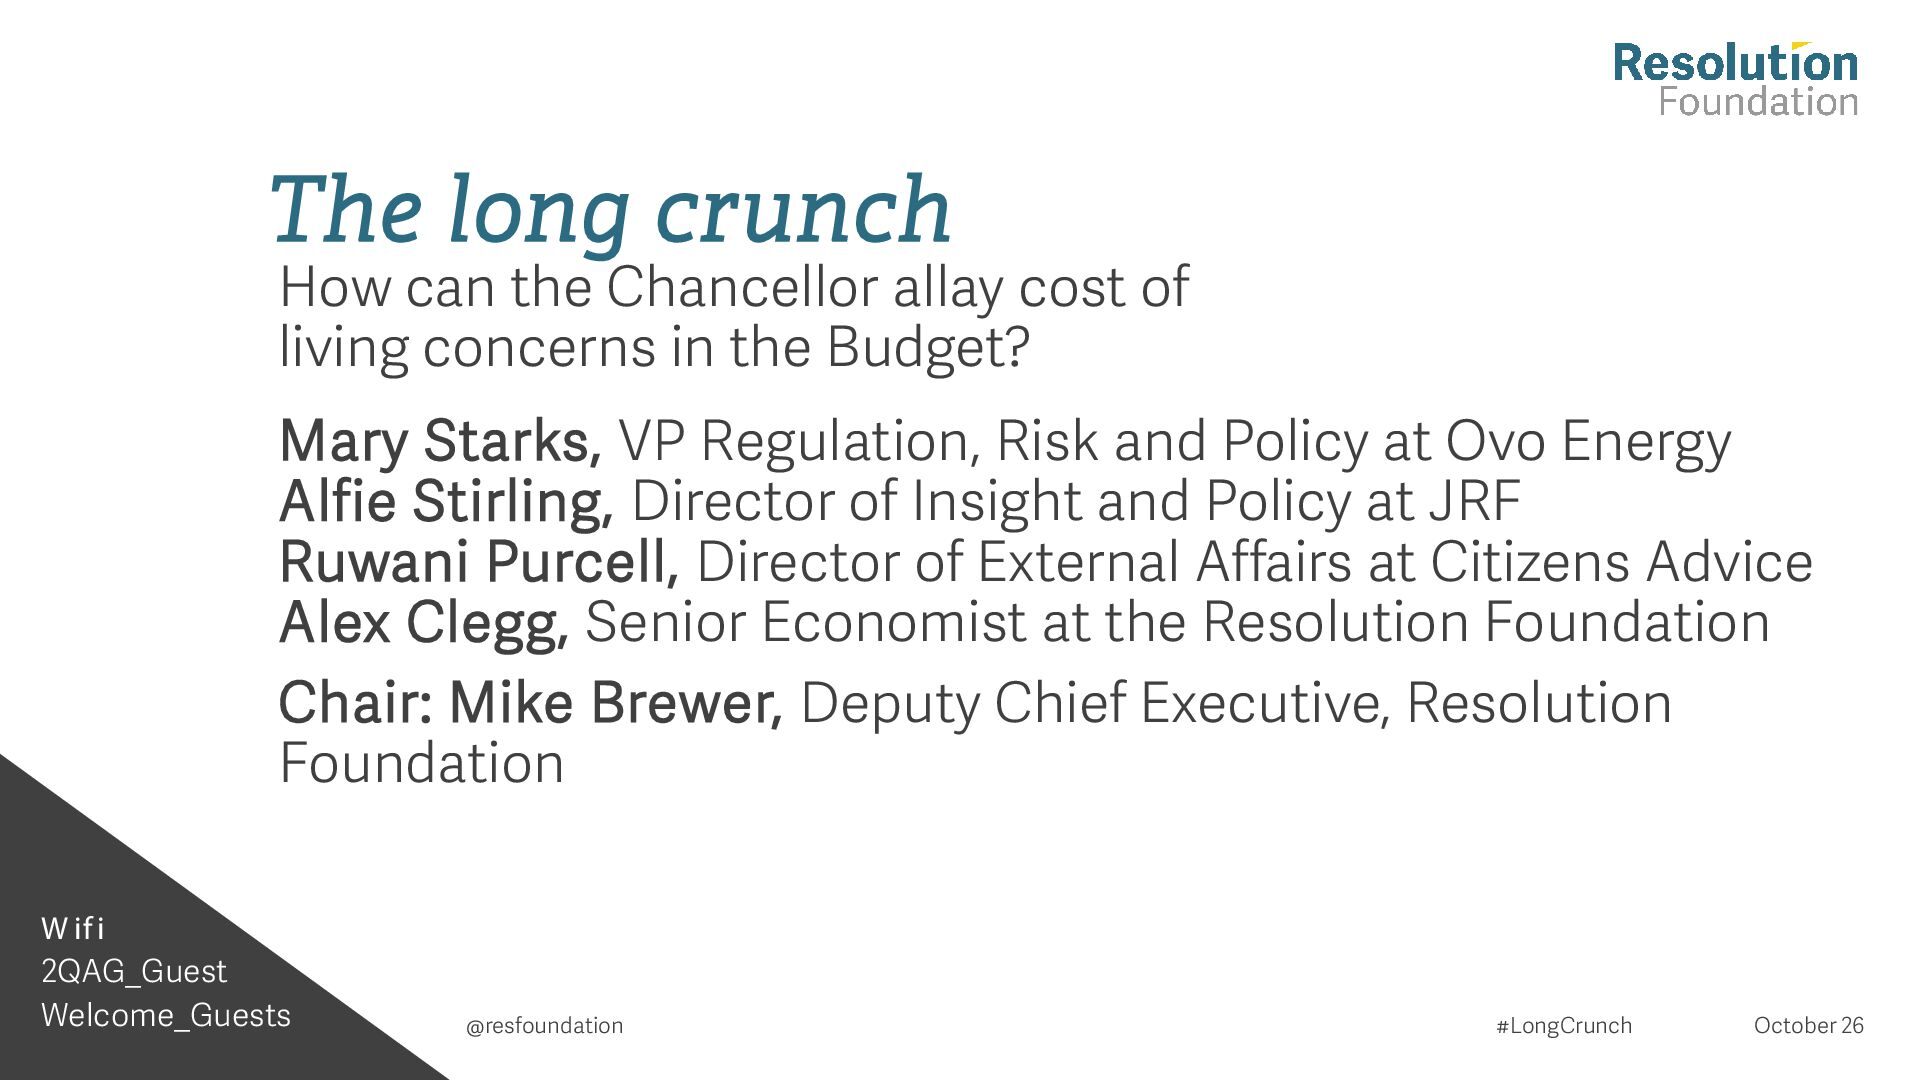
living concerns in the Budget? Mary Starks, VP Regulation, OVO Energy Alfie Stirling, Director of Insight and Policy, Joseph Rowntree Foundation Ruwani Purcell, Director of External Affairs, Citizens Advice Alex Clegg, Senior Economist, Resolution Foundation Chair: Mike Brewer, Deputy Chief Executive, Resolution Foundation W if i 2QAG_Guest Welcome_Guests @resfoundation #LongCrunch October 26
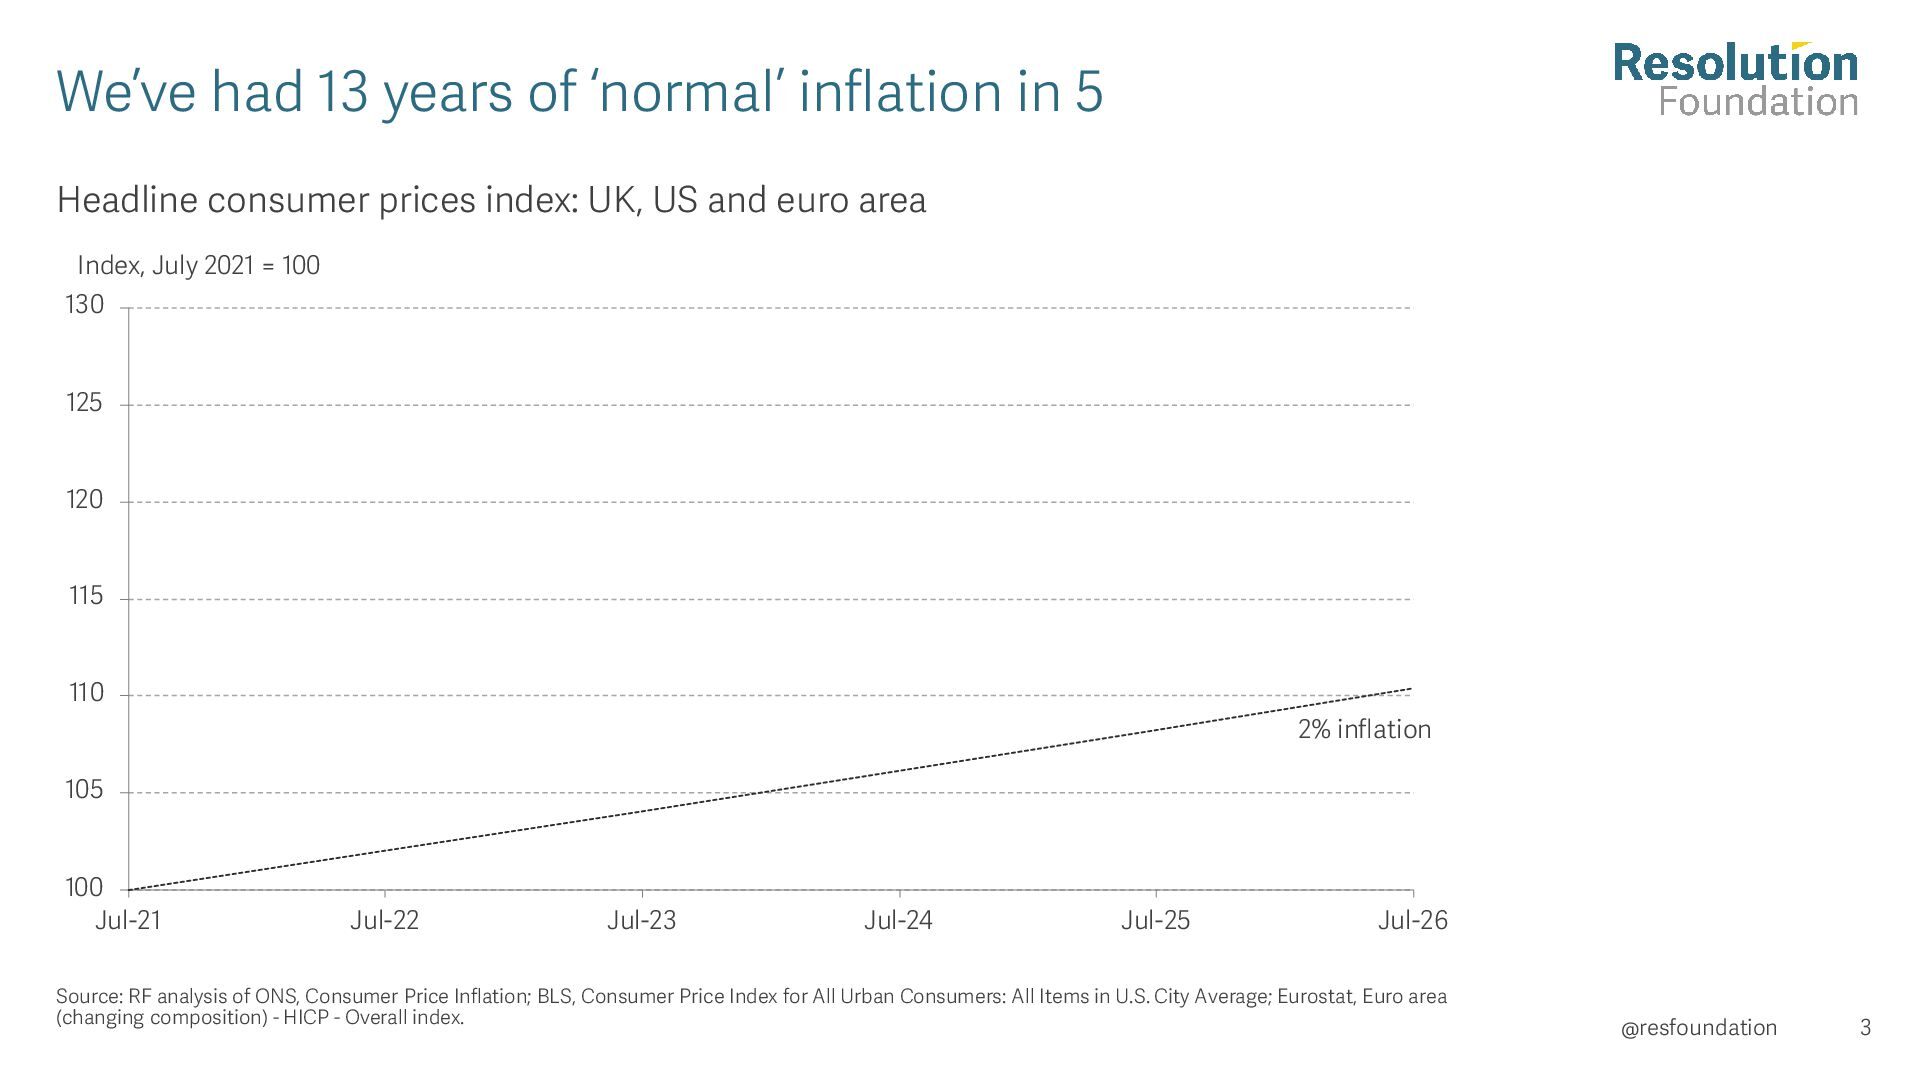
consumer prices index: UK, US and euro area Index, July 2021 = 100 130 125 120 115 110 2% inflation 105 100 Jul-21 Jul-22 Jul-23 Jul-24 Jul-25 Jul-26 Source: RF analysis of ONS, Consumer Price Inflation; BLS, Consumer Price Index for All Urban Consumers: All Items in U.S. City Average; Eurostat, Euro area (changing composition) - HICP - Overall index. @resfoundation 3
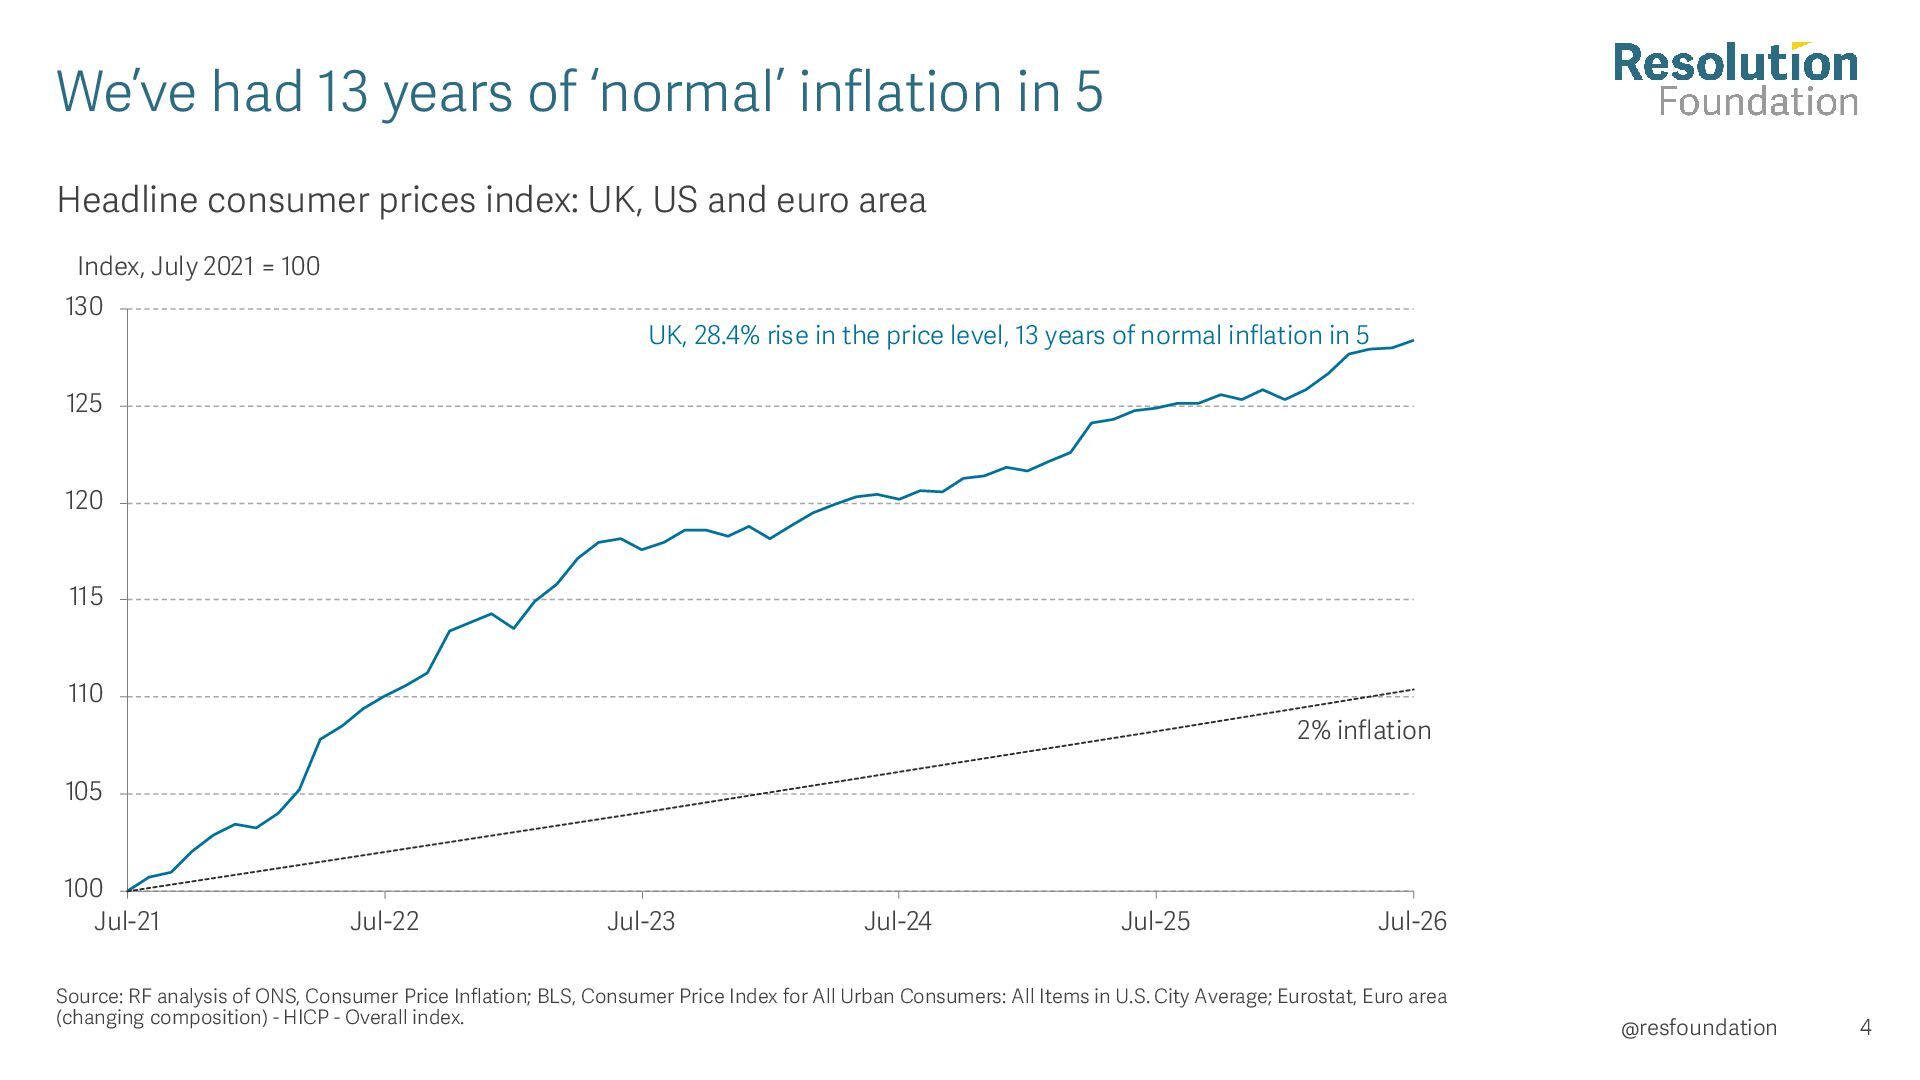
consumer prices index: UK, US and euro area Index, July 2021 = 100 130 UK, 28.4% rise in the price level, 13 years of normal inflation in 5 125 120 115 110 2% inflation 105 100 Jul-21 Jul-22 Jul-23 Jul-24 Jul-25 Jul-26 Source: RF analysis of ONS, Consumer Price Inflation; BLS, Consumer Price Index for All Urban Consumers: All Items in U.S. City Average; Eurostat, Euro area (changing composition) - HICP - Overall index. @resfoundation 4
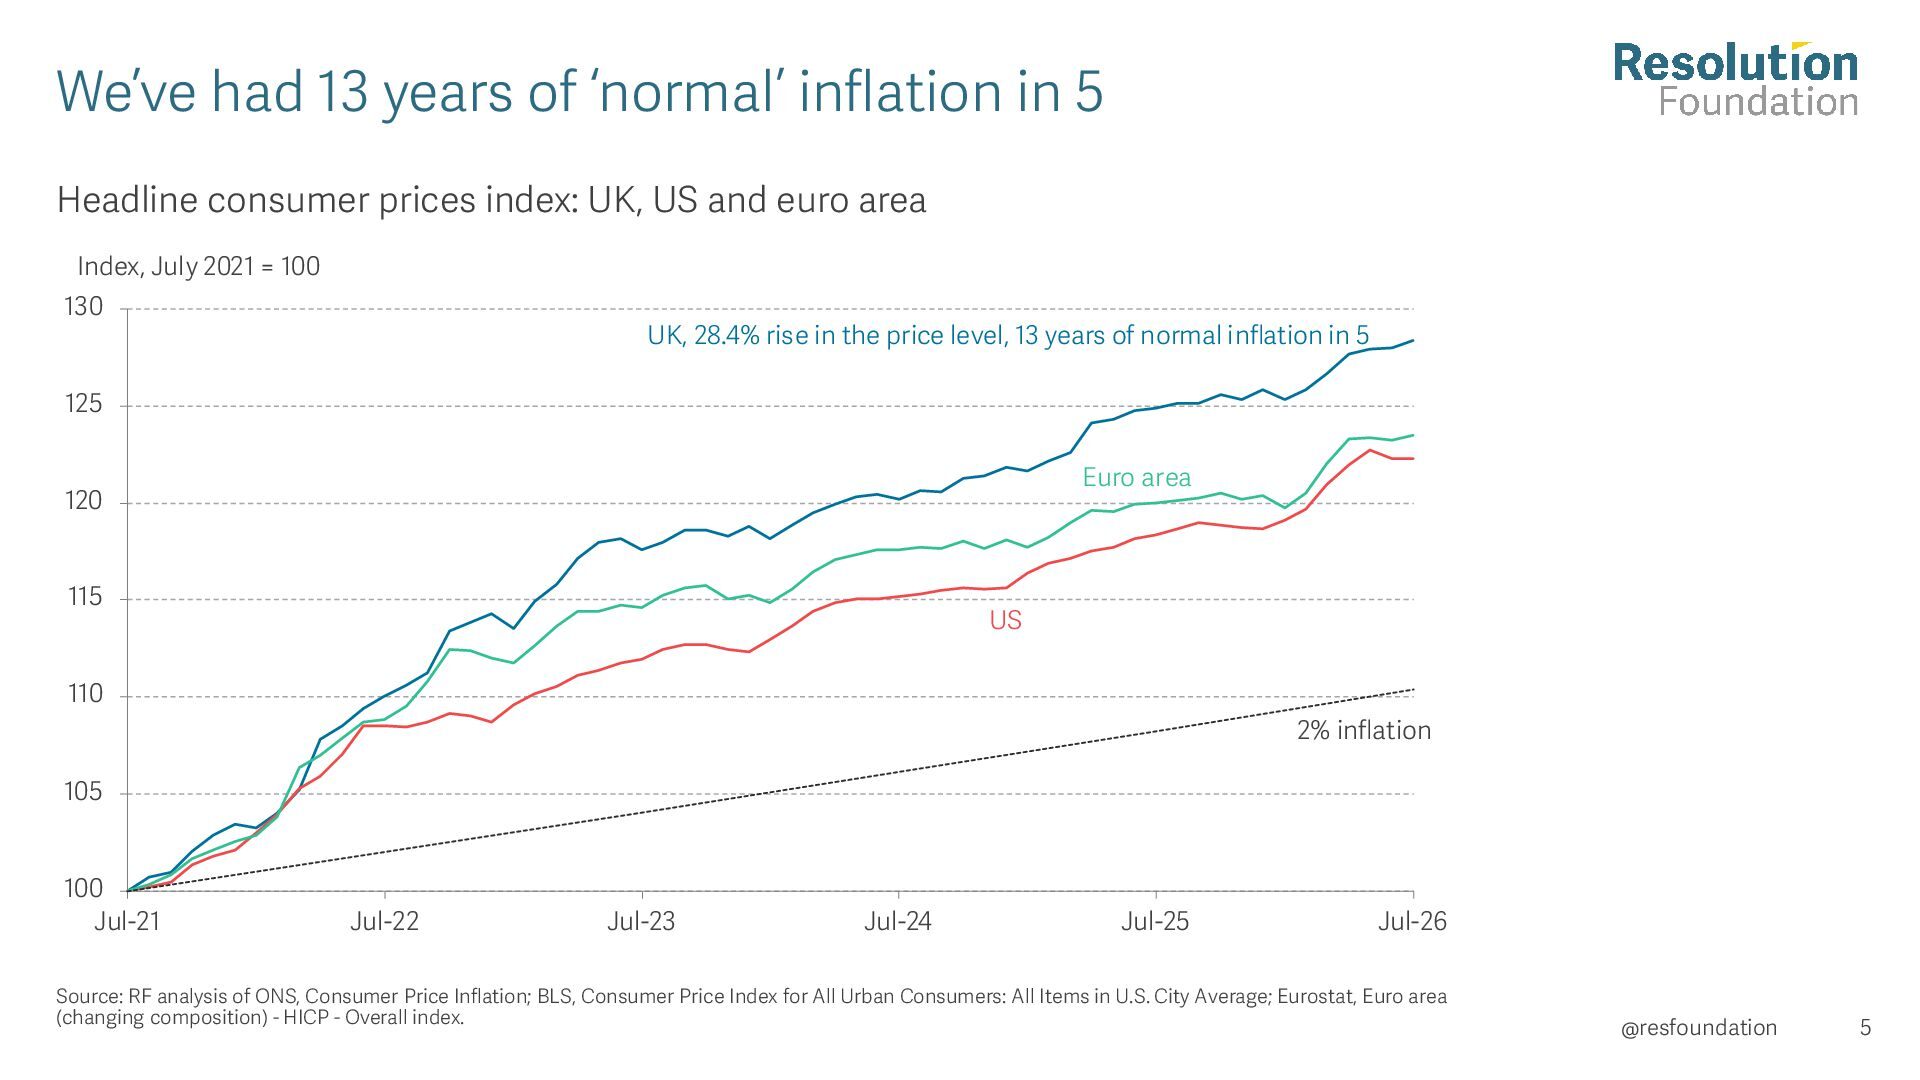
consumer prices index: UK, US and euro area Index, July 2021 = 100 130 UK, 28.4% rise in the price level, 13 years of normal inflation in 5 125 Euro area 120 115 US 110 2% inflation 105 100 Jul-21 Jul-22 Jul-23 Jul-24 Jul-25 Jul-26 Source: RF analysis of ONS, Consumer Price Inflation; BLS, Consumer Price Index for All Urban Consumers: All Items in U.S. City Average; Eurostat, Euro area (changing composition) - HICP - Overall index. @resfoundation 5
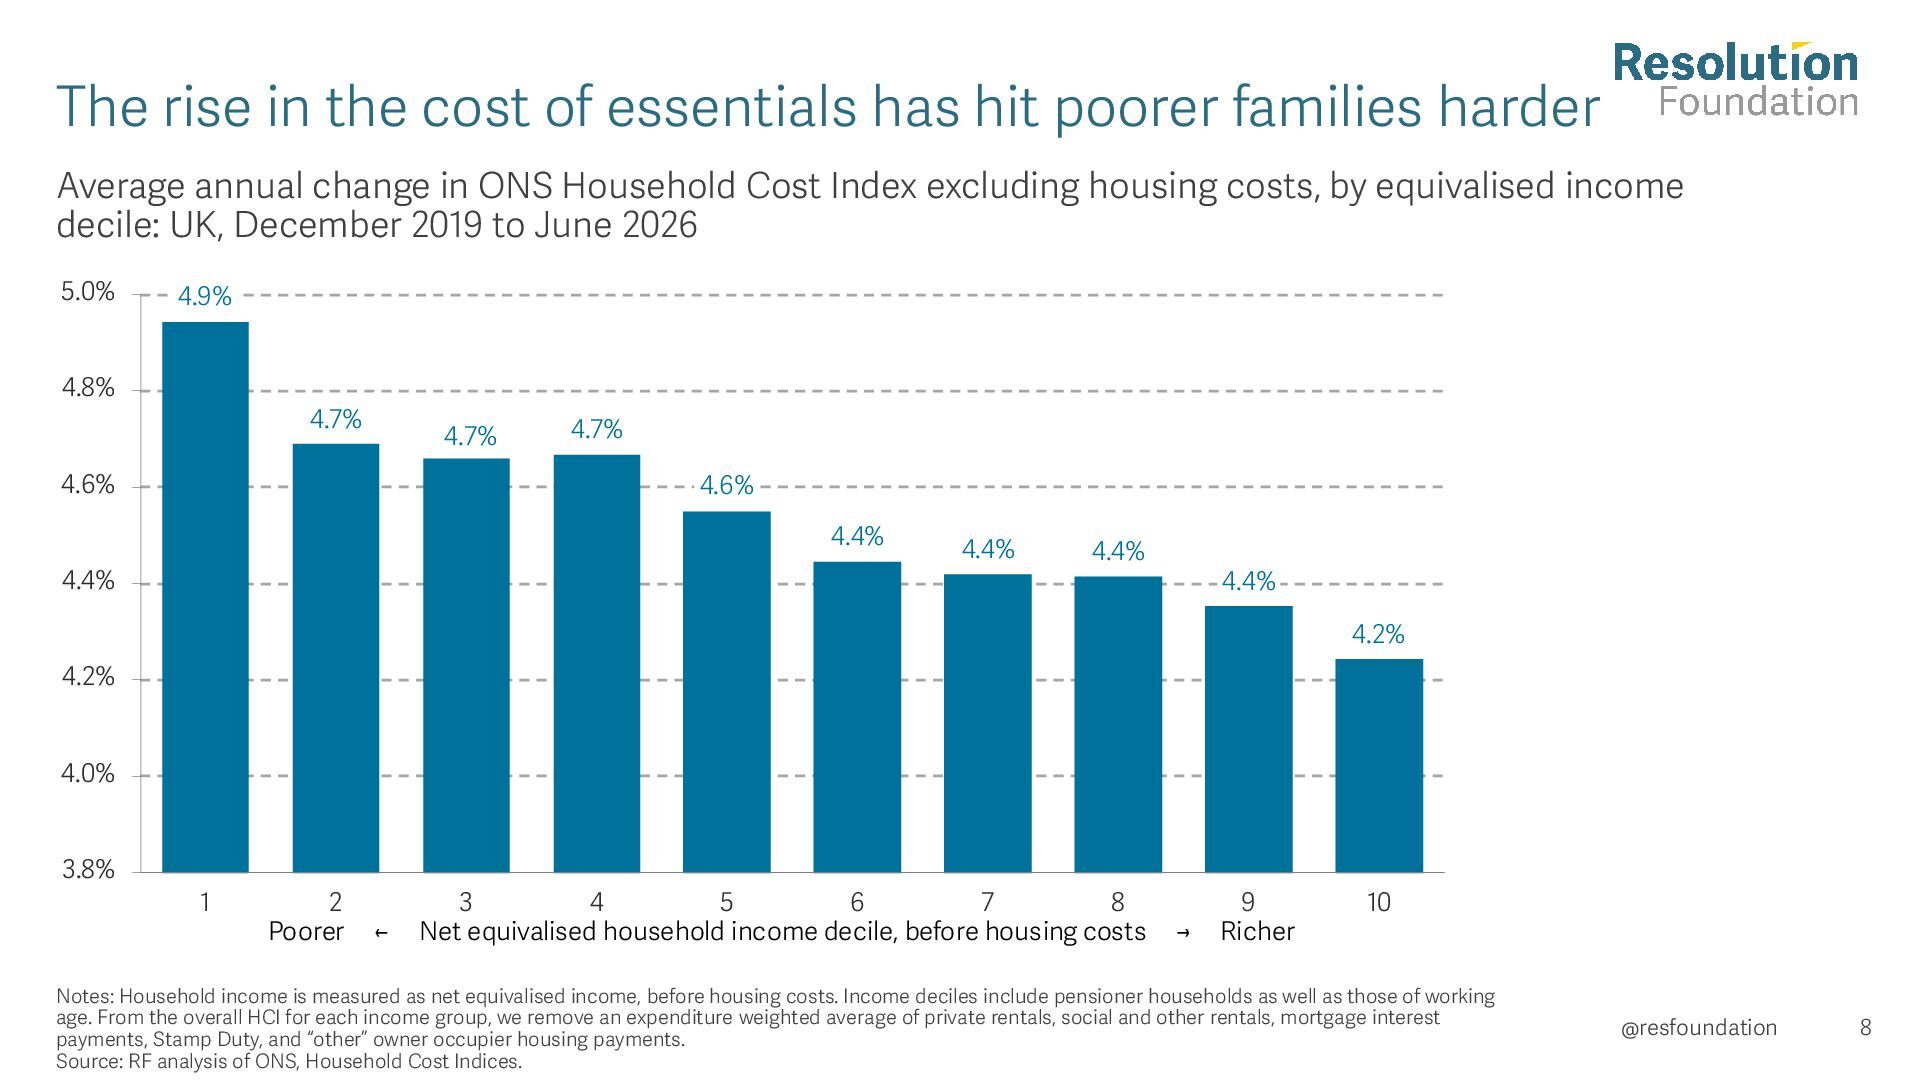
families harder Average annual change in ONS Household Cost Index excluding housing costs, by equivalised income decile: UK, December 2019 to June 2026 5.0% 4.9% 4.8% 4.7% 4.7% 4.6% 4.7% 4.6% 4.4% 4.4% 4.4% 4.4% 4.4% 4.2% 4.2% 4.0% 3.8% 1 2 Poorer ← 3 4 5 6 7 8 Net equivalised household income decile, before housing costs → 9 Richer 10 Notes: Household income is measured as net equivalised income, before housing costs. Income deciles include pensioner households as well as those of working age. From the overall HCI for each income group, we remove an expenditure weighted average of private rentals, social and other rentals, mortgage interest payments, Stamp Duty, and “other” owner occupier housing payments. Source: RF analysis of ONS, Household Cost Indices. @resfoundation 8
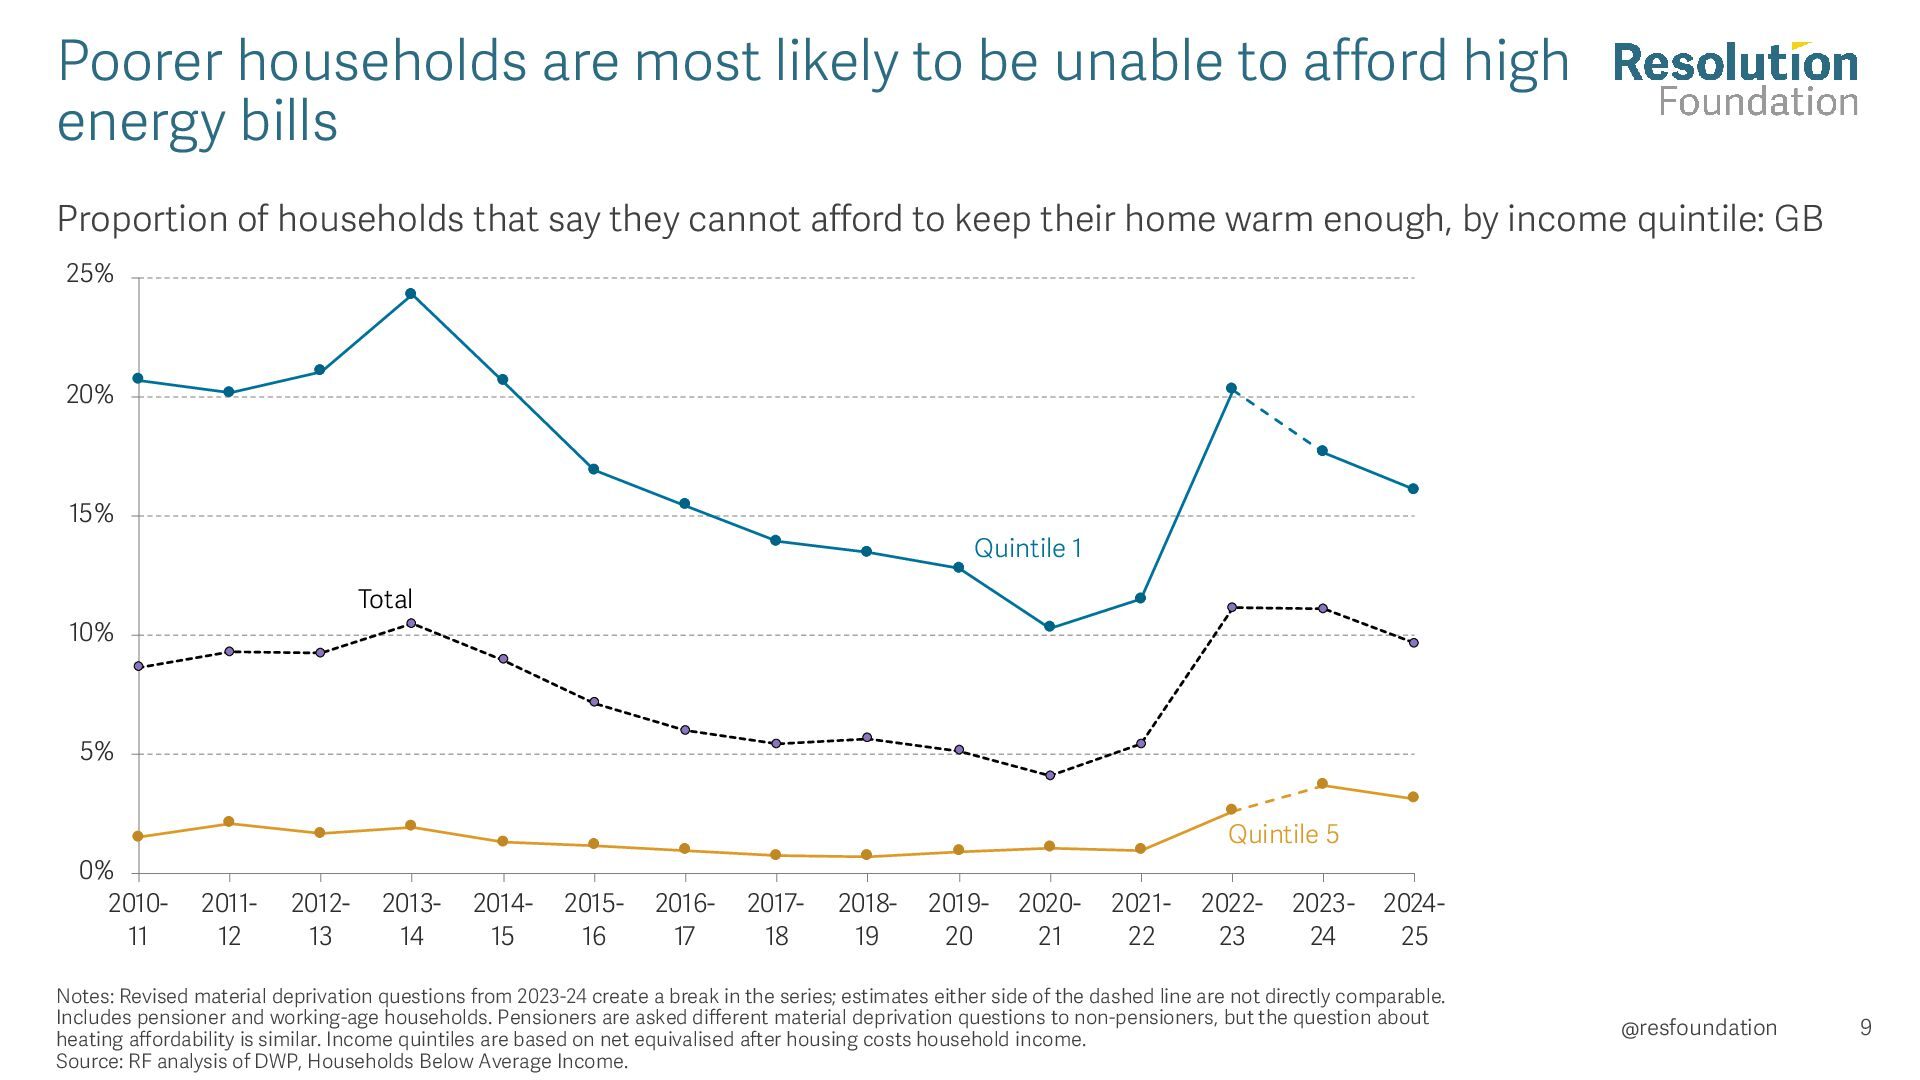
high energy bills Proportion of households that say they cannot afford to keep their home warm enough, by income quintile: GB 25% 20% 15% Quintile 1 Total 10% 5% Quintile 5 0% 201011 201112 201213 201314 201415 201516 201617 201718 201819 201920 202021 202122 202223 202324 202425 Notes: Revised material deprivation questions from 2023-24 create a break in the series; estimates either side of the dashed line are not directly comparable. Includes pensioner and working-age households. Pensioners are asked different material deprivation questions to non-pensioners, but the question about heating affordability is similar. Income quintiles are based on net equivalised after housing costs household income. Source: RF analysis of DWP, Households Below Average Income. @resfoundation 9
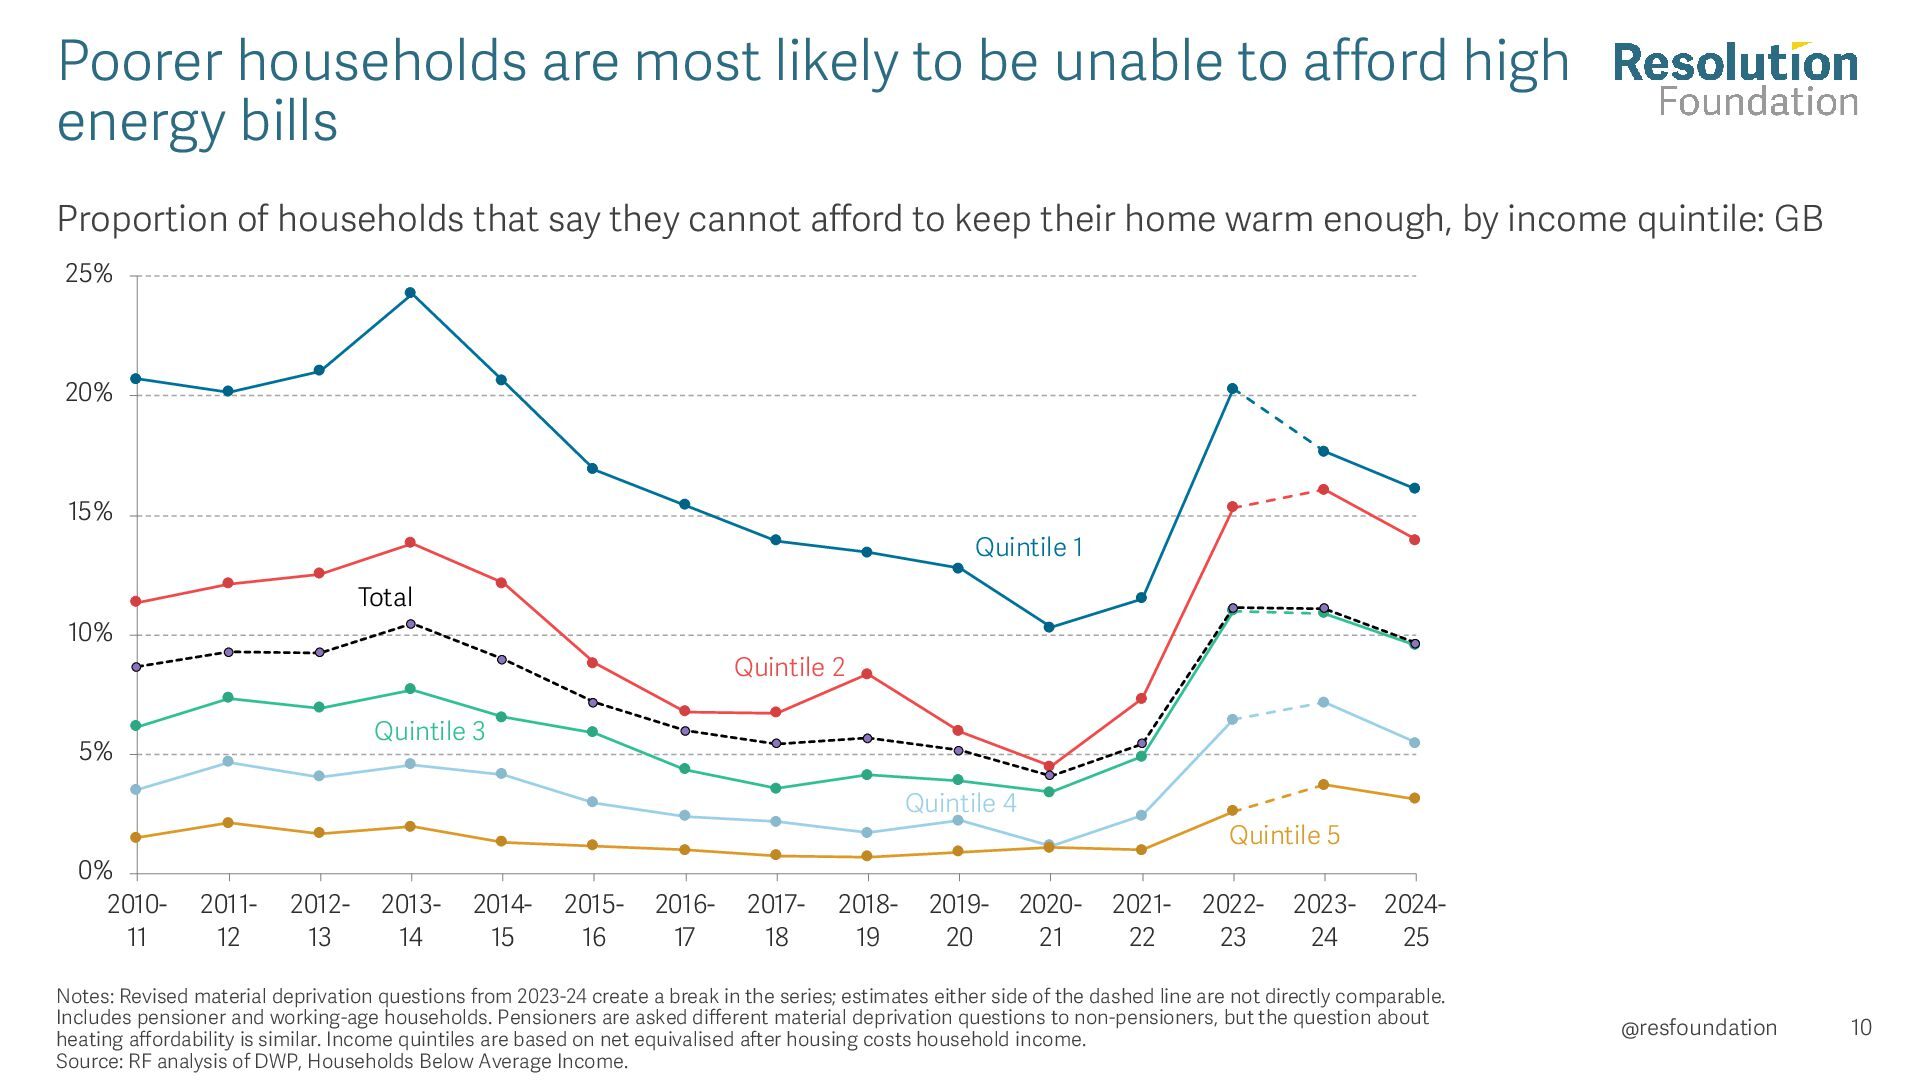
high energy bills Proportion of households that say they cannot afford to keep their home warm enough, by income quintile: GB 25% 20% 15% Quintile 1 Total 10% Quintile 2 Quintile 3 5% Quintile 4 0% 201011 201112 201213 201314 201415 201516 201617 201718 201819 201920 Quintile 5 202021 202122 202223 202324 202425 Notes: Revised material deprivation questions from 2023-24 create a break in the series; estimates either side of the dashed line are not directly comparable. Includes pensioner and working-age households. Pensioners are asked different material deprivation questions to non-pensioners, but the question about heating affordability is similar. Income quintiles are based on net equivalised after housing costs household income. Source: RF analysis of DWP, Households Below Average Income. @resfoundation 10
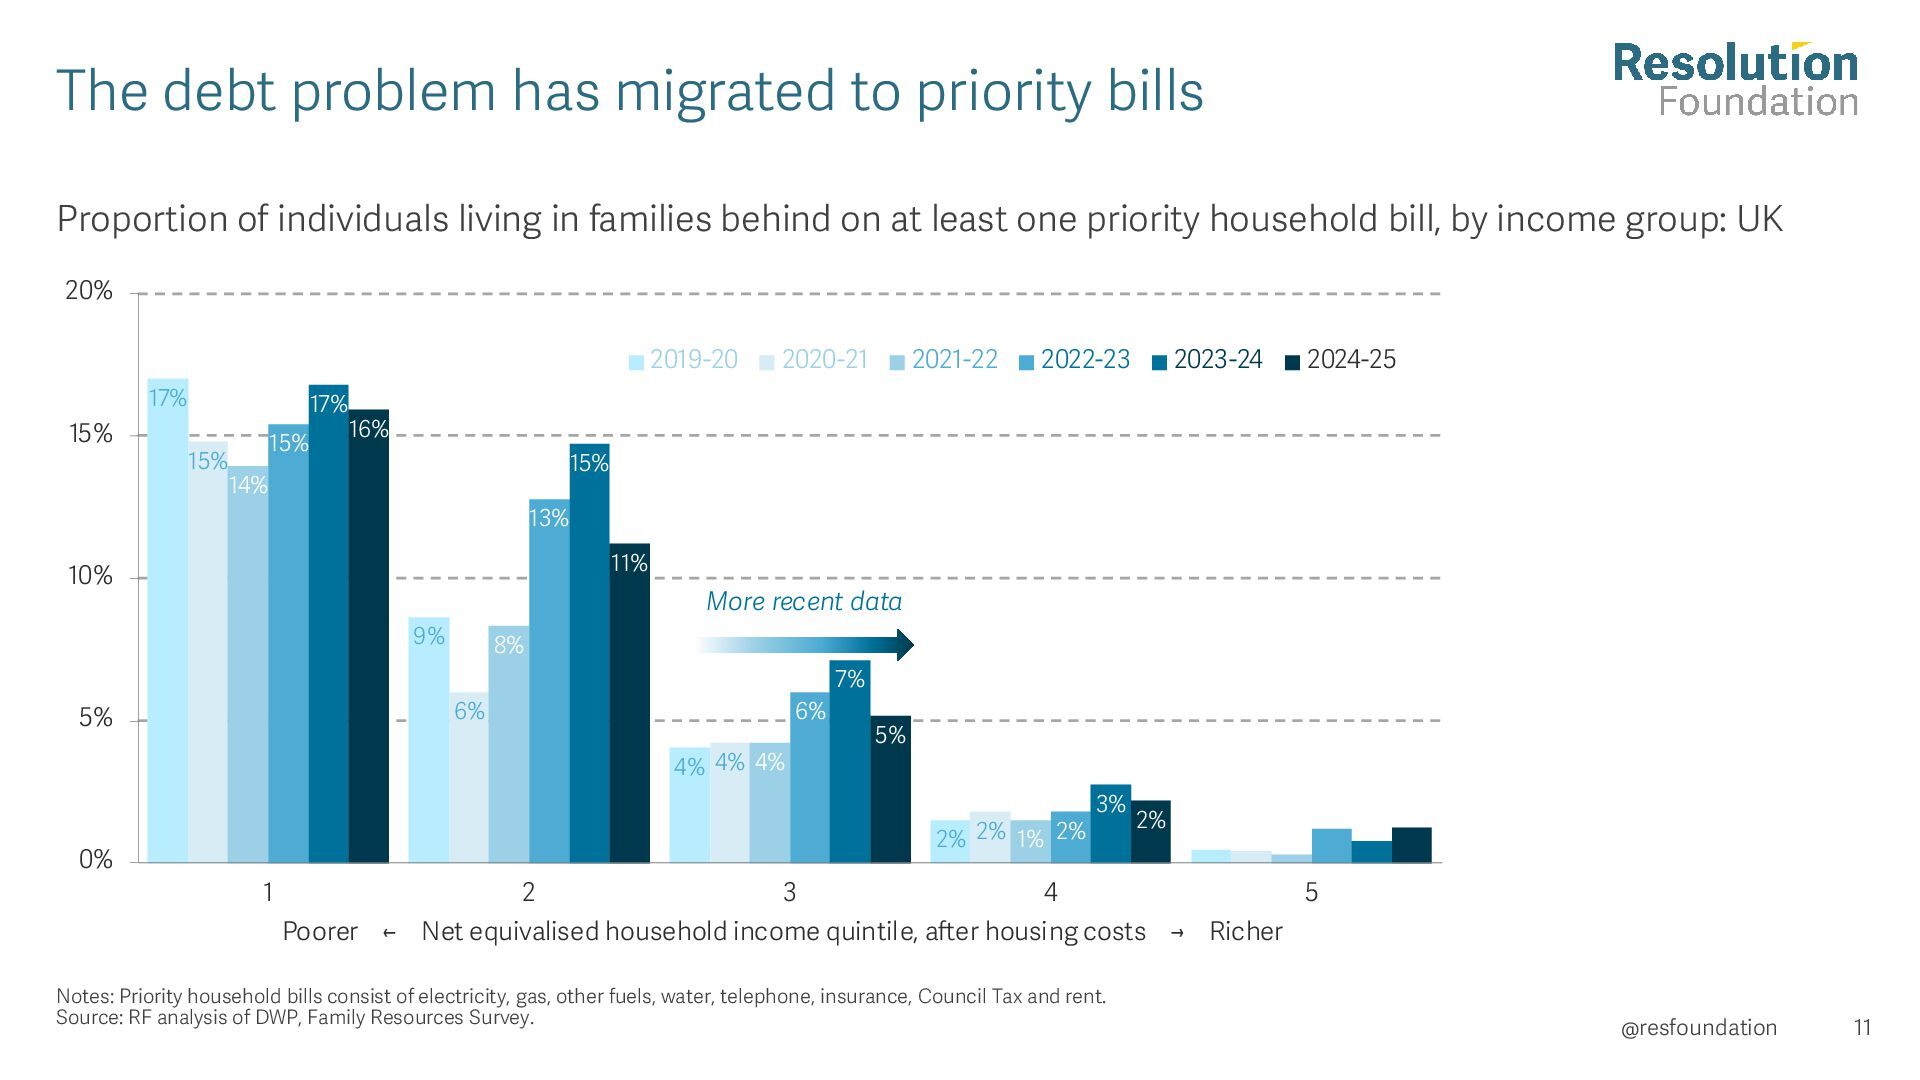
individuals living in families behind on at least one priority household bill, by income group: UK 20% 2019-20 17% 15% 17% 15% 2020-21 2021-22 2022-23 2023-24 2024-25 16% 15% 14% 15% 13% 11% 10% More recent data 9% 8% 7% 6% 5% 6% 4% 4% 4% 0% 5% 2% 2% 1% 2% 1 3% 2% 0% 2 3 4 5 Poorer ← Net equivalised household income quintile, after housing costs → Richer Notes: Priority household bills consist of electricity, gas, other fuels, water, telephone, insurance, Council Tax and rent. Source: RF analysis of DWP, Family Resources Survey. @resfoundation 11
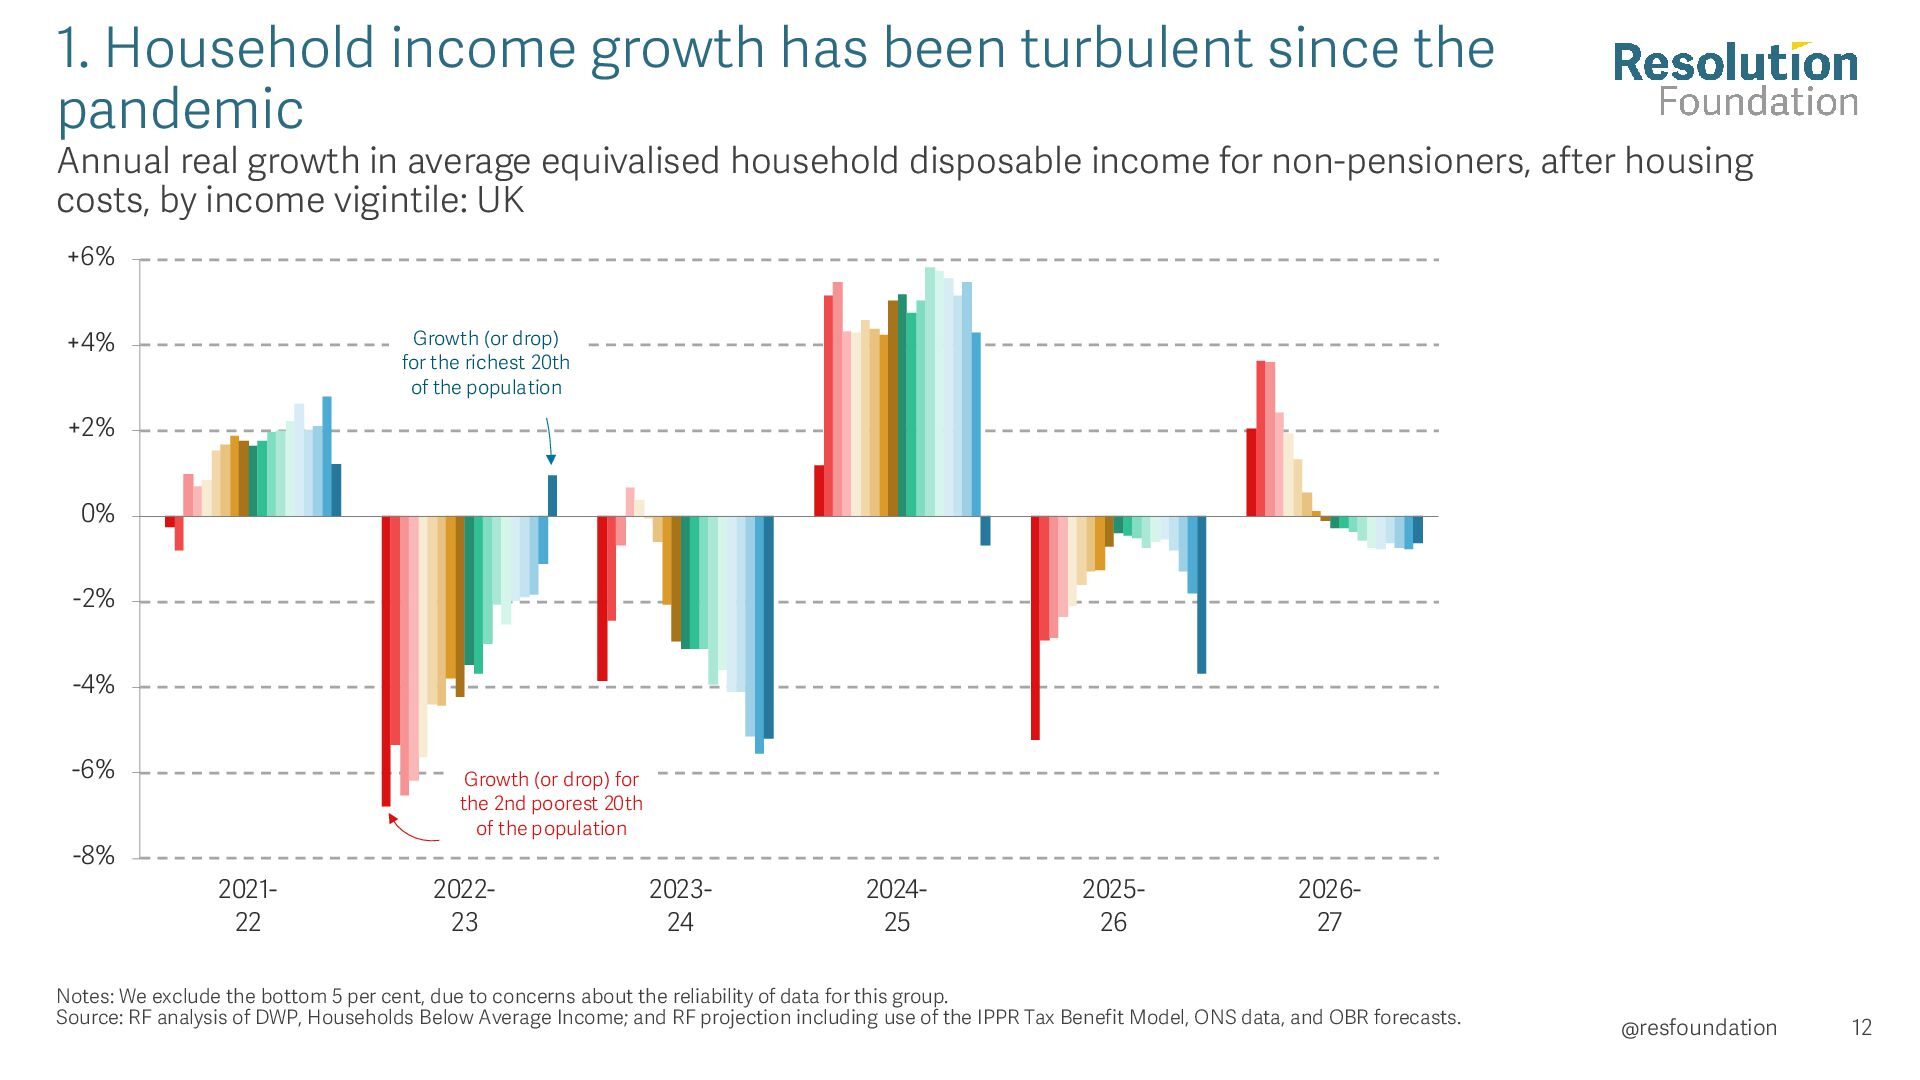
Annual real growth in average equivalised household disposable income for non-pensioners, after housing costs, by income vigintile: UK +6% +4% Growth (or drop) for the richest 20th of the population +2% 0% -2% -4% -6% -8% Growth (or drop) for the 2nd poorest 20th of the population 202122 202223 202324 202425 202526 202627 Notes: We exclude the bottom 5 per cent, due to concerns about the reliability of data for this group. Source: RF analysis of DWP, Households Below Average Income; and RF projection including use of the IPPR Tax Benefit Model, ONS data, and OBR forecasts. @resfoundation 12
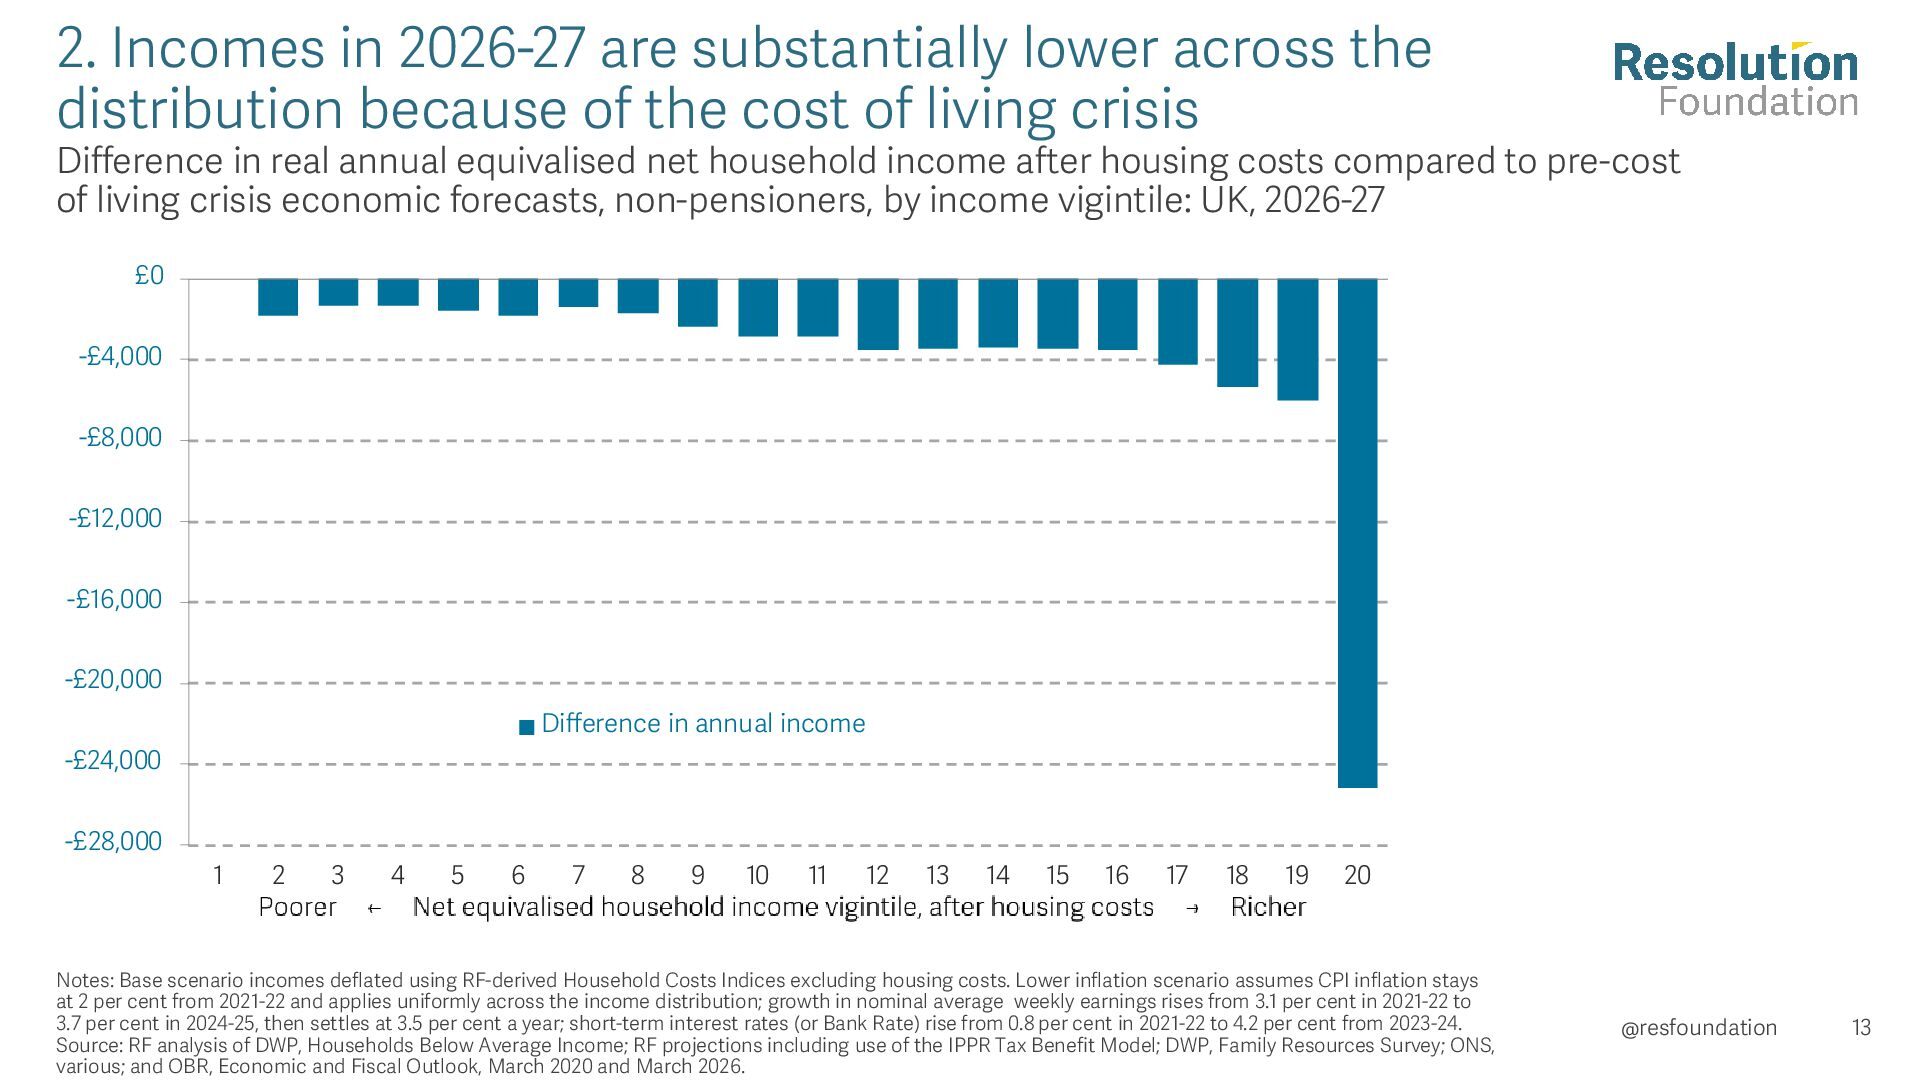
because of the cost of living crisis Difference in real annual equivalised net household income after housing costs compared to pre-cost of living crisis economic forecasts, non-pensioners, by income vigintile: UK, 2026-27 £0 -£4,000 -£8,000 -£12,000 -£16,000 -£20,000 Difference in annual income -£24,000 -£28,000 1 2 3 4 5 6 7 8 9 10 11 12 13 14 15 16 17 18 19 20 Notes: Base scenario incomes deflated using RF-derived Household Costs Indices excluding housing costs. Lower inflation scenario assumes CPI inflation stays at 2 per cent from 2021-22 and applies uniformly across the income distribution; growth in nominal average weekly earnings rises from 3.1 per cent in 2021-22 to 3.7 per cent in 2024-25, then settles at 3.5 per cent a year; short-term interest rates (or Bank Rate) rise from 0.8 per cent in 2021-22 to 4.2 per cent from 2023-24. Source: RF analysis of DWP, Households Below Average Income; RF projections including use of the IPPR Tax Benefit Model; DWP, Family Resources Survey; ONS, various; and OBR, Economic and Fiscal Outlook, March 2020 and March 2026. @resfoundation 13
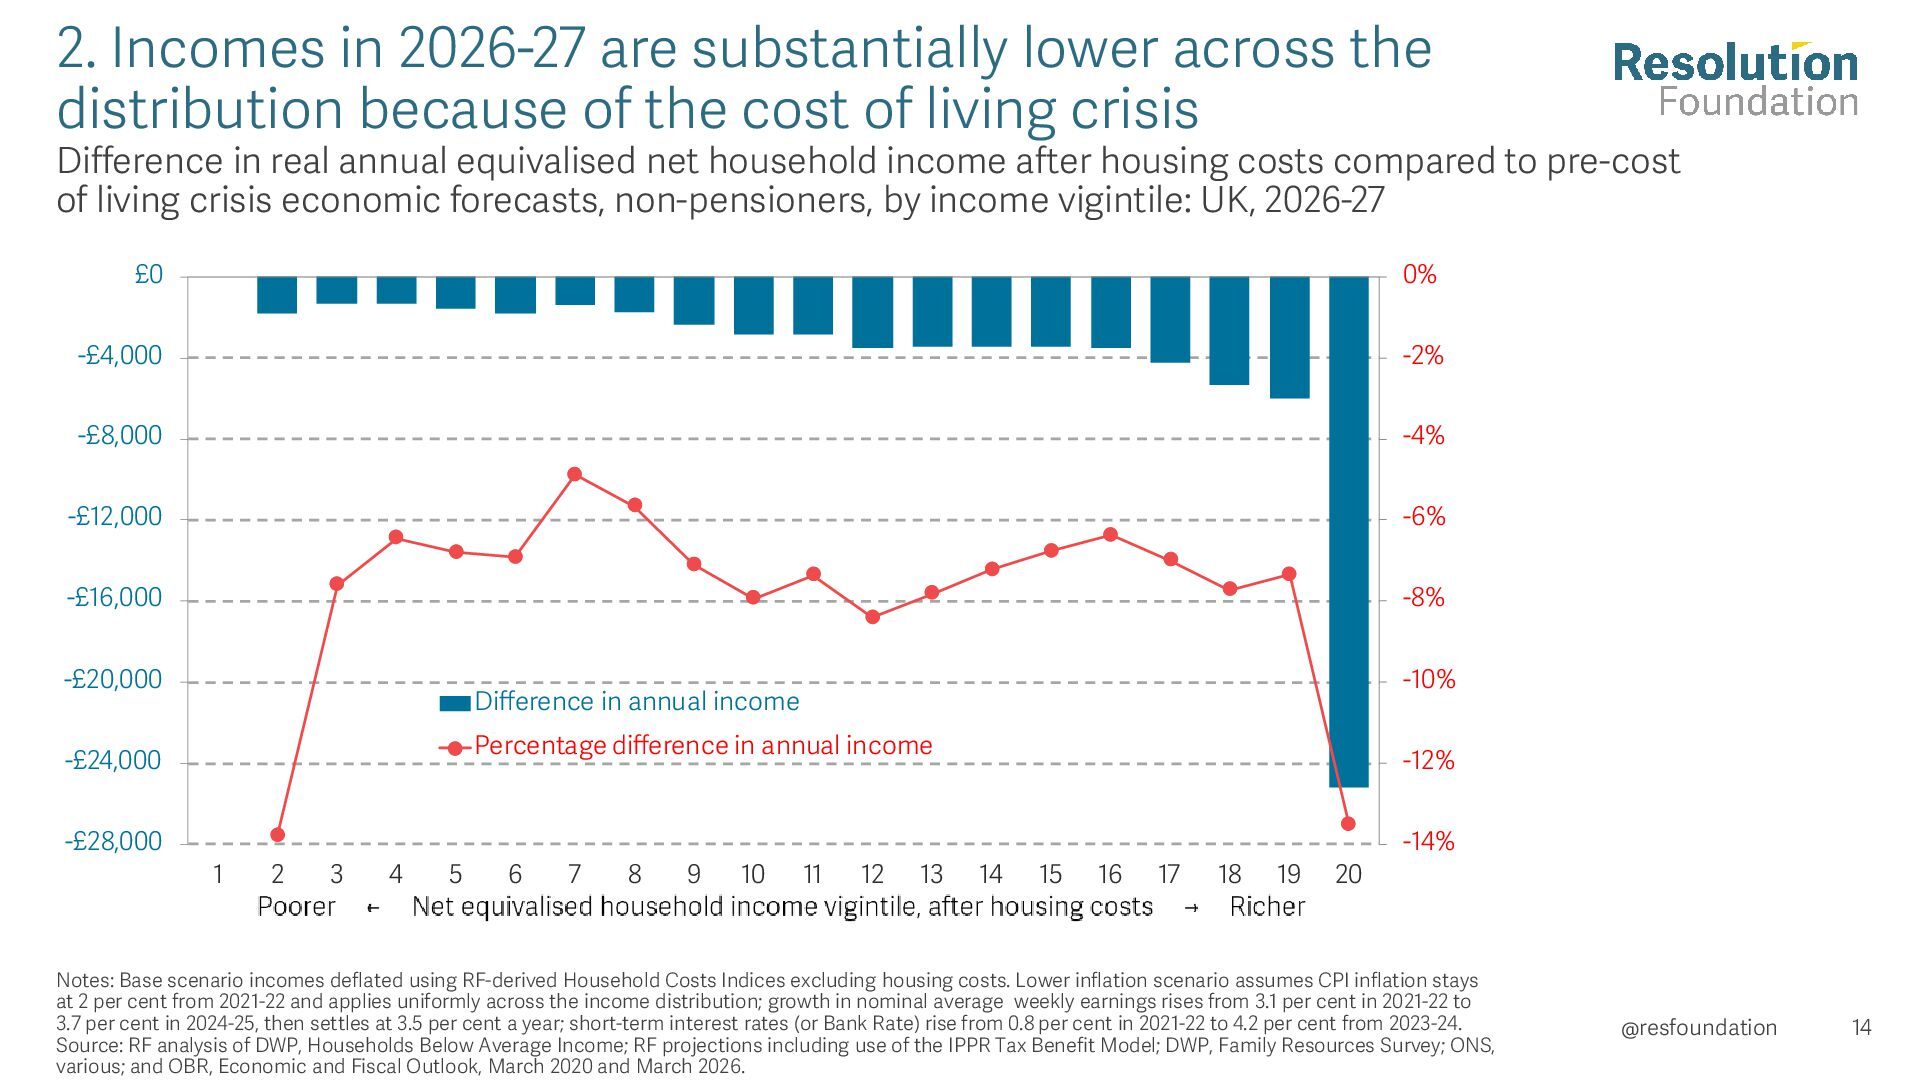
because of the cost of living crisis Difference in real annual equivalised net household income after housing costs compared to pre-cost of living crisis economic forecasts, non-pensioners, by income vigintile: UK, 2026-27 £0 0% -£4,000 -2% -£8,000 -4% -£12,000 -6% -£16,000 -8% -£20,000 Percentage difference in annual income -£24,000 -£28,000 -10% Difference in annual income 1 2 3 4 5 6 7 8 9 10 11 12 13 -12% 14 15 16 17 18 19 20 -14% Notes: Base scenario incomes deflated using RF-derived Household Costs Indices excluding housing costs. Lower inflation scenario assumes CPI inflation stays at 2 per cent from 2021-22 and applies uniformly across the income distribution; growth in nominal average weekly earnings rises from 3.1 per cent in 2021-22 to 3.7 per cent in 2024-25, then settles at 3.5 per cent a year; short-term interest rates (or Bank Rate) rise from 0.8 per cent in 2021-22 to 4.2 per cent from 2023-24. Source: RF analysis of DWP, Households Below Average Income; RF projections including use of the IPPR Tax Benefit Model; DWP, Family Resources Survey; ONS, various; and OBR, Economic and Fiscal Outlook, March 2020 and March 2026. @resfoundation 14
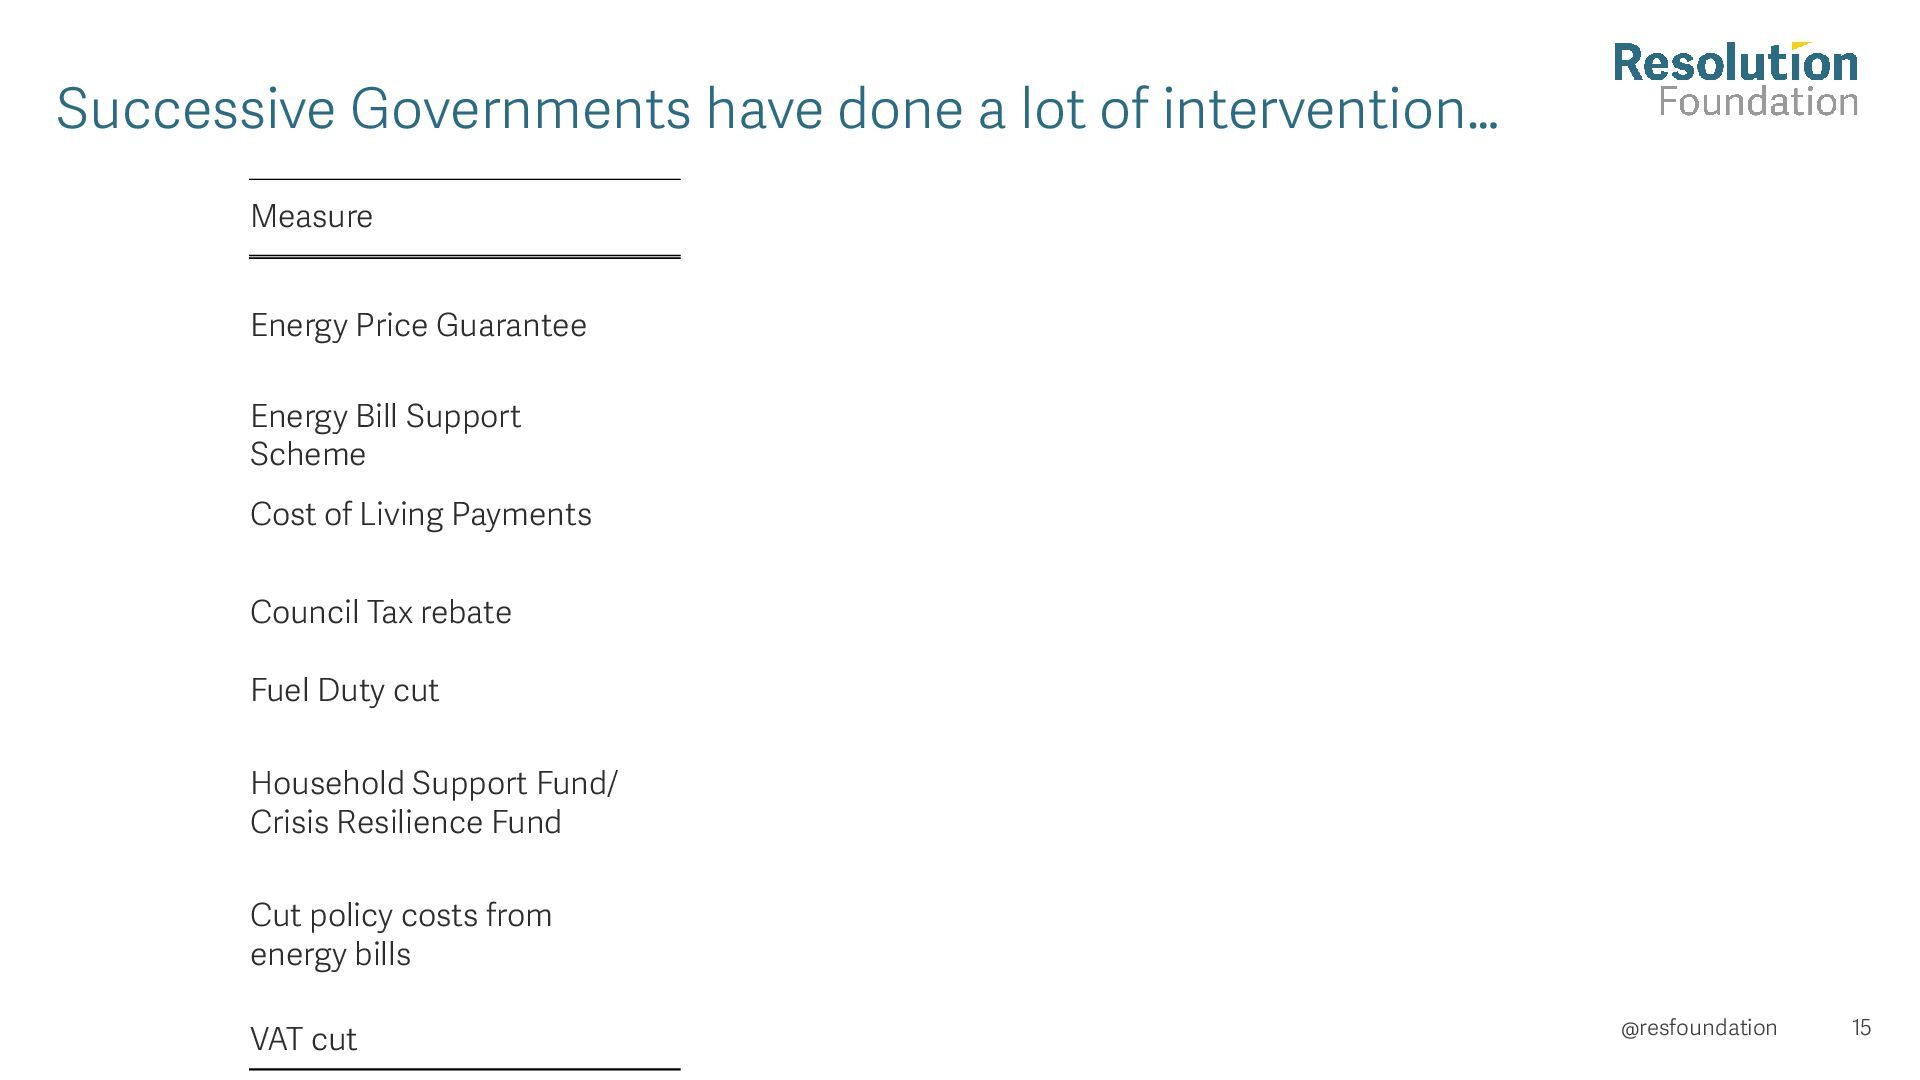
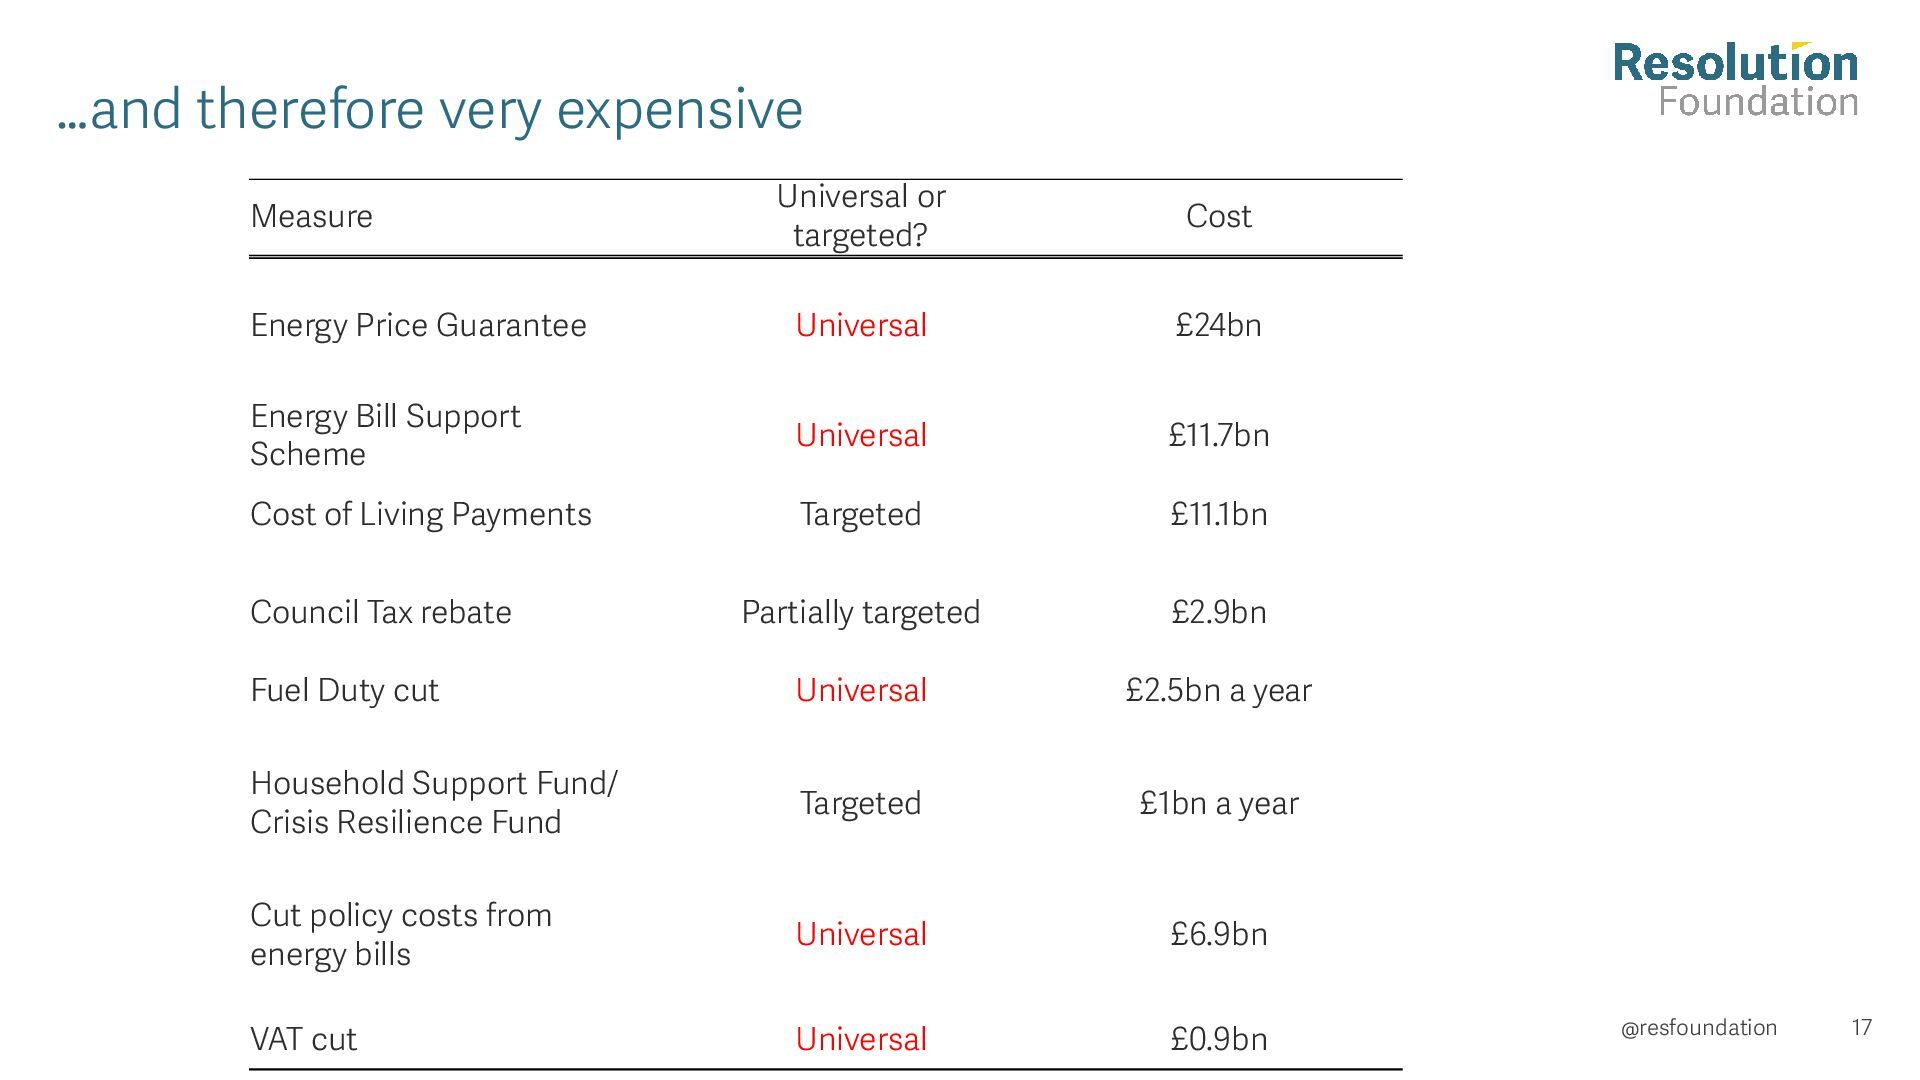
or targeted? Cost Energy Price Guarantee Universal £24bn Energy Bill Support Scheme Universal £11.7bn Cost of Living Payments Targeted £11.1bn Partially targeted £2.9bn Fuel Duty cut Universal £2.5bn a year Household Support Fund/ Crisis Resilience Fund Targeted £1bn a year Cut policy costs from energy bills Universal £6.9bn VAT cut Universal £0.9bn Council Tax rebate @resfoundation 15
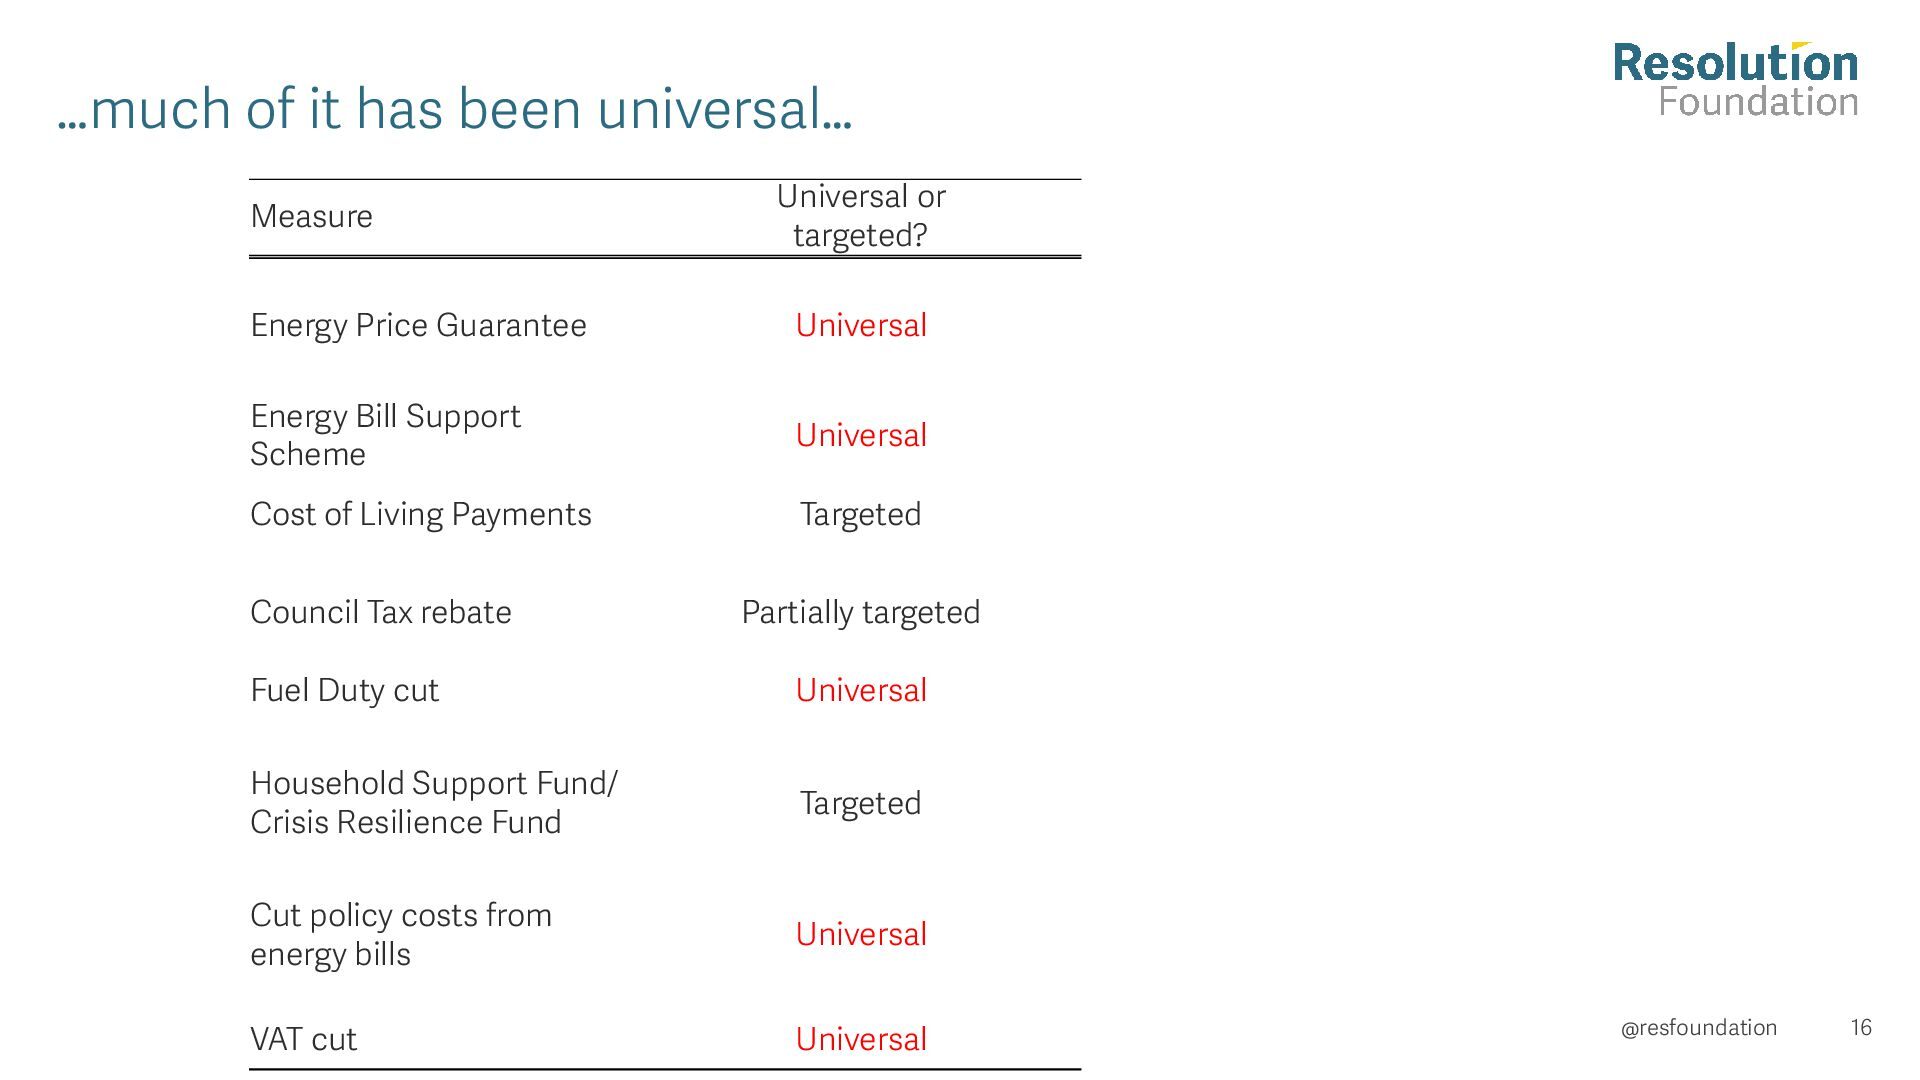
Cost Energy Price Guarantee Universal £24bn Energy Bill Support Scheme Universal £11.7bn Cost of Living Payments Targeted £11.1bn Partially targeted £2.9bn Fuel Duty cut Universal £2.5bn a year Household Support Fund/ Crisis Resilience Fund Targeted £1bn a year Cut policy costs from energy bills Universal £6.9bn VAT cut Universal £0.9bn Council Tax rebate @resfoundation 16
Price Guarantee Universal £24bn Energy Bill Support Scheme Universal £11.7bn Cost of Living Payments Targeted £11.1bn Partially targeted £2.9bn Fuel Duty cut Universal £2.5bn a year Household Support Fund/ Crisis Resilience Fund Targeted £1bn a year Cut policy costs from energy bills Universal £6.9bn VAT cut Universal £0.9bn Council Tax rebate @resfoundation 17
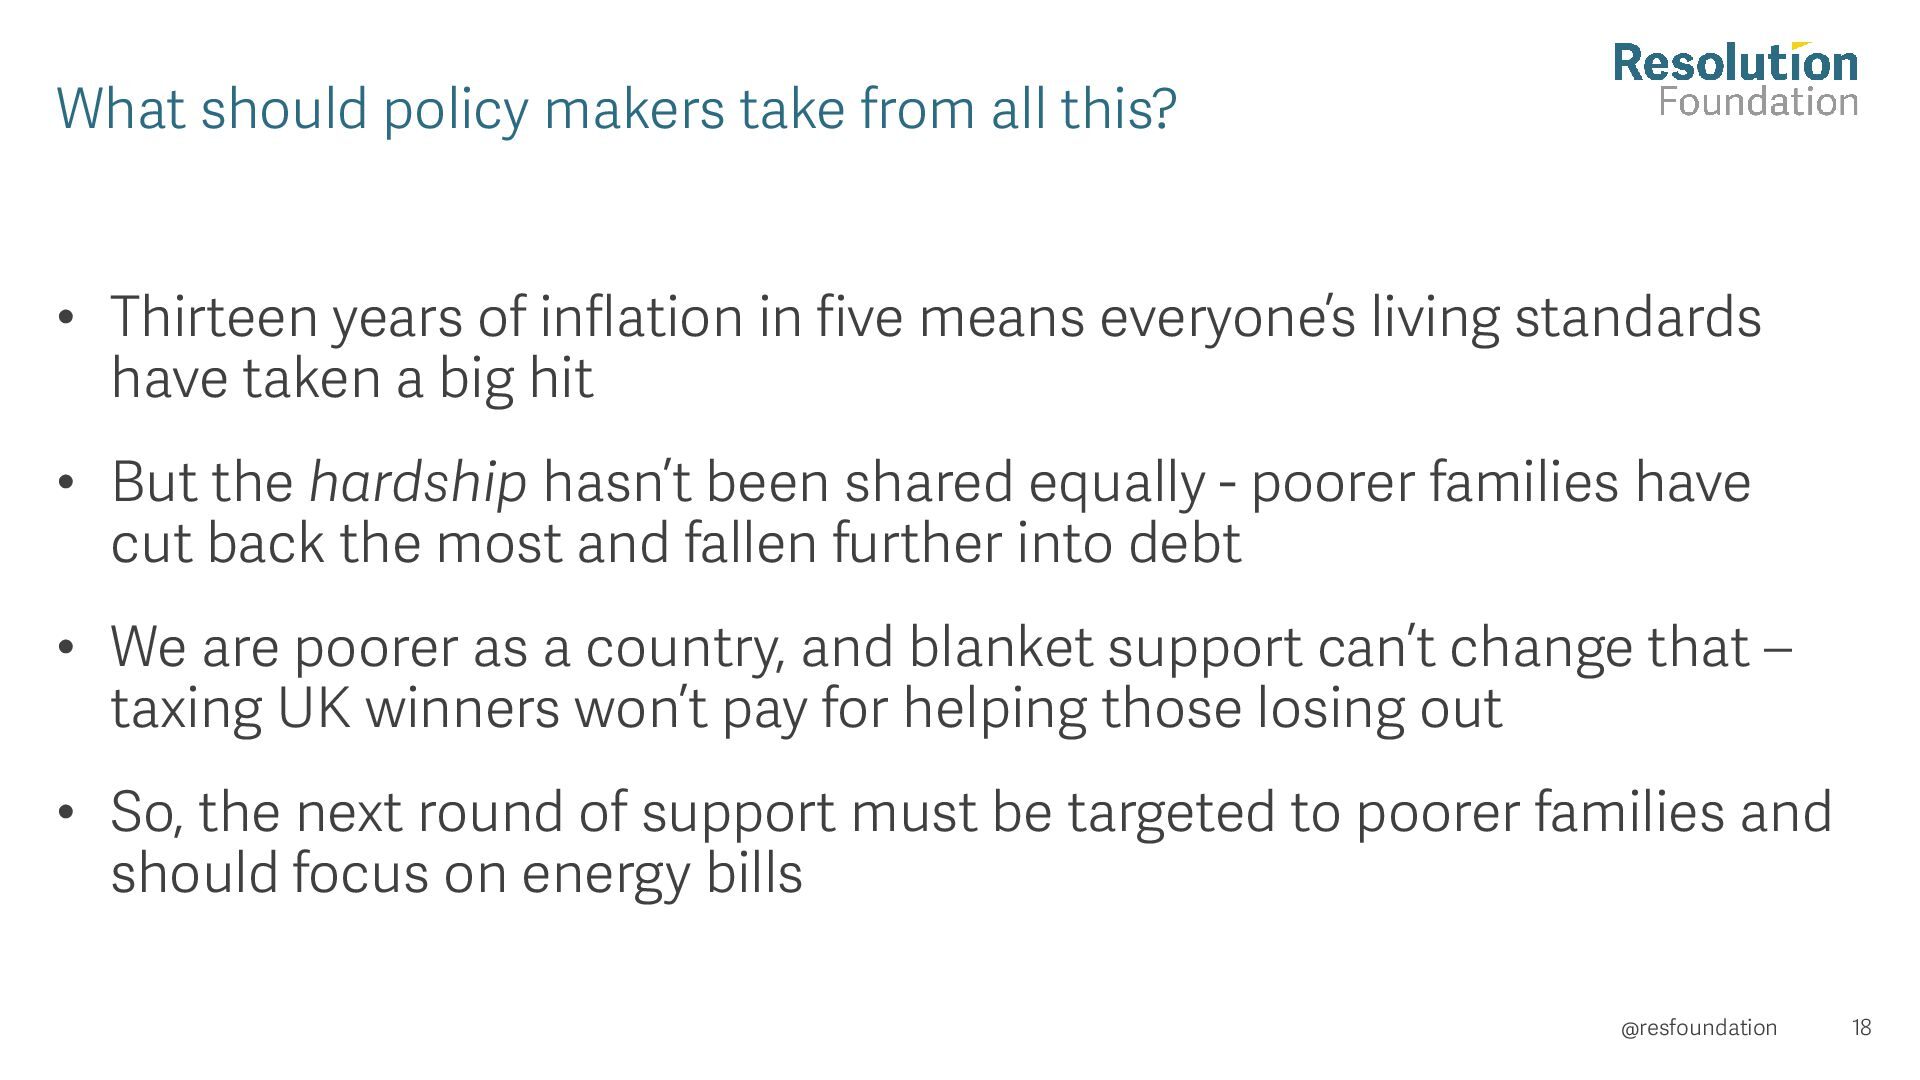
years of inflation in five means everyone’s living standards have taken a big hit • But the hardship hasn’t been shared equally - poorer families have cut back the most and fallen further into debt • We are poorer as a country, and blanket support can’t change that – taxing UK winners won’t pay for helping those losing out • So, the next round of support must be targeted to poorer families and should focus on energy bills @resfoundation 18
living concerns in the Budget? Mary Starks, VP Regulation, Risk and Policy at Ovo Energy Alfie Stirling, Director of Insight and Policy at JRF Ruwani Purcell, Director of External Affairs at Citizens Advice Alex Clegg, Senior Economist at the Resolution Foundation Chair: Mike Brewer, Deputy Chief Executive, Resolution Foundation W if i 2QAG_Guest Welcome_Guests @resfoundation #LongCrunch October 26


 beale
beale
 maggiecrowley
 eitanlees
 watany
 baasie
 oripsolob
 morganepeng
 lara
lara
 jonyablonski
 mza
mza
 marketingsoph
 philnash
 schlessera