Upgrade to Pro — share decks privately, control downloads, hide ads and more …

Visualizing Data with HTML5 Dashboards for Real...

Visualizing Data with HTML5 Dashboards for Real-Time Action

Delivered at DevCon5 in New York City, August 3rd 2016.

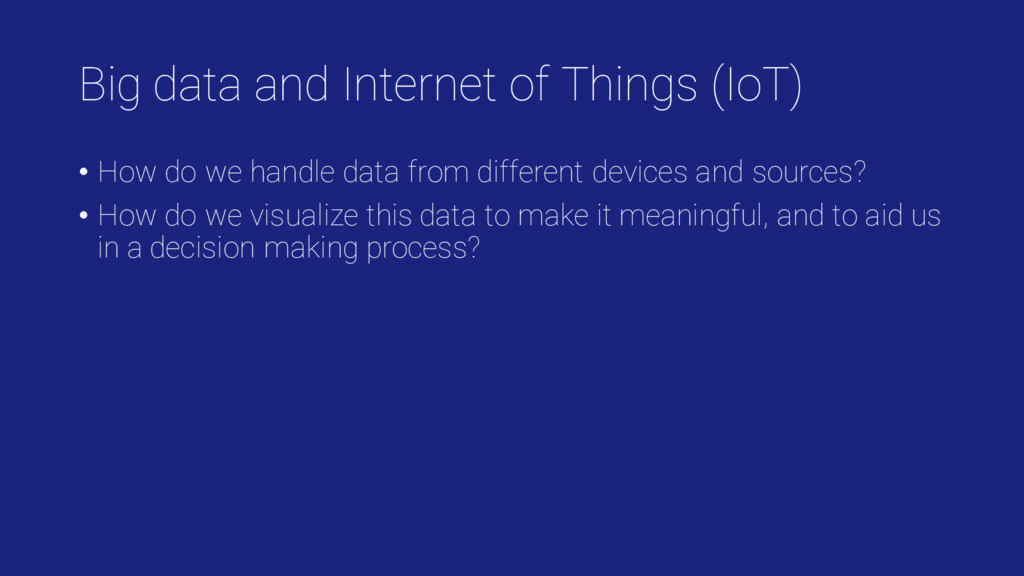
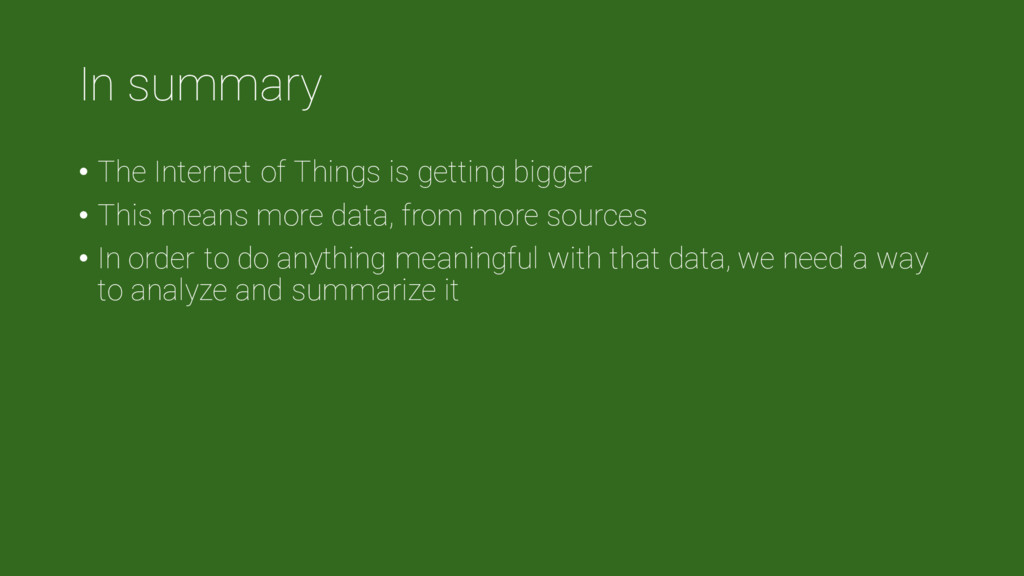
Big data and Internet of Things (IoT) connectivity is increasingly forcing enterprises to find solutions to organize and visualize massive amounts of incoming data.

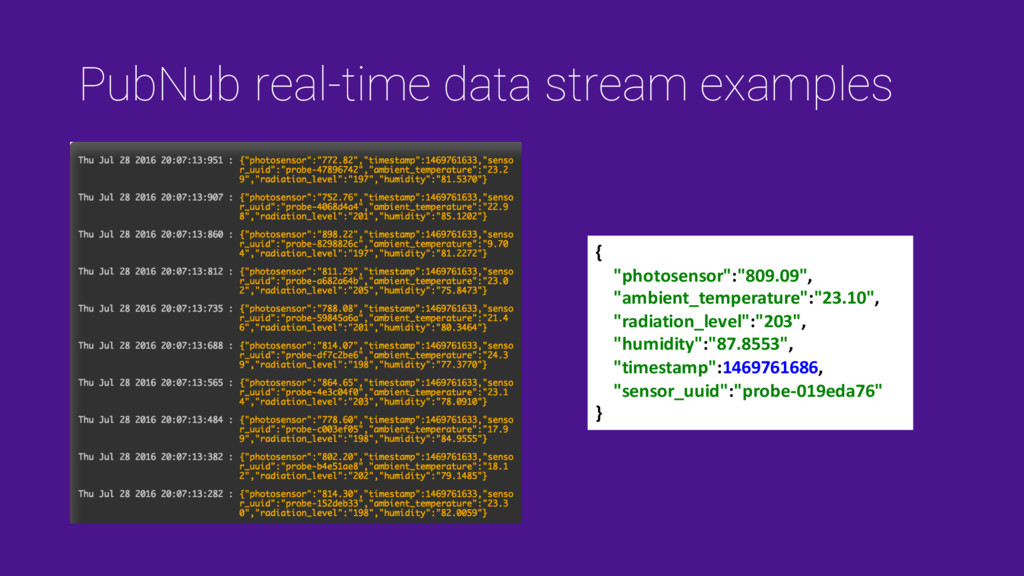
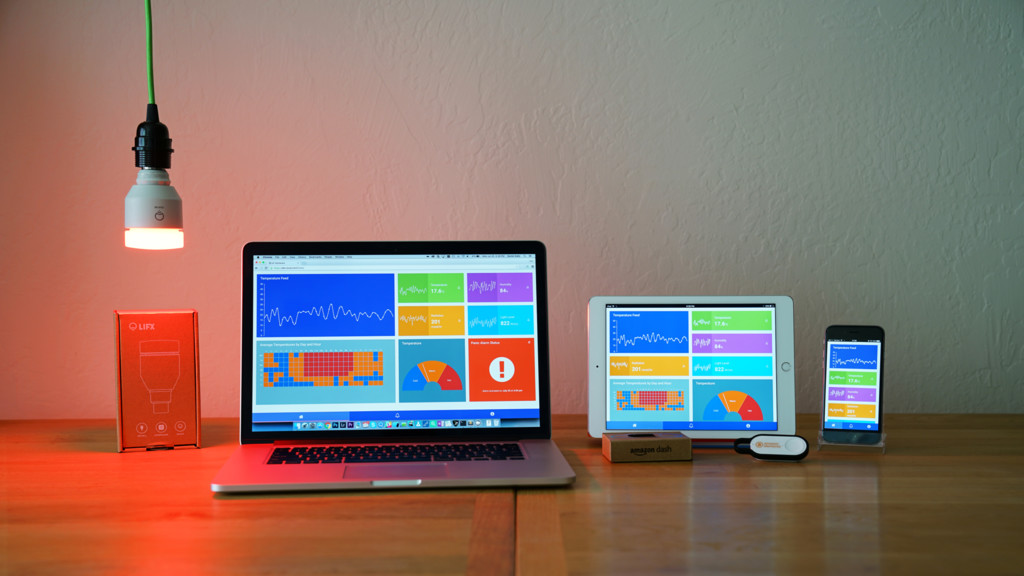
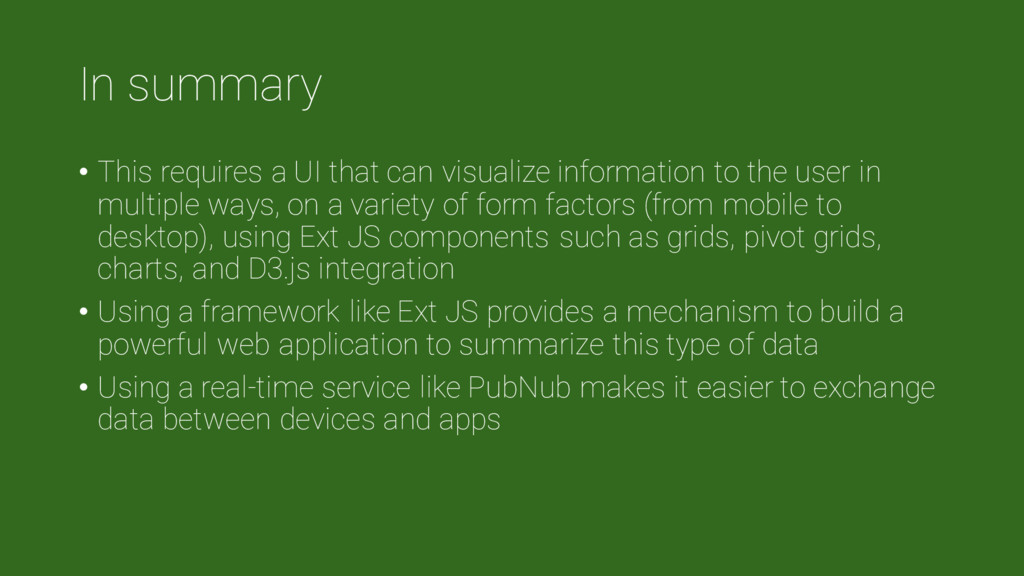
To allow for rapid decision-making, for everything from immediate actions in tactical situations to strategic analysis and reporting, developers need the ability to provide re-configurable dashboard widgets that can discover and visualize critical insights from all that data, on any screen and device.

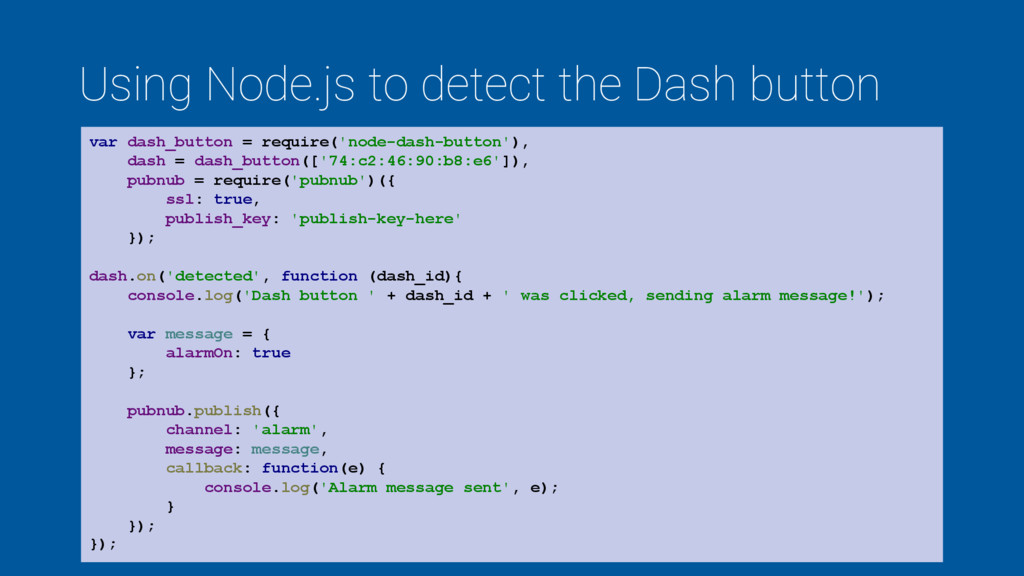
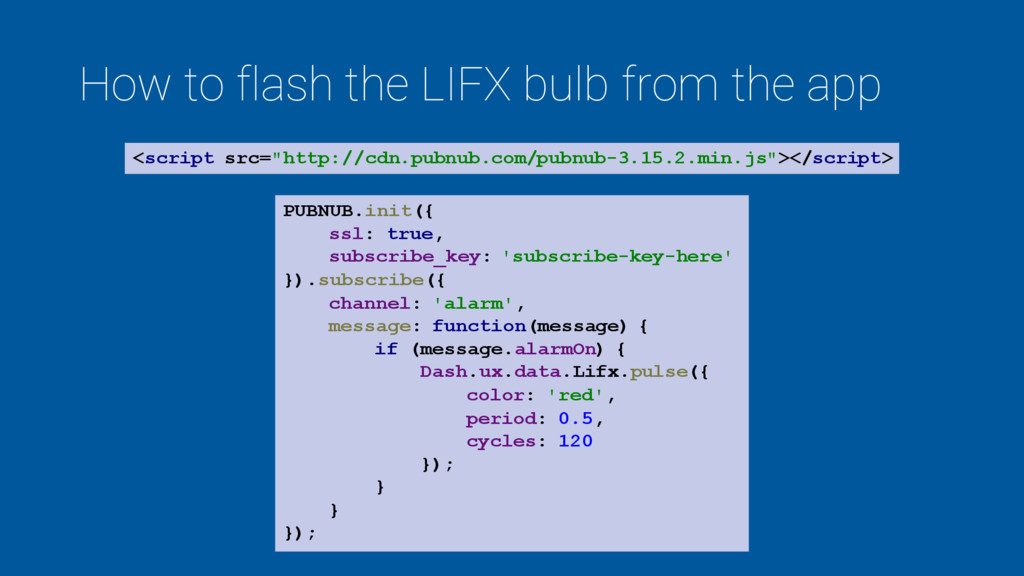
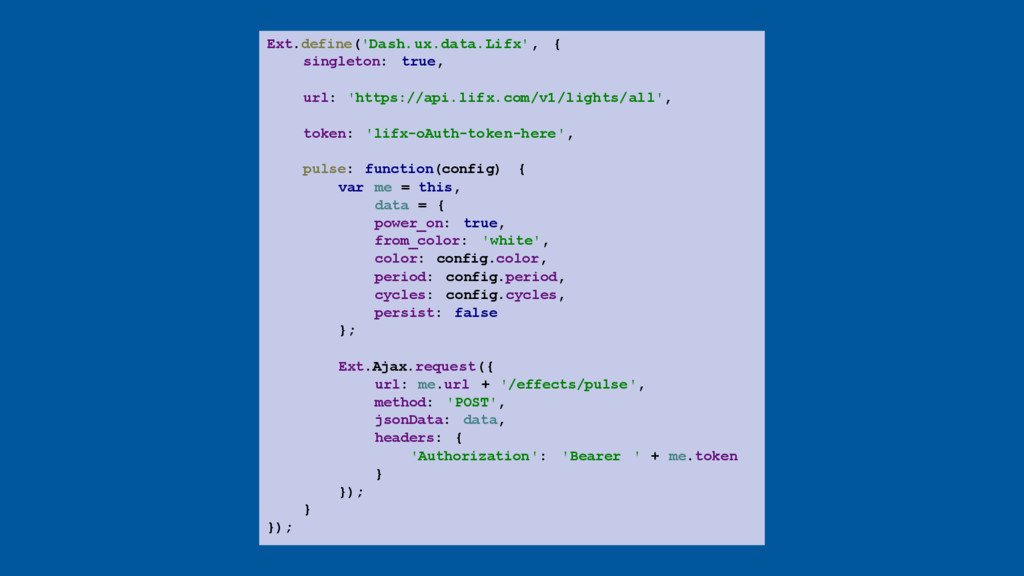
This session will discuss how to create HTML5 dashboards that provide big data analysis capabilities and interact with IoT devices via Ext JS constructed components like Grids, Charts, and Widgets.

Daniel Gallo

August 03, 2016
Tweet

More Decks by Daniel Gallo

Other Decks in Technology

Transcript

  1. Dan Gallo • Technical Sales Engineer at Sencha • Background

    in web app development speakerdeck.com/danielgallo @DanielJGallo
  2. Big data and Internet of Things (IoT) • How do

    we handle data from different devices and sources? • How do we visualize this data to make it meaningful, and to aid us in a decision making process?
  3. ?

  4. Internet of Things? • Linking of smart objects to the

    Internet • Physical objects that have an IP address • Exchanging of data between these things, and other Internet connected systems
  5. Internet of Things – uses • Smart homes – lighting,

    door locks, security systems, moisture sensor for leaks, smart fridges • Monitoring environment – temperature, light, humidity • Smart cities – street lighting, traffic, rail • Healthcare • Wearables
  6. Internet of Things – communication • Various communication methods may

    be used: Technology Distance Speed Bluetooth 50-150 m / 54-164 yards 1Mbps Cellular 35-200 km / 21-124 miles 600kbps-10Mbps LoRaWAN 2-15 km / 1-9 miles 0.3-50kbps Neul 10 km / 6 miles 100kbps NFC 10 cm / 4 in 100-420kbps Sigfox 3-50 km / 2-31 miles 10-1000bps WiFi 50 m / 54 yards 150-600Mbps Z-Wave 30 m / 32 yards 9-100kbps Zigbee 10-100 m / 11-110 yards 250kbps
  7. Internet of Things – devices • iotlist.co contains a good

    selection of available devices • Some examples:
  8. Internet of Things – devices • iotlist.co contains a good

    selection of available devices • Some examples:
  9. Internet of Things – kits • More IoT kits available

    now, enabling greater interest • E.g. Intel Edison and Grove IoT Starter Kit Powered by AWS • Enables various sensors to be connected and programmed • Integrates with AWS IoT • Apps can be programmed with Node.js
  10. Internet of Things – growth • Cisco estimates the IoT

    will consist of 50 billion devices connected to the Internet by 2020 • Will require the ability to handle and analyze data from many different sources • Also hearing about the IoT much more in the news Source: http://www.cisco.com/c/en/us/solutions/internet-of-things/overview.html
  11. Data • Various services available to help with integration of

    IoT devices and applications: • PubNub • AWS IoT • Azure IoT • … • These services make it easier to enable devices to communicate with each other and with applications
  12. PubNub • Provides a real-time messaging service • 70+ different

    platform SDKs • Enables devices to communicate with each other regardless of platform
  13. Example – publish messages with Node.js var pubnub = require('pubnub')({

    ssl: true, publish_key: 'publish-key-here' }); pubnub.publish({ channel: 'mychannel', message: { sensor: 'temperature', value: 32.2 }, callback: function(e) { console.log('Message sent', e); } });
  14. Example – subscribe to messages in a web app PUBNUB.init({

    ssl: true, subscribe_key: 'subscribe-key-here' }).subscribe({ channel: 'mychannel', message: function(message) { console.log(message); } }); { sensor: 'temperature', value: 32.2 } Console output: <script src="http://cdn.pubnub.com/pubnub-3.15.2.min.js"></script>
  15. LIFX smart bulb • Internet connected LED bulb • Millions

    of colors • Mobile app for control • REST-based API for third party apps
  16. Amazon Dash button • Internet connected button • Designed to

    order a pre-selected item from Amazon • Stick or hang the buttons around your house, e.g. next to the washing machine, ready to press when you run low on washing powder • Amazon offers a programmable IoT button to use with its AWS IoT service, but for this demo I’m using a normal Dash button, and using a Node script to listen for when it establishes a network request • Button is always in an “off” state, until the button is pressed
  17. Sencha Ext JS • JavaScript framework for mobile, tablet and

    desktop apps • Huge selection of UI components and widgets • UI can be configured to adapt based on the device type or screen size, enabling an app to run on all platforms from one common codebase
  18. Getting started • Download and install Sencha Cmd and Sencha

    Ext JS from sencha.com • Create a new project from the command line: • Open the project folder in an IDE of your choice sencha -sdk /downloads/ext generate app --name Dash --path /apps/Dash --modern
  19. Getting started – important files • app.json contains application settings,

    such as theme name, version, required packages, caching configuration etc. • app.js initializes the application, and defines the initial view to create on load Ext.application({ name: 'Dash', extend: 'Dash.Application', requires: [ 'Dash.view.main.Main' ], mainView: 'Dash.view.main.Main' });
  20. Getting started – concepts • Applications are structured using an

    MVVM architecture • Each class (view, model, controller etc.) resides within its own .js file, and normally extends from a base class • JSON syntax • A new class is defined by using Ext.define Ext.define('Dash.model.Alert', { extend: 'Ext.data.Model', fields: [{ name: 'text' }, { name: 'value', type: 'number' }, { name: 'sensorType' }] });
  21. The app – Server room monitoring app • A dashboard

    app for monitoring and visualizing the conditions of a Server Room • Use sample PubNub stream of data to mimic real-world sensor data, such as temperature, humidity, light • Dashboard must act on this data, e.g. if values exceed a defined threshold, issue an on-screen alert • Incorporate a panic alarm button, that displays an alert in the app • Smart bulb will also provide a way to visualize these alerts
  22. The app Amazon Dash button acts as a panic button

    Node.js script listens for Dash button ARP request PubNub sample data stream acts as sensor data Dashboard app subscribes to PubNub messages and visualizes data Alarm message published to PubNub service If panic alarm message is received, flash the bulb red If data stream values exceed a threshold, flash the bulb orange
  23. Using Node.js to detect the Dash button var dash_button =

    require('node-dash-button'), dash = dash_button(['74:c2:46:90:b8:e6']), pubnub = require('pubnub')({ ssl: true, publish_key: 'publish-key-here' }); dash.on('detected', function (dash_id){ console.log('Dash button ' + dash_id + ' was clicked, sending alarm message!'); var message = { alarmOn: true }; pubnub.publish({ channel: 'alarm', message: message, callback: function(e) { console.log('Alarm message sent', e); } }); });
  24. How to flash the LIFX bulb from the app PUBNUB.init({

    ssl: true, subscribe_key: 'subscribe-key-here' }).subscribe({ channel: 'alarm', message: function(message) { if (message.alarmOn) { Dash.ux.data.Lifx.pulse({ color: 'red', period: 0.5, cycles: 120 }); } } }); <script src="http://cdn.pubnub.com/pubnub-3.15.2.min.js"></script>
  25. Ext.define('Dash.ux.data.Lifx', { singleton: true, url: 'https://api.lifx.com/v1/lights/all', token: 'lifx-oAuth-token-here', pulse: function(config)

    { var me = this, data = { power_on: true, from_color: 'white', color: config.color, period: config.period, cycles: config.cycles, persist: false }; Ext.Ajax.request({ url: me.url + '/effects/pulse', method: 'POST', jsonData: data, headers: { 'Authorization': 'Bearer ' + me.token } }); } });
  26. Creating a dashboard interface • Define a container with dashboard

    items, for example: Ext.define('Dash.view.dashboard.Dashboard', { extend: 'Ext.Panel', xtype: 'dashboard', cls: 'dashboard', items: [{ xtype: 'valuepanel', title: 'Temperature Chart', backgroundColor: '#3F51B5', userCls: 'big-50 medium-50 small-100 dashboard-item shadow' }, { xtype: 'valuepanel', title: 'Humidity', backgroundColorLeft: '#7CB13B', backgroundColorRight: '#89C540', userCls: 'big-25 medium-50 small-100 dashboard-item shadow' }] });
  27. Varying panel heights • Each dashboard item can have varying

    platform-specific fixed heights defined, by using platformConfig Ext.define('Dash.view.valuepanel.ValuePanel', { extend: 'Ext.Panel', ... platformConfig: { phone: { height: 100 }, tablet: { height: 120 }, desktop: { height: 180 } } });
  28. Varying panel widths • Use CSS to set the position

    of dashboard items on screen • Also add padding between the dashboard items • Ext JS uses Sass, meaning we can make use of variables: $dashboard-item-spacing: 20px; .dashboard > * > .x-inner { padding: $dashboard-item-spacing 0 0 $dashboard-item-spacing; } .dashboard-item { margin: 0 $dashboard-item-spacing $dashboard-item-spacing 0; float: left; }
  29. Varying panel widths • Use CSS to set the widths

    of each dashboard panel • Use screen size media queries to define which CSS variables are used for controlling width $dashboard-item-spacing: 20px; @media (min-width: 720px) { .medium-50 { width: calc(50% - #{$dashboard-item-spacing}); } .medium-25 { width: calc(25% - #{$dashboard-item-spacing}); } } @media (min-width: 1048px) { .big-50 { width: calc(50% - #{$dashboard-item-spacing}); } .big-25 { width: calc(25% - #{$dashboard-item-spacing}); } }
  30. In summary • The Internet of Things is getting bigger

    • This means more data, from more sources • In order to do anything meaningful with that data, we need a way to analyze and summarize it
  31. In summary • This requires a UI that can visualize

    information to the user in multiple ways, on a variety of form factors (from mobile to desktop), using Ext JS components such as grids, pivot grids, charts, and D3.js integration • Using a framework like Ext JS provides a mechanism to build a powerful web application to summarize this type of data • Using a real-time service like PubNub makes it easier to exchange data between devices and apps