Upgrade to Pro
— share decks privately, control downloads, hide ads and more …
Speaker Deck
Features
Speaker Deck
PRO
Sign in
Sign up for free
Search
Search
MongoDB Diagnostics and Performance Tuning
Search
dcrosta
January 23, 2012
Technology
1.7k
3
Share
Embed
Copy iframe code
Copy JS code
Copy link
Start on current slide
MongoDB Diagnostics and Performance Tuning
From MongoDB LA, January 19, 2012.
dcrosta
January 23, 2012
More Decks by dcrosta
See All by dcrosta
Let the computer write the tests
dcrosta
0
100
Good Test, Bad Test
dcrosta
1
780
Exploring Python Code Objects (PyOhio)
dcrosta
4
360
Python Packaging for Humans
dcrosta
13
520
Exploring Python Code Objects
dcrosta
5
310
Keystone: Python Web Development, Simplified
dcrosta
4
360
MongoDB In the Cloud with Amazon EC2
dcrosta
6
470
Evolution without Migration
dcrosta
2
450
Other Decks in Technology
See All in Technology
非定型なドキュメントを効率よくリファクタする 〜えぇ!?仕様書27本の移行が1日で終わったって!?〜
subroh0508
1
380
シンガポールで登壇してきます
yama3133
0
120
Terraform共通モジュールをチーム横断で“変えられる”運用へ ― リリースと適用の分離
kekke_n
1
2.9k
インフラ寄りSREでも 開発に踏み出せる〜境界を越えてユーザー体験に向き合いたい〜
sansantech
PRO
2
3.8k
AI Agent SaaS を支える自社仮想化基盤への挑戦と実運用 / ai-agent-saas-virtualization
flatt_security
2
3.9k
CIで使うClaude
iwatatomoya
0
250
最適な自走を最小限の支援で — M&Aで拡大する組織で少人数SREが挑んだ1年 / SRE NEXT 2026
genda
0
1.1k
「早く出す」より「事業に効く」 ── 顧客の業務サイクルから逆算するAI時代の二重ループ開発と「変化の設計者」 / devsumi2026
rakus_dev
1
240
Amazon EVS で VCF 9.0 / 9.1 のサポート開始まとめ
mtoyoda
0
290
技術イベント終了後、運営の 事後タスクは丁寧に (心がけています)/ #tamagawadev
nishiuma
1
100
【Claude Code】鹿野さんに聞く 私の推しの並行開発環境 大公開 / claude-code-parallel-2026-07-15
tonkotsuboy_com
11
7.1k
Control Planeで育てるBtoB SaaSの認証基盤 - SRE NEXT 2026
pokohide
1
2.3k
Featured
See All Featured
Music & Morning Musume
bryan
47
7.3k
The Art of Programming - Codeland 2020
erikaheidi
57
14k
Evolving SEO for Evolving Search Engines
ryanjones
0
240
Public Speaking Without Barfing On Your Shoes - THAT 2023
reverentgeek
1
460
Data-driven link building: lessons from a $708K investment (BrightonSEO talk)
szymonslowik
1
1.2k
Marketing Yourself as an Engineer | Alaka | Gurzu
gurzu
0
260
Ecommerce SEO: The Keys for Success Now & Beyond - #SERPConf2024
aleyda
1
2.1k
B2B Lead Gen: Tactics, Traps & Triumph
marketingsoph
0
170
A Soul's Torment
seathinner
6
3.1k
Optimizing for Happiness
mojombo
378
71k
How Fast Is Fast Enough? [PerfNow 2025]
tammyeverts
3
650
Accessibility Awareness
sabderemane
1
150
Transcript
Diagnostics and Performance Tuning Dan Crosta, 10gen
[email protected]
@lazlofruvous
Agenda •Tools •Performance Indicators
Speed MongoDB is a high-performance database, but how do I
know that I’m getting the best performance
TOOLS
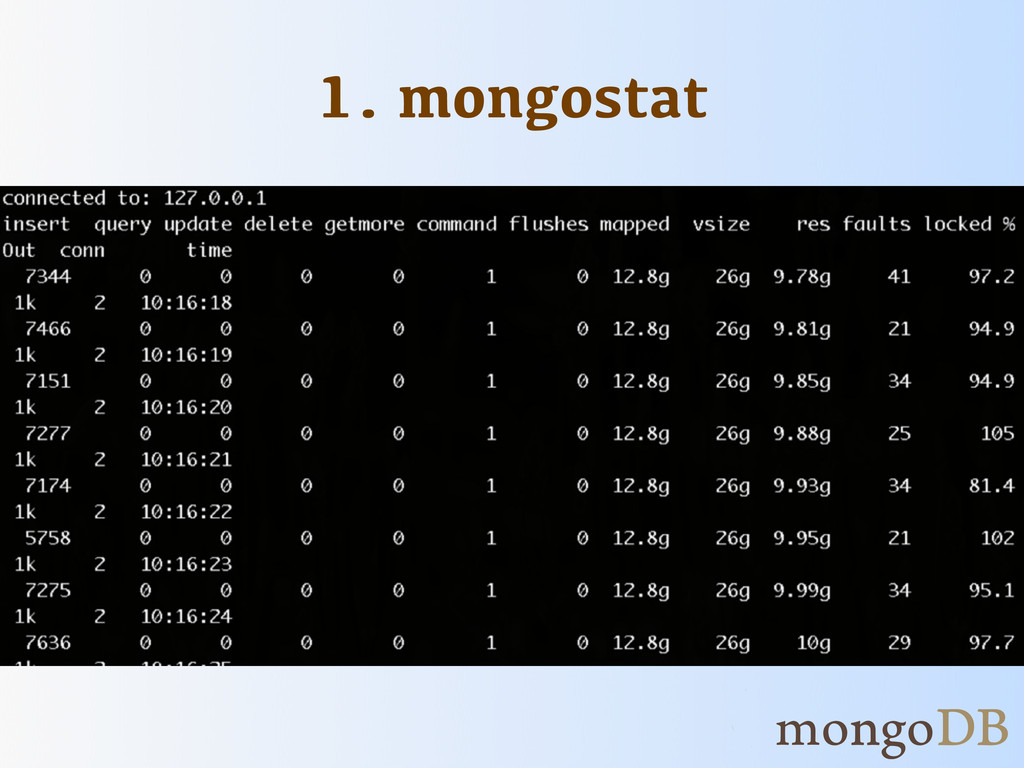
1. mongostat
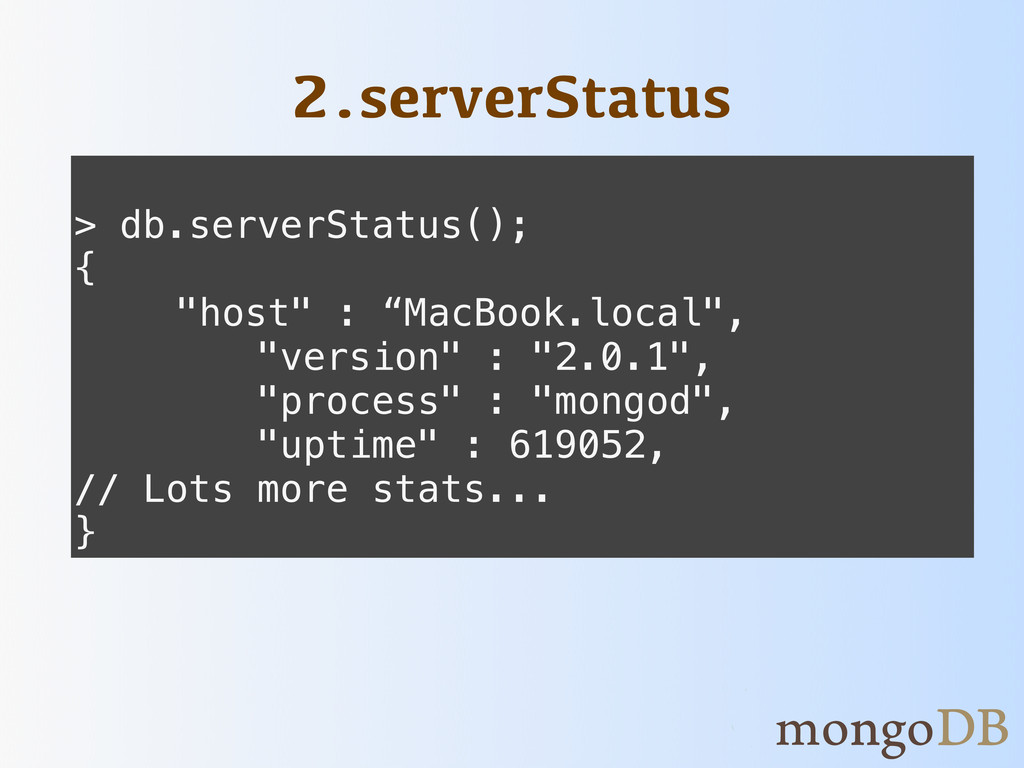
2.serverStatus > db.serverStatus(); { ! ! "host" : “MacBook.local", "version"
: "2.0.1", "process" : "mongod", "uptime" : 619052, // Lots more stats... }
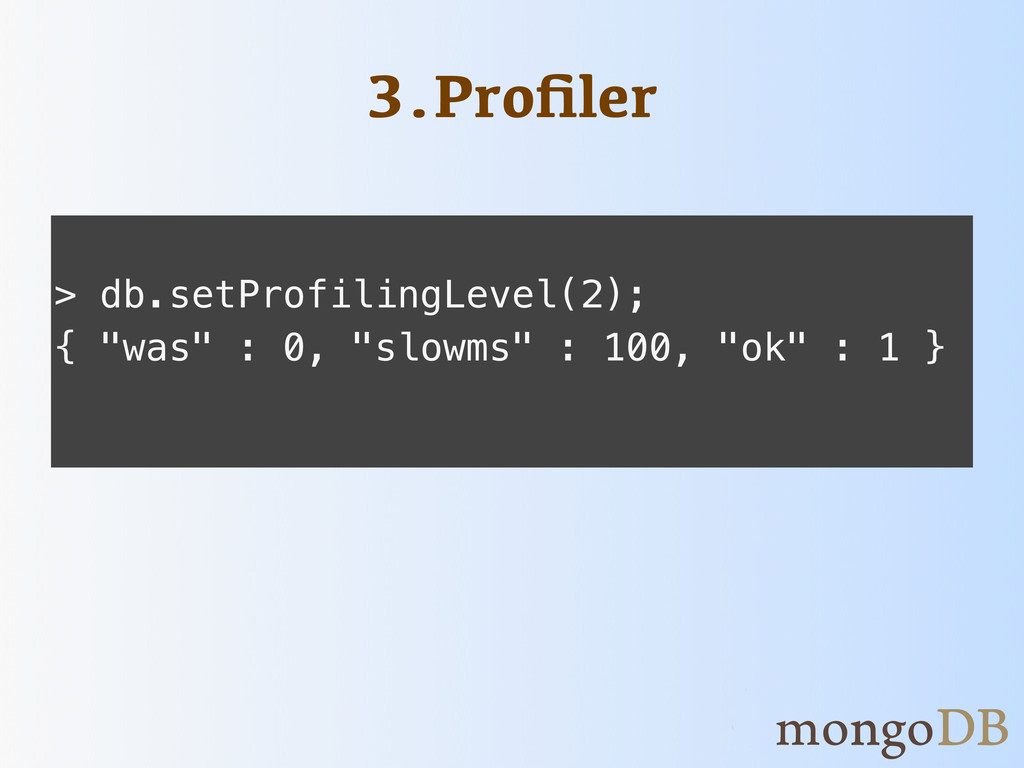
3.Profiler > db.setProfilingLevel(2); { "was" : 0, "slowms" : 100,
"ok" : 1 }
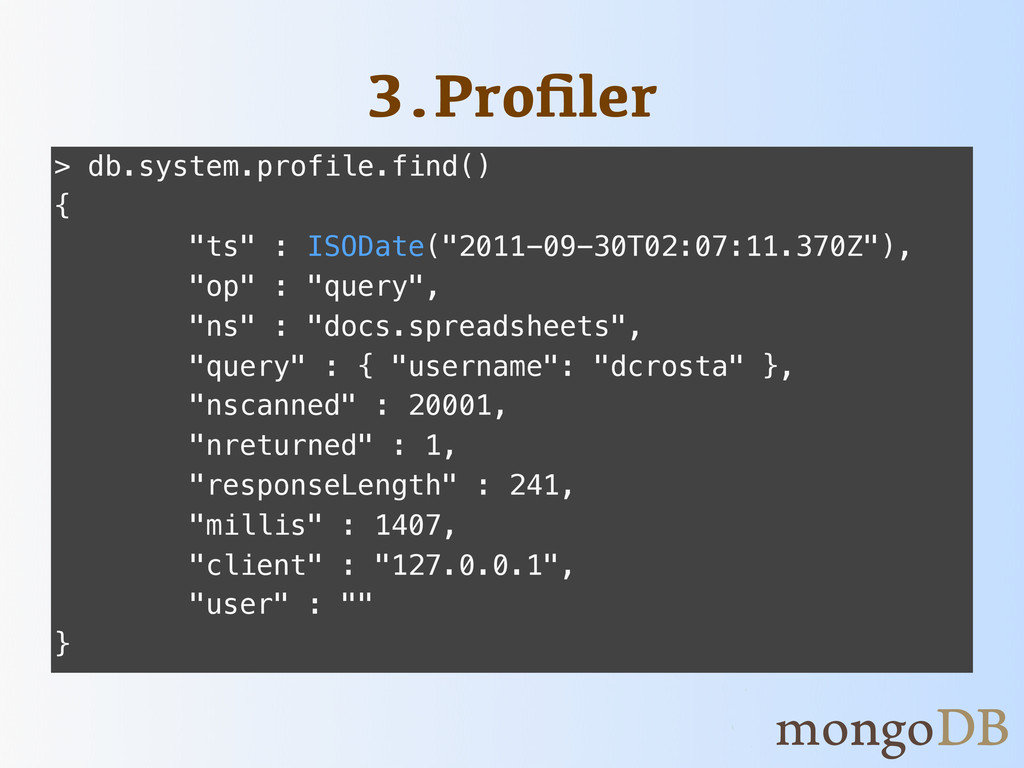
3.Profiler > db.system.profile.find() { "ts" : ISODate("2011-09-30T02:07:11.370Z"), "op" : "query",
"ns" : "docs.spreadsheets", "query" : { "username": "dcrosta" }, "nscanned" : 20001, "nreturned" : 1, "responseLength" : 241, "millis" : 1407, "client" : "127.0.0.1", "user" : "" }
4.Monitoring Service • MMS: 10gen.com/try-mms • Nagios • Munin
INDICATORS
1.Slow Operations Sun May 22 19:01:47 [conn10] query docs.spreadsheets ntoreturn:100
reslen:510436 nscanned:19976 { username: “dcrosta”} nreturned:100 147ms
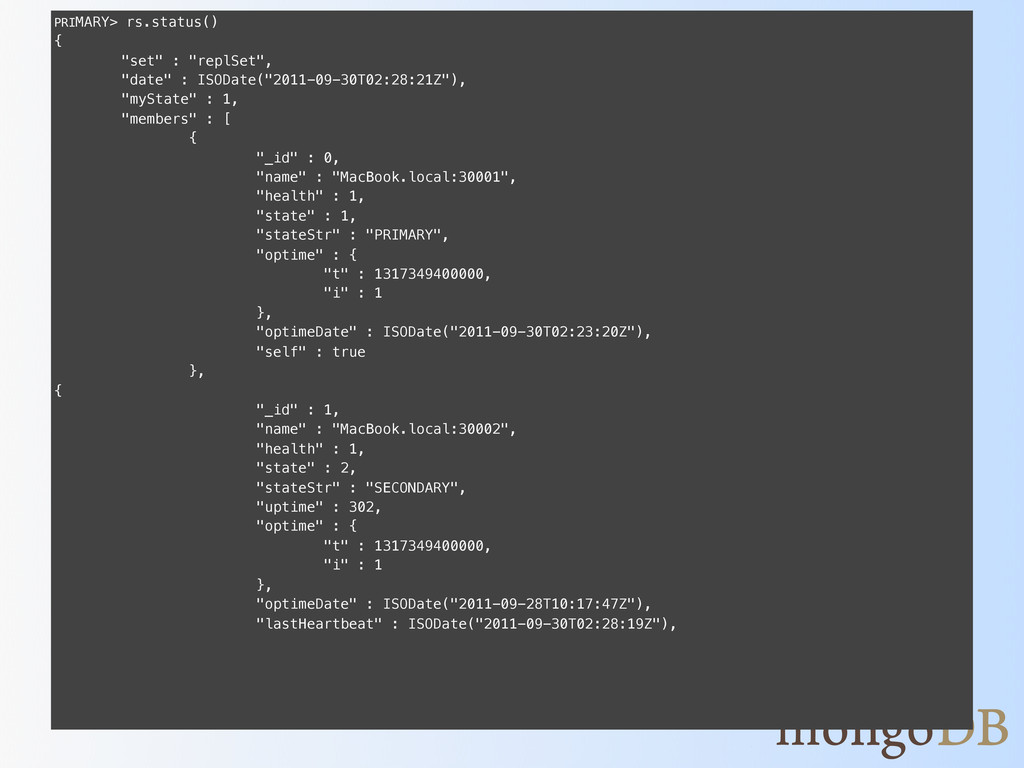
2.Replication Lag PRIMARY> rs.status() { "set" : "replSet", "date" :
ISODate("2011-09-30T02:28:21Z"), "myState" : 1, "members" : [ { "_id" : 0, "name" : "MacBook.local:30001", "health" : 1, "state" : 1, "stateStr" : "PRIMARY", "optime" : { "t" : 1317349400000, "i" : 1 }, "optimeDate" : ISODate("2011-09-30T02:23:20Z"), "self" : true }, { "_id" : 1, "name" : "MacBook.local:30002", "health" : 1, "state" : 2, "stateStr" : "SECONDARY", "uptime" : 302, "optime" : { "t" : 1317349400000, "i" : 1 }, "optimeDate" : ISODate("2011-09-28T10:17:47Z"), "lastHeartbeat" : ISODate("2011-09-30T02:28:19Z"),
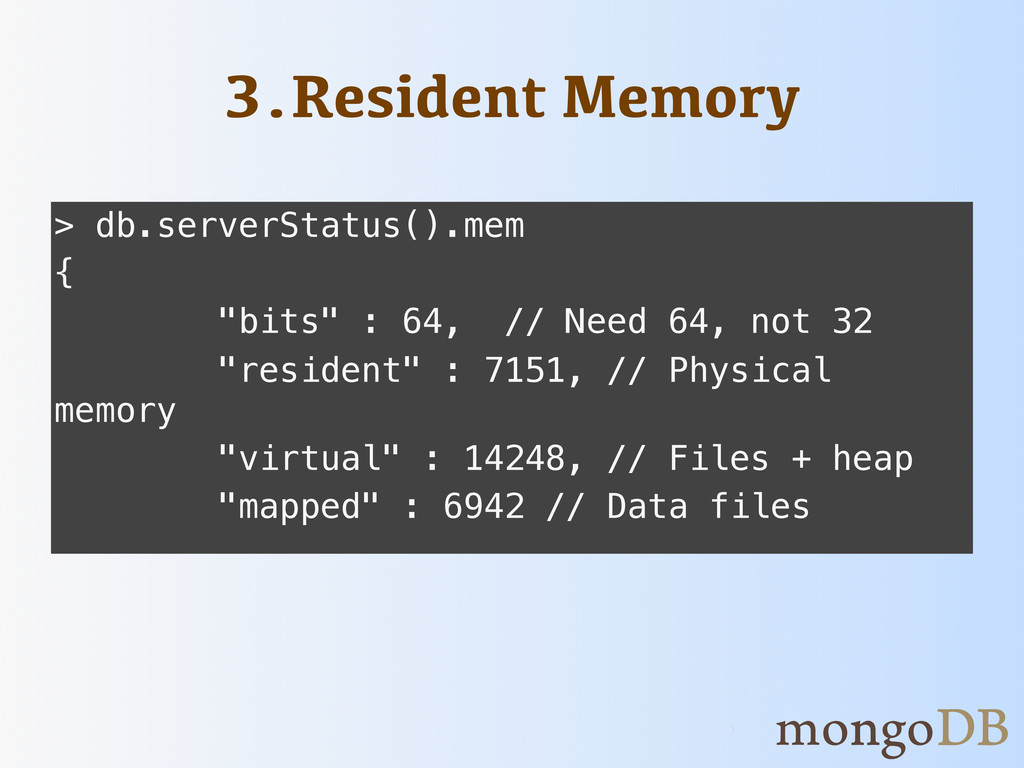
3.Resident Memory > db.serverStatus().mem { "bits" : 64, // Need
64, not 32 "resident" : 7151, // Physical memory "virtual" : 14248, // Files + heap "mapped" : 6942 // Data files
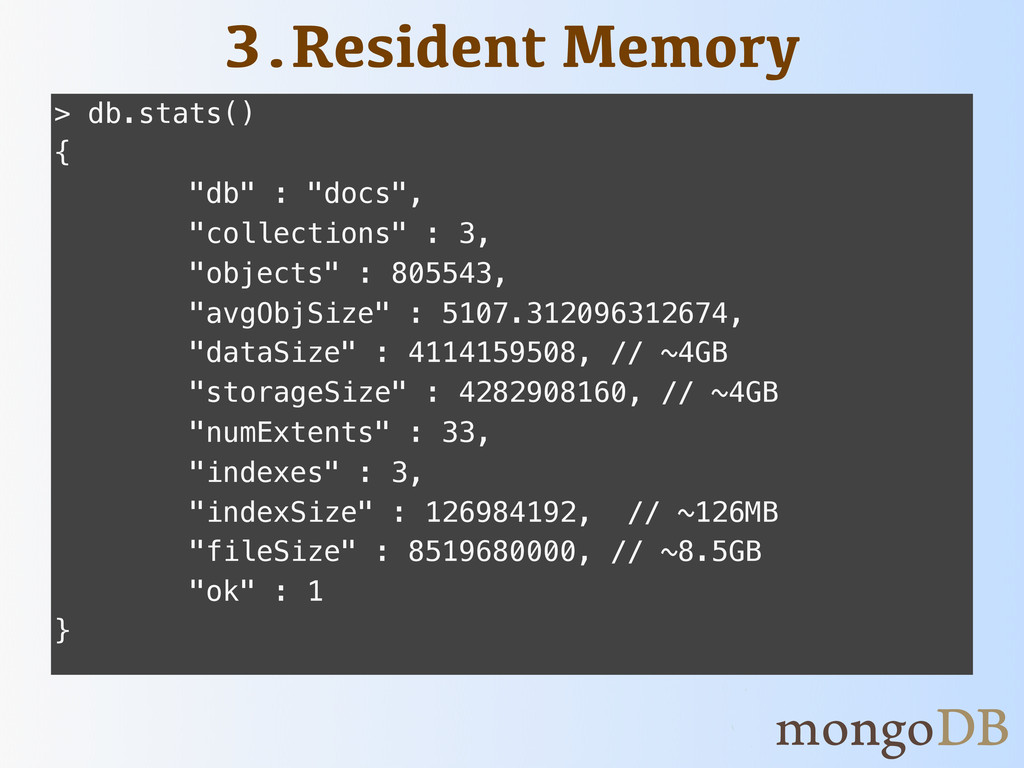
3.Resident Memory > db.stats() { "db" : "docs", "collections" :
3, "objects" : 805543, "avgObjSize" : 5107.312096312674, "dataSize" : 4114159508, // ~4GB "storageSize" : 4282908160, // ~4GB "numExtents" : 33, "indexes" : 3, "indexSize" : 126984192, // ~126MB "fileSize" : 8519680000, // ~8.5GB "ok" : 1 }
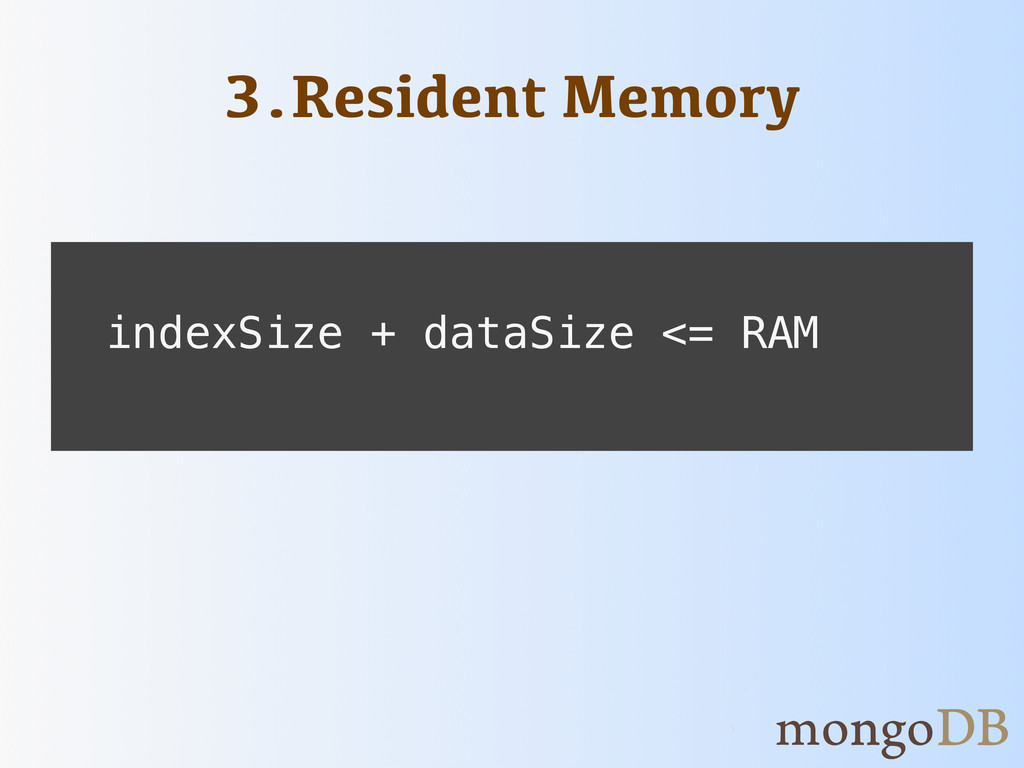
3.Resident Memory ! ! indexSize + dataSize <= RAM
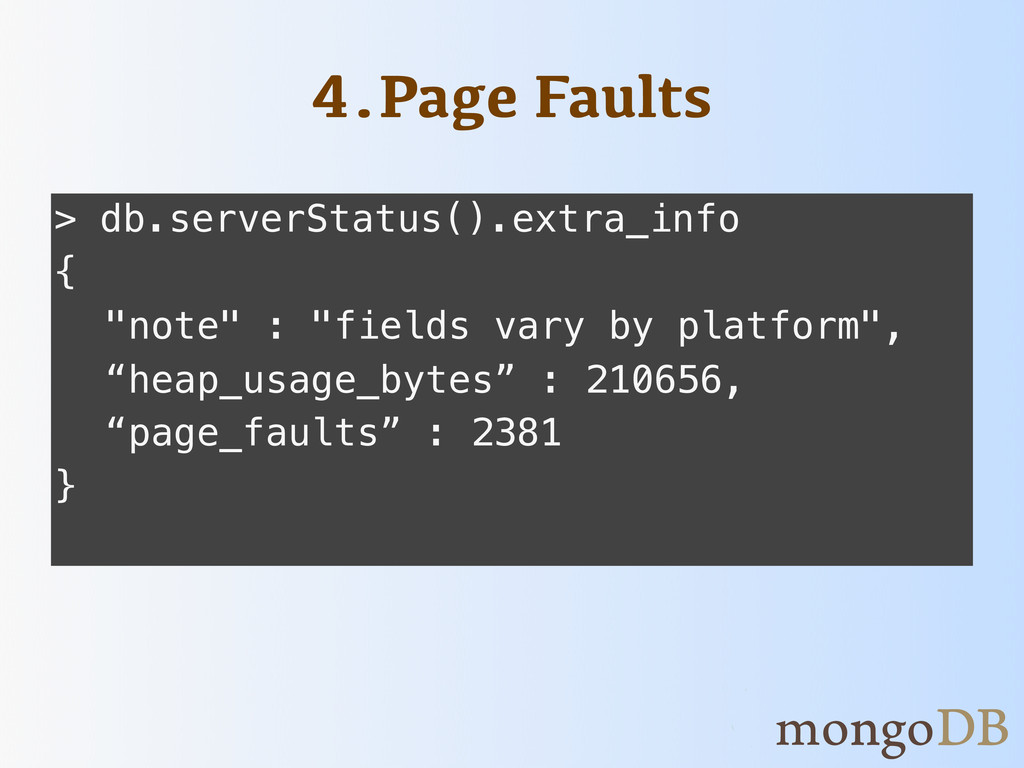
4.Page Faults > db.serverStatus().extra_info { ! "note" : "fields vary
by platform", ! “heap_usage_bytes” : 210656, ! “page_faults” : 2381 }
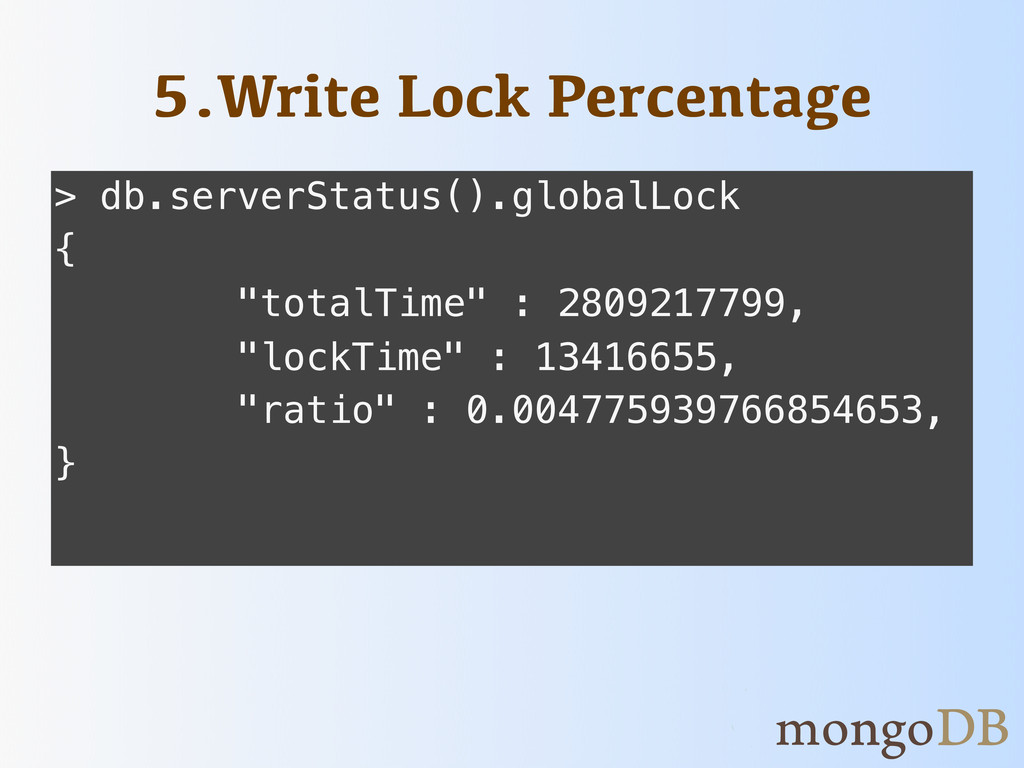
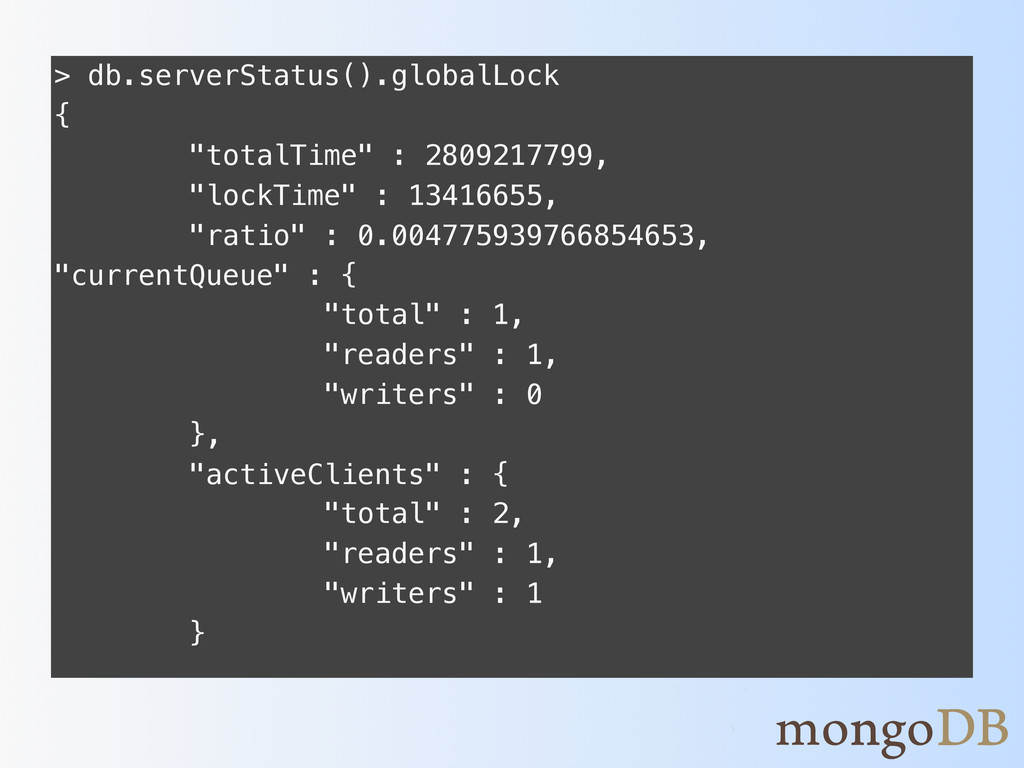
5.Write Lock Percentage > db.serverStatus().globalLock { "totalTime" : 2809217799, "lockTime"
: 13416655, "ratio" : 0.004775939766854653, }
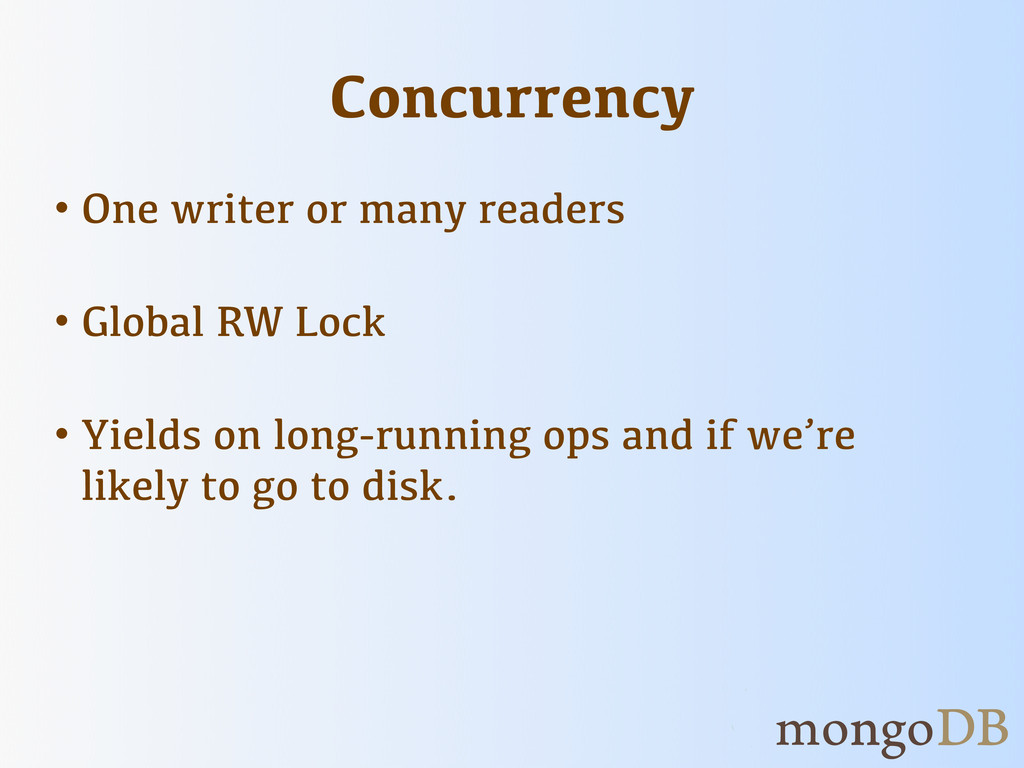
Concurrency • One writer or many readers • Global RW
Lock • Yields on long-running ops and if we’re likely to go to disk.
High Lock Percentage? You’re Probably Paging!
6.Reader and Writer Queues > db.serverStatus().globalLock { "totalTime" : 2809217799,
"lockTime" : 13416655, "ratio" : 0.004775939766854653, "currentQueue" : { "total" : 1, "readers" : 1, "writers" : 0 }, "activeClients" : { "total" : 2, "readers" : 1, "writers" : 1 }
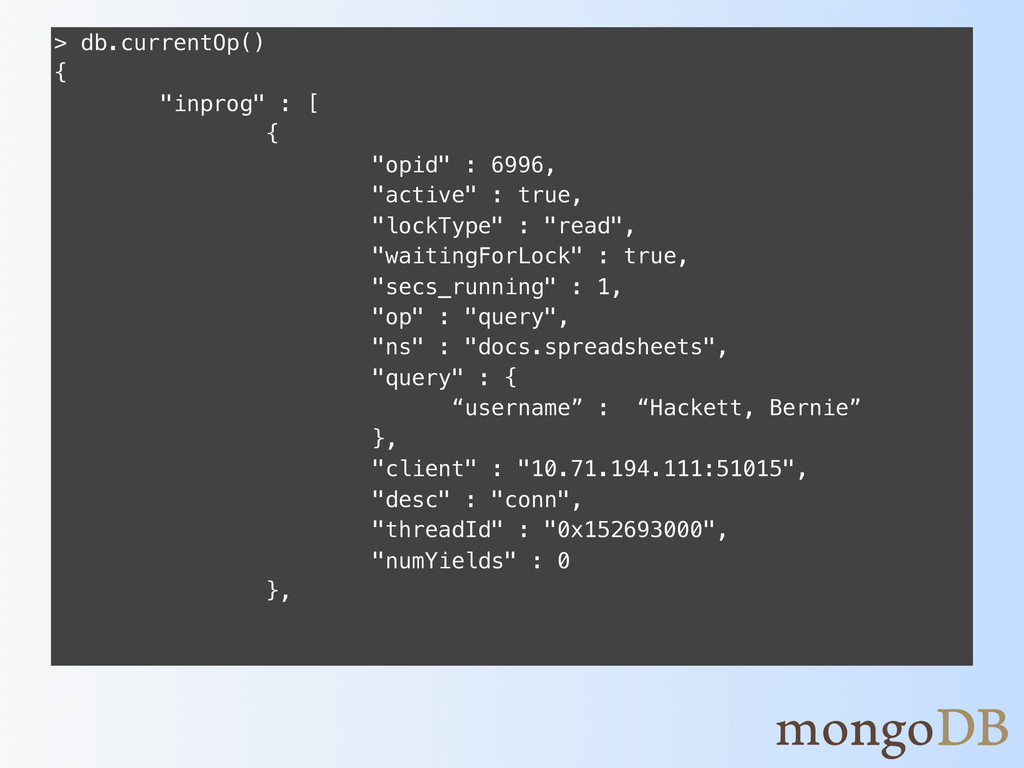
6.Reader and Writer Queues > db.currentOp() { "inprog" : [
{ "opid" : 6996, "active" : true, "lockType" : "read", "waitingForLock" : true, "secs_running" : 1, "op" : "query", "ns" : "docs.spreadsheets", "query" : { “username” : “Hackett, Bernie” }, "client" : "10.71.194.111:51015", "desc" : "conn", "threadId" : "0x152693000", "numYields" : 0 },
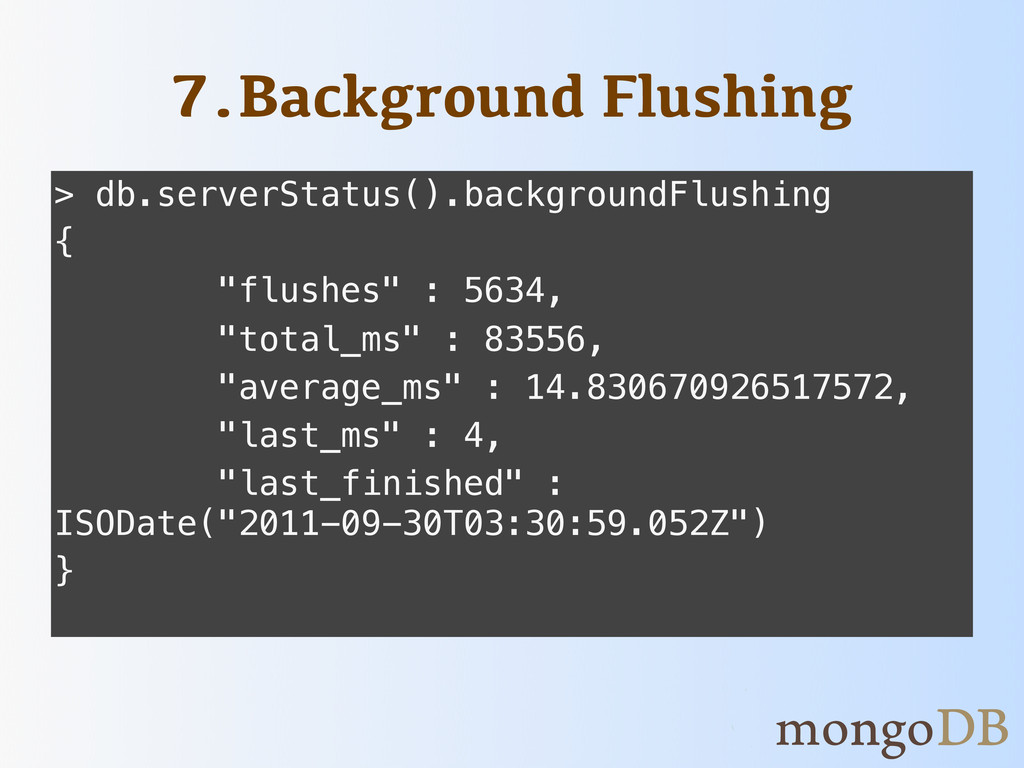
7.Background Flushing > db.serverStatus().backgroundFlushing { "flushes" : 5634, "total_ms" :
83556, "average_ms" : 14.830670926517572, "last_ms" : 4, "last_finished" : ISODate("2011-09-30T03:30:59.052Z") }
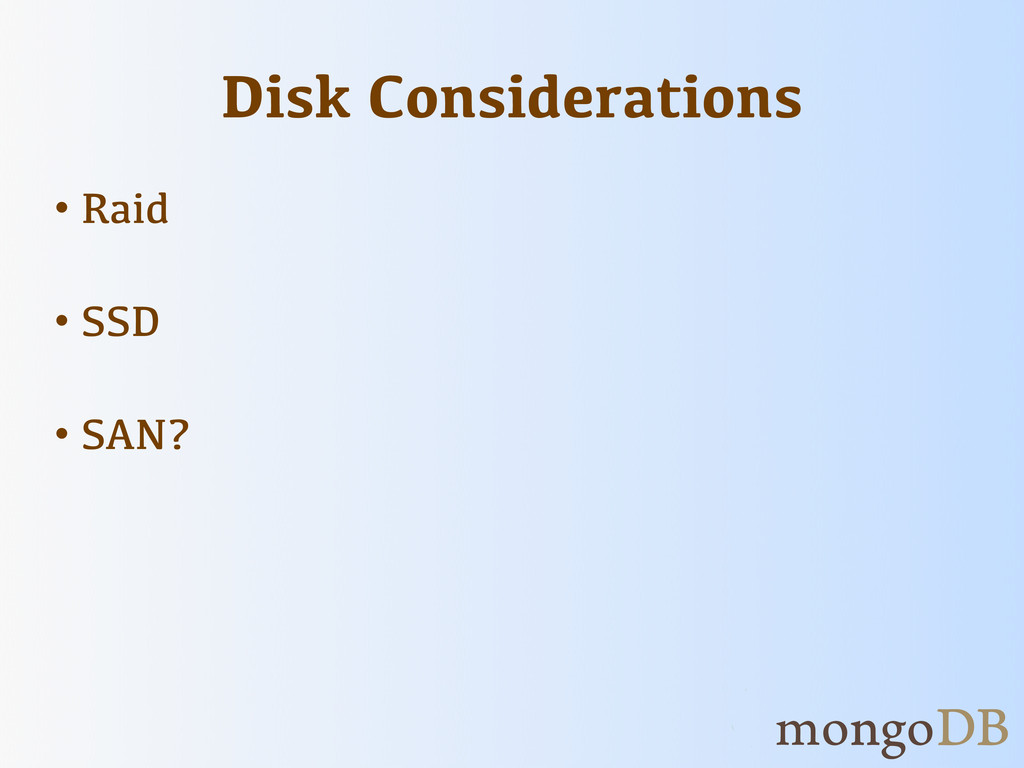
Disk Considerations • Raid • SSD • SAN?
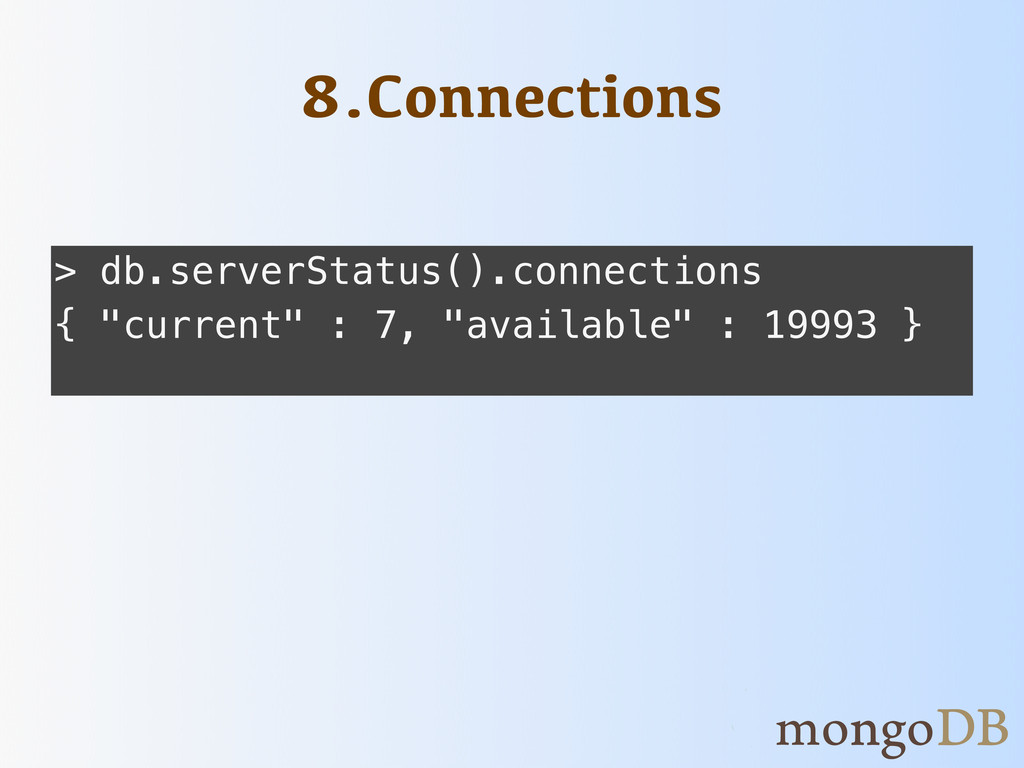
8.Connections > db.serverStatus().connections { "current" : 7, "available" : 19993
}
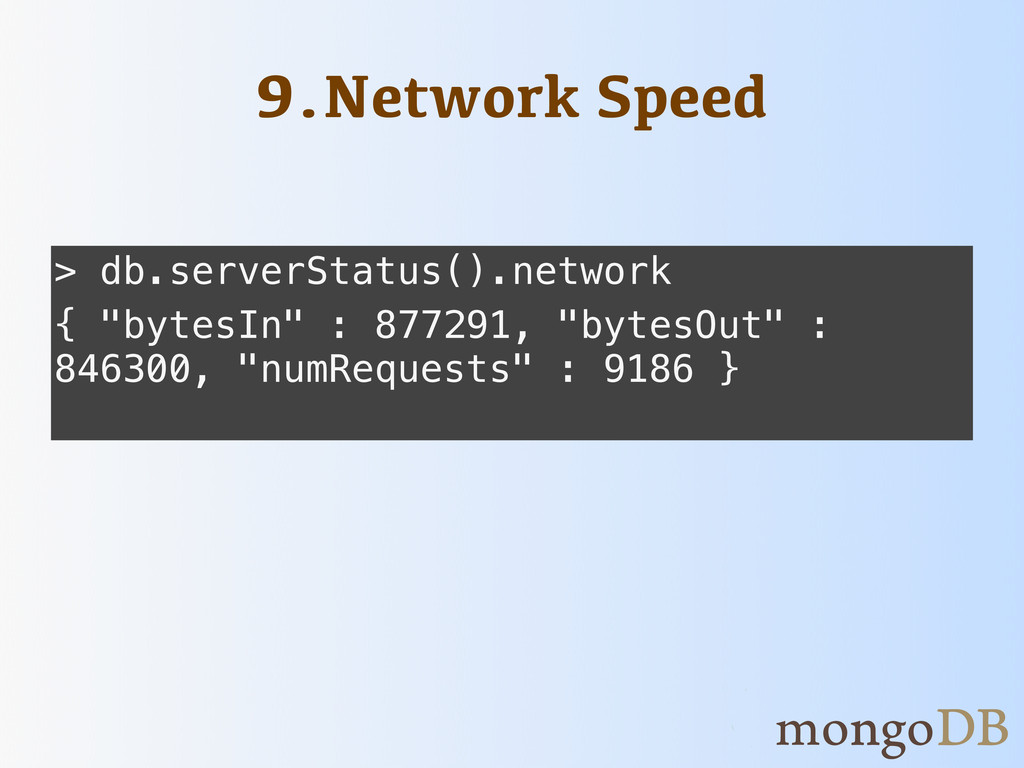
9.Network Speed > db.serverStatus().network { "bytesIn" : 877291, "bytesOut" :
846300, "numRequests" : 9186 }
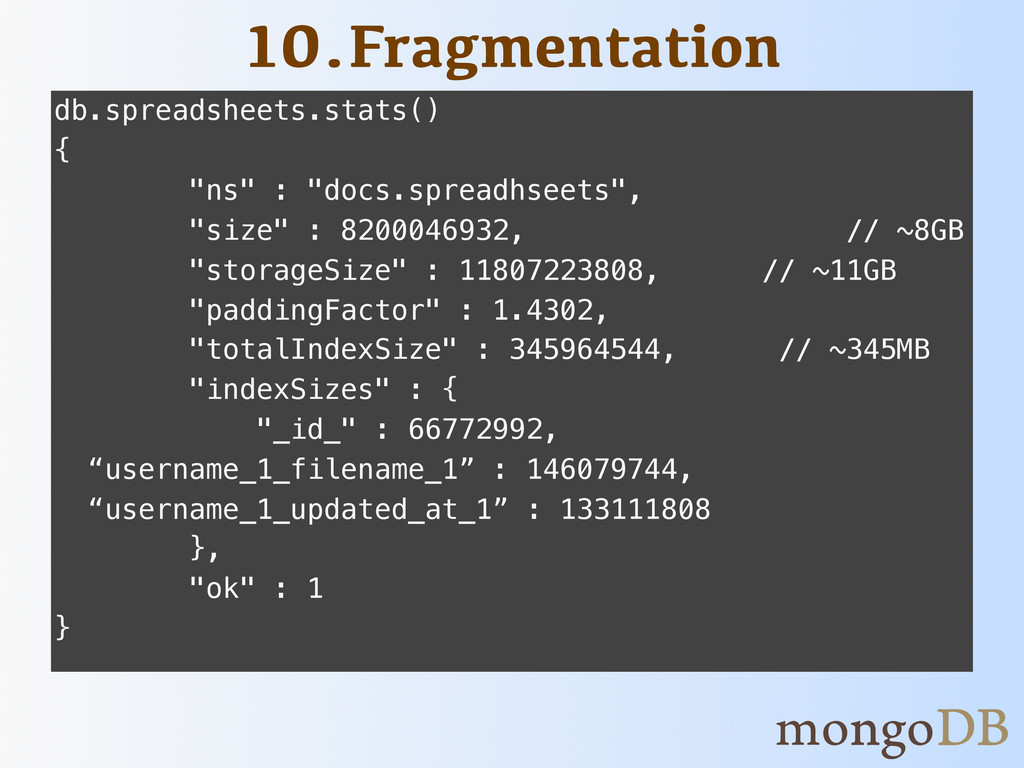
10.Fragmentation db.spreadsheets.stats() { "ns" : "docs.spreadhseets", "size" : 8200046932, //
~8GB "storageSize" : 11807223808, // ~11GB "paddingFactor" : 1.4302, "totalIndexSize" : 345964544, // ~345MB "indexSizes" : { "_id_" : 66772992, “username_1_filename_1” : 146079744, “username_1_updated_at_1” : 133111808 }, "ok" : 1 }
10.Fragmentation 2 is the Magic Number
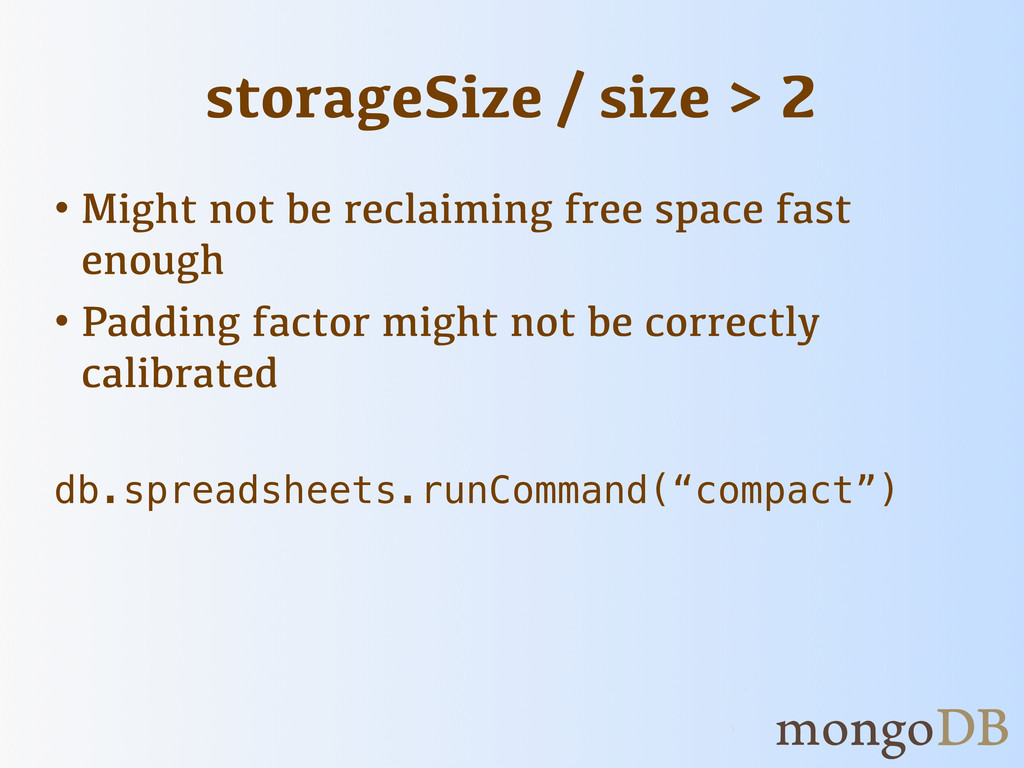
storageSize / size > 2 • Might not be reclaiming
free space fast enough • Padding factor might not be correctly calibrated db.spreadsheets.runCommand(“compact”)
paddingFactor > 2 • You might have the wrong data
model • You might be growing documents too much • Should review Schema Design
download at mongoDB.org
We’re Hiring Engineers, Sales, Evangelist, Marketing, Support, Developers @mongodb_jobs http://linkd.in/joinmongo
We’re Always Around For Conferences, Appearances and Meetups 10gen.com/events @mongodb
h2p://bit.ly/mongo8
![Diagnostics and Performance Tuning Dan Crosta, 10gen [email protected] @lazlofruvous](https://files.speakerdeck.com/presentations/4f1dcdceded19c001f00df09/slide_0.jpg)
![1.Slow Operations Sun May 22 19:01:47 [conn10] query docs.spreadsheets ntoreturn:100](https://files.speakerdeck.com/presentations/4f1dcdceded19c001f00df09/slide_10.jpg)