Share
Embed
Scalable Kernel Density Classification via Threshold-Based Pruning
Edward Gan & Peter Bailis
SIGMOD 2017
https://www.youtube.com/watch?v=6tmLPjmtzYk&t=25m23s
https://github.com/stanford-futuredata/tKDC
Stanford Future Data Systems
May 19, 2017
Transcript
31 slides
-
• Increasing Streaming Data • Manufacturing, Sensors, Mobile • Multi-dimensional
+ Latent anomalies • Running in production • see CIDR17, SIGMOD17 • End-to-end operator cascades for: • Feature Transformation • Statistical Classification • Data Summarization MacroBase: Analytics on Fast Streams 2 -
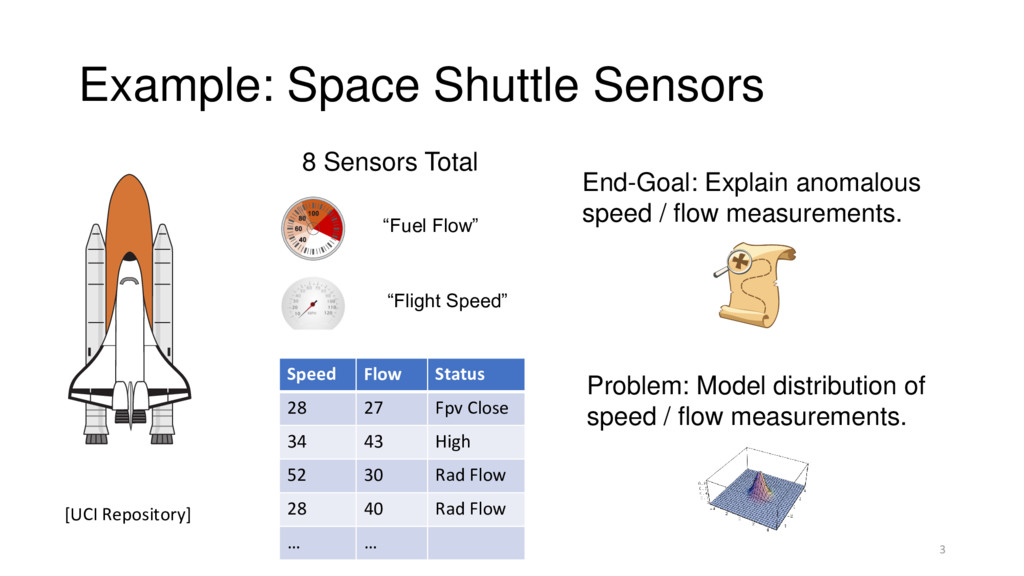
Example: Space Shuttle Sensors 3 8 Sensors Total “Fuel Flow”
“Flight Speed” [UCI Repository] Speed Flow Status 28 27 Fpv Close 34 43 High 52 30 Rad Flow 28 40 Rad Flow … … End-Goal: Explain anomalous speed / flow measurements. Problem: Model distribution of speed / flow measurements. -
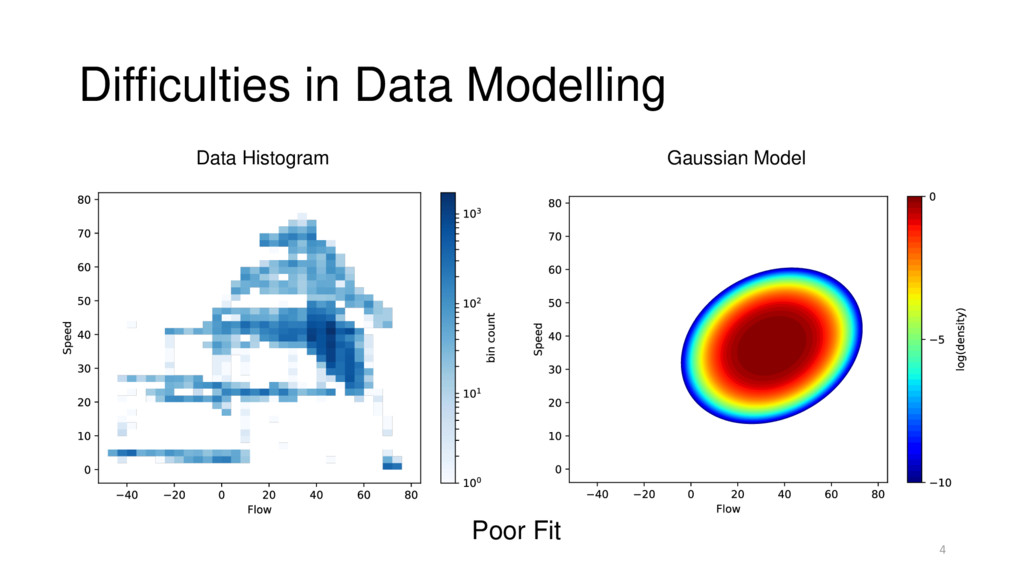
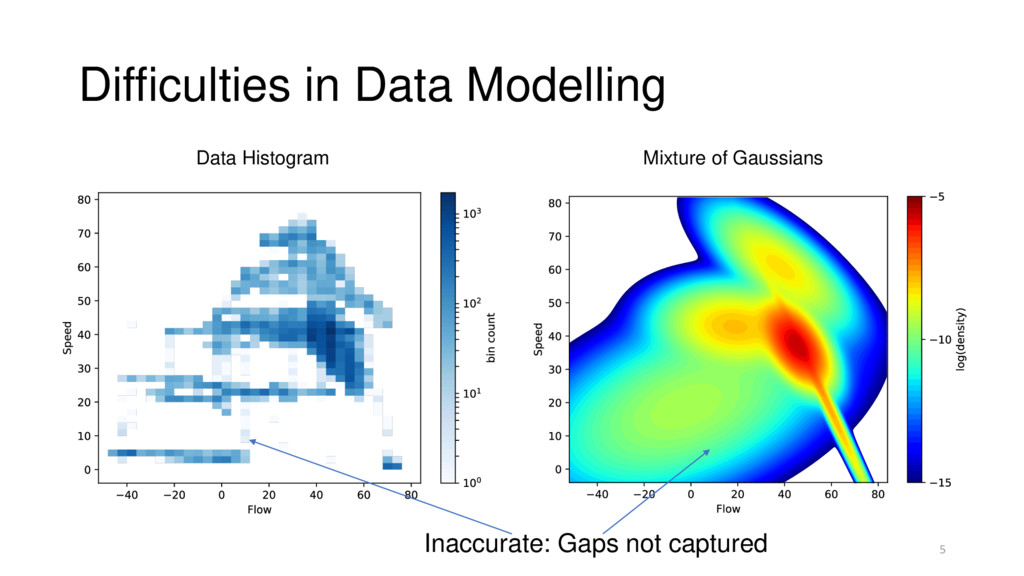
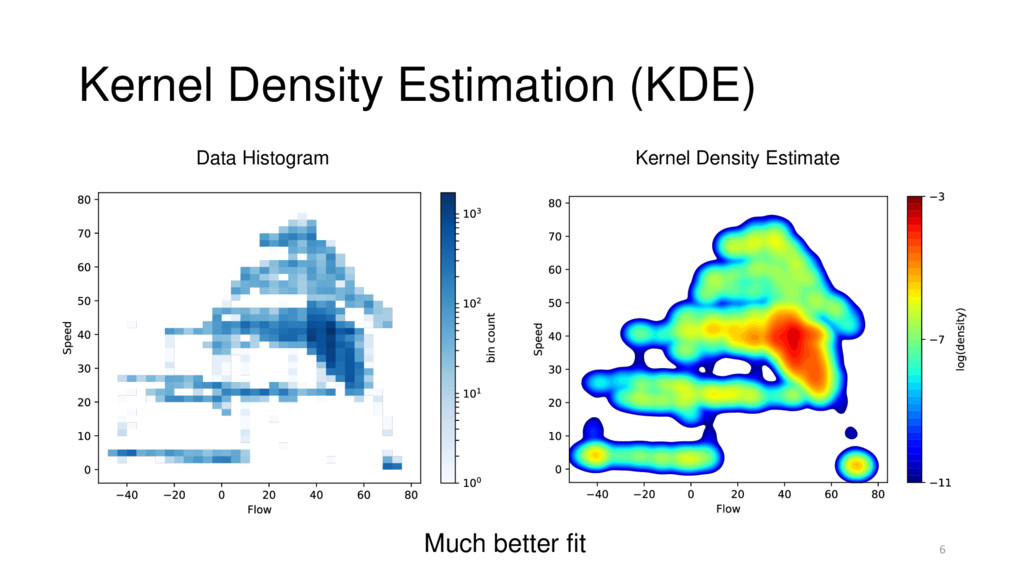
Difficulties in Data Modelling Inaccurate: Gaps not captured Data Histogram
Mixture of Gaussians 5 -
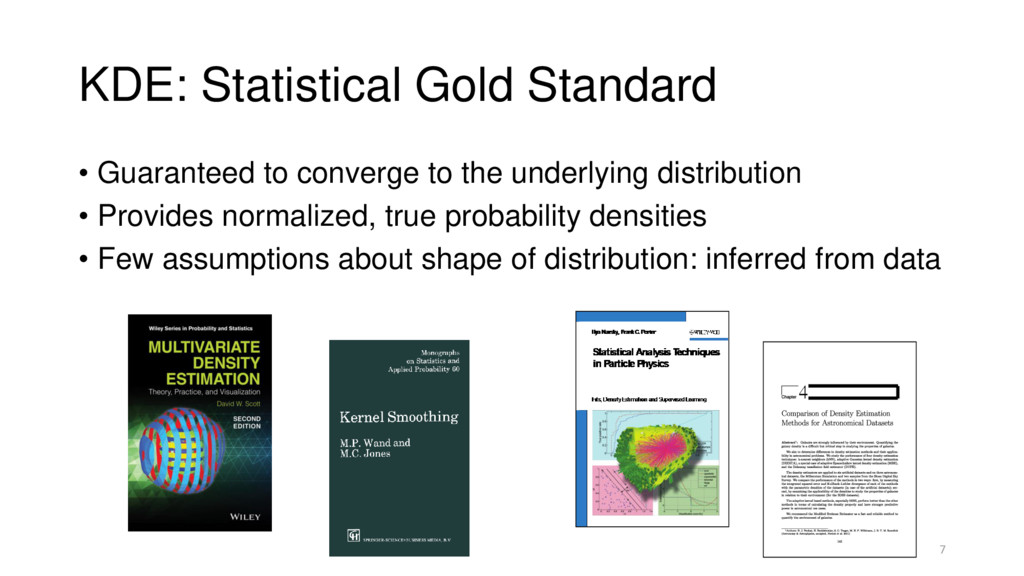
KDE: Statistical Gold Standard • Guaranteed to converge to the
underlying distribution • Provides normalized, true probability densities • Few assumptions about shape of distribution: inferred from data 7 -
KDE Usage Galaxy Mass Distribution [Sloan Digital Sky Survey] Distribution
of Bowhead Whales [L.T. Quackenbush et al, Arctic 2010] 8 -
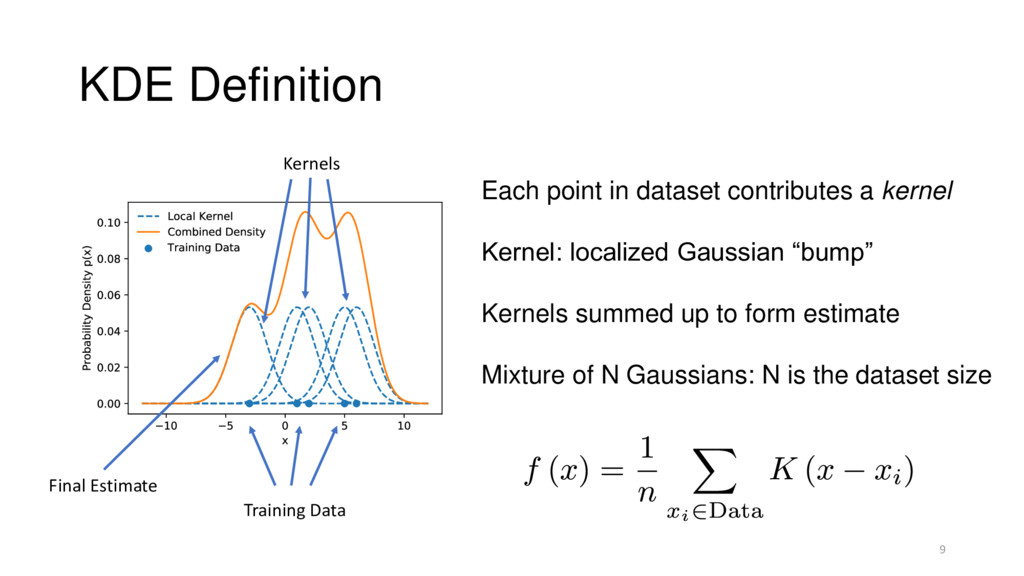
KDE Definition 9 Each point in dataset contributes a kernel
Kernel: localized Gaussian “bump” Kernels summed up to form estimate Mixture of N Gaussians: N is the dataset size Training Data Kernels Final Estimate -
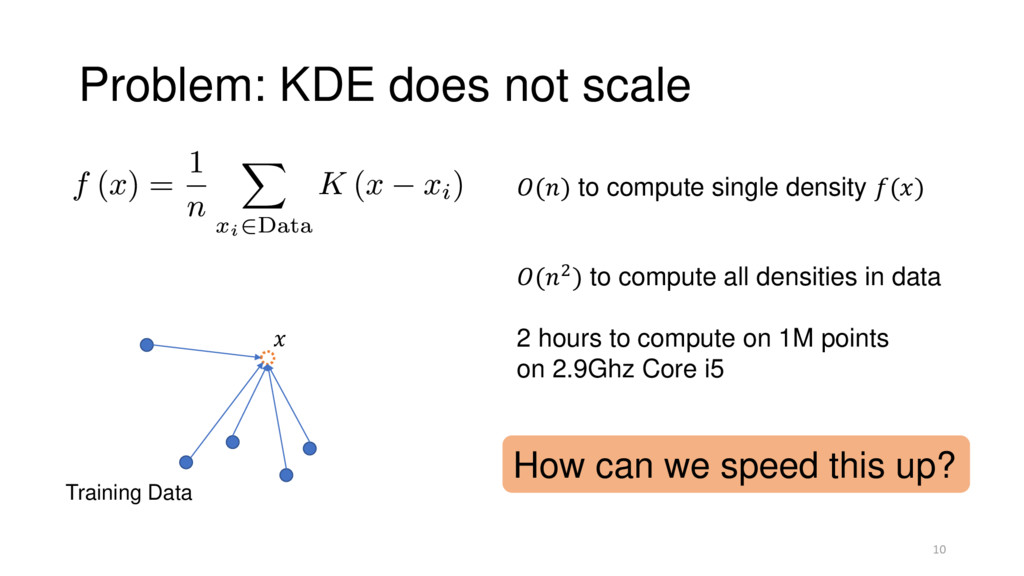
Problem: KDE does not scale 10 () to compute single
density () How can we speed this up? Training Data (2) to compute all densities in data 2 hours to compute on 1M points on 2.9Ghz Core i5 -
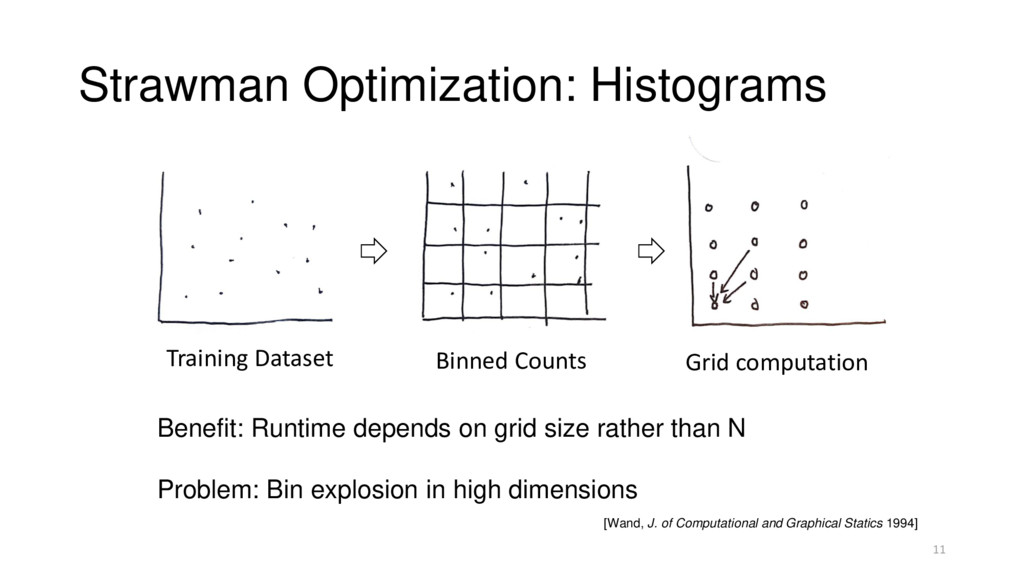
Strawman Optimization: Histograms Training Dataset Binned Counts Grid computation Benefit:
Runtime depends on grid size rather than N Problem: Bin explosion in high dimensions 11 [Wand, J. of Computational and Graphical Statics 1994] -
SELECT flight_mode FROM shuttle_sensors WHERE kde(flow,speed) < threshold Stepping Back:
What users need 12 SELECT color FROM galaxies WHERE kde(x,y,z) < threshold Anomaly Explanation Hypothesis Testing -
From Estimation to Classification 13 SELECT flight_mode FROM shuttle_sensors WHERE
kde(flow,speed) < Threshold Training Data KDE Model Classification -
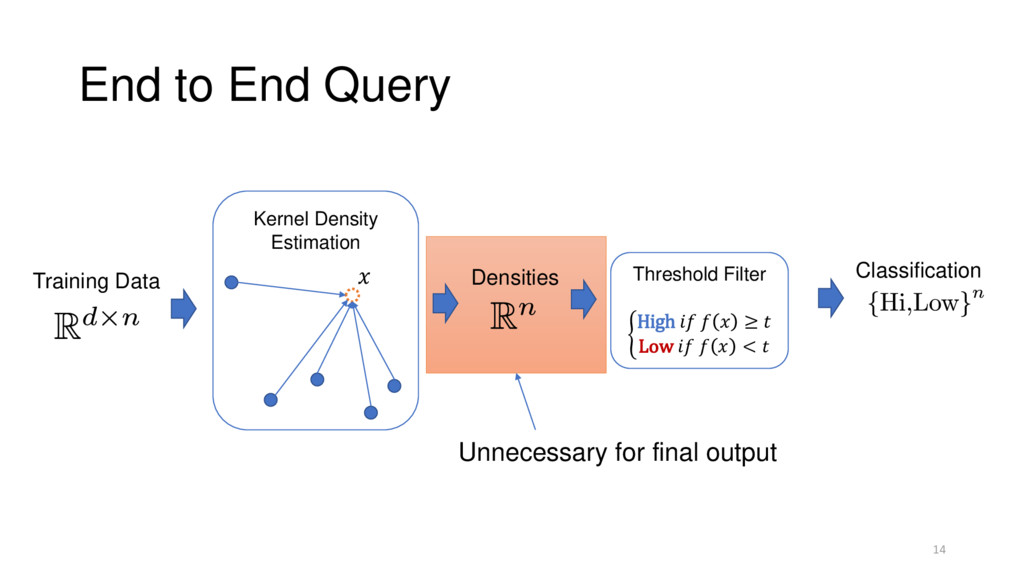
End to End Query 14 Kernel Density Estimation Threshold Filter
ቊ High ≥ Low < Training Data Densities Classification Unnecessary for final output -
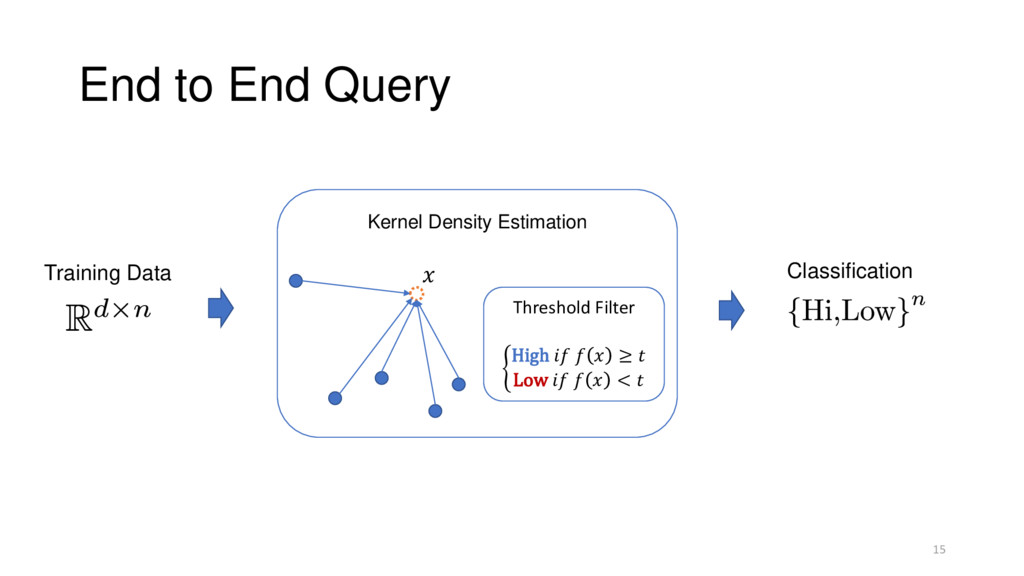
End to End Query 15 Kernel Density Estimation Threshold Filter
ቊ High ≥ Low < Training Data Classification -
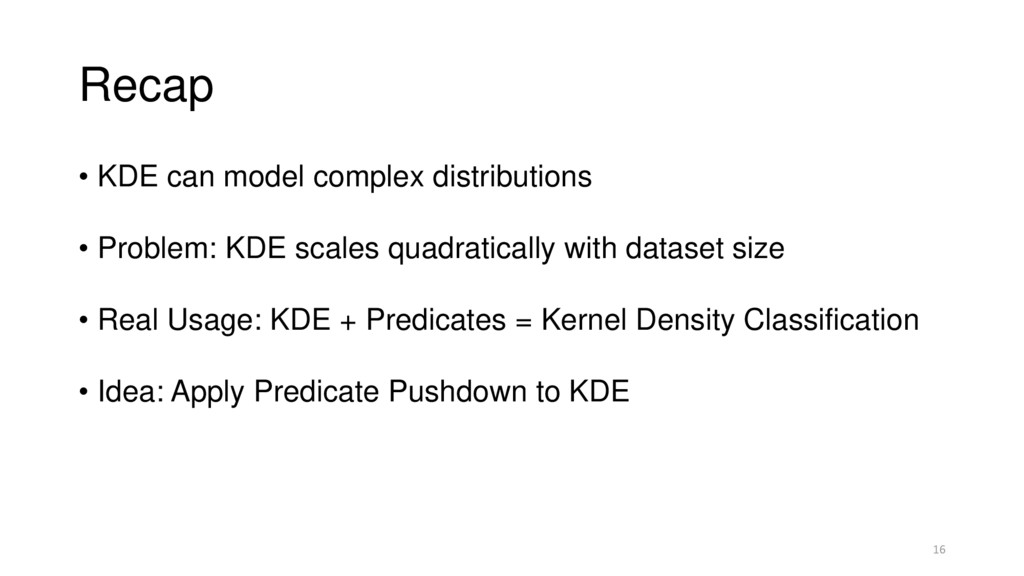
Recap • KDE can model complex distributions • Problem: KDE
scales quadratically with dataset size • Real Usage: KDE + Predicates = Kernel Density Classification • Idea: Apply Predicate Pushdown to KDE 16 -
tkdc Algorithm Overview 1. Pick a threshold 2. Repeat: Calculate
bounds on point density 3. Stop when we can make a classification 17 -
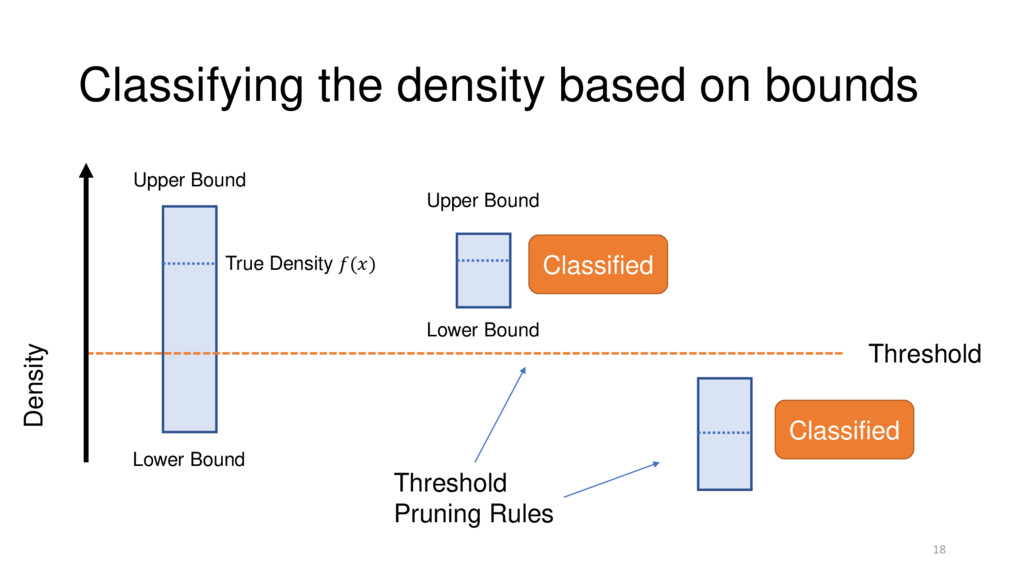
Classifying the density based on bounds 18 Threshold Upper Bound
Lower Bound Density Upper Bound Lower Bound True Density () Classified Classified Threshold Pruning Rules -
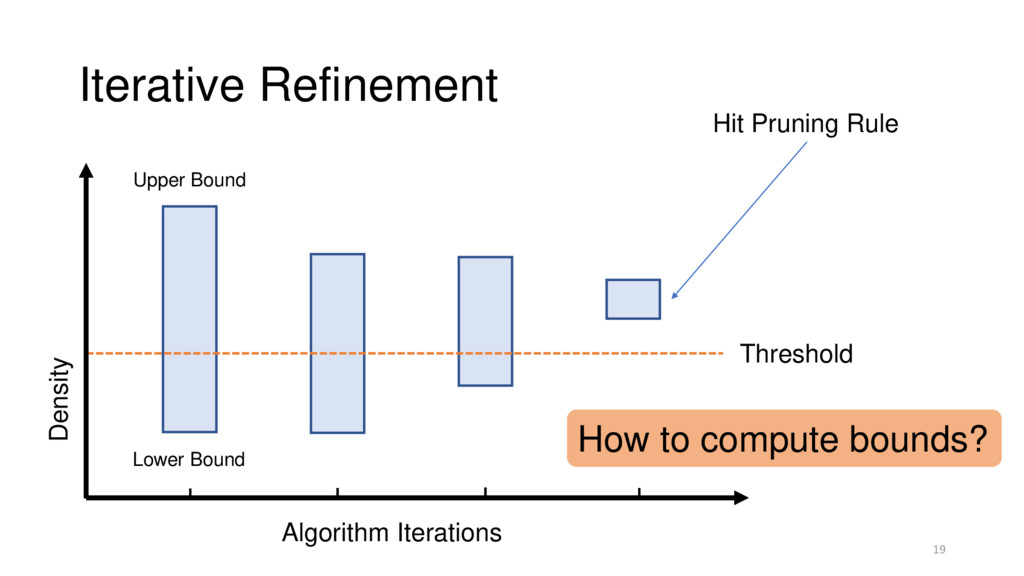
Iterative Refinement 19 Threshold Upper Bound Lower Bound Density Algorithm
Iterations Hit Pruning Rule How to compute bounds? -
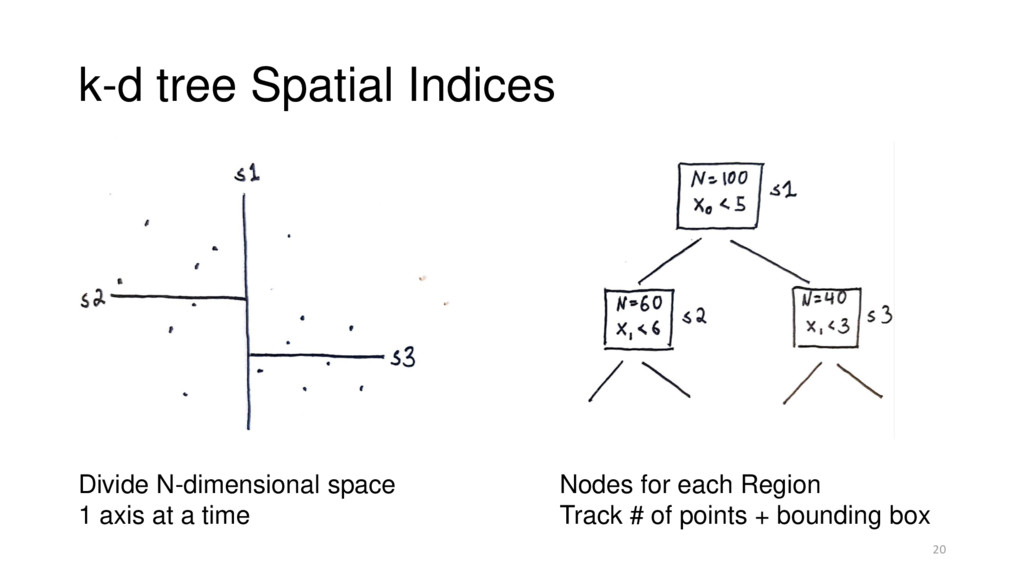
k-d tree Spatial Indices Divide N-dimensional space 1 axis at
a time 20 Nodes for each Region Track # of points + bounding box -
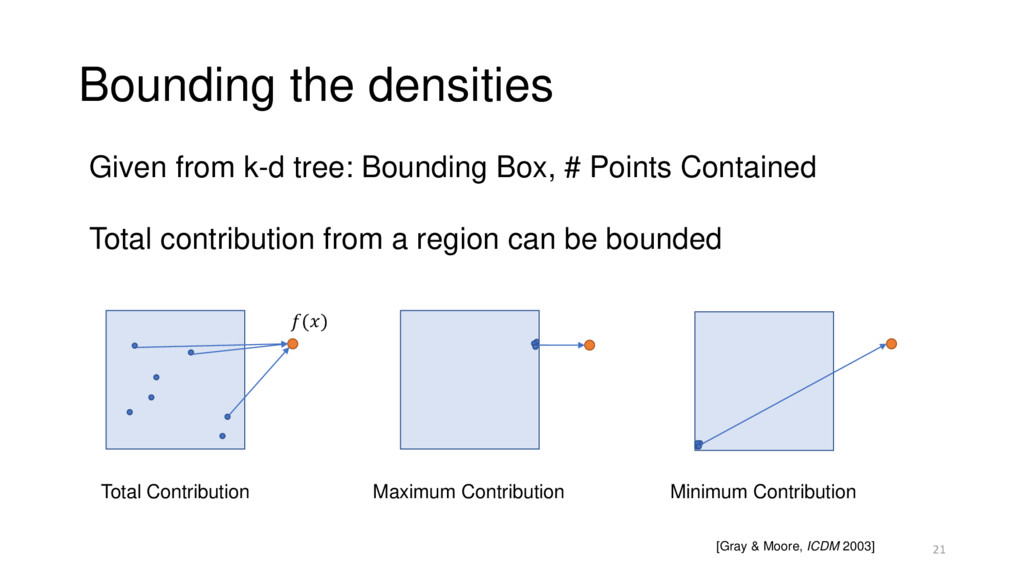
Bounding the densities Given from k-d tree: Bounding Box, #
Points Contained Total contribution from a region can be bounded [Gray & Moore, ICDM 2003] 21 Total Contribution Maximum Contribution Minimum Contribution () -
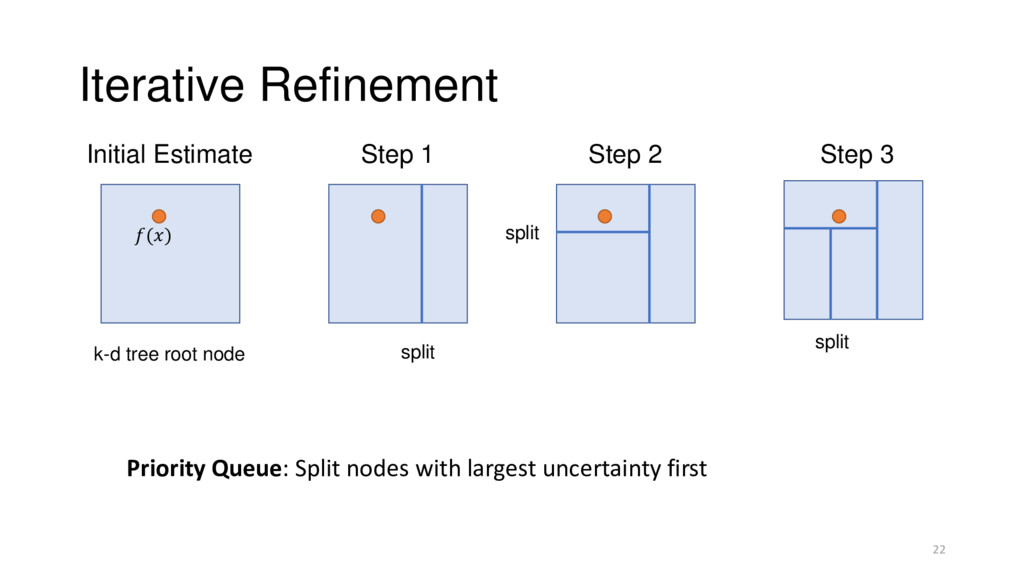
Iterative Refinement Initial Estimate Priority Queue: Split nodes with largest
uncertainty first 22 Step 1 k-d tree root node split split split () Step 2 Step 3 -
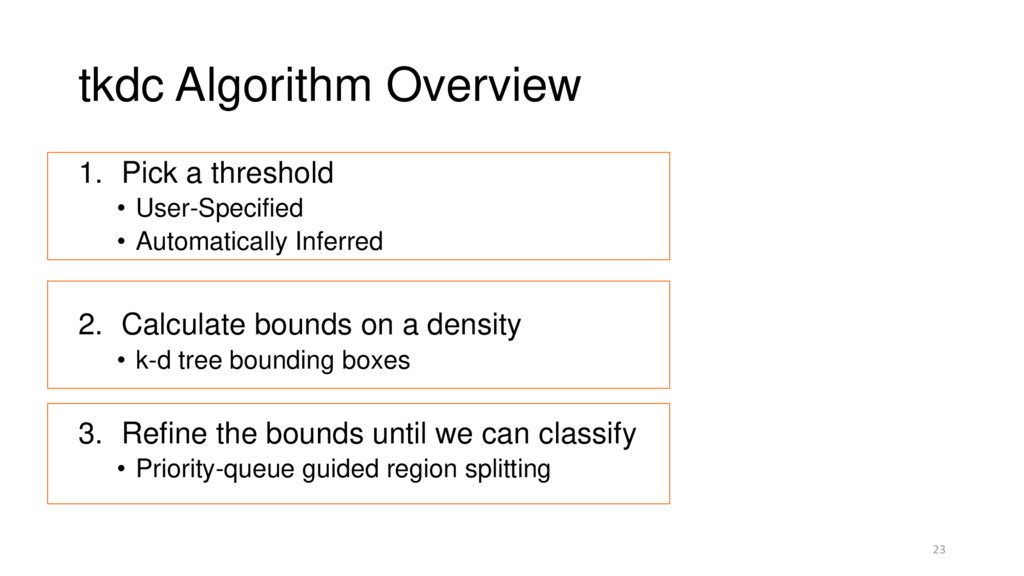
tkdc Algorithm Overview 1. Pick a threshold • User-Specified •
Automatically Inferred 2. Calculate bounds on a density • k-d tree bounding boxes 3. Refine the bounds until we can classify • Priority-queue guided region splitting 23 -
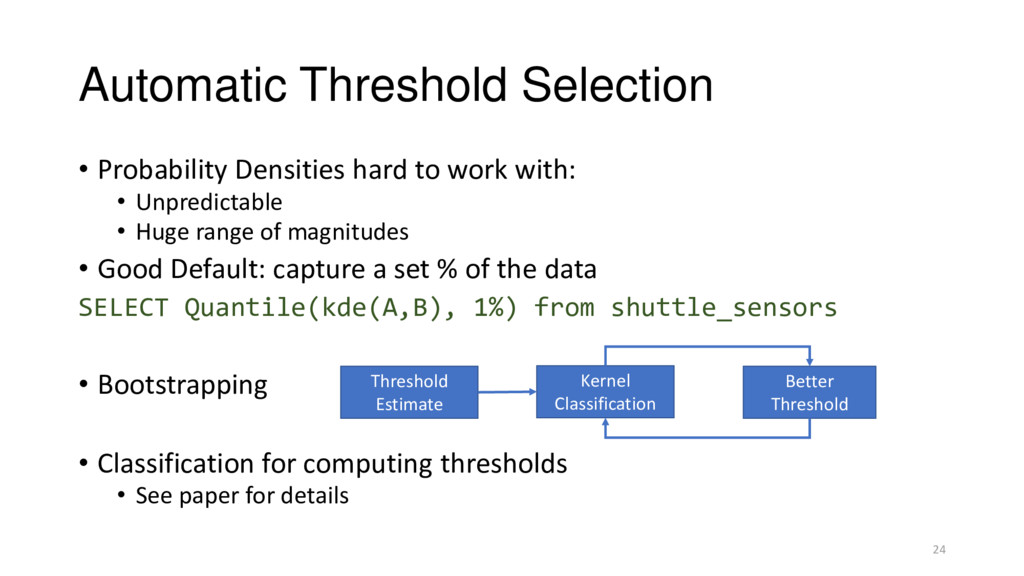
Automatic Threshold Selection • Probability Densities hard to work with:
• Unpredictable • Huge range of magnitudes • Good Default: capture a set % of the data SELECT Quantile(kde(A,B), 1%) from shuttle_sensors • Bootstrapping • Classification for computing thresholds • See paper for details Kernel Classification Better Threshold Threshold Estimate 24 -
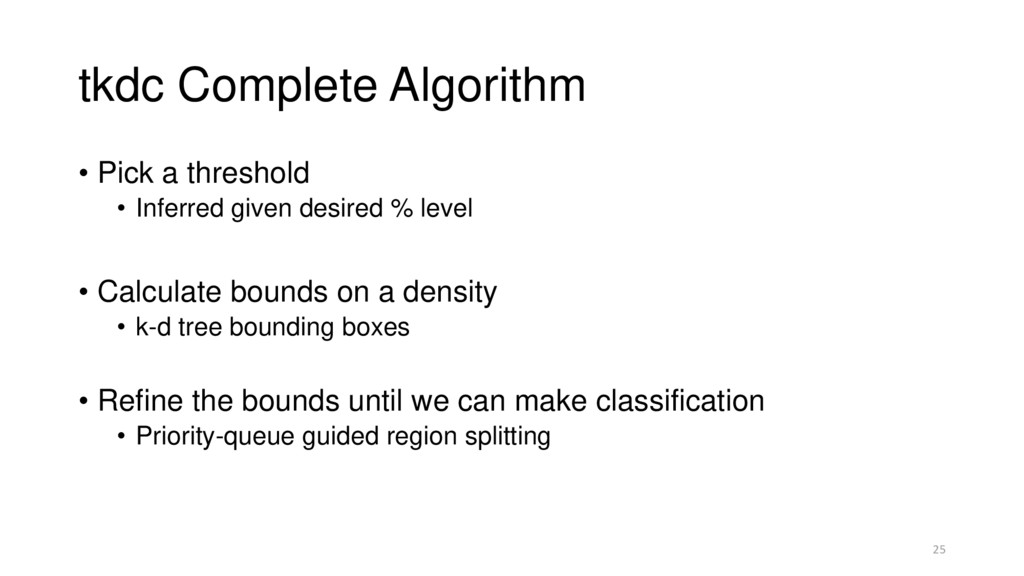
tkdc Complete Algorithm • Pick a threshold • Inferred given
desired % level • Calculate bounds on a density • k-d tree bounding boxes • Refine the bounds until we can make classification • Priority-queue guided region splitting 25 -
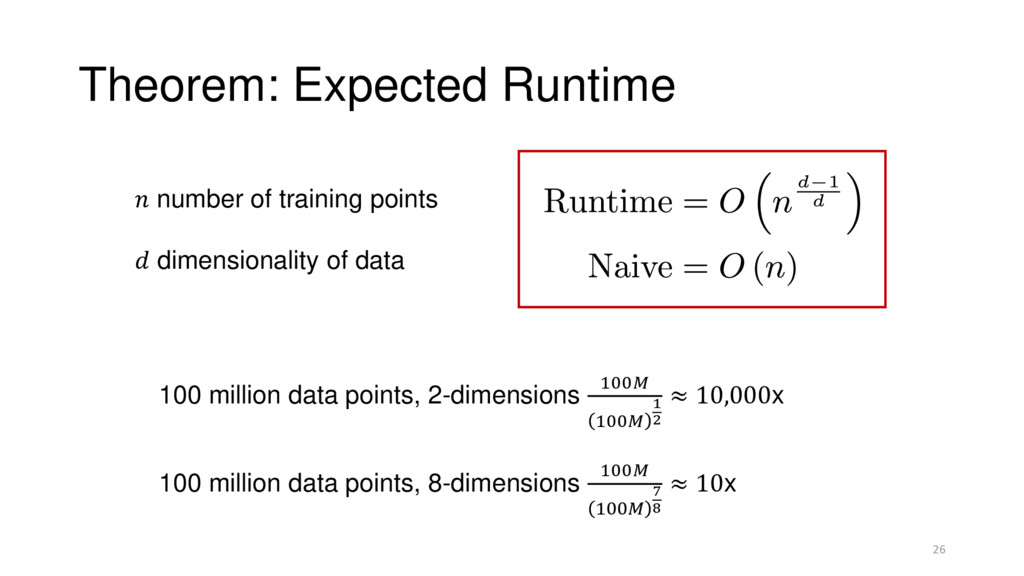
Theorem: Expected Runtime 26 100 million data points, 2-dimensions 100
100 1 2 ≈ 10,000x 100 million data points, 8-dimensions 100 100 7 8 ≈ 10x number of training points dimensionality of data -
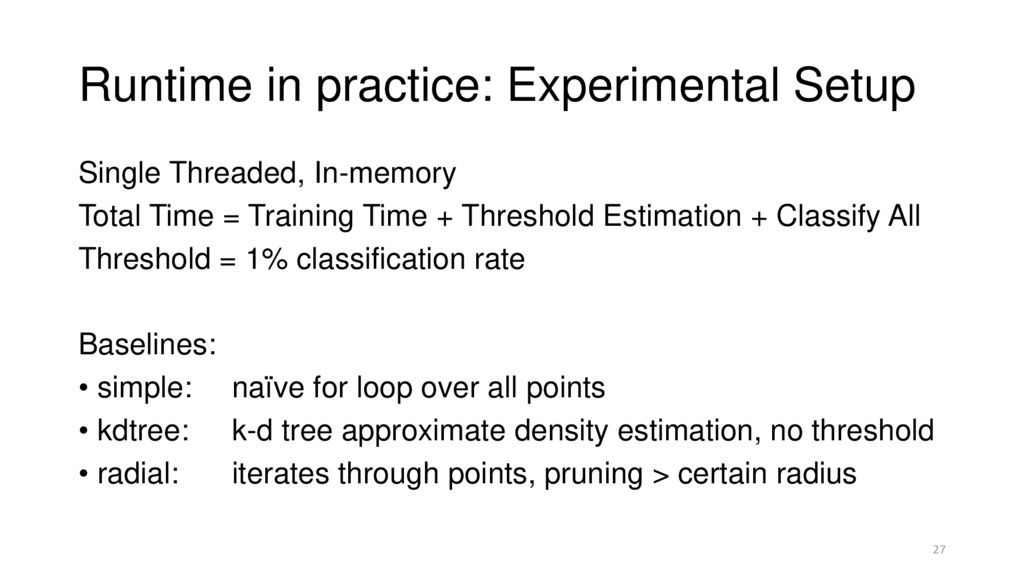
Runtime in practice: Experimental Setup Single Threaded, In-memory Total Time
= Training Time + Threshold Estimation + Classify All Threshold = 1% classification rate Baselines: • simple: naïve for loop over all points • kdtree: k-d tree approximate density estimation, no threshold • radial: iterates through points, pruning > certain radius 27 -
tkdc scales well with dataset size 30 Asymptotic Speedup Our
Algorithm: tkdc -
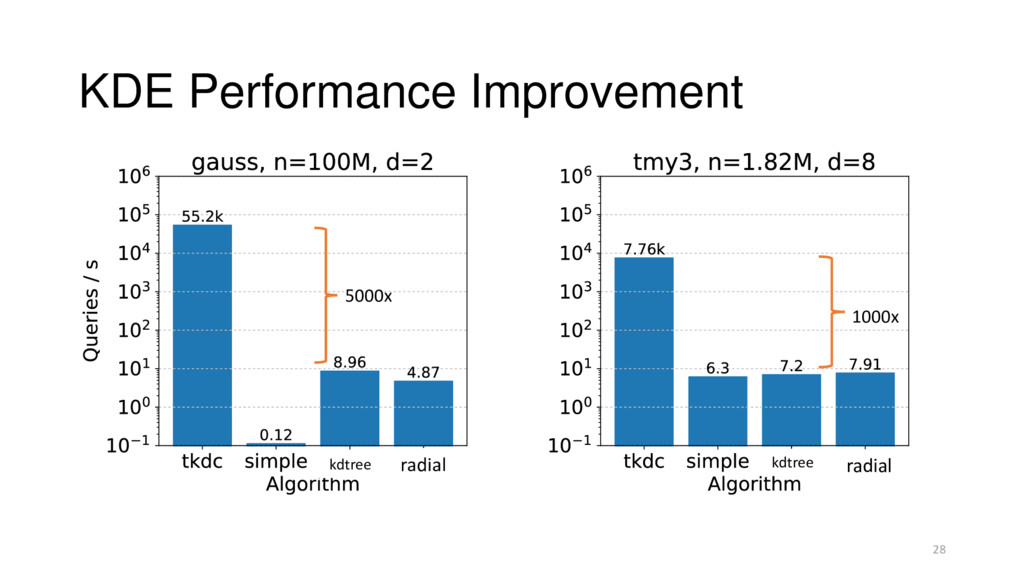
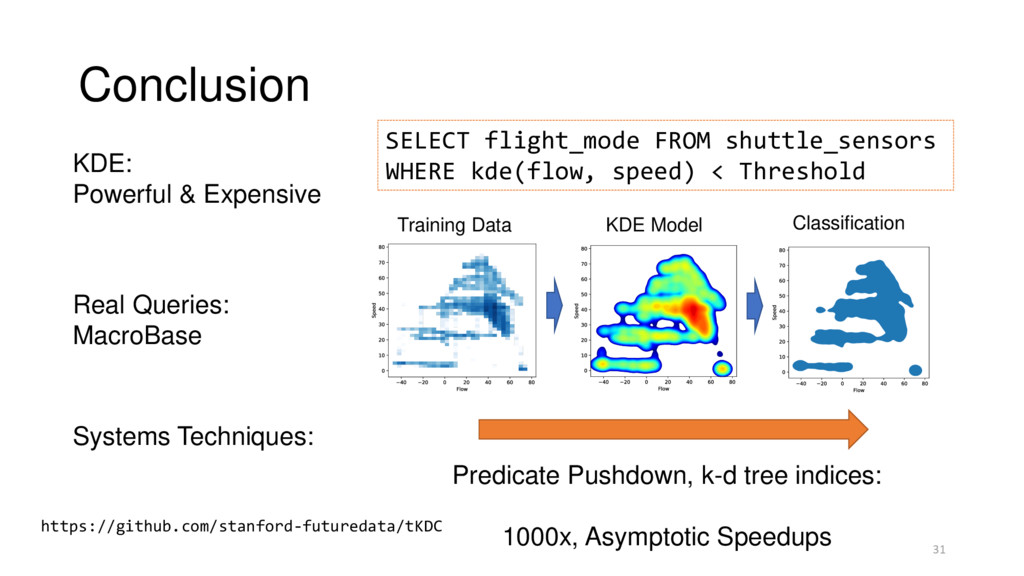
Conclusion Predicate Pushdown, k-d tree indices: 1000x, Asymptotic Speedups 31
Training Data KDE Model Classification SELECT flight_mode FROM shuttle_sensors WHERE kde(flow, speed) < Threshold KDE: Powerful & Expensive Real Queries: MacroBase Systems Techniques: https://github.com/stanford-futuredata/tKDC