Share
Embed
Transcript
39 slides
-
Who am I? PhD student: Stanford InfoLab (Peter Bailis, Matei
Zaharia) Main project: MacroBase, system for diagnosing anomalies Fun fact: first time in Portland + first conference talk! 2 -
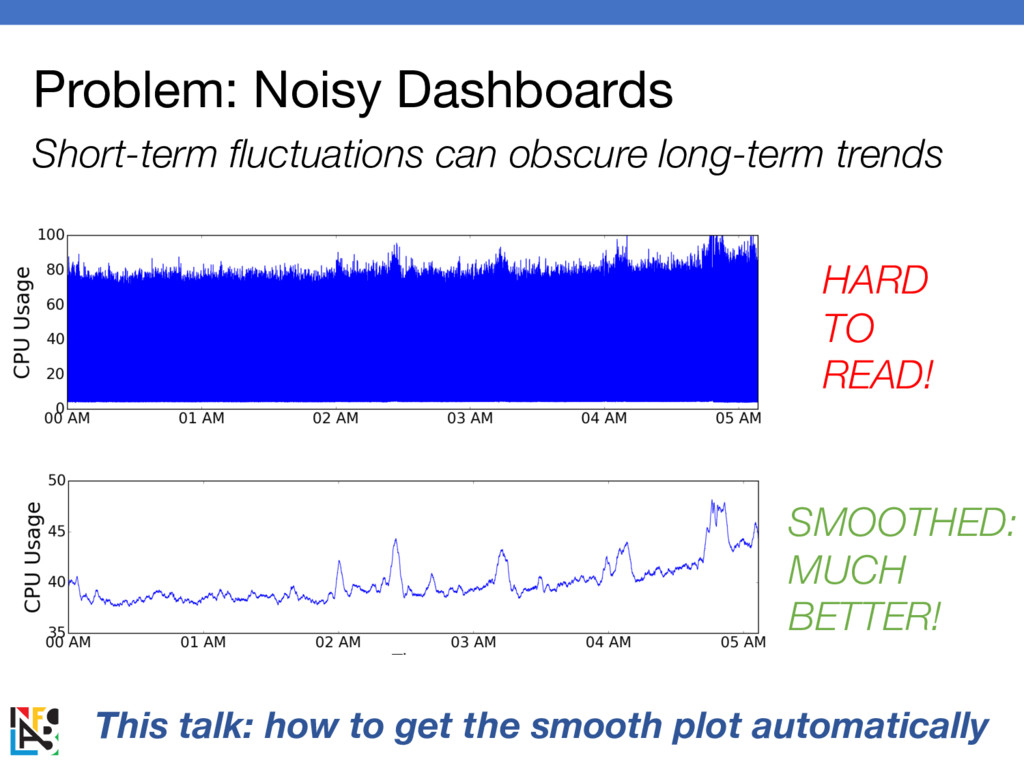
Problem: Noisy Dashboards Short-term fluctuations can obscure long-term trends HARD
TO READ! SMOOTHED: MUCH BETTER! This talk: how to get the smooth plot automatically -
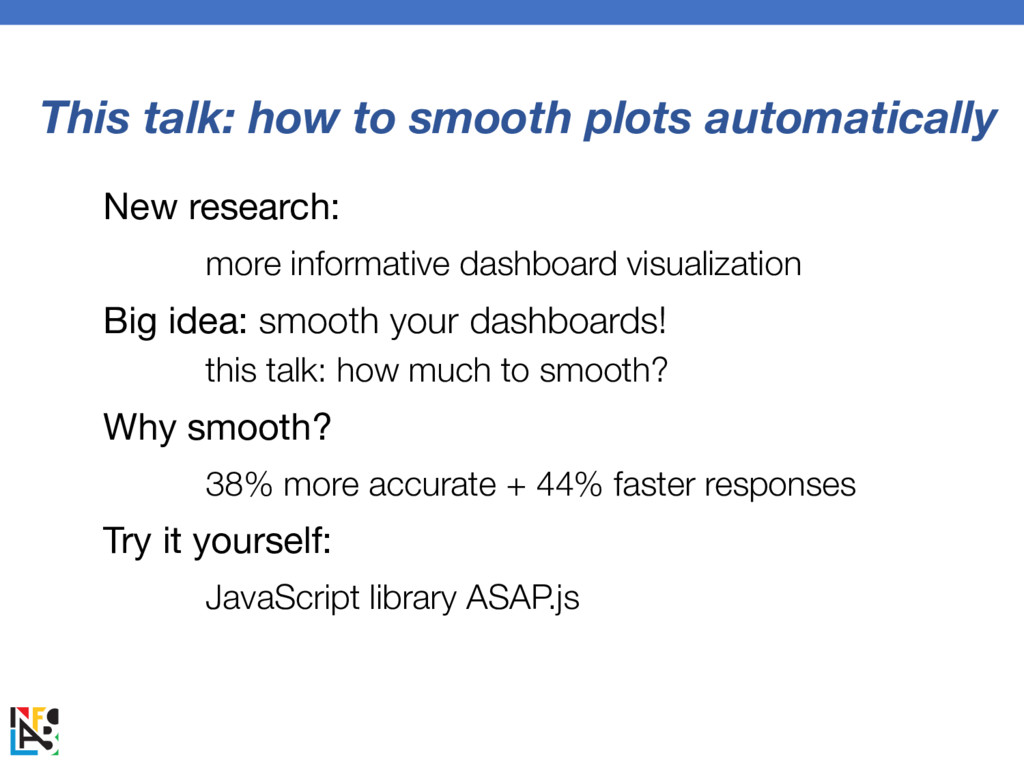
This talk: how to smooth plots automatically New research: more
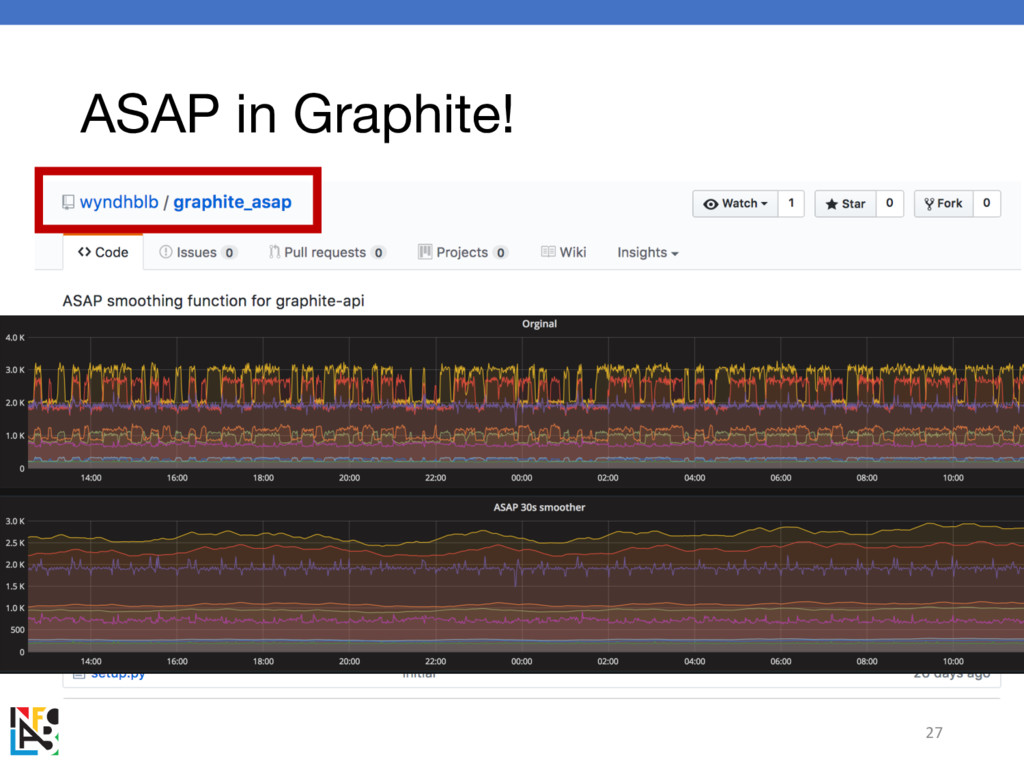
informative dashboard visualization Big idea: smooth your dashboards! this talk: how much to smooth? Why smooth? 38% more accurate + 44% faster responses Try it yourself: JavaScript library ASAP.js -
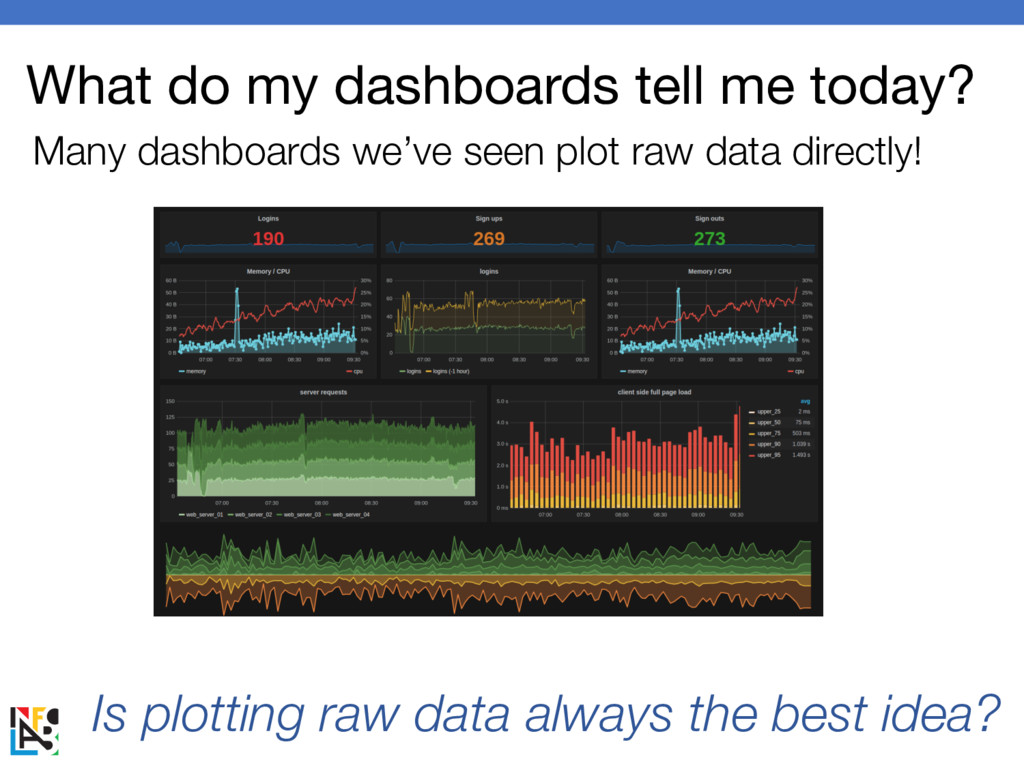
What do my dashboards tell me today? Many dashboards we’ve
seen plot raw data directly! Is plotting raw data always the best idea? -
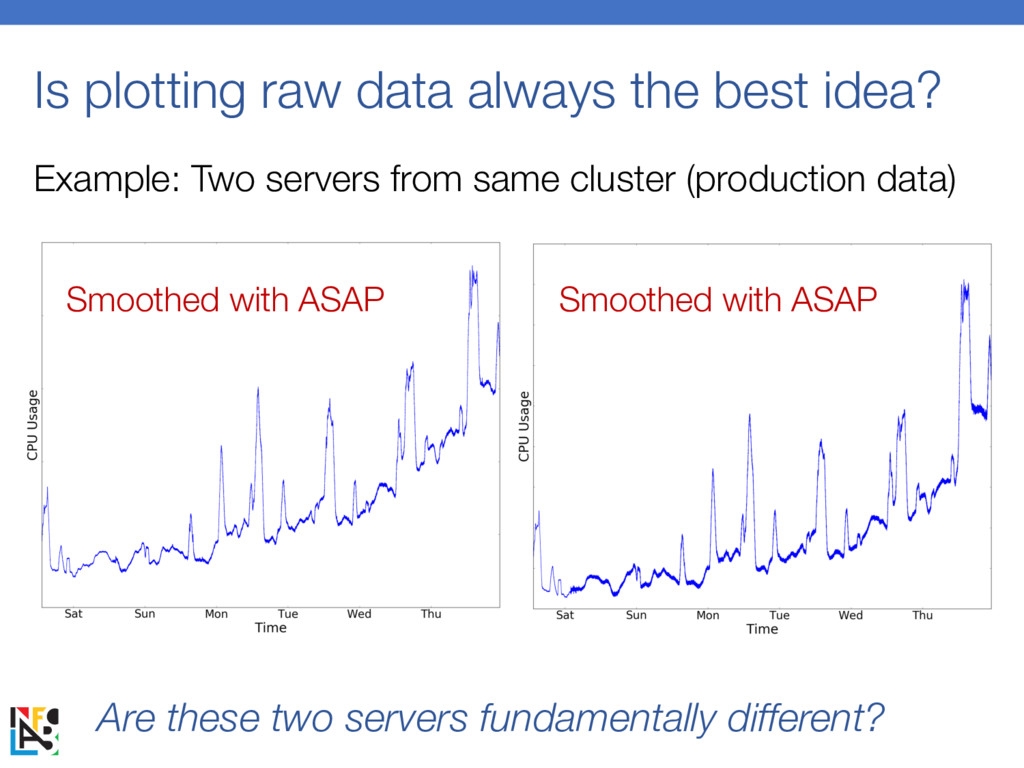
Is plotting raw data always the best idea? Example: Two
servers from same cluster (production data) Are these two servers fundamentally different? Smoothed with ASAP Smoothed with ASAP -
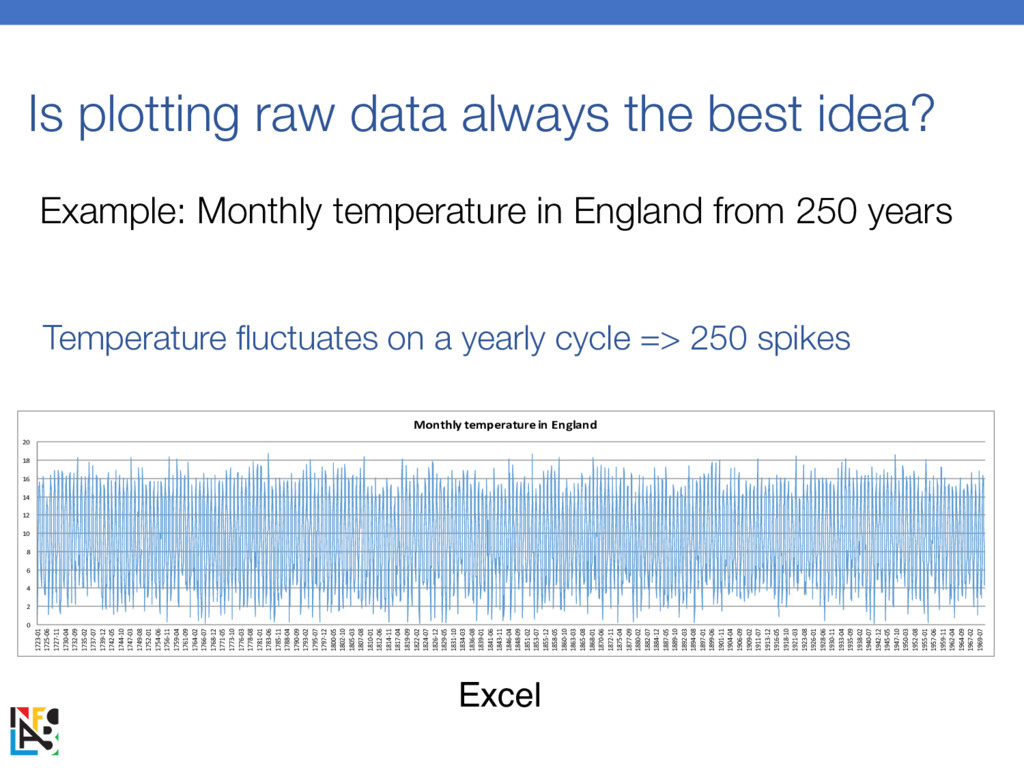
Is plotting raw data always the best idea? 0 2
4 6 8 10 12 14 16 18 20 1723-01 1725-06 1727-11 1730-04 1732-09 1735-02 1737-07 1739-12 1742-05 1744-10 1747-03 1749-08 1752-01 1754-06 1756-11 1759-04 1761-09 1764-02 1766-07 1768-12 1771-05 1773-10 1776-03 1778-08 1781-01 1783-06 1785-11 1788-04 1790-09 1793-02 1795-07 1797-12 1800-05 1802-10 1805-03 1807-08 1810-01 1812-06 1814-11 1817-04 1819-09 1822-02 1824-07 1826-12 1829-05 1831-10 1834-03 1836-08 1839-01 1841-06 1843-11 1846-04 1848-09 1851-02 1853-07 1855-12 1858-05 1860-10 1863-03 1865-08 1868-01 1870-06 1872-11 1875-04 1877-09 1880-02 1882-07 1884-12 1887-05 1889-10 1892-03 1894-08 1897-01 1899-06 1901-11 1904-04 1906-09 1909-02 1911-07 1913-12 1916-05 1918-10 1921-03 1923-08 1926-01 1928-06 1930-11 1933-04 1935-09 1938-02 1940-07 1942-12 1945-05 1947-10 1950-03 1952-08 1955-01 1957-06 1959-11 1962-04 1964-09 1967-02 1969-07 Monthly temperature in England Excel Example: Monthly temperature in England from 250 years Temperature fluctuates on a yearly cycle => 250 spikes -
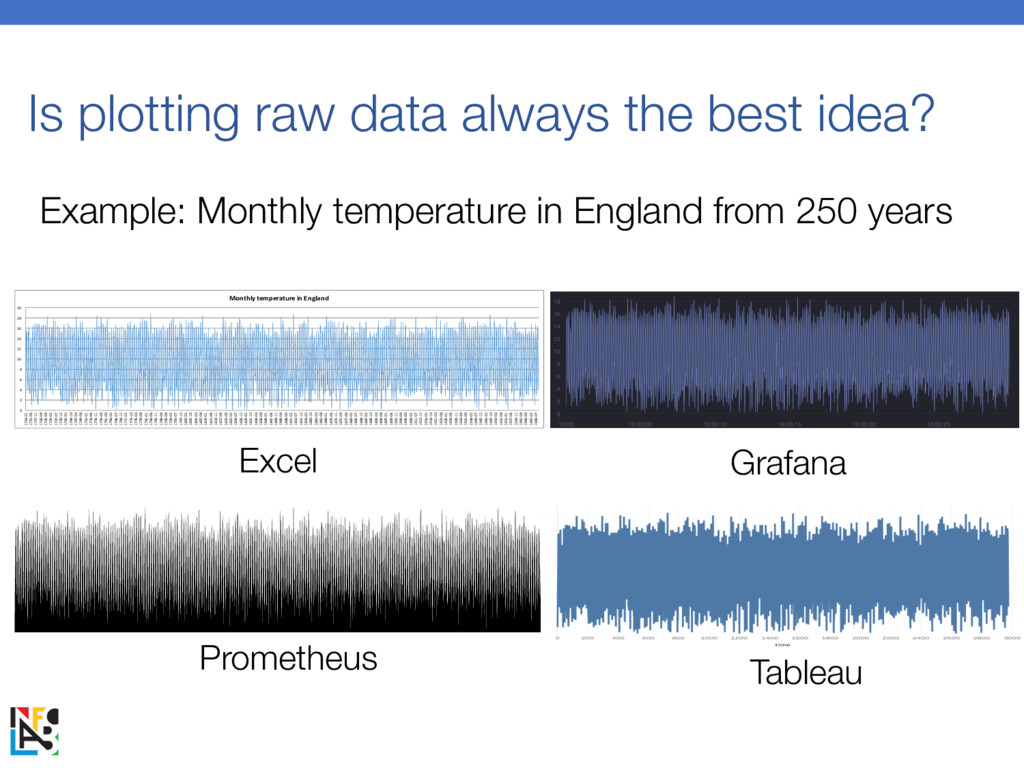
0 2 4 6 8 10 12 14 16 18
20 1723-01 1725-06 1727-11 1730-04 1732-09 1735-02 1737-07 1739-12 1742-05 1744-10 1747-03 1749-08 1752-01 1754-06 1756-11 1759-04 1761-09 1764-02 1766-07 1768-12 1771-05 1773-10 1776-03 1778-08 1781-01 1783-06 1785-11 1788-04 1790-09 1793-02 1795-07 1797-12 1800-05 1802-10 1805-03 1807-08 1810-01 1812-06 1814-11 1817-04 1819-09 1822-02 1824-07 1826-12 1829-05 1831-10 1834-03 1836-08 1839-01 1841-06 1843-11 1846-04 1848-09 1851-02 1853-07 1855-12 1858-05 1860-10 1863-03 1865-08 1868-01 1870-06 1872-11 1875-04 1877-09 1880-02 1882-07 1884-12 1887-05 1889-10 1892-03 1894-08 1897-01 1899-06 1901-11 1904-04 1906-09 1909-02 1911-07 1913-12 1916-05 1918-10 1921-03 1923-08 1926-01 1928-06 1930-11 1933-04 1935-09 1938-02 1940-07 1942-12 1945-05 1947-10 1950-03 1952-08 1955-01 1957-06 1959-11 1962-04 1964-09 1967-02 1969-07 Monthly temperature in England Excel Grafana Prometheus Tableau Is plotting raw data always the best idea? Example: Monthly temperature in England from 250 years -
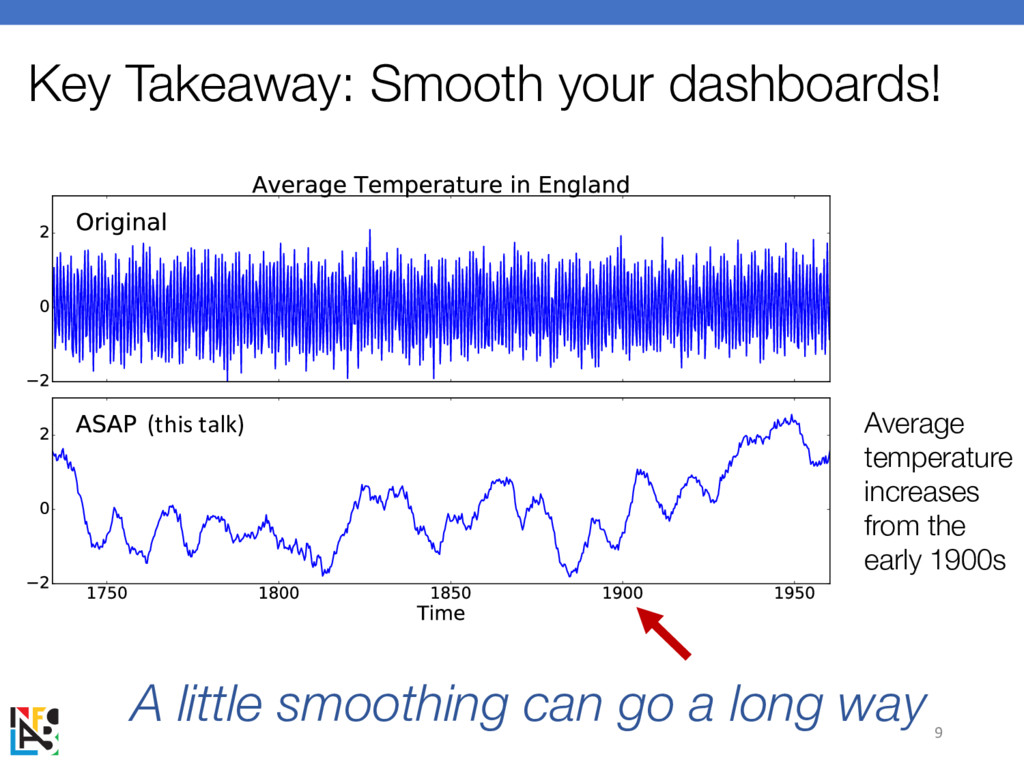
(this talk) Key Takeaway: Smooth your dashboards! A little smoothing
can go a long way 9 Average temperature increases from the early 1900s -
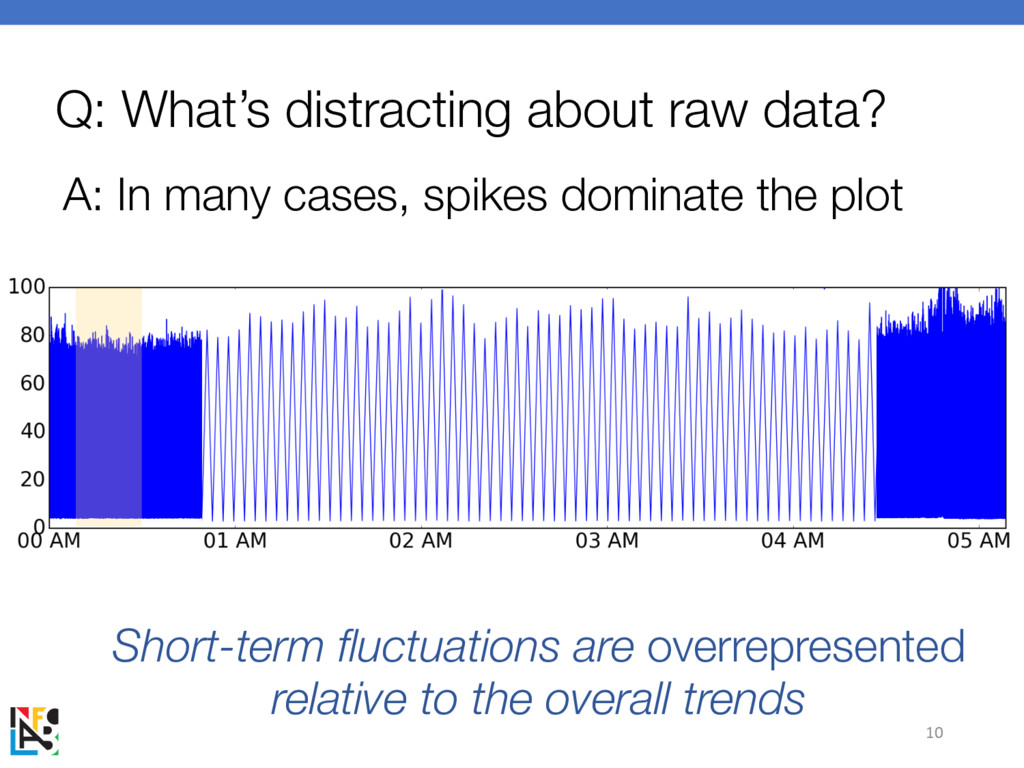
Q: What’s distracting about raw data? A: In many cases,
spikes dominate the plot 10 Short-term fluctuations are overrepresented relative to the overall trends -
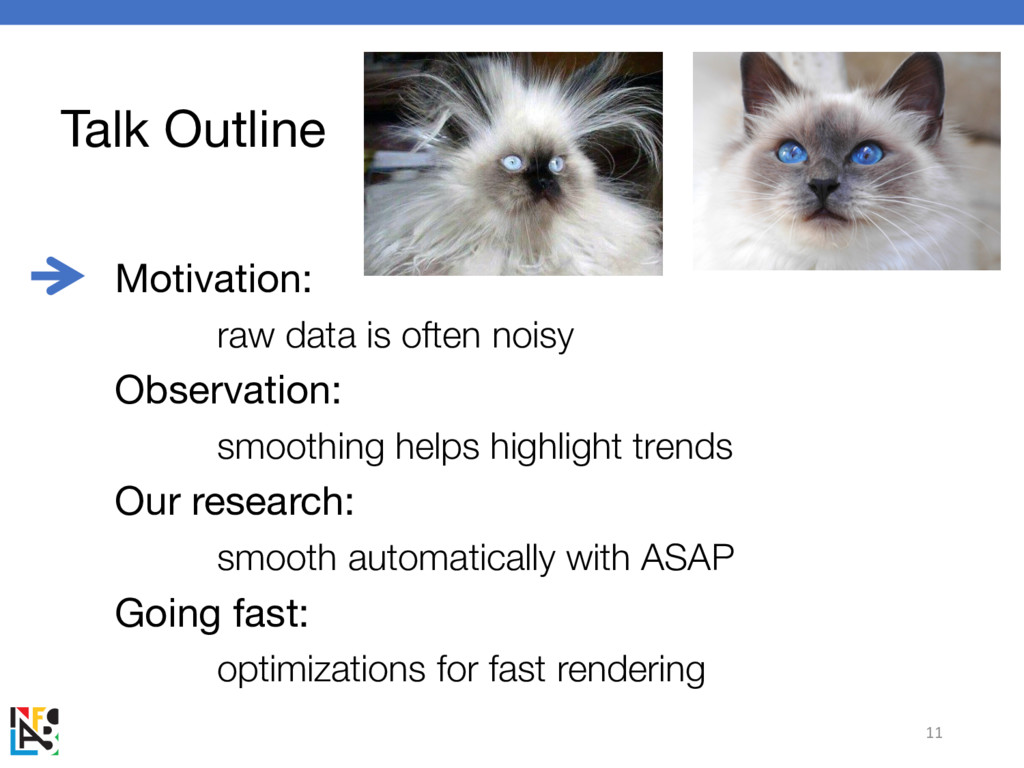
Talk Outline Motivation: raw data is often noisy Observation: smoothing
helps highlight trends Our research: smooth automatically with ASAP Going fast: optimizations for fast rendering 11 -
How should we smooth visualizations? Q: What smoothing function should
we use? A: Moving average works Signal Processing Theory: Optimal for removing noise 1 2 3 4 5 6 2.5 3.5 4.5 window size: 4 Average Average Average -
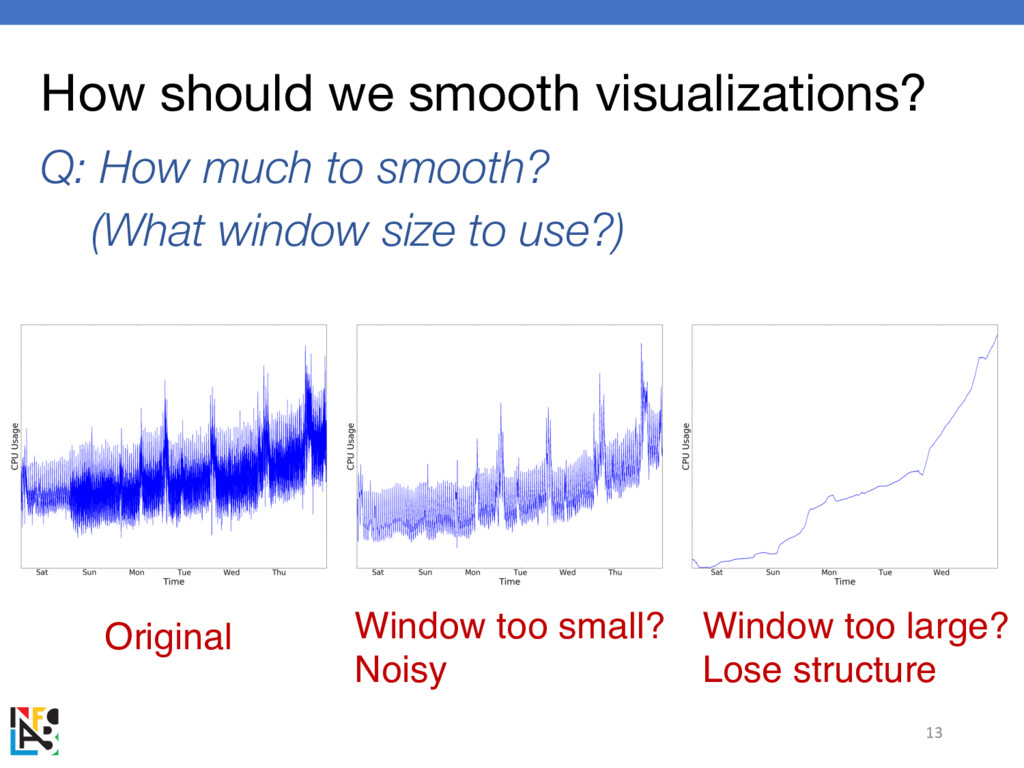
How should we smooth visualizations? Q: How much to smooth?
(What window size to use?) 13 Window too small? Noisy Window too large? Lose structure Original -
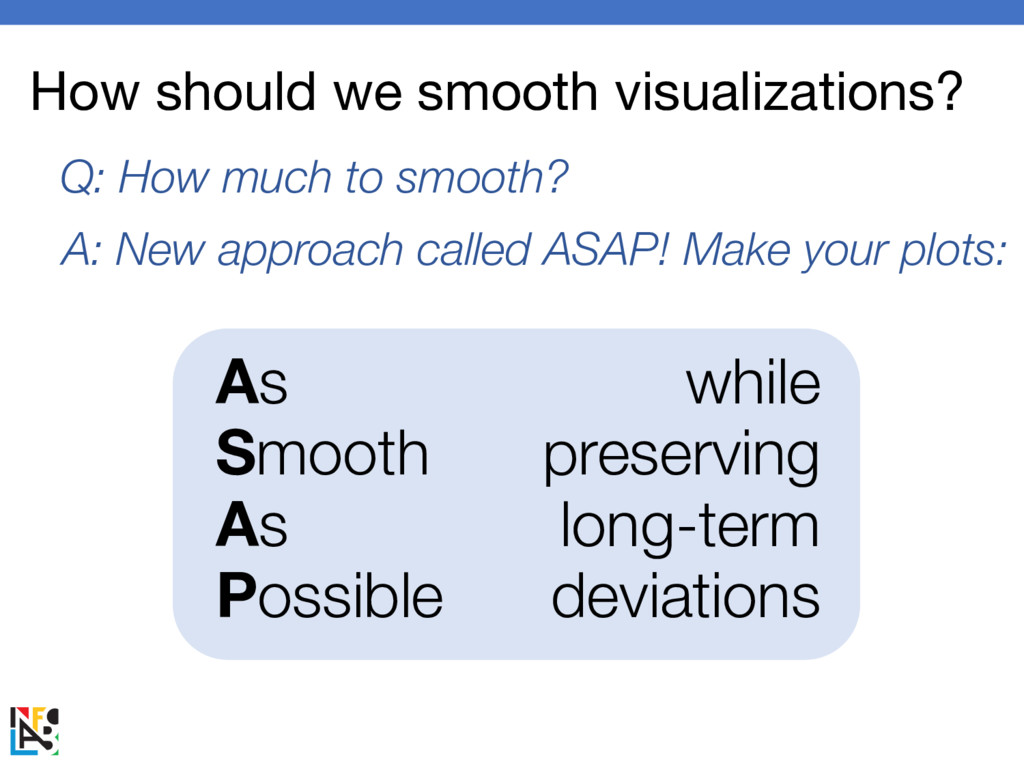
How should we smooth visualizations? Q: How much to smooth?
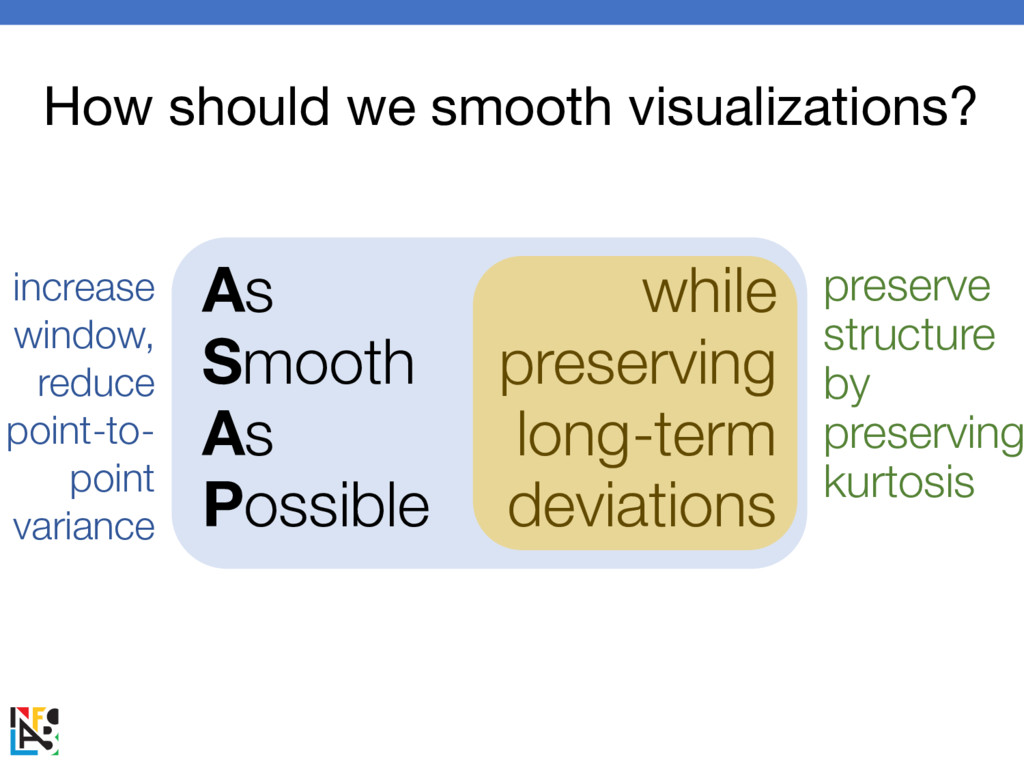
A: New approach called ASAP! Make your plots: As Smooth As Possible while preserving long-term deviations -
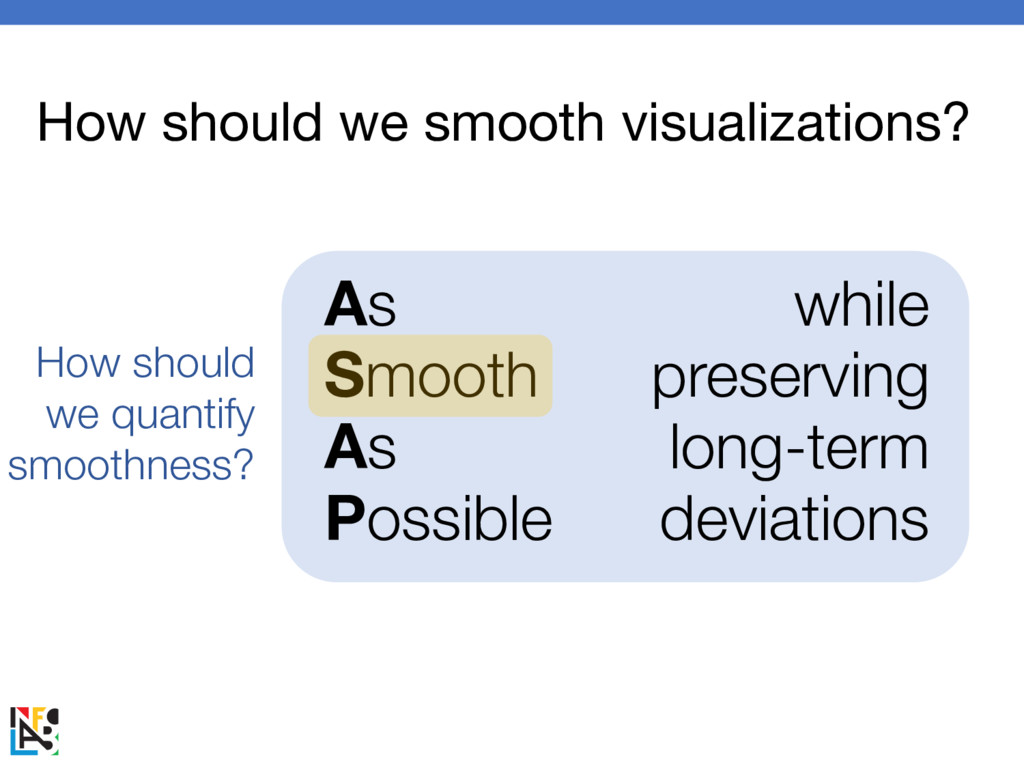
As Smooth As Possible while preserving long-term deviations How should
we smooth visualizations? How should we quantify smoothness? -
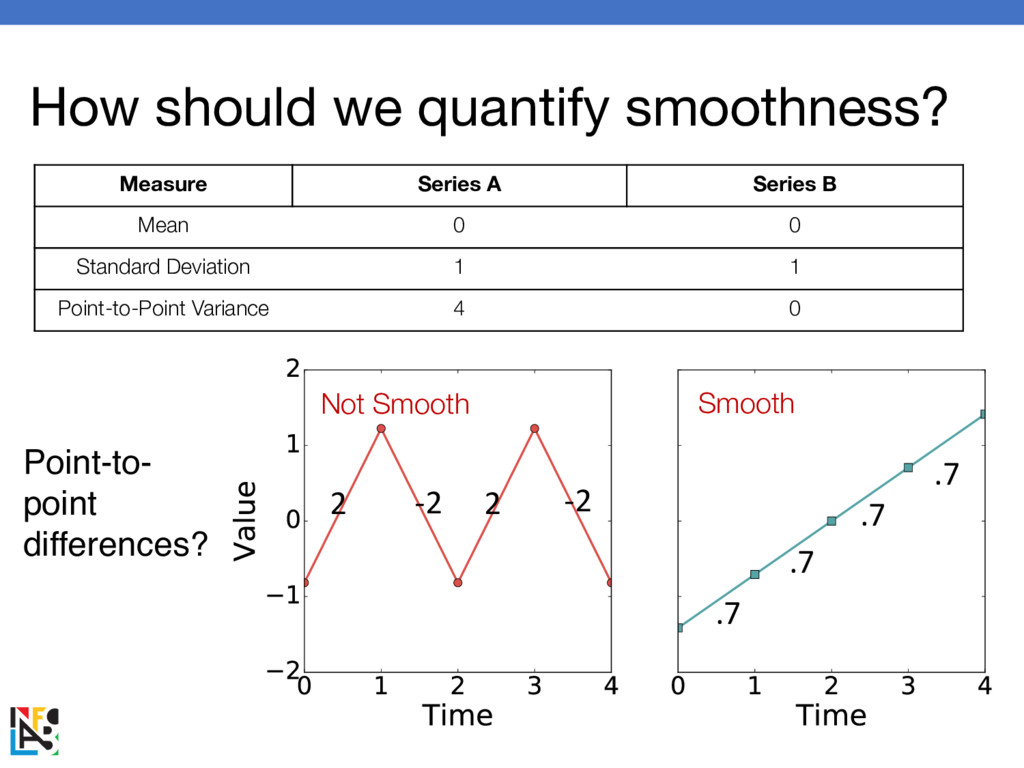
How should we quantify smoothness? Measure Series A Series B
Mean 0 0 Standard Deviation 1 1 Point-to-Point Variance 4 0 2 2 -2 -2 .7 .7 .7 .7 Point-to- point differences? Smooth Not Smooth -
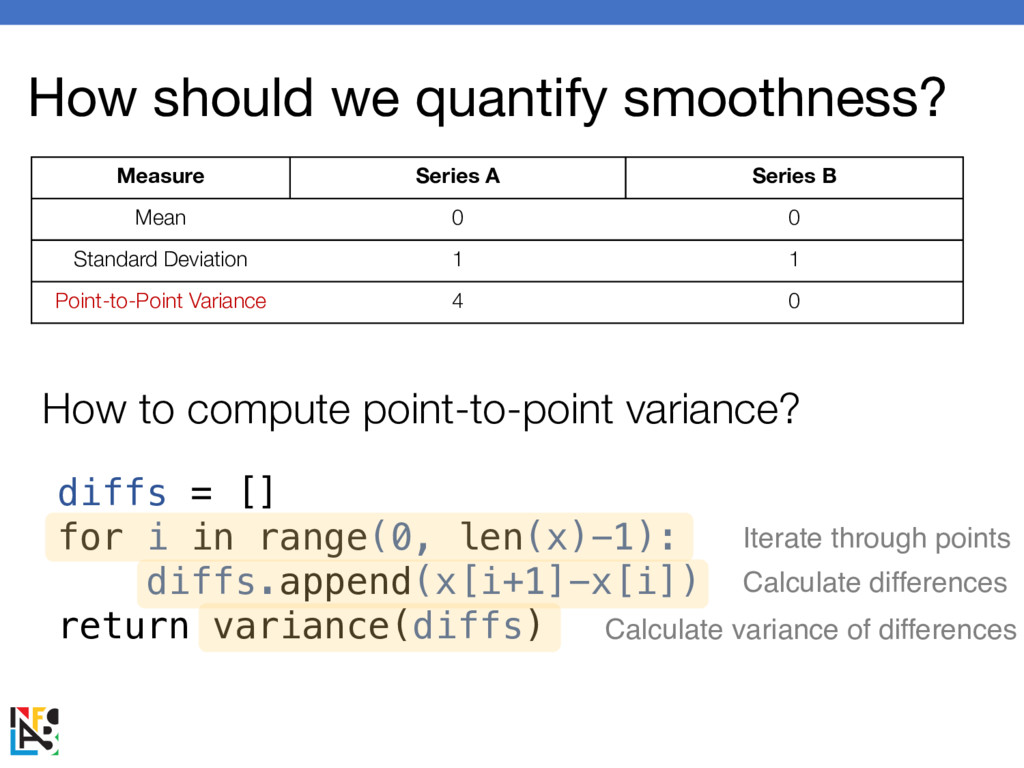
How should we quantify smoothness? Measure Series A Series B
Mean 0 0 Standard Deviation 1 1 Point-to-Point Variance 4 0 diffs = [] for i in range(0, len(x)-1): diffs.append(x[i+1]-x[i]) return variance(diffs) How to compute point-to-point variance? Iterate through points Calculate differences Calculate variance of differences -
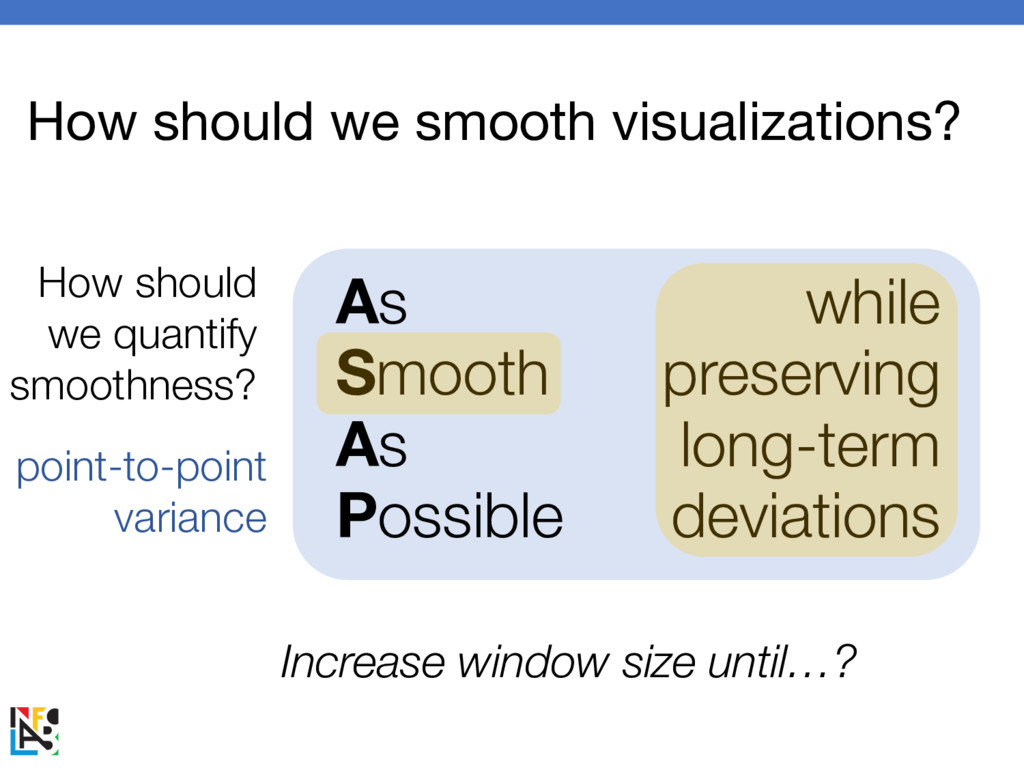
As Smooth As Possible while preserving long-term deviations How should
we smooth visualizations? How should we quantify smoothness? point-to-point variance Increase window size until…? -
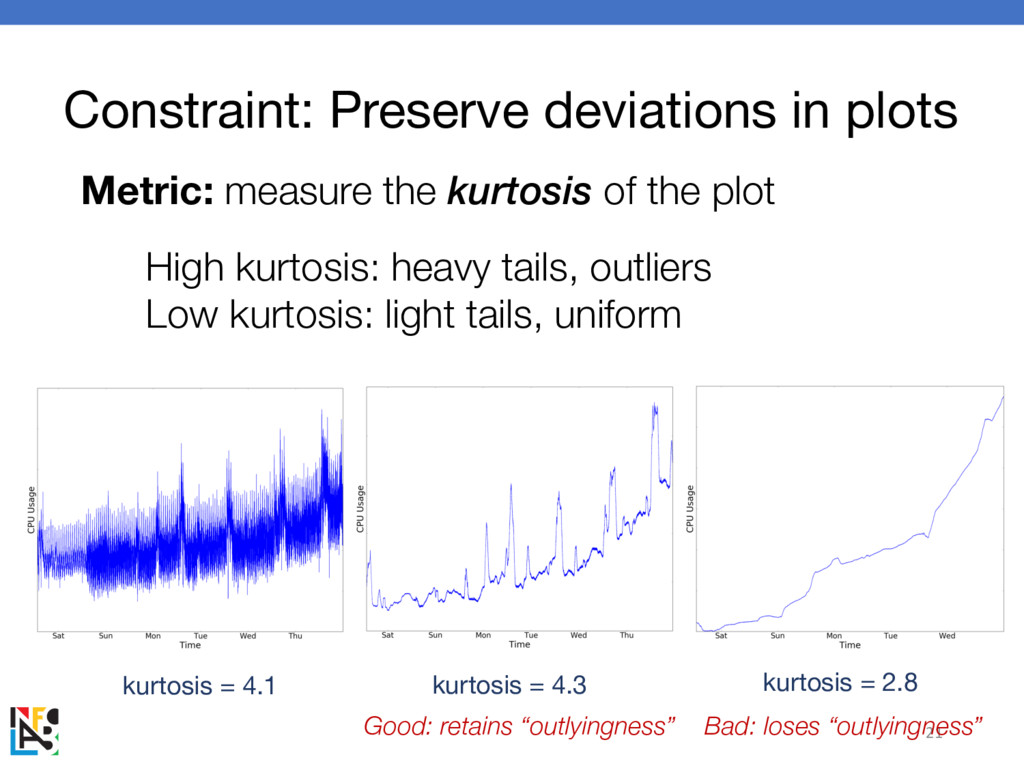
Constraint: Preserve deviations in plots Goal: avoid oversmoothing 19 Idea:
measure the “outlyingness” of the plot Good: retains “outlyingness” Bad: loses “outlyingness” Original: noisy -
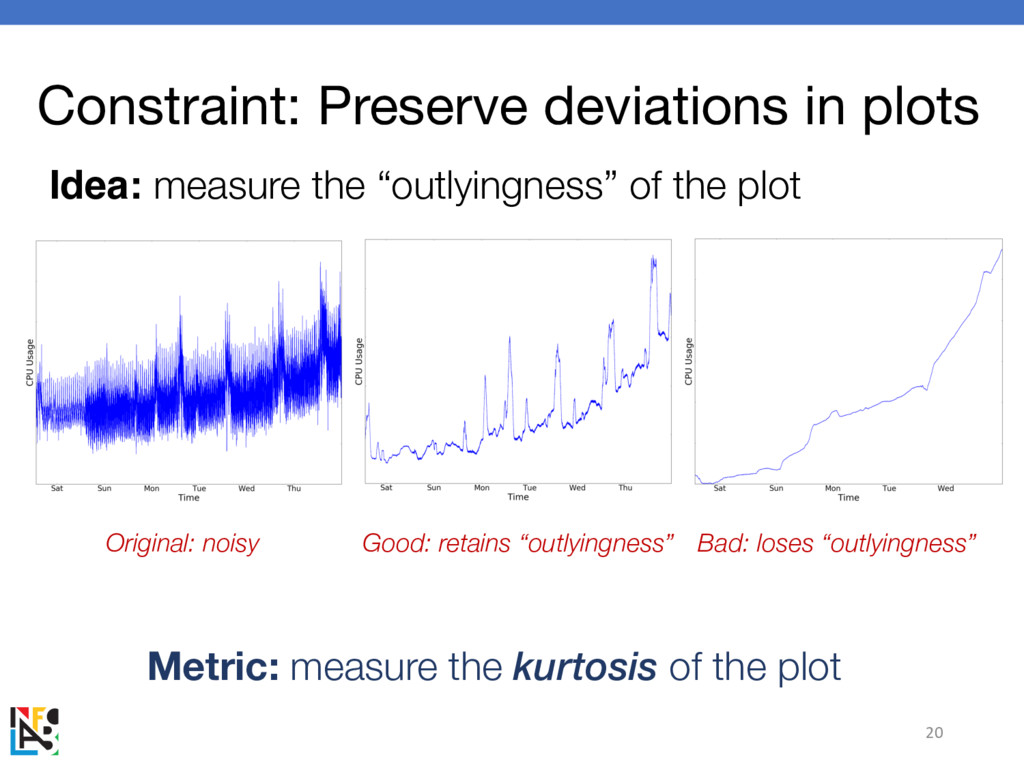
Constraint: Preserve deviations in plots 20 Idea: measure the “outlyingness”
of the plot Metric: measure the kurtosis of the plot Good: retains “outlyingness” Bad: loses “outlyingness” Original: noisy -
Constraint: Preserve deviations in plots 21 Metric: measure the kurtosis
of the plot High kurtosis: heavy tails, outliers Low kurtosis: light tails, uniform kurtosis = 4.3 kurtosis = 2.8 kurtosis = 4.1 Good: retains “outlyingness” Bad: loses “outlyingness” -
22 m = mean(x) tmp = 0 for i in
range(0, len(x)): tmp += (x[i] – m)4 return tmp / (len(x) * variance(x)2) How to compute kurtosis? Iterate through points Difference to the fourth power Divide by variance squared from scipy.stats import kurtosis Or, do it yourself Metric: measure the kurtosis of the plot Constraint: Preserve deviations in plots -
As Smooth As Possible while preserving long-term deviations How should
we smooth visualizations? increase window, reduce point-to- point variance preserve structure by preserving kurtosis -
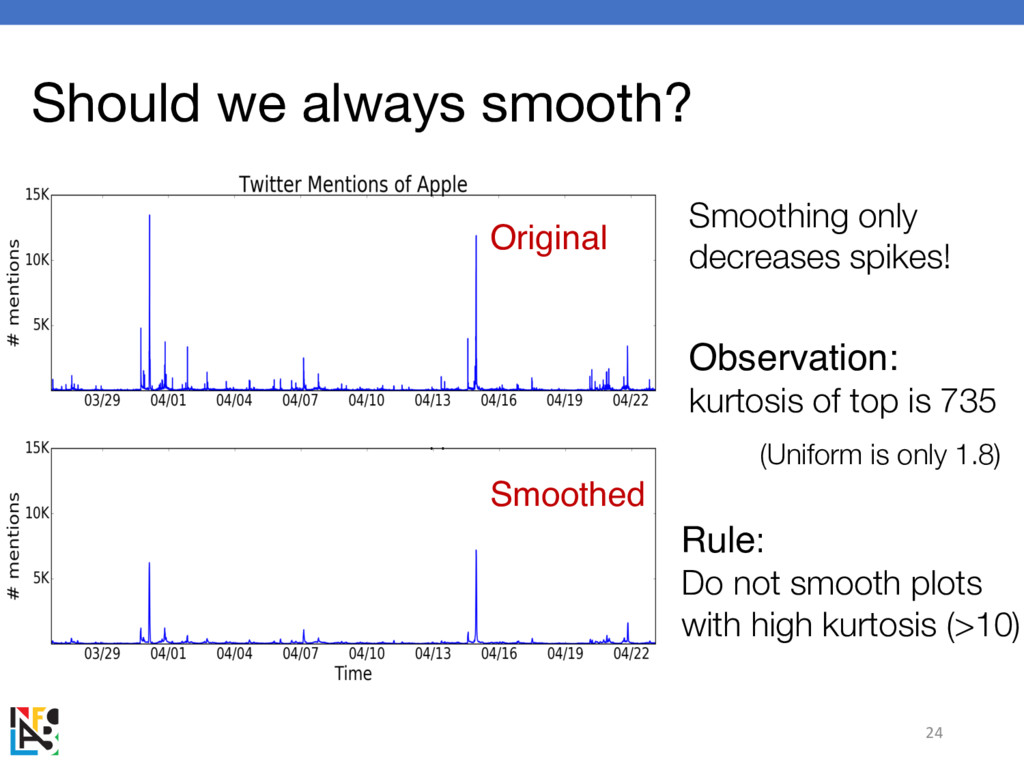
Should we always smooth? 24 Smoothing only decreases spikes! Rule:
Do not smooth plots with high kurtosis (>10) Observation: kurtosis of top is 735 Original Smoothed (Uniform is only 1.8) -
ASAP Recap procedure: minimize point-to-point variance by adjusting window size
while preserving kurtosis 25 As Smooth As Possible while preserving long-term deviations -
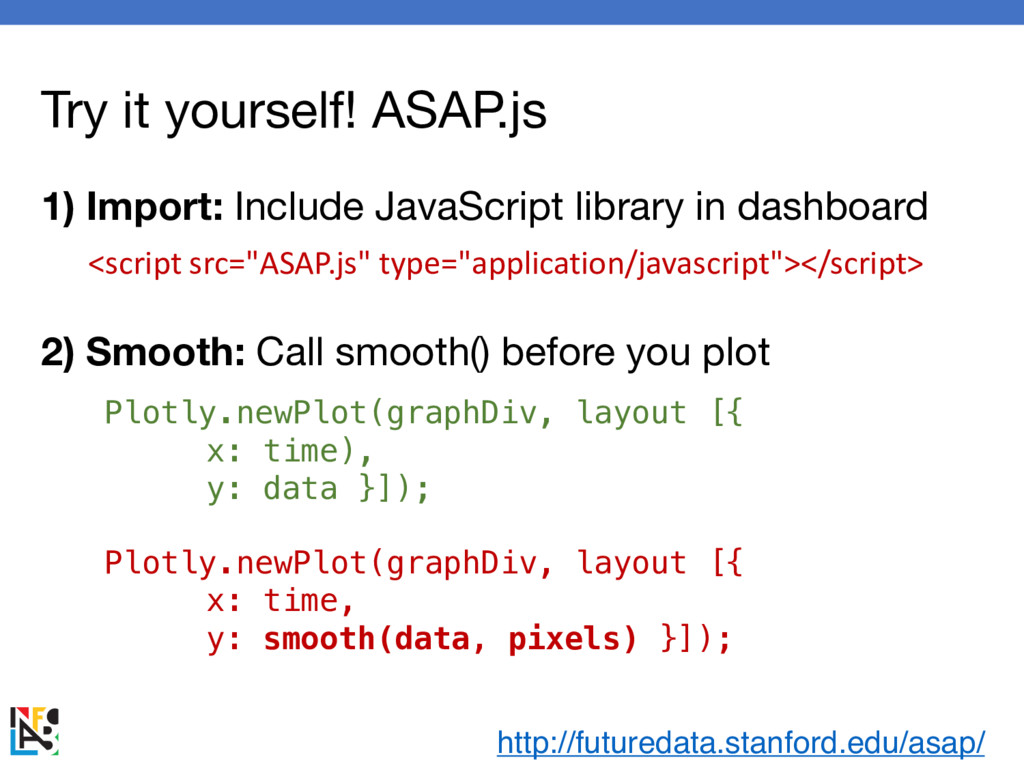
Try it yourself! ASAP.js Plotly.newPlot(graphDiv, layout [{ x: time), y:
data }]); Plotly.newPlot(graphDiv, layout [{ x: time, y: smooth(data, pixels) }]); <script src="ASAP.js" type="application/javascript"></script> http://futuredata.stanford.edu/asap/ 1) Import: Include JavaScript library in dashboard 2) Smooth: Call smooth() before you plot before after -
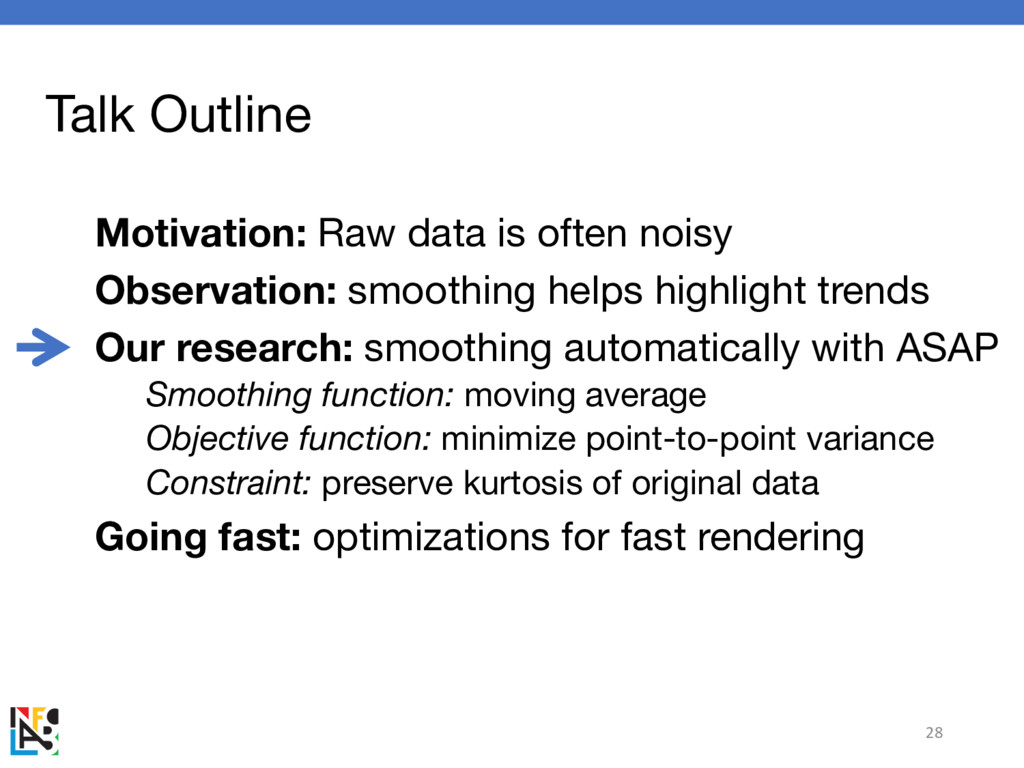
Talk Outline Motivation: Raw data is often noisy Observation: smoothing
helps highlight trends Our research: smoothing automatically with ASAP Smoothing function: moving average Objective function: minimize point-to-point variance Constraint: preserve kurtosis of original data Going fast: optimizations for fast rendering 28 -
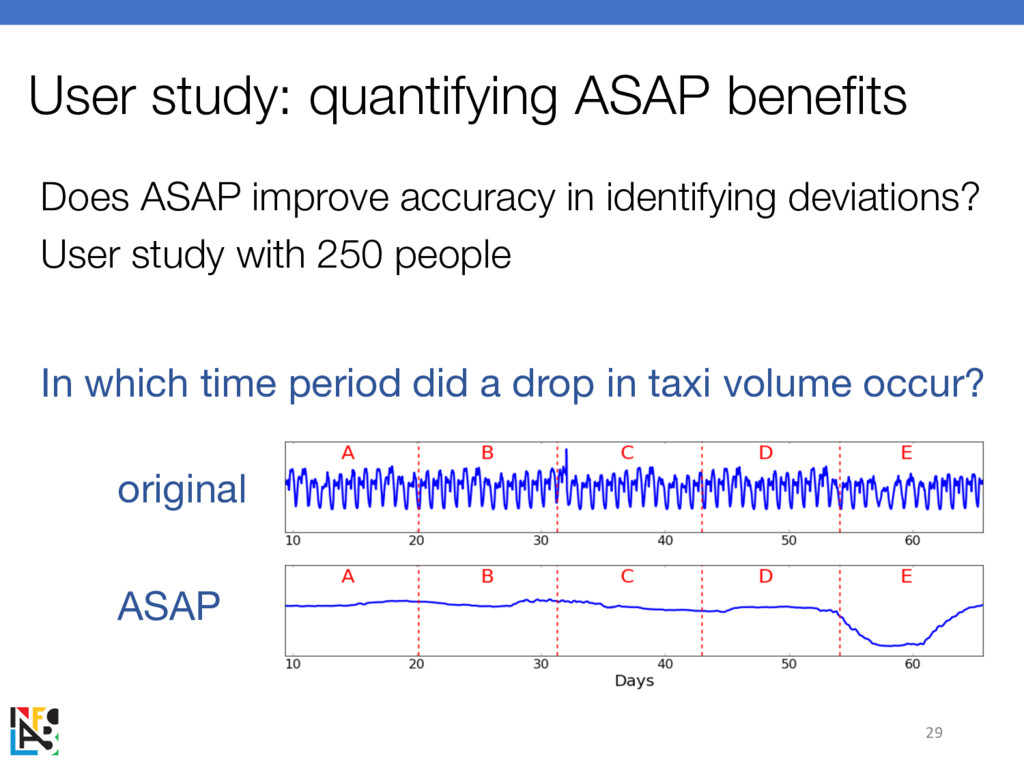
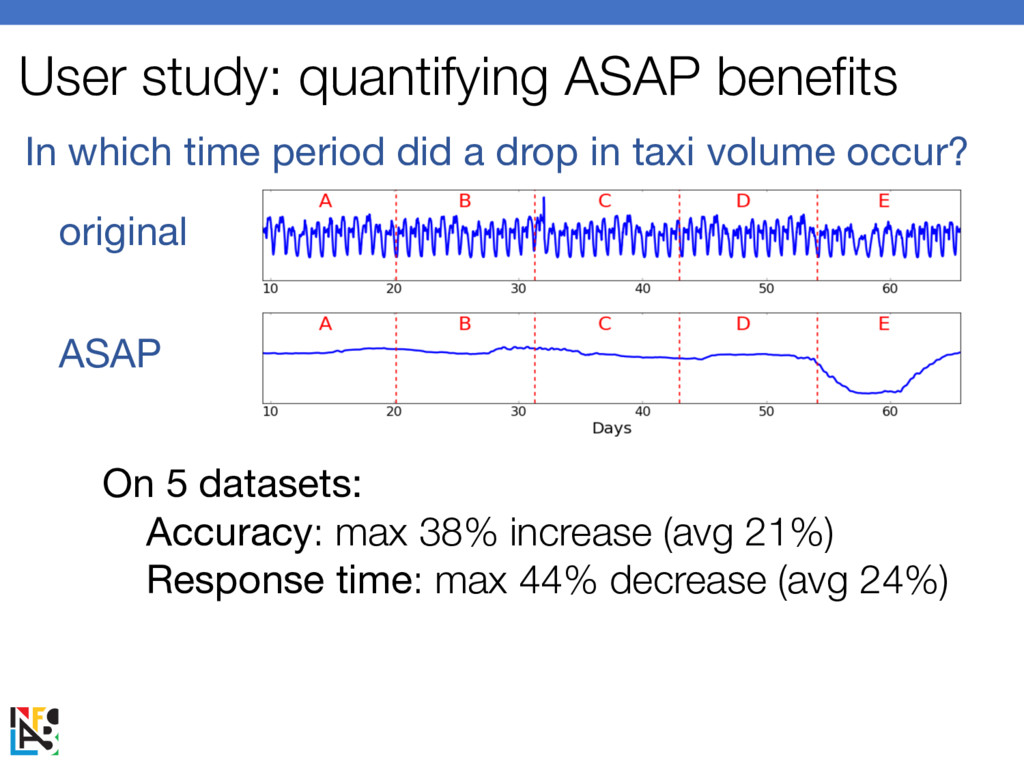
Does ASAP improve accuracy in identifying deviations? User study with
250 people 29 User study: quantifying ASAP benefits In which time period did a drop in taxi volume occur? original ASAP -
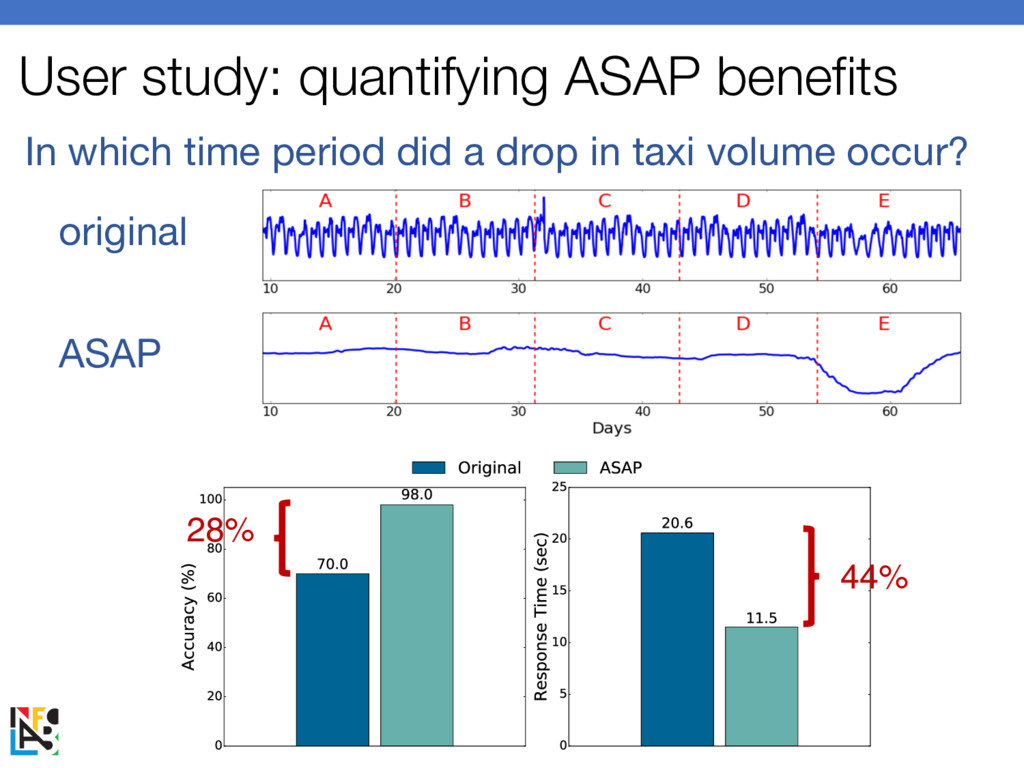
User study: quantifying ASAP benefits In which time period did
a drop in taxi volume occur? original ASAP 28% 44% -
User study: quantifying ASAP benefits In which time period did
a drop in taxi volume occur? original ASAP 28% 44% On 5 datasets: Accuracy: max 38% increase (avg 21%) Response time: max 44% decrease (avg 24%) -
Talk Outline Motivation: Raw data is often noisy Observation: smoothing
helps highlight trends Our research: smoothing automatically with ASAP Smoothing function: moving average Objective function: minimize point-to-point variance Constraint: preserve kurtosis of original data Going fast: optimizations for fast rendering 32 -
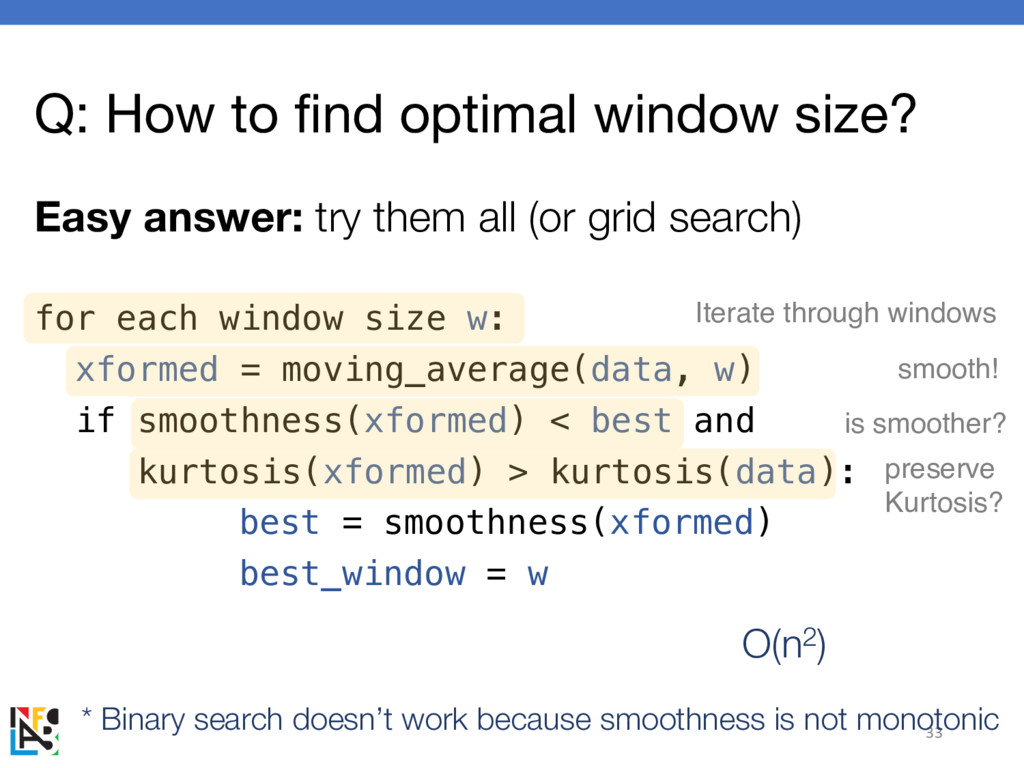
Q: How to find optimal window size? Easy answer: try
them all (or grid search) 33 for each window size w: xformed = moving_average(data, w) if smoothness(xformed) < best and kurtosis(xformed) > kurtosis(data): best = smoothness(xformed) best_window = w Iterate through windows smooth! preserve Kurtosis? is smoother? * Binary search doesn’t work because smoothness is not monotonic O(n2) -
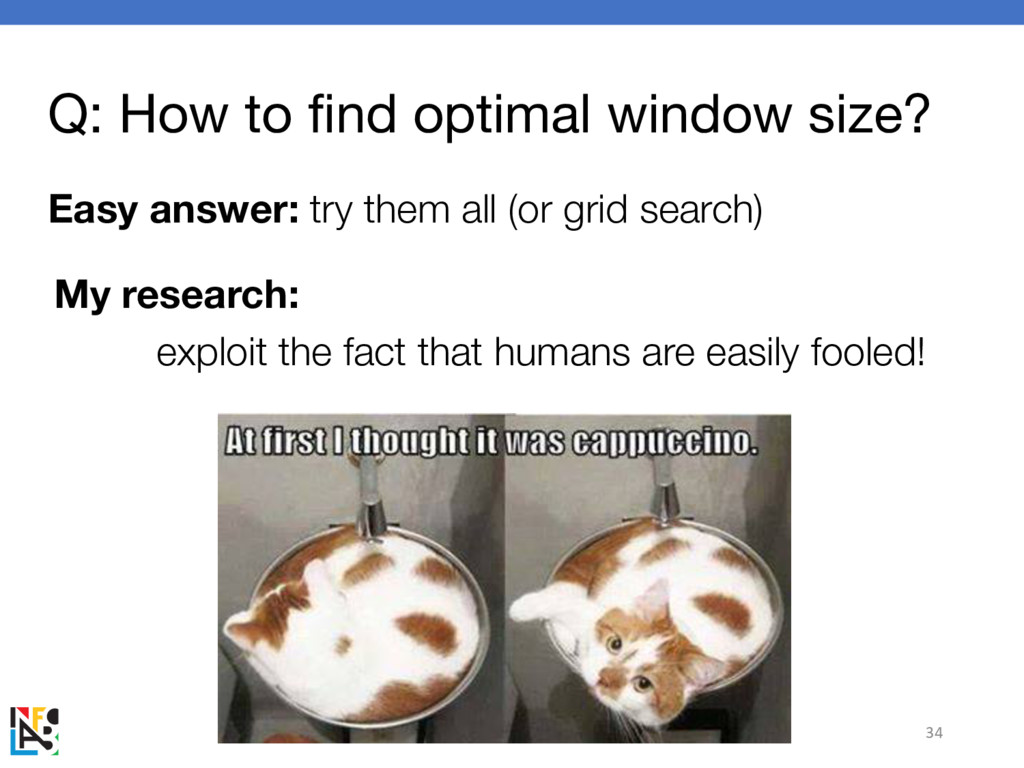
Q: How to find optimal window size? Easy answer: try
them all (or grid search) 34 My research: exploit the fact that humans are easily fooled! -
Optimization 1: Limited pixels Q: how many pixels does your
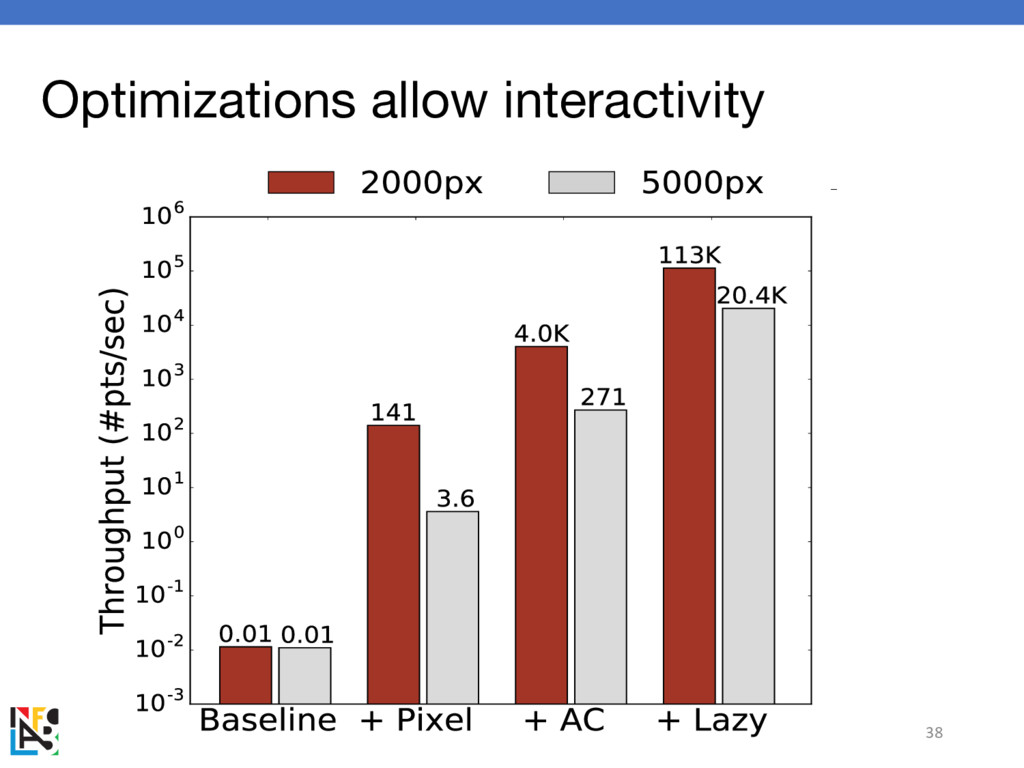
phone have? iPhone 7: 1334 pixels What if I have 1M points? Only a few windows look different Idea: pre-aggregate according to resolution How to go even faster? > 3000x speedups with IPhone -
Optimization 2: Update rate matters Q: Can you tell if
these dashboards are updating at the same rate? 36 Idea: even if data arrives quickly, don’t update faster than humans can tell -
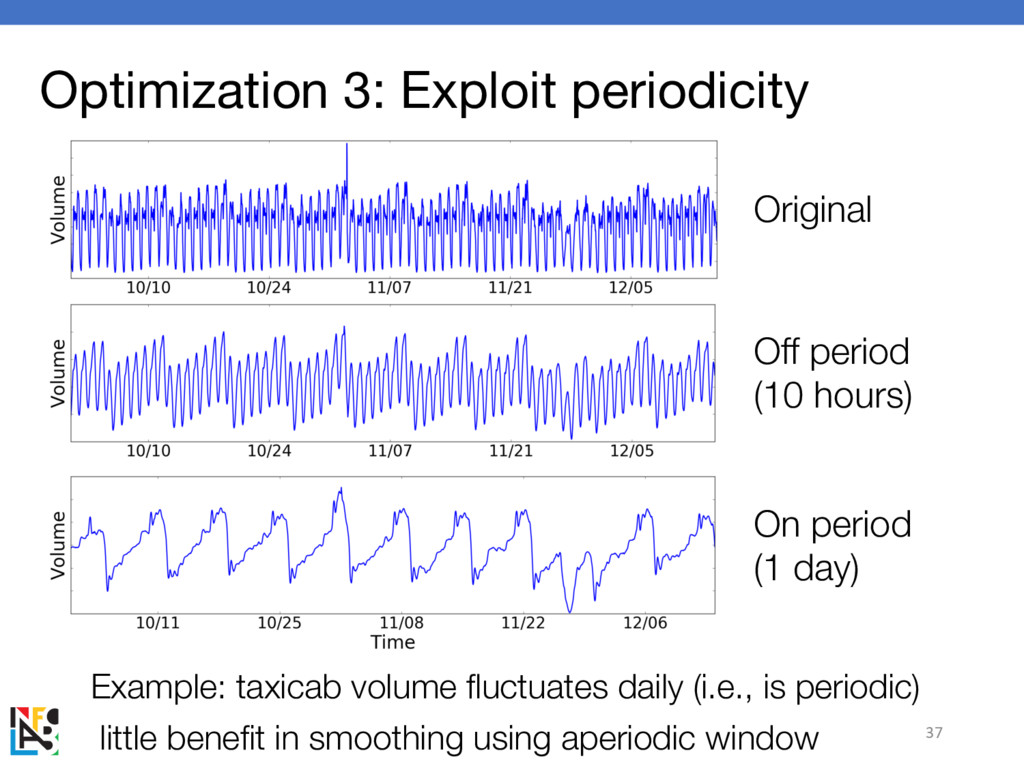
Optimization 3: Exploit periodicity Example: taxicab volume fluctuates daily (i.e.,
is periodic) little benefit in smoothing using aperiodic window 37 Original On period (1 day) Off period (10 hours) -
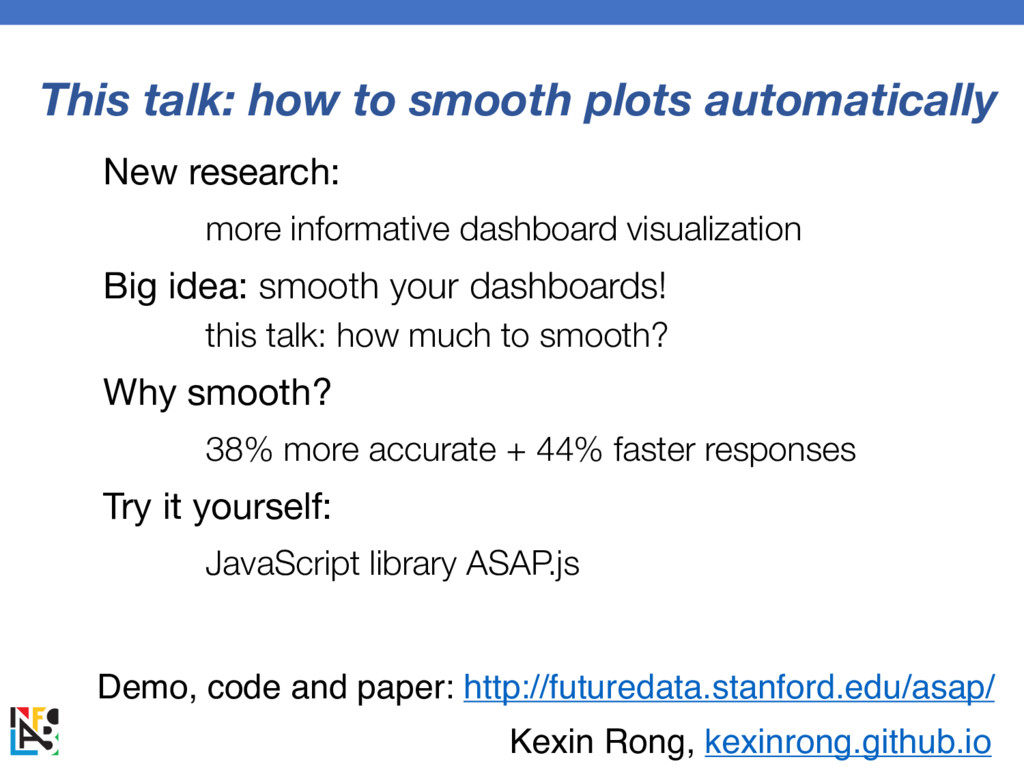
This talk: how to smooth plots automatically New research: more
informative dashboard visualization Big idea: smooth your dashboards! this talk: how much to smooth? Why smooth? 38% more accurate + 44% faster responses Try it yourself: JavaScript library ASAP.js Demo, code and paper: http://futuredata.stanford.edu/asap/ Kexin Rong, kexinrong.github.io