Upgrade to Pro
— share decks privately, control downloads, hide ads and more …
Speaker Deck
Features
Speaker Deck
PRO
Sign in
Sign up for free
Search
Search
Interaktywna wizualizacja danych w d3.js
Search
Piotr Migdał
January 25, 2016
Programming
760
2
Share
Embed
Copy iframe code
Copy JS code
Copy link
Start on current slide
Interaktywna wizualizacja danych w d3.js
warsztaty KFnrD w ICM UW
Piotr Migdał
January 25, 2016
More Decks by Piotr Migdał
See All by Piotr Migdał
Detecting trypophobia triggers (with deep learning)
pmigdal
1
390
Teaching Machine Learning
pmigdal
7
1.7k
A game needs to framework
pmigdal
1
260
Visualizing word coincidences
pmigdal
1
110
Dreams, Drugs and ConvNets
pmigdal
1
990
{Machine, Deep} Learning for software engineers
pmigdal
1
2.2k
Lightning talk - Teaching machine learning
pmigdal
0
1.8k
Gry naukowe, moja gra kwantowa
pmigdal
0
260
Side-projects and off-topics
pmigdal
0
180
Other Decks in Programming
See All in Programming
使いながら育てる Claude Code — 開発フローの1コマンド化 × 繰り返し指摘の自動仕組み化
shiki_kakaku
0
1.5k
Foundation Models frameworkで画像分析
ryodeveloper
1
240
2年かけて Deno に DOMMatrix を実装した話 / How I implemented DOMMatrix in Deno over two years
petamoriken
0
190
数百円から始めるRuby電子工作
tarosay
0
120
Google Apps Script で Ruby を動かす
kawahara
0
120
Welcome to the "Parametricity" 🏙️ − Generic だけど Specific な世界 −
guvalif
PRO
1
200
AI時代の仕事技芸論〜ソフトウェア開発で「遊ぶように働く」職人的熟達のすすめ(スクフェス仙台 2026バージョン)
kuranuki
0
790
AI時代のPHPer生存戦略 ~「言語、もうなんでもよくない?」に本気で向き合う~
vivion
0
210
信頼性について考えてみる(SRE NEXT 2026 miniLT)
hayama17
0
230
地域 SRE コミュニティ最前線 - ホンマでっかSRE勉強会
tk3fftk
0
290
ITヒヤリハットを整理してみた ~ライフサイクルと原因から考える再発防止策~
koukimiura
1
130
The Past, Present, and Future of Enterprise Java
ivargrimstad
0
480
Featured
See All Featured
Efficient Content Optimization with Google Search Console & Apps Script
katarinadahlin
PRO
1
750
The untapped power of vector embeddings
frankvandijk
2
1.8k
Measuring & Analyzing Core Web Vitals
bluesmoon
9
940
Pawsitive SEO: Lessons from My Dog (and Many Mistakes) on Thriving as a Consultant in the Age of AI
davidcarrasco
0
200
How to build an LLM SEO readiness audit: a practical framework
nmsamuel
1
820
Mind Mapping
helmedeiros
PRO
1
290
職位にかかわらず全員がリーダーシップを発揮するチーム作り / Building a team where everyone can demonstrate leadership regardless of position
madoxten
64
56k
Tell your own story through comics
letsgokoyo
1
1k
Lightning Talk: Beautiful Slides for Beginners
inesmontani
PRO
2
620
Google's AI Overviews - The New Search
badams
0
1.1k
Principles of Awesome APIs and How to Build Them.
keavy
128
18k
The Web Performance Landscape in 2024 [PerfNow 2024]
tammyeverts
12
1.2k
Transcript
Interaktywna wizualizacja danych w d3.js Piotr Migdał warsztaty KFnrD ICM,
25-29 sty 2016
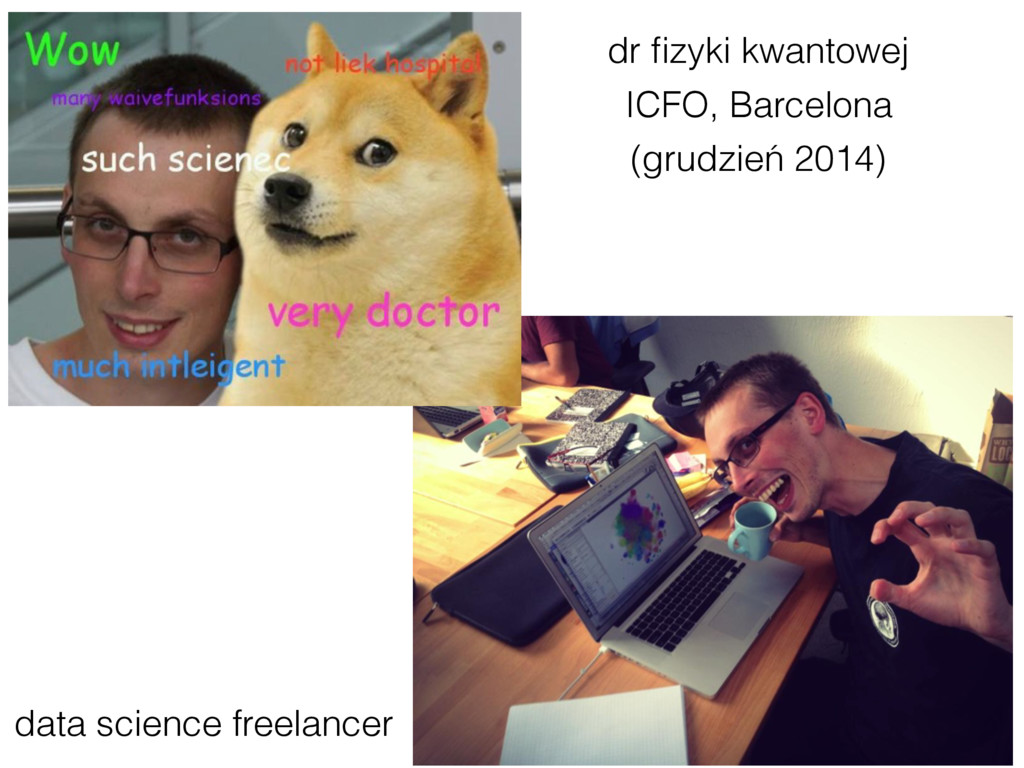
dr fizyki kwantowej data science freelancer ICFO, Barcelona (grudzień 2014)
None
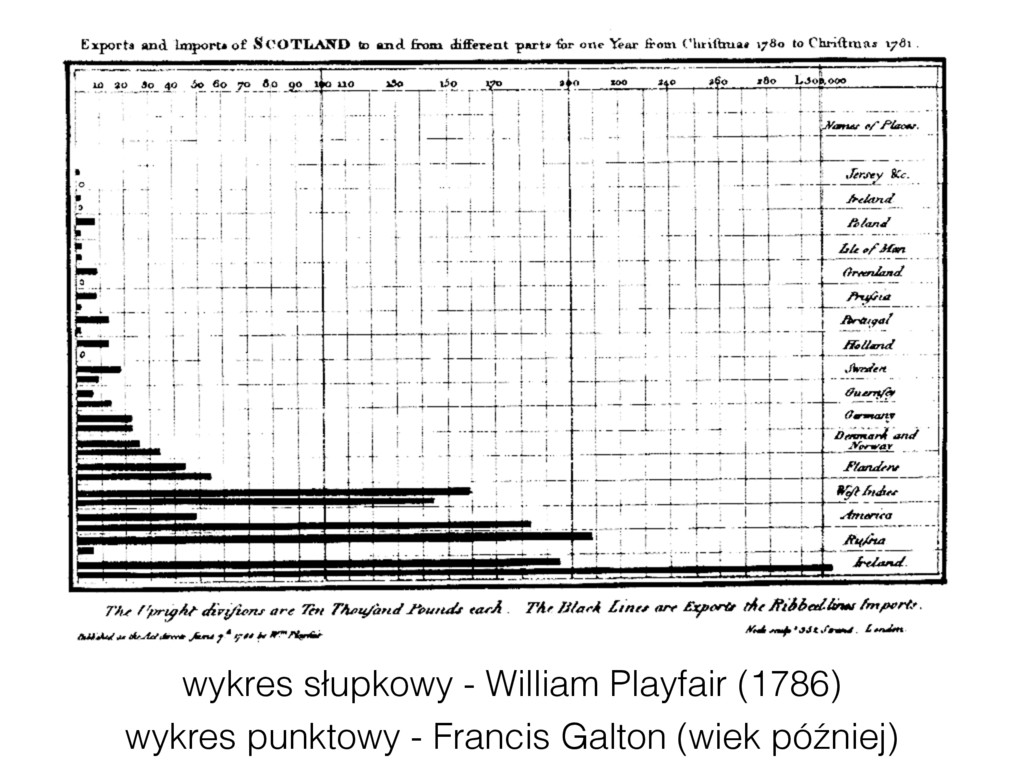
wykres słupkowy - William Playfair (1786) wykres punktowy - Francis
Galton (wiek później)
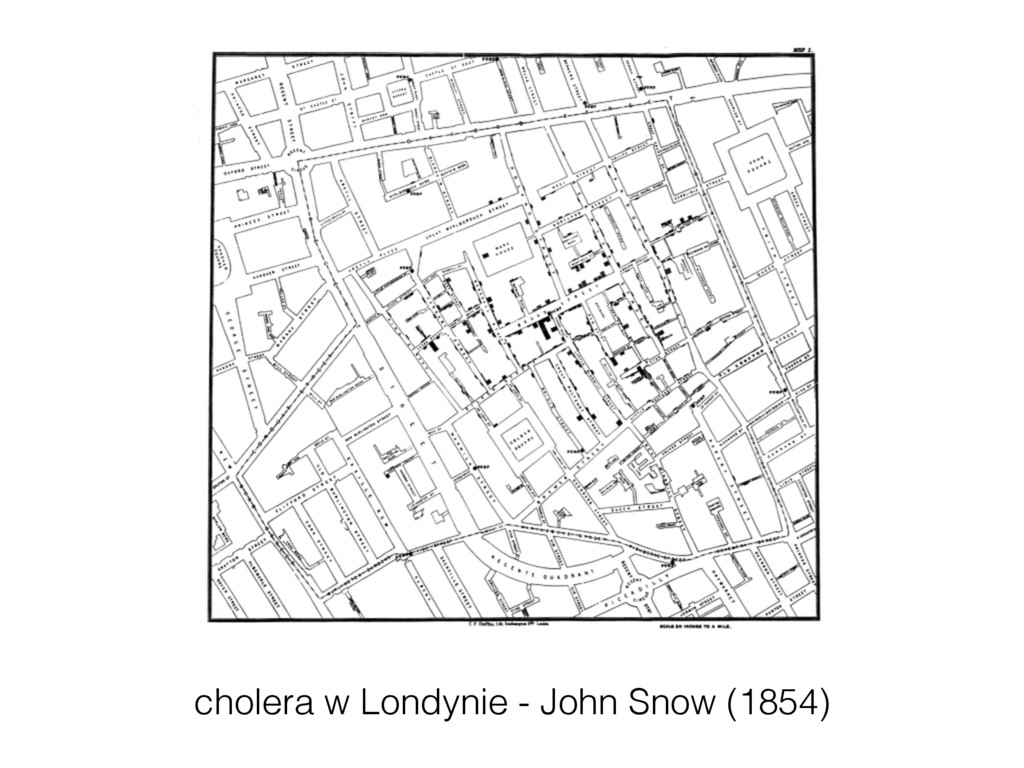
cholera w Londynie - John Snow (1854)
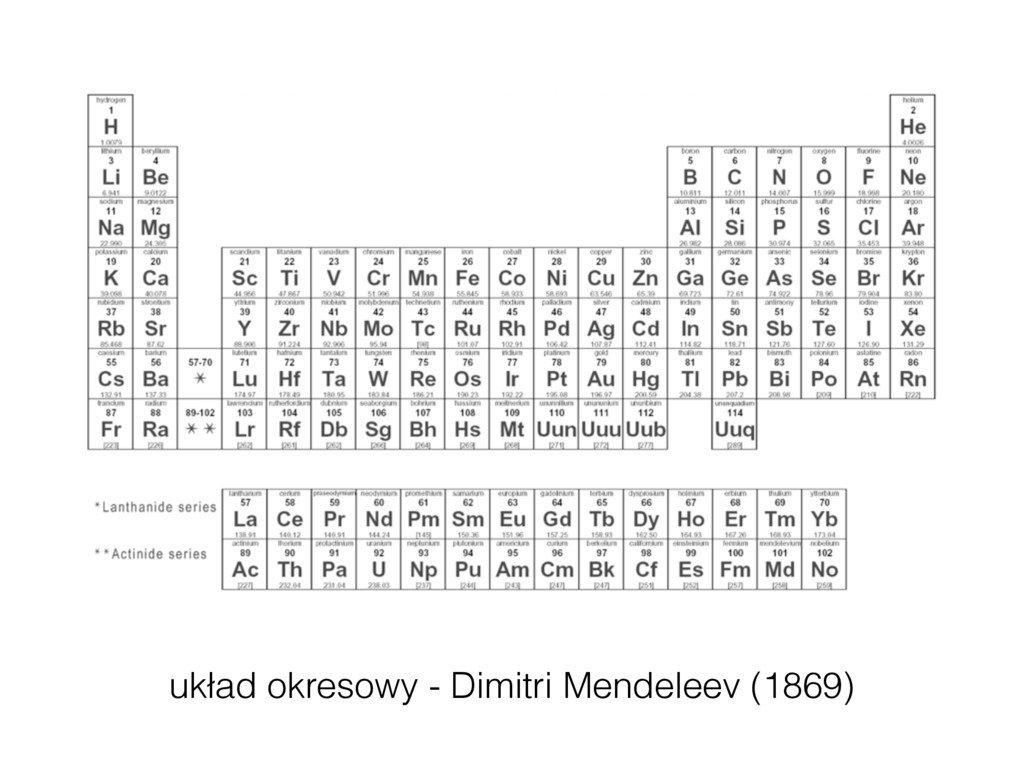
Dmitri Mendeleev | Periodic Table of Elements (1869) układ okresowy
- Dimitri Mendeleev (1869)
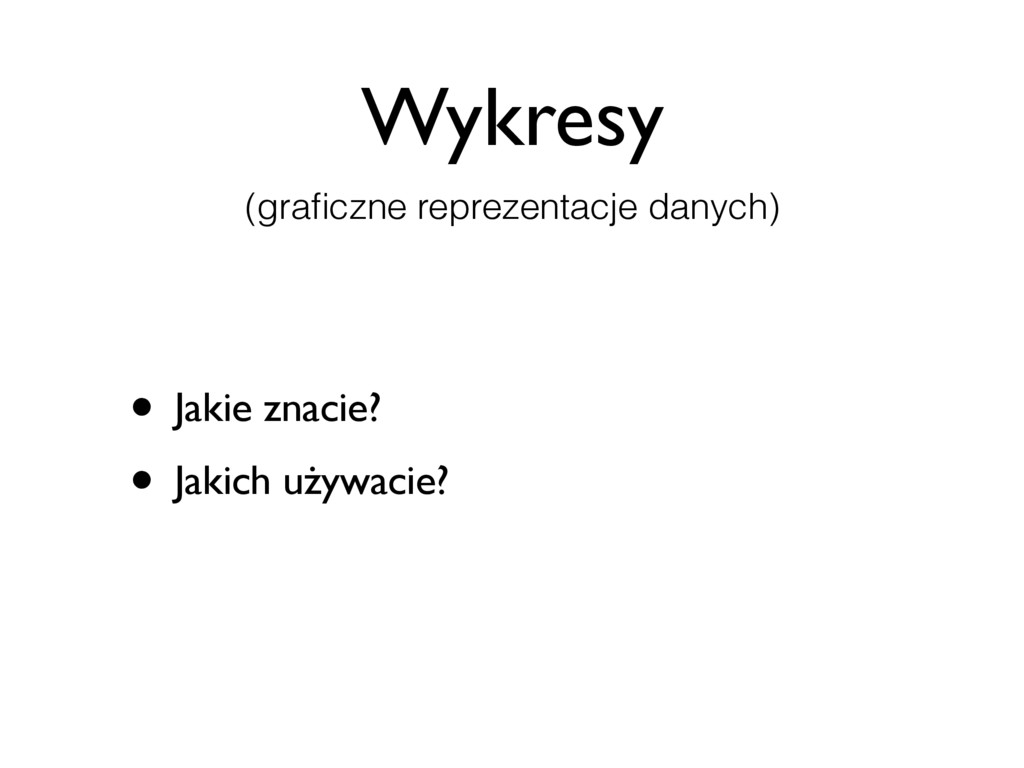
Wykresy • Jakie znacie? • Jakich używacie? (graficzne reprezentacje danych)
3.14159
Dobry wykres czy zły?
http://darkhorseanalytics.com/blog/data-looks-better-naked
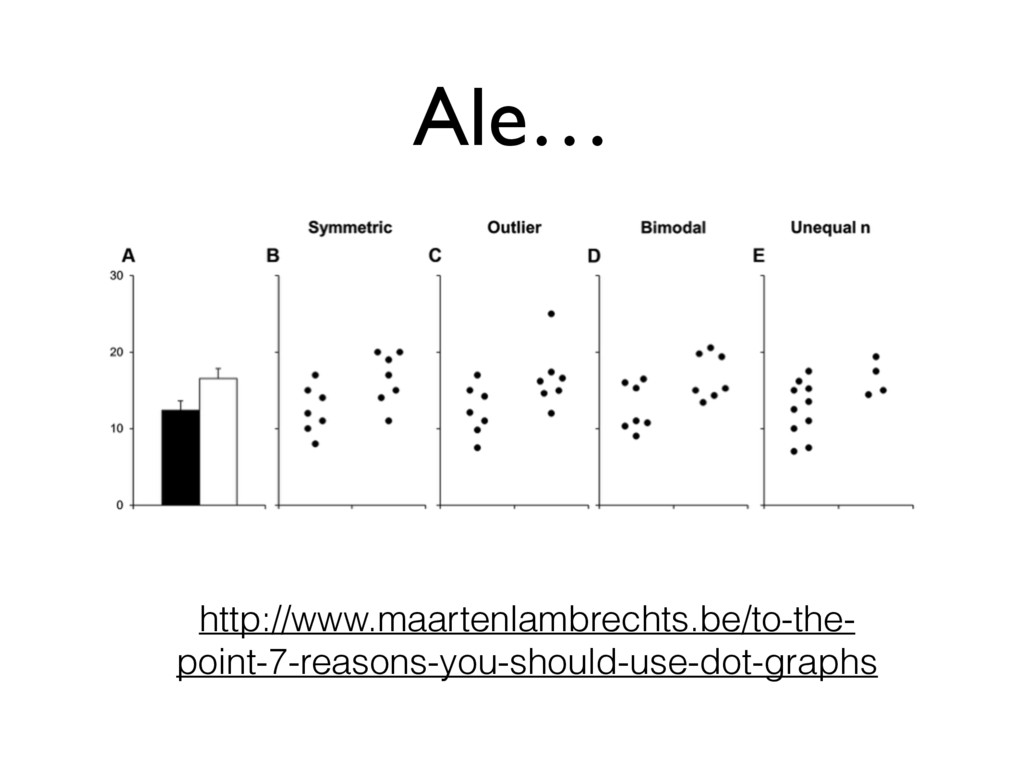
Ale… http://www.maartenlambrechts.be/to-the- point-7-reasons-you-should-use-dot-graphs
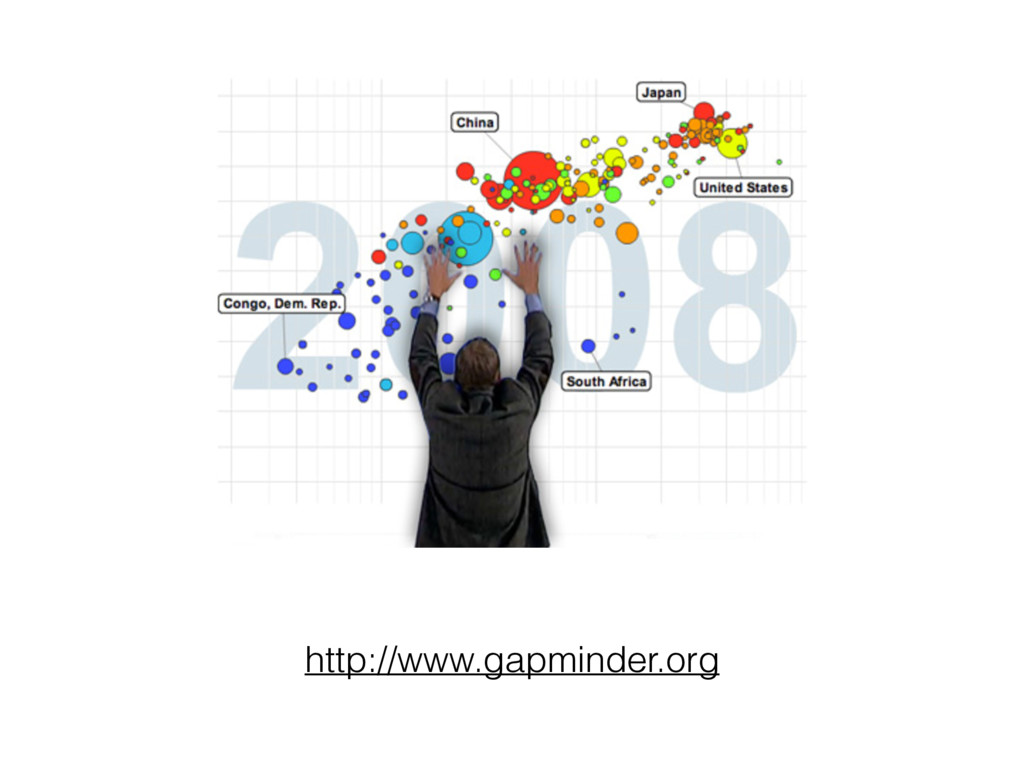
http://www.gapminder.org
None
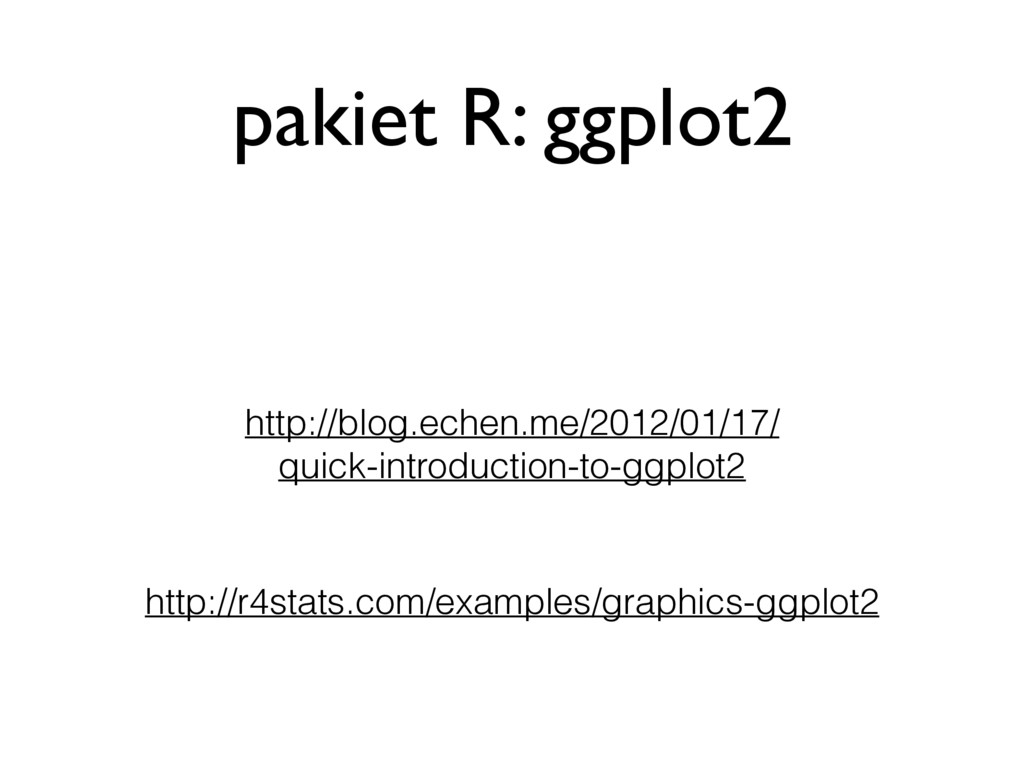
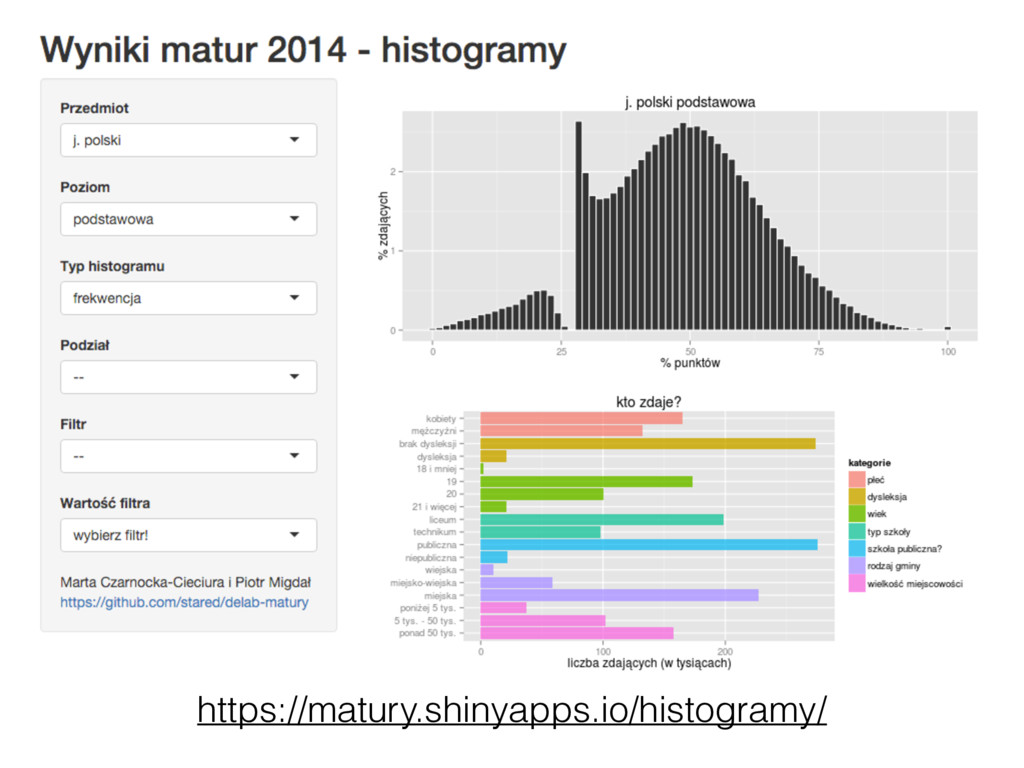
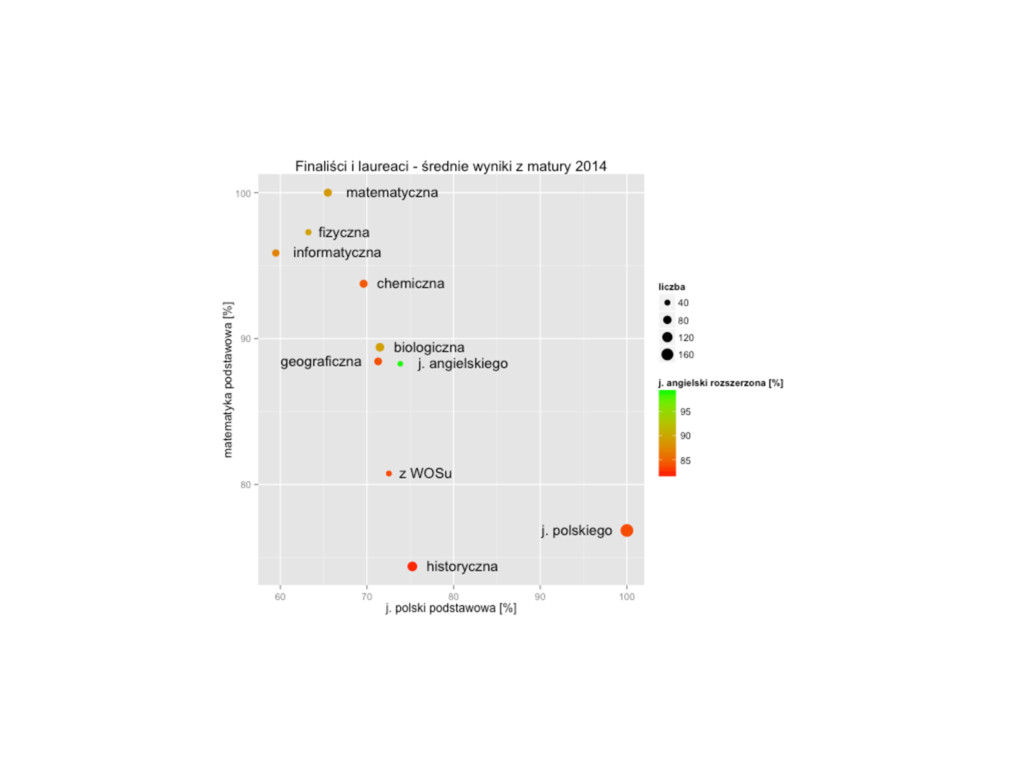
pakiet R: ggplot2 http://blog.echen.me/2012/01/17/ quick-introduction-to-ggplot2 http://r4stats.com/examples/graphics-ggplot2
https://matury.shinyapps.io/histogramy/
None
None
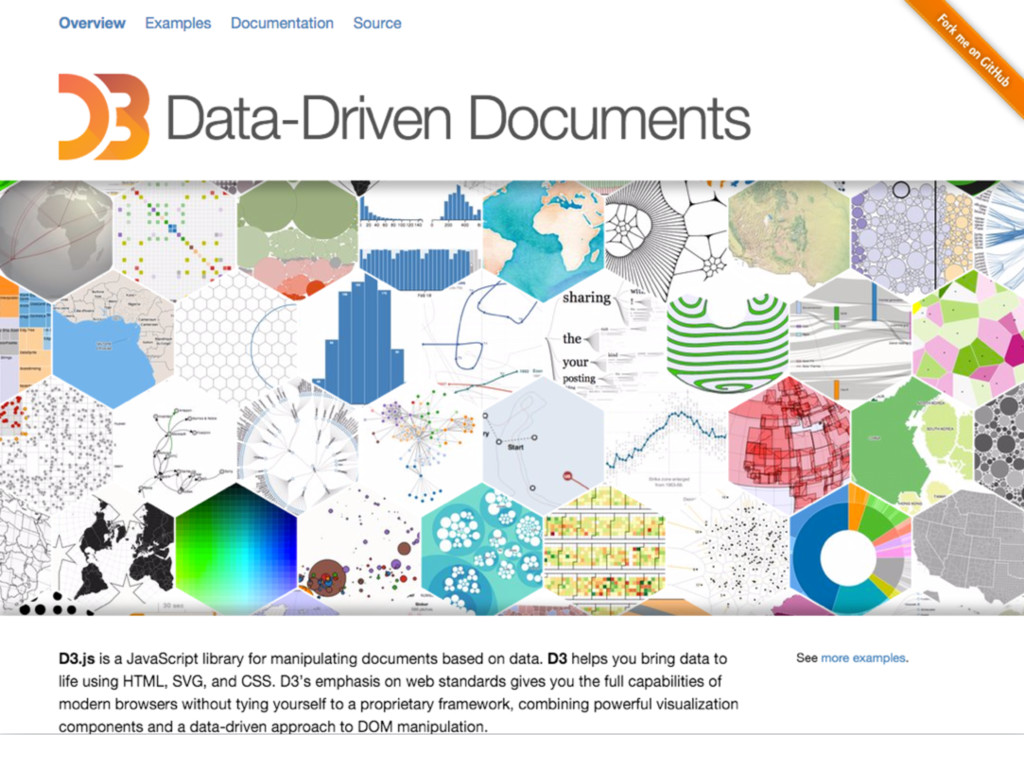
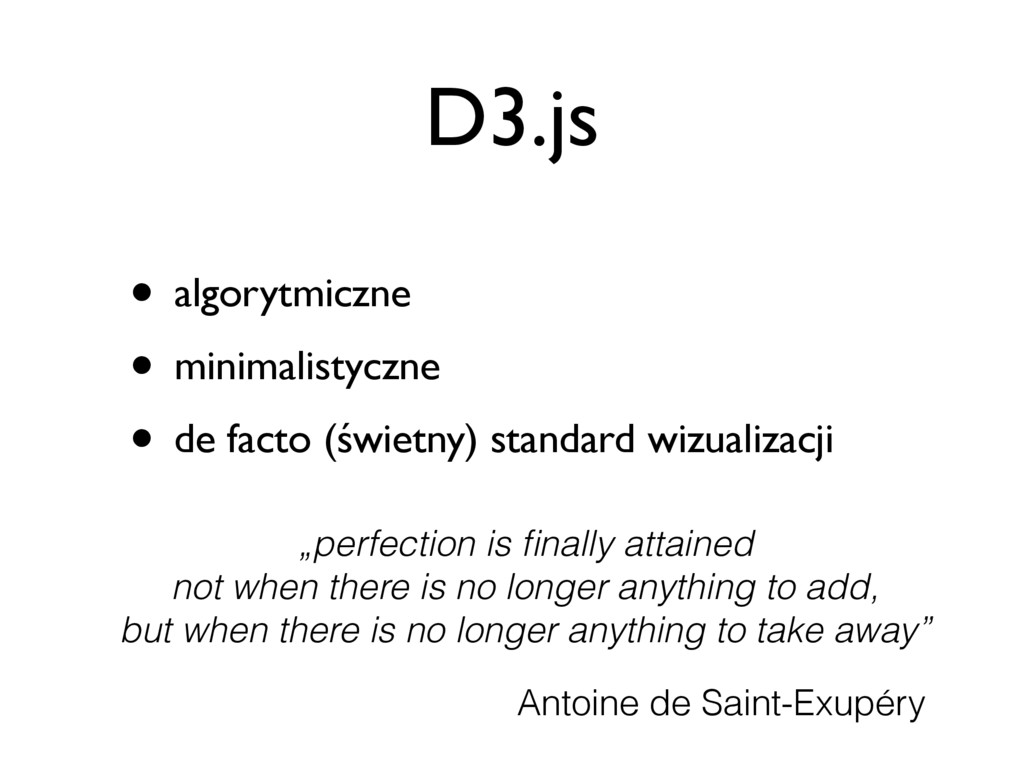
D3.js • algorytmiczne • minimalistyczne • de facto (świetny) standard
wizualizacji „perfection is finally attained not when there is no longer anything to add, but when there is no longer anything to take away” Antoine de Saint-Exupéry
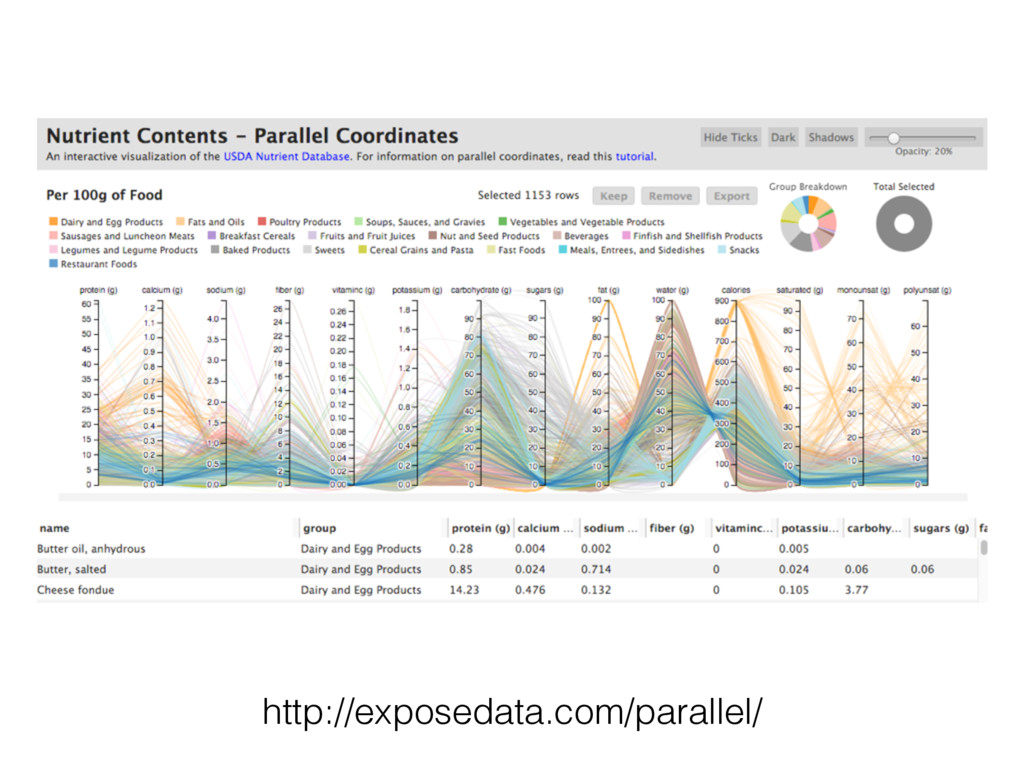
http://exposedata.com/parallel/
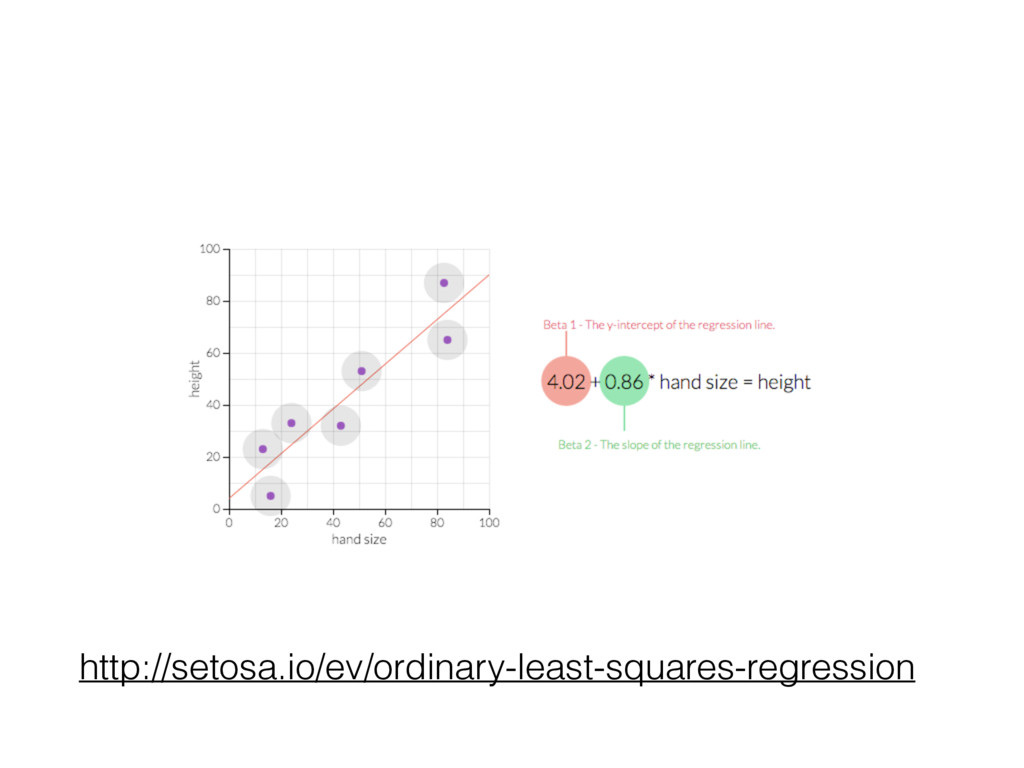
http://setosa.io/ev/ordinary-least-squares-regression
http://bl.ocks.org/mbostock/7322386
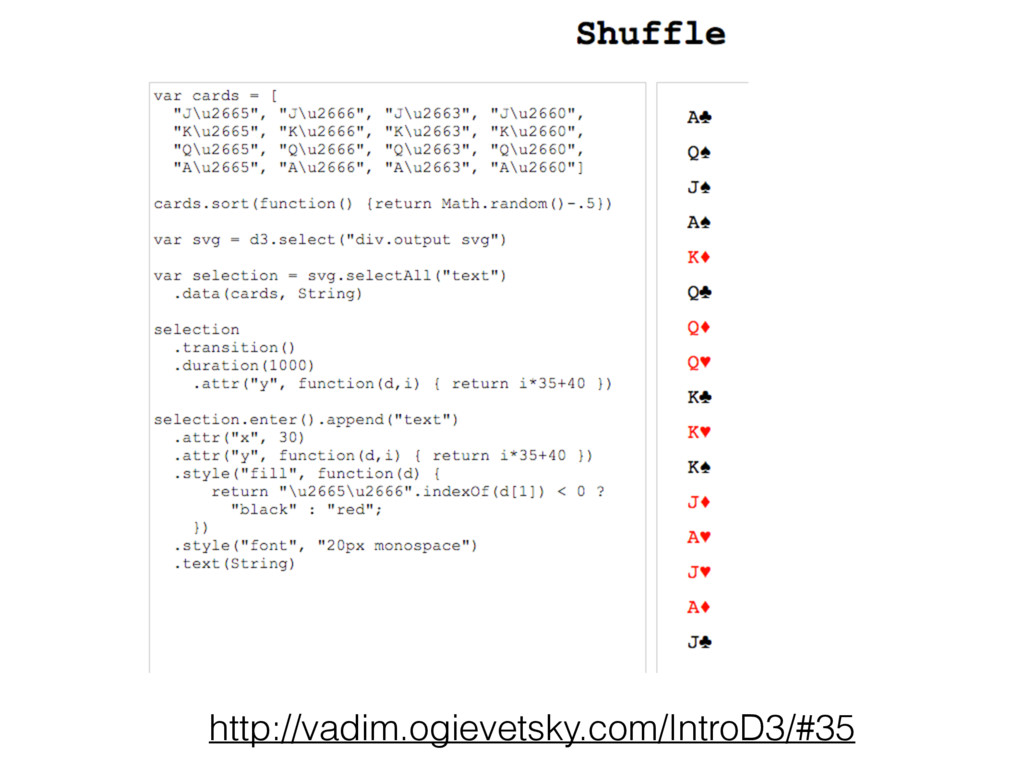
http://vadim.ogievetsky.com/IntroD3/#35
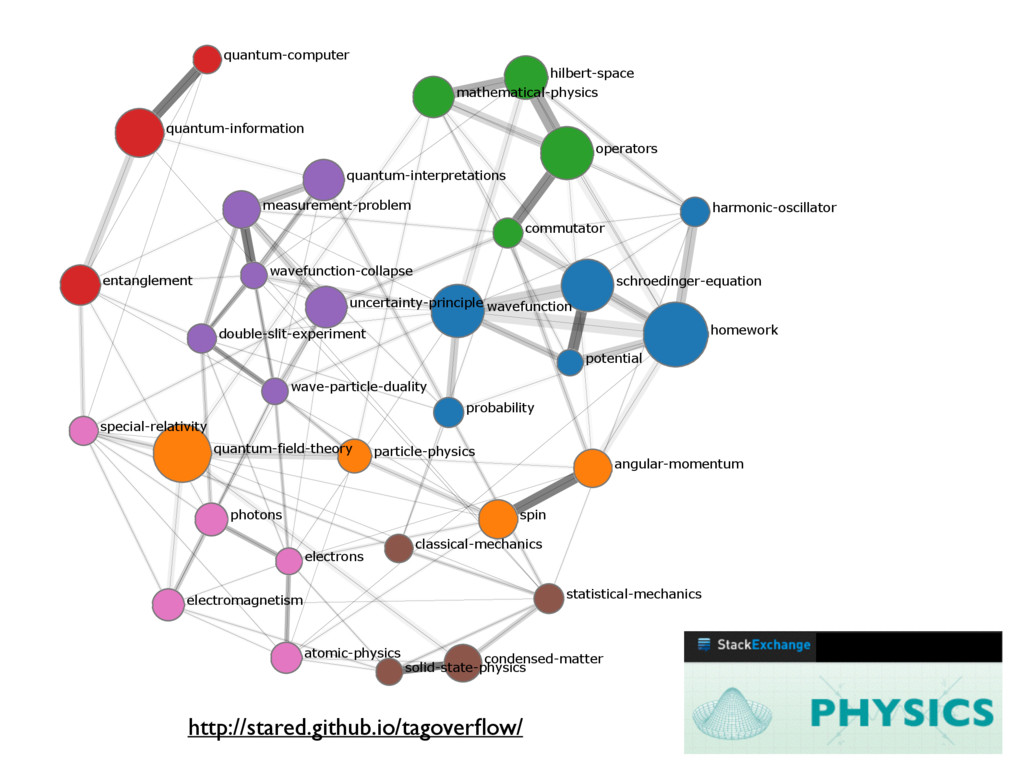
homework quantum-field-theory wavefunction operators schroedinger-equation quantum-information hilbert-space uncertainty-principle mathematical-physics quantum-interpretations
entanglement spin angular-momentum measurement-problem condensed-matter particle-physics photons electromagnetism atomic-physics probability commutator statistical-mechanics harmonic-oscillator double-slit-experiment special-relativity classical-mechanics quantum-computer solid-state-physics electrons wavefunction-collapse wave-particle-duality potential http://stared.github.io/tagoverflow/
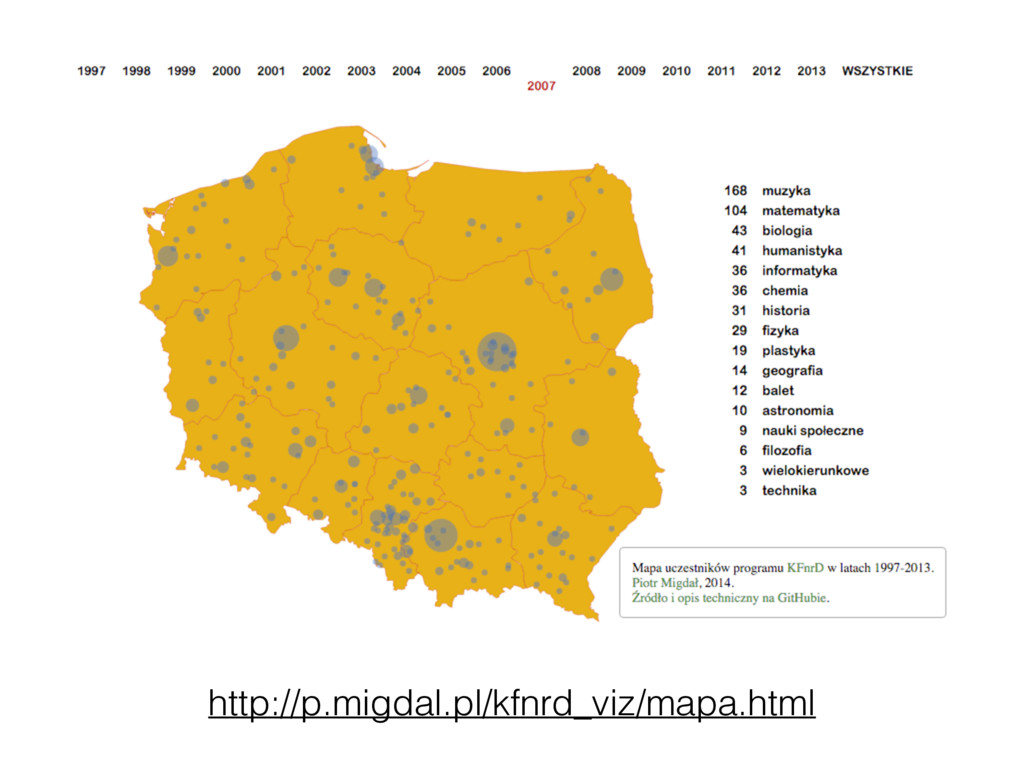
http://p.migdal.pl/kfnrd_viz/mapa.html
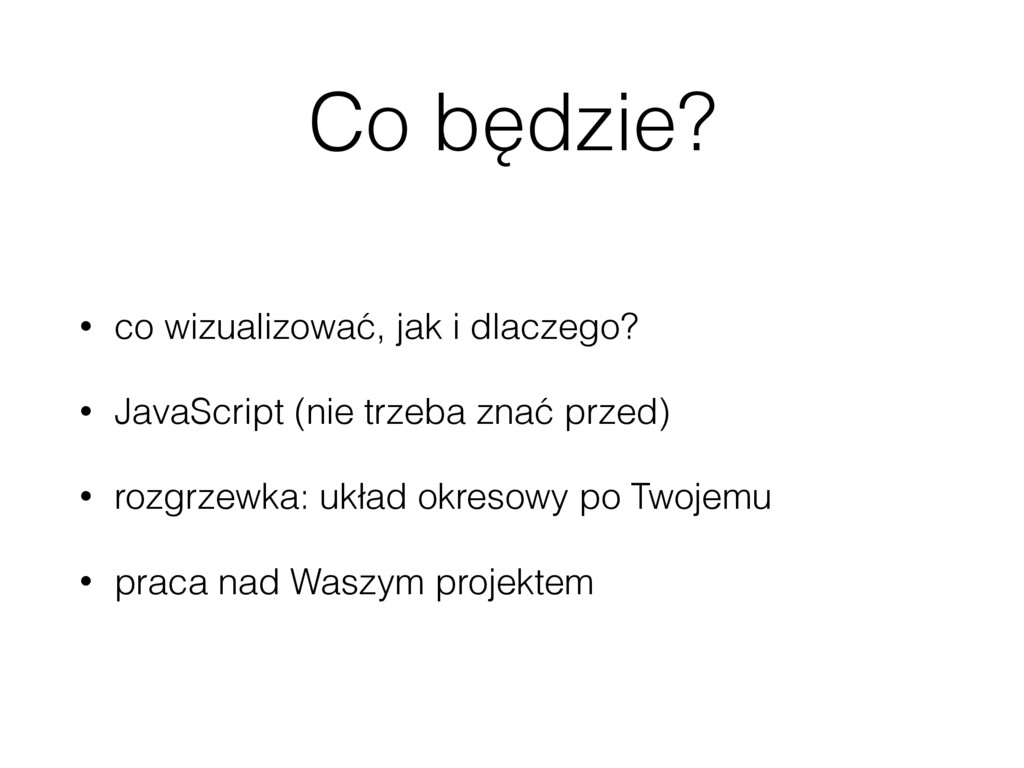
Co będzie? • co wizualizować, jak i dlaczego? • JavaScript
(nie trzeba znać przed) • rozgrzewka: układ okresowy po Twojemu • praca nad Waszym projektem
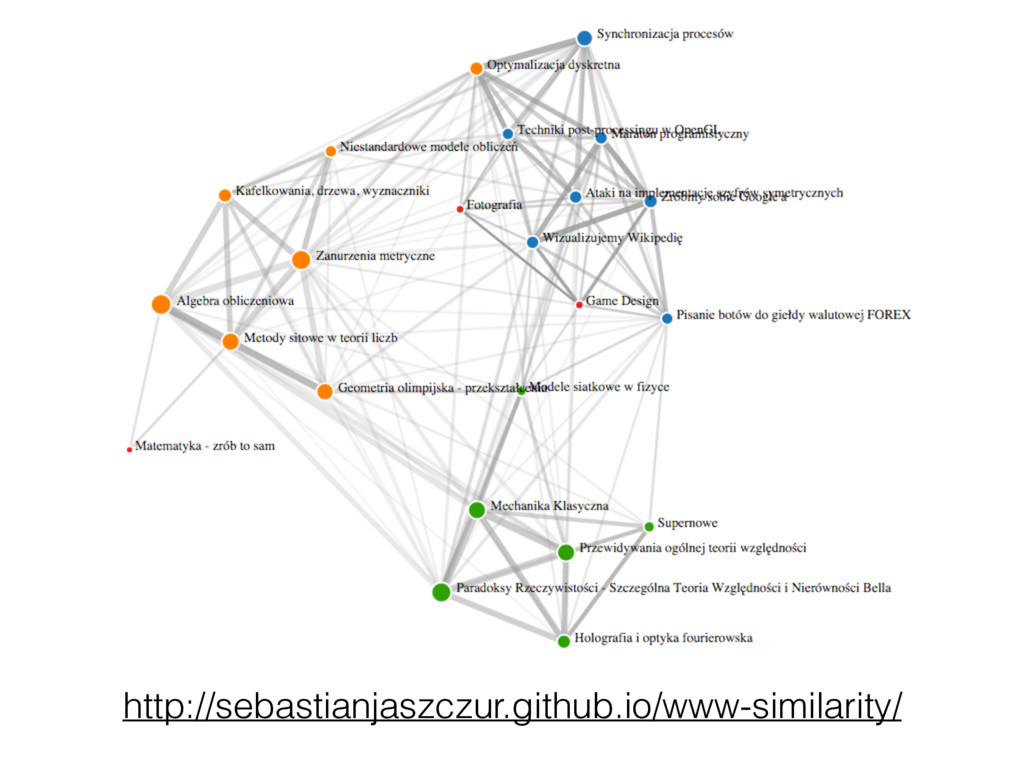
http://sebastianjaszczur.github.io/www-similarity/
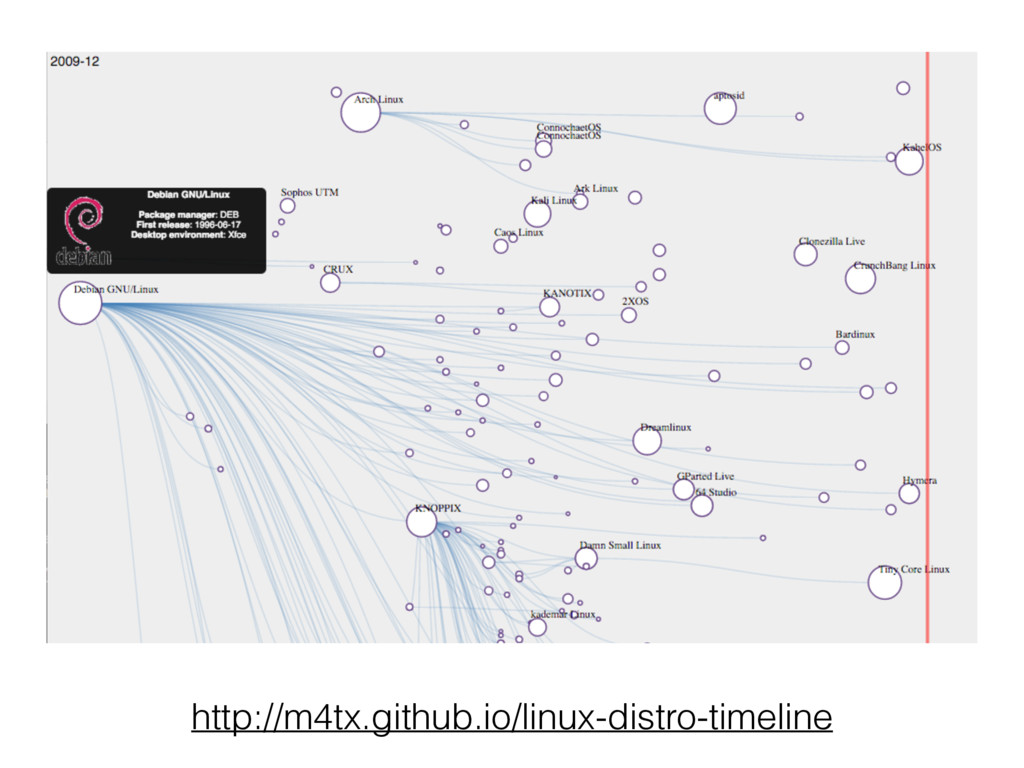
http://m4tx.github.io/linux-distro-timeline
Lektury • Edward Tufte, The Visual Display of Quantitative Information
• Willard C. Brinton, Graphic Presentation (1939) https://archive.org/stream/ graphicpresentat00brinrich#page/n0/mode/thumb
Moje ściągawki • http://warsztatywww.wikidot.com/ www10:wizualizujemy-wikipedie • http://smarterpoland.pl/index.php/2014/06/ metawstep-do-wizualizacji-danych-w-d3-js/ • https://github.com/DELabUW/szkola-letnia-2015/
blob/master/zajecia/ deser_sztuka_robienia_wykresow.ipynb
Dla wszystkich • http://www.fallen.io/ww2/ (~20 min) • mogę pomóc z:
• R ggplot2 • Python: Pandas/Seaborn