Upgrade to Pro — share decks privately, control downloads, hide ads and more …

Jori Ford - When Server Logs Lie: The Wire-Leve...

Sponsored · SiteGround - Reliable hosting with speed, security, and support you can count on. →

Jori Ford - When Server Logs Lie: The Wire-Level Truth Behind Googlebot’s Ghost Errors

Tech SEO Connect PRO

November 13, 2026

Transcript

17 slides
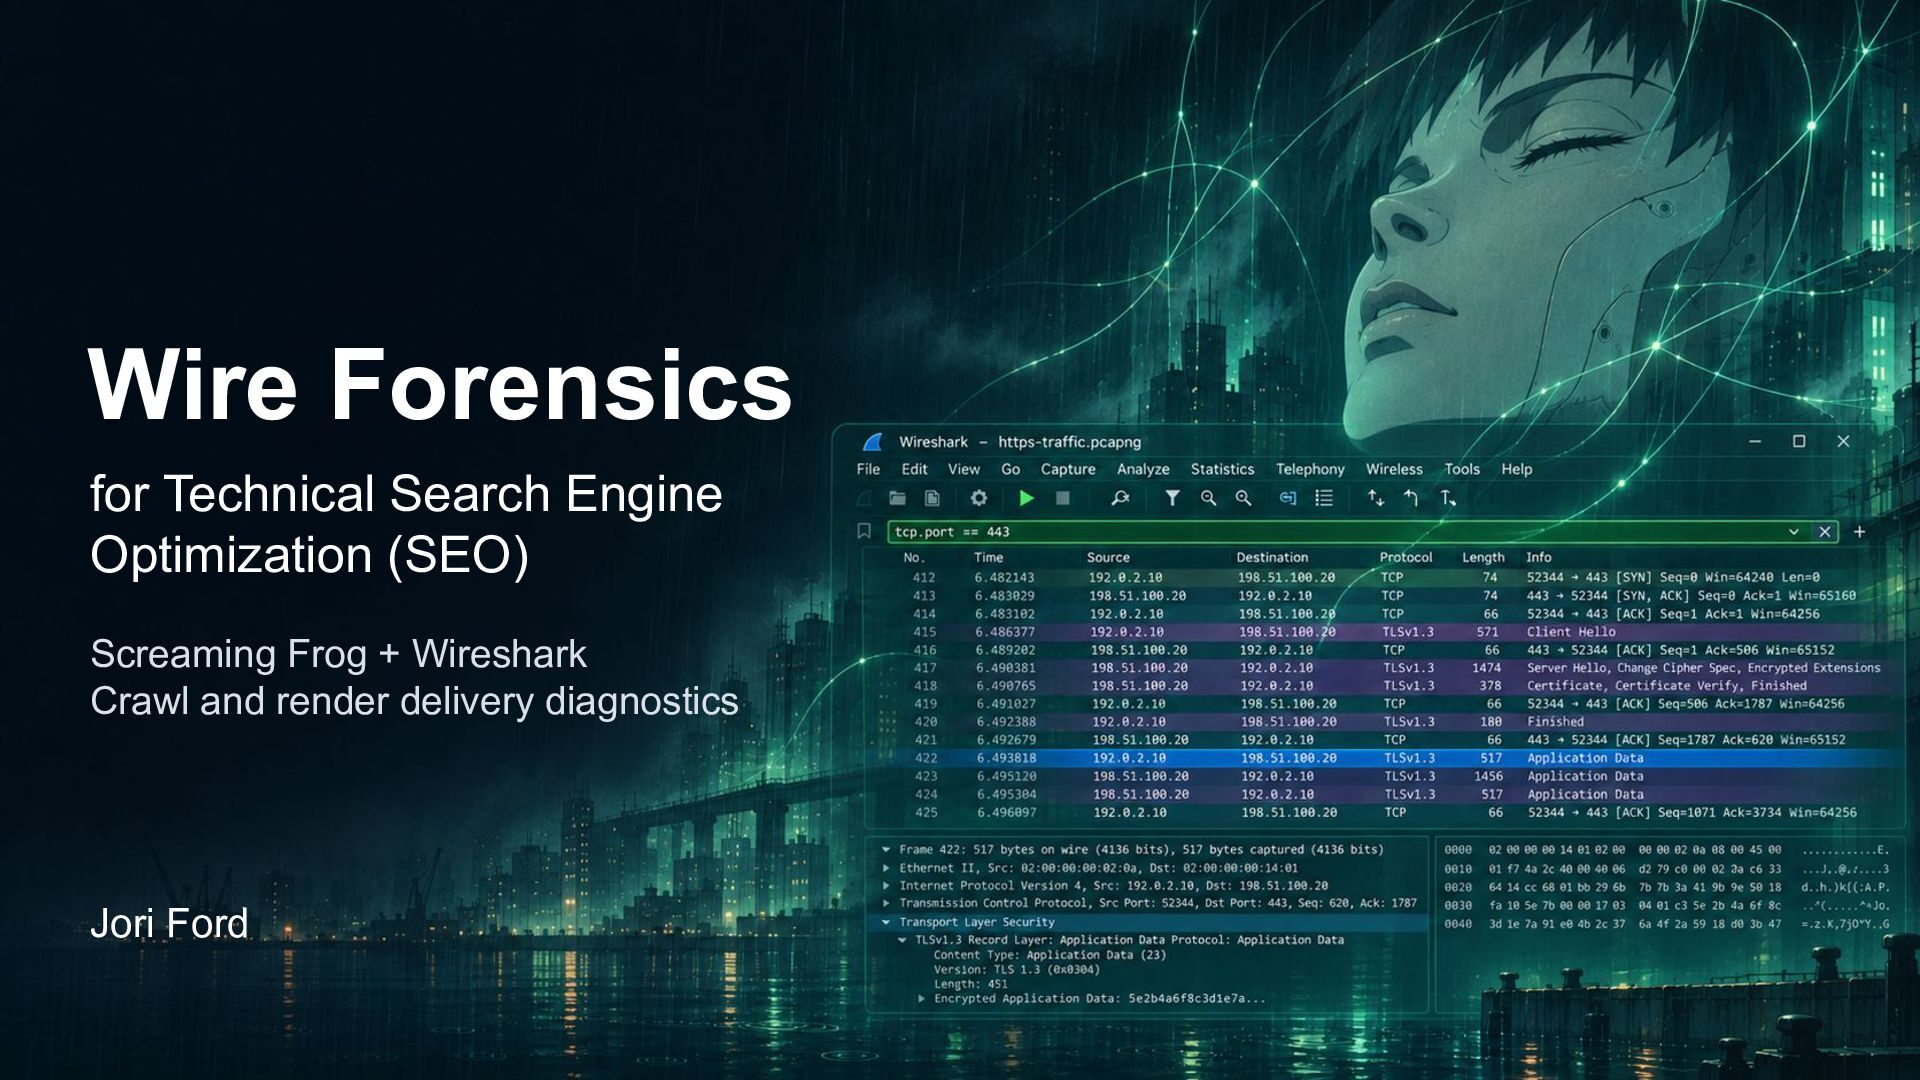
  1. Wire Forensics for Technical Search Engine Optimization (SEO) Screaming Frog

    + Wireshark Crawl and render delivery diagnostics Jori Ford
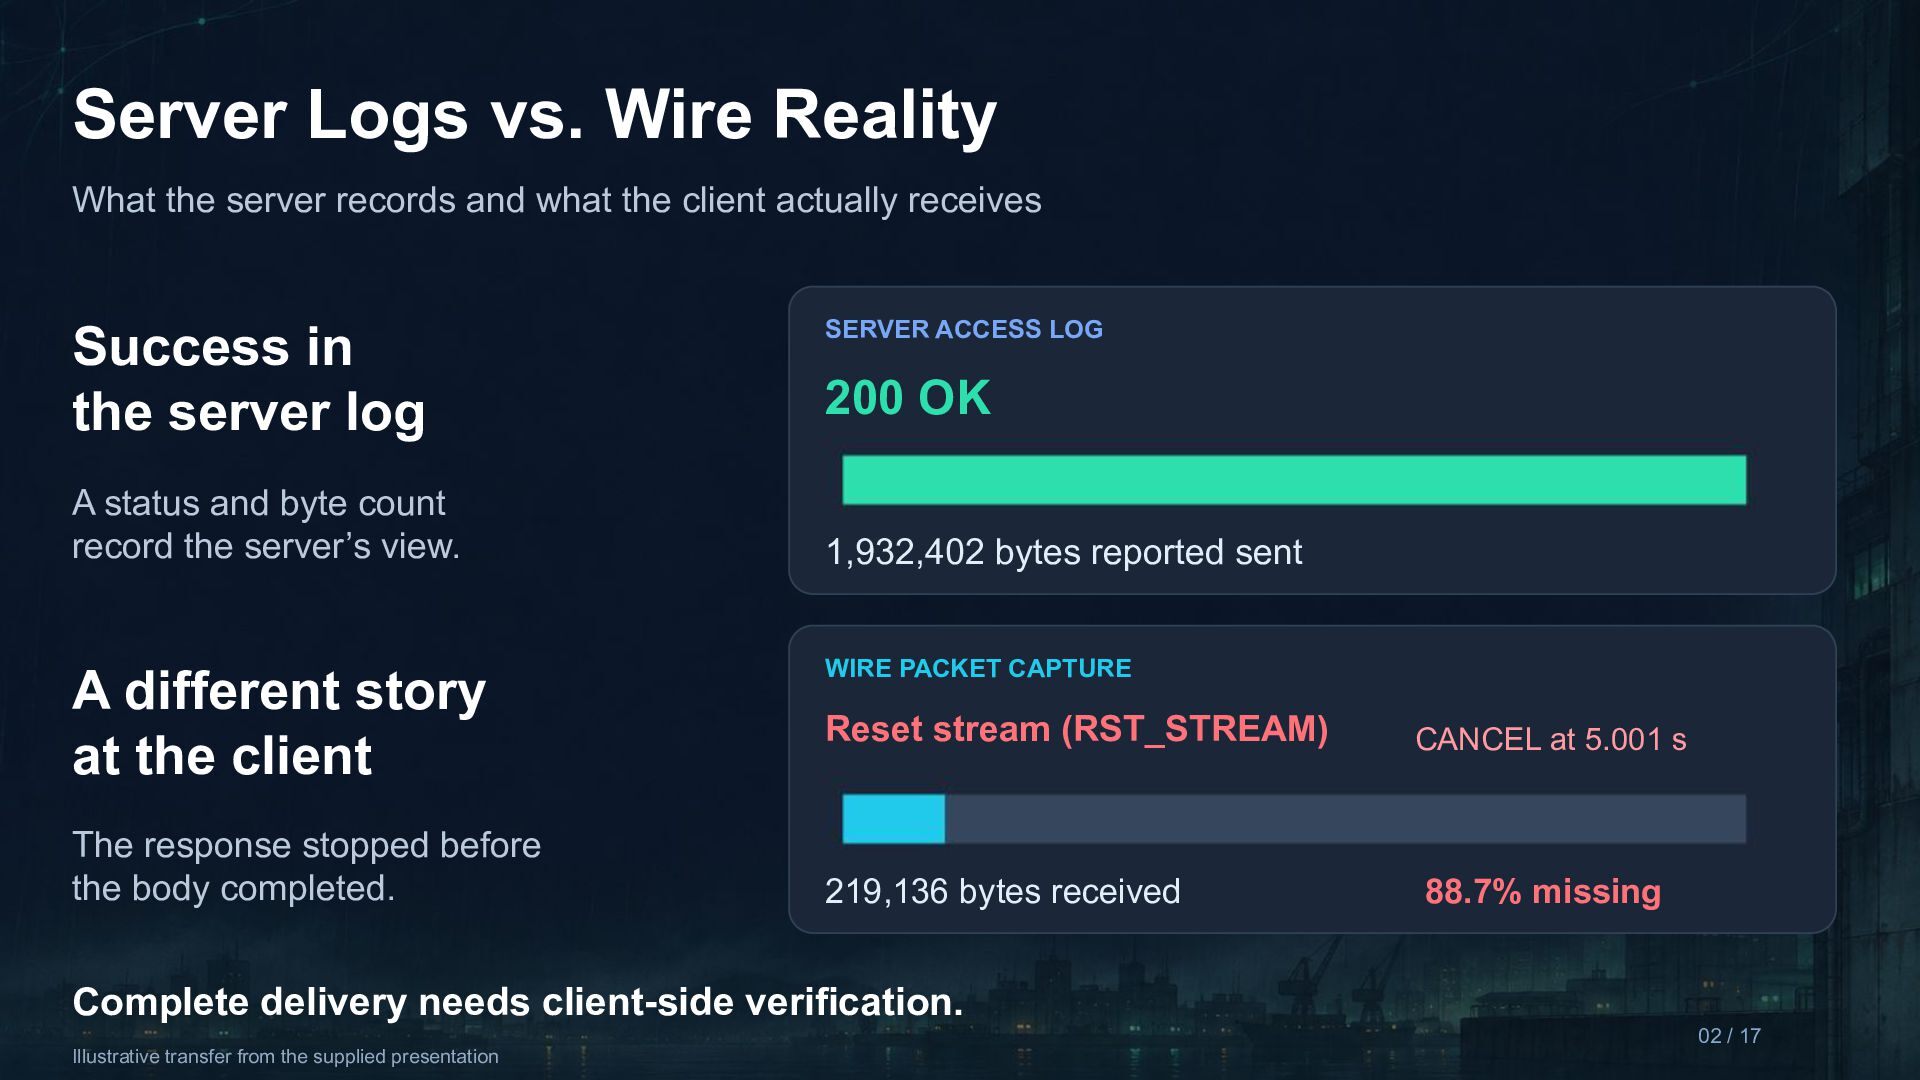
  2. Server Logs vs. Wire Reality What the server records and

    what the client actually receives Success in the server log A status and byte count record the server’s view. A different story at the client The response stopped before the body completed. SERVER ACCESS LOG 200 OK 1,932,402 bytes reported sent WIRE PACKET CAPTURE Reset stream (RST_STREAM) CANCEL at 5.001 s 219,136 bytes received 88.7% missing Complete delivery needs client-side verification. 02 / 17 Illustrative transfer from the supplied presentation
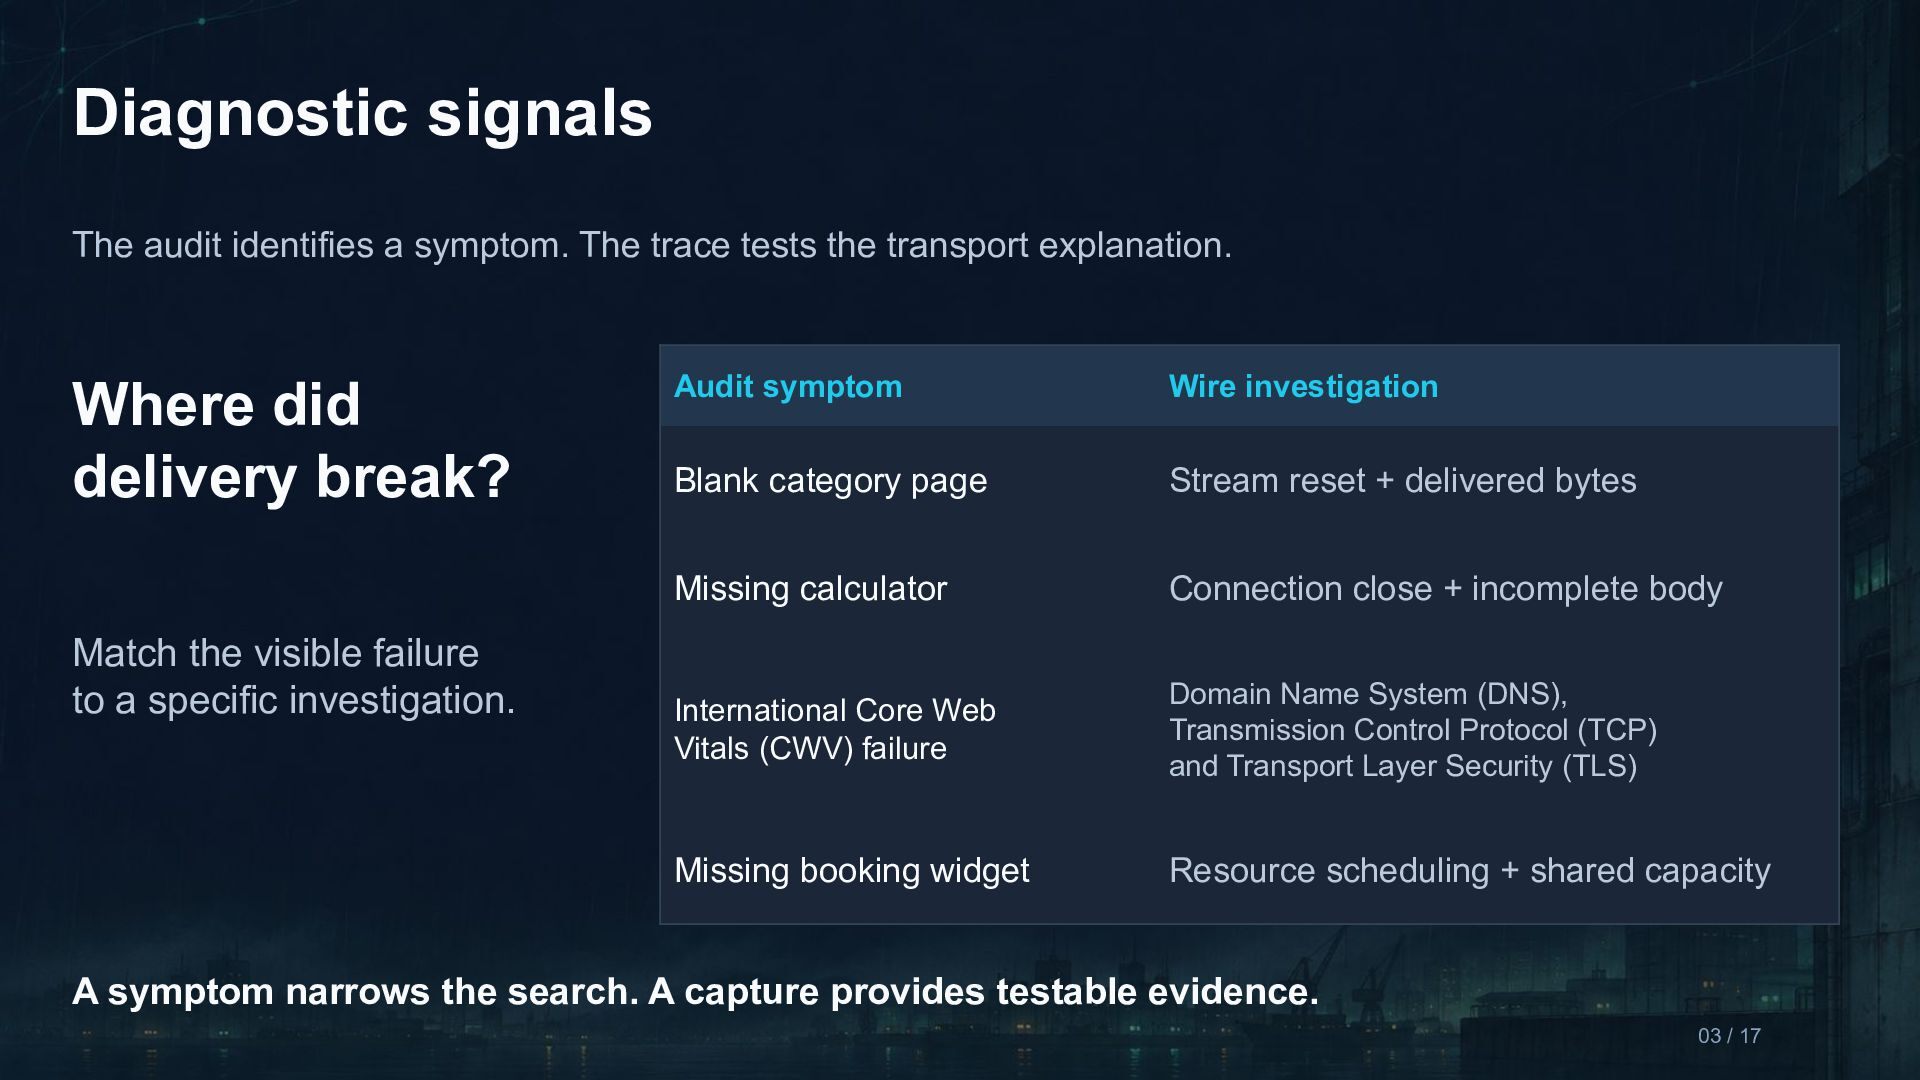
  3. Diagnostic signals The audit identifies a symptom. The trace tests

    the transport explanation. Where did delivery break? Match the visible failure to a specific investigation. Audit symptom Wire investigation Blank category page Stream reset + delivered bytes Missing calculator Connection close + incomplete body International Core Web Vitals (CWV) failure Domain Name System (DNS), Transmission Control Protocol (TCP) and Transport Layer Security (TLS) Missing booking widget Resource scheduling + shared capacity A symptom narrows the search. A capture provides testable evidence. 03 / 17
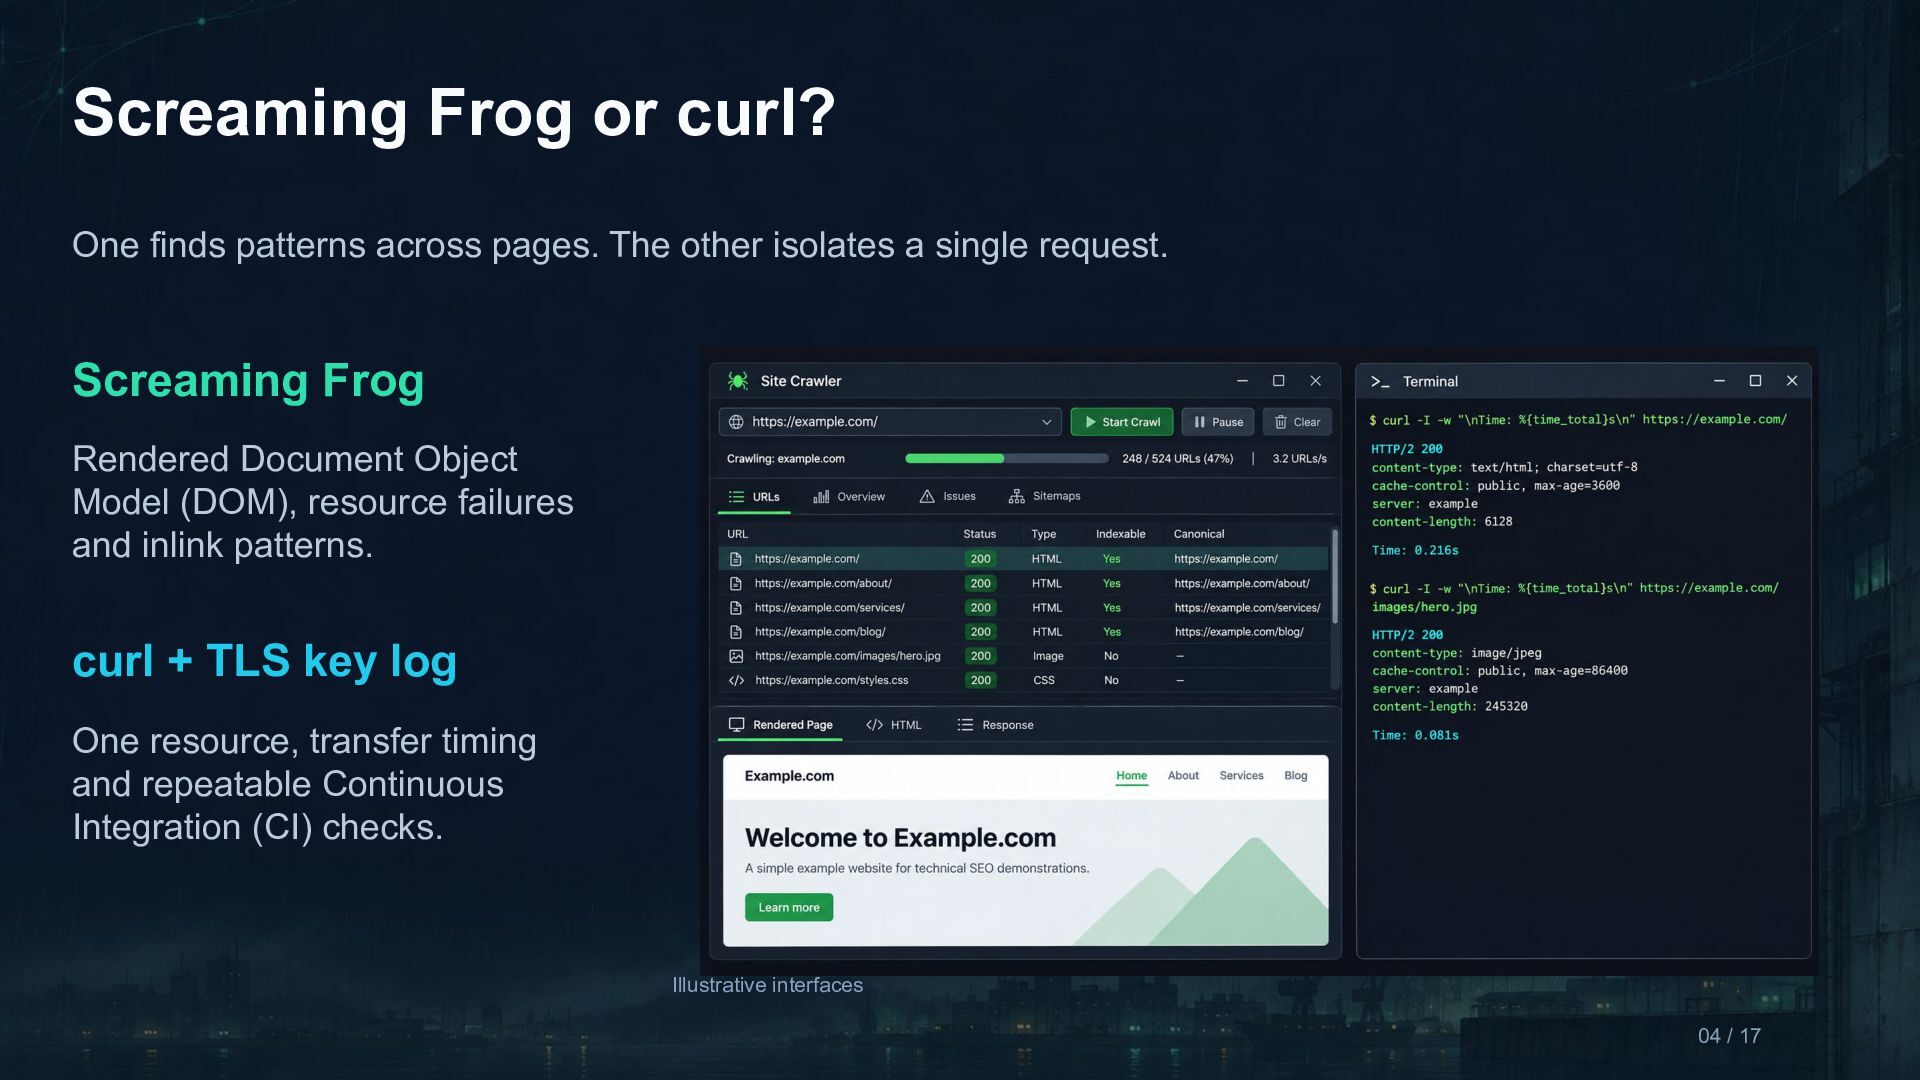
  4. Screaming Frog or curl? One finds patterns across pages. The

    other isolates a single request. Screaming Frog Rendered Document Object Model (DOM), resource failures and inlink patterns. curl + TLS key log One resource, transfer timing and repeatable Continuous Integration (CI) checks. Illustrative interfaces 04 / 17
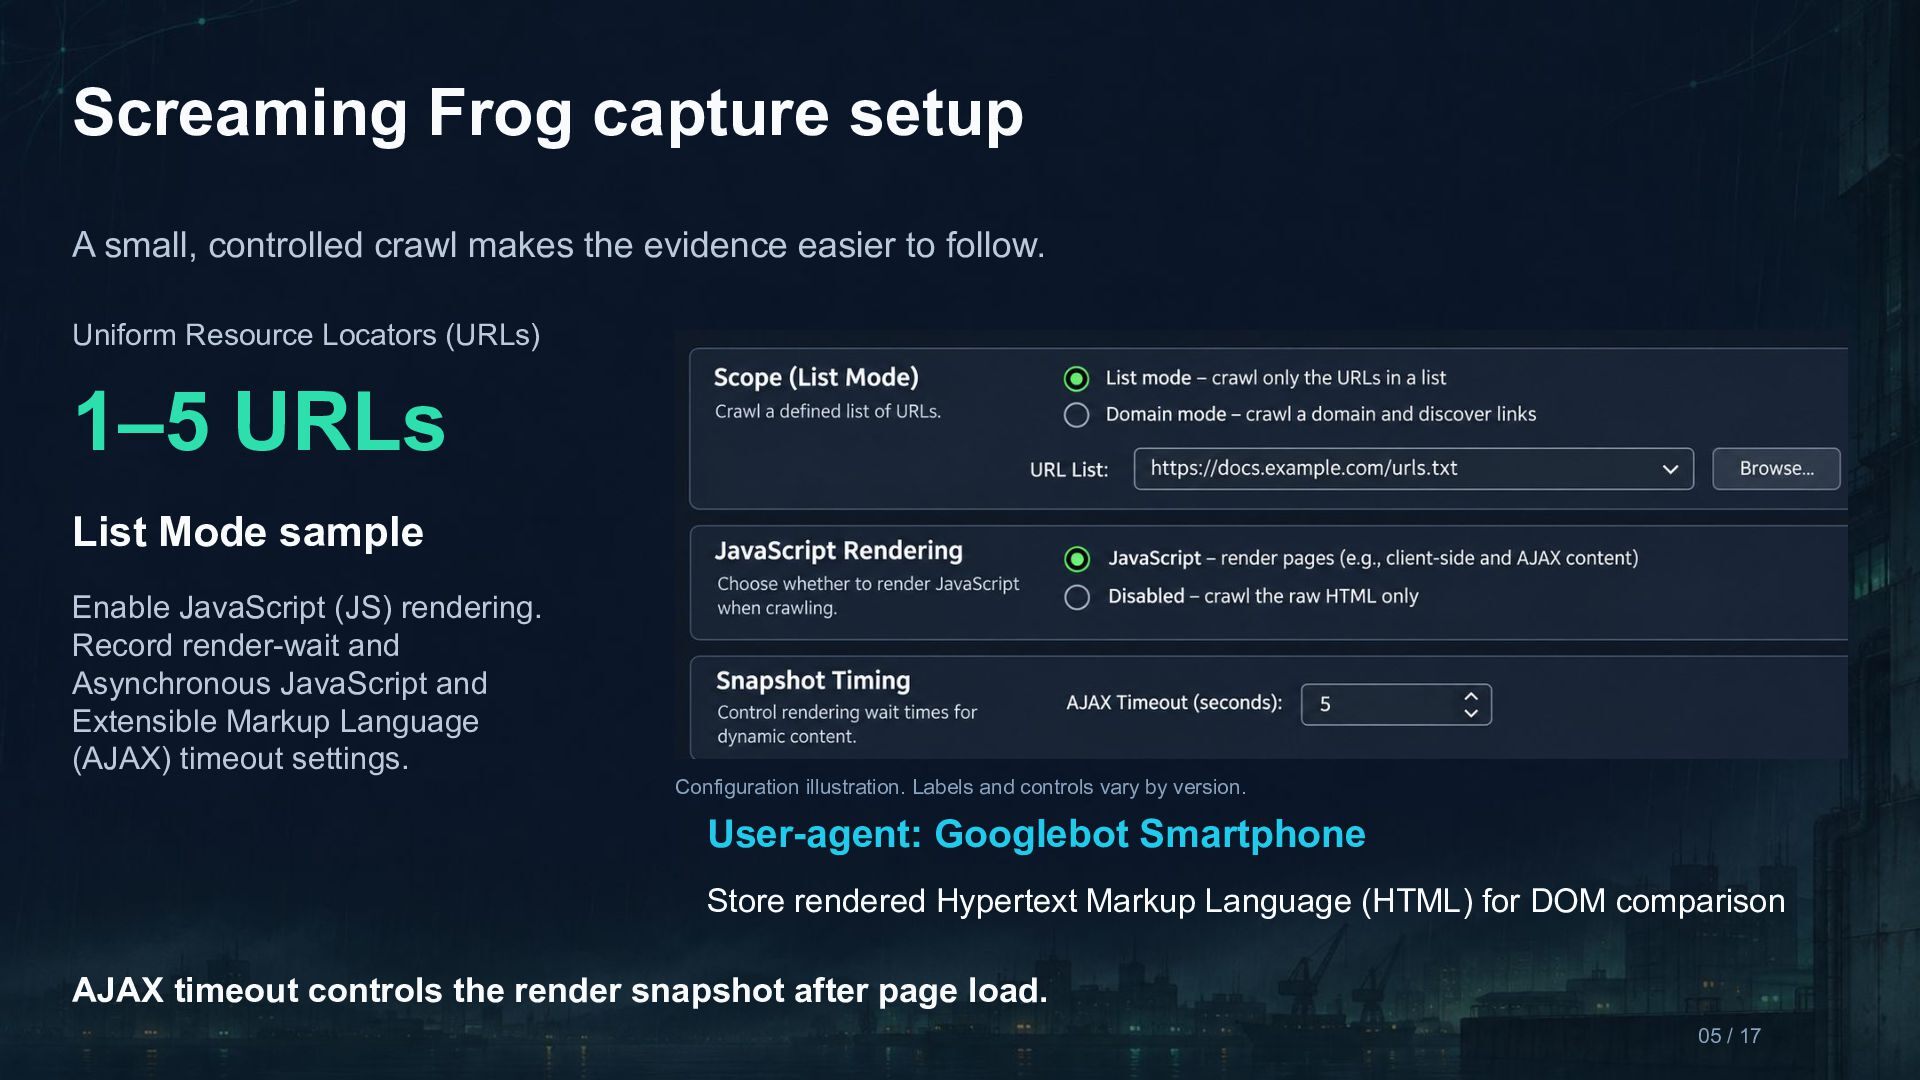
  5. Screaming Frog capture setup A small, controlled crawl makes the

    evidence easier to follow. Uniform Resource Locators (URLs) 1–5 URLs List Mode sample Enable JavaScript (JS) rendering. Record render-wait and Asynchronous JavaScript and Extensible Markup Language (AJAX) timeout settings. Configuration illustration. Labels and controls vary by version. User-agent: Googlebot Smartphone Store rendered Hypertext Markup Language (HTML) for DOM comparison AJAX timeout controls the render snapshot after page load. 05 / 17
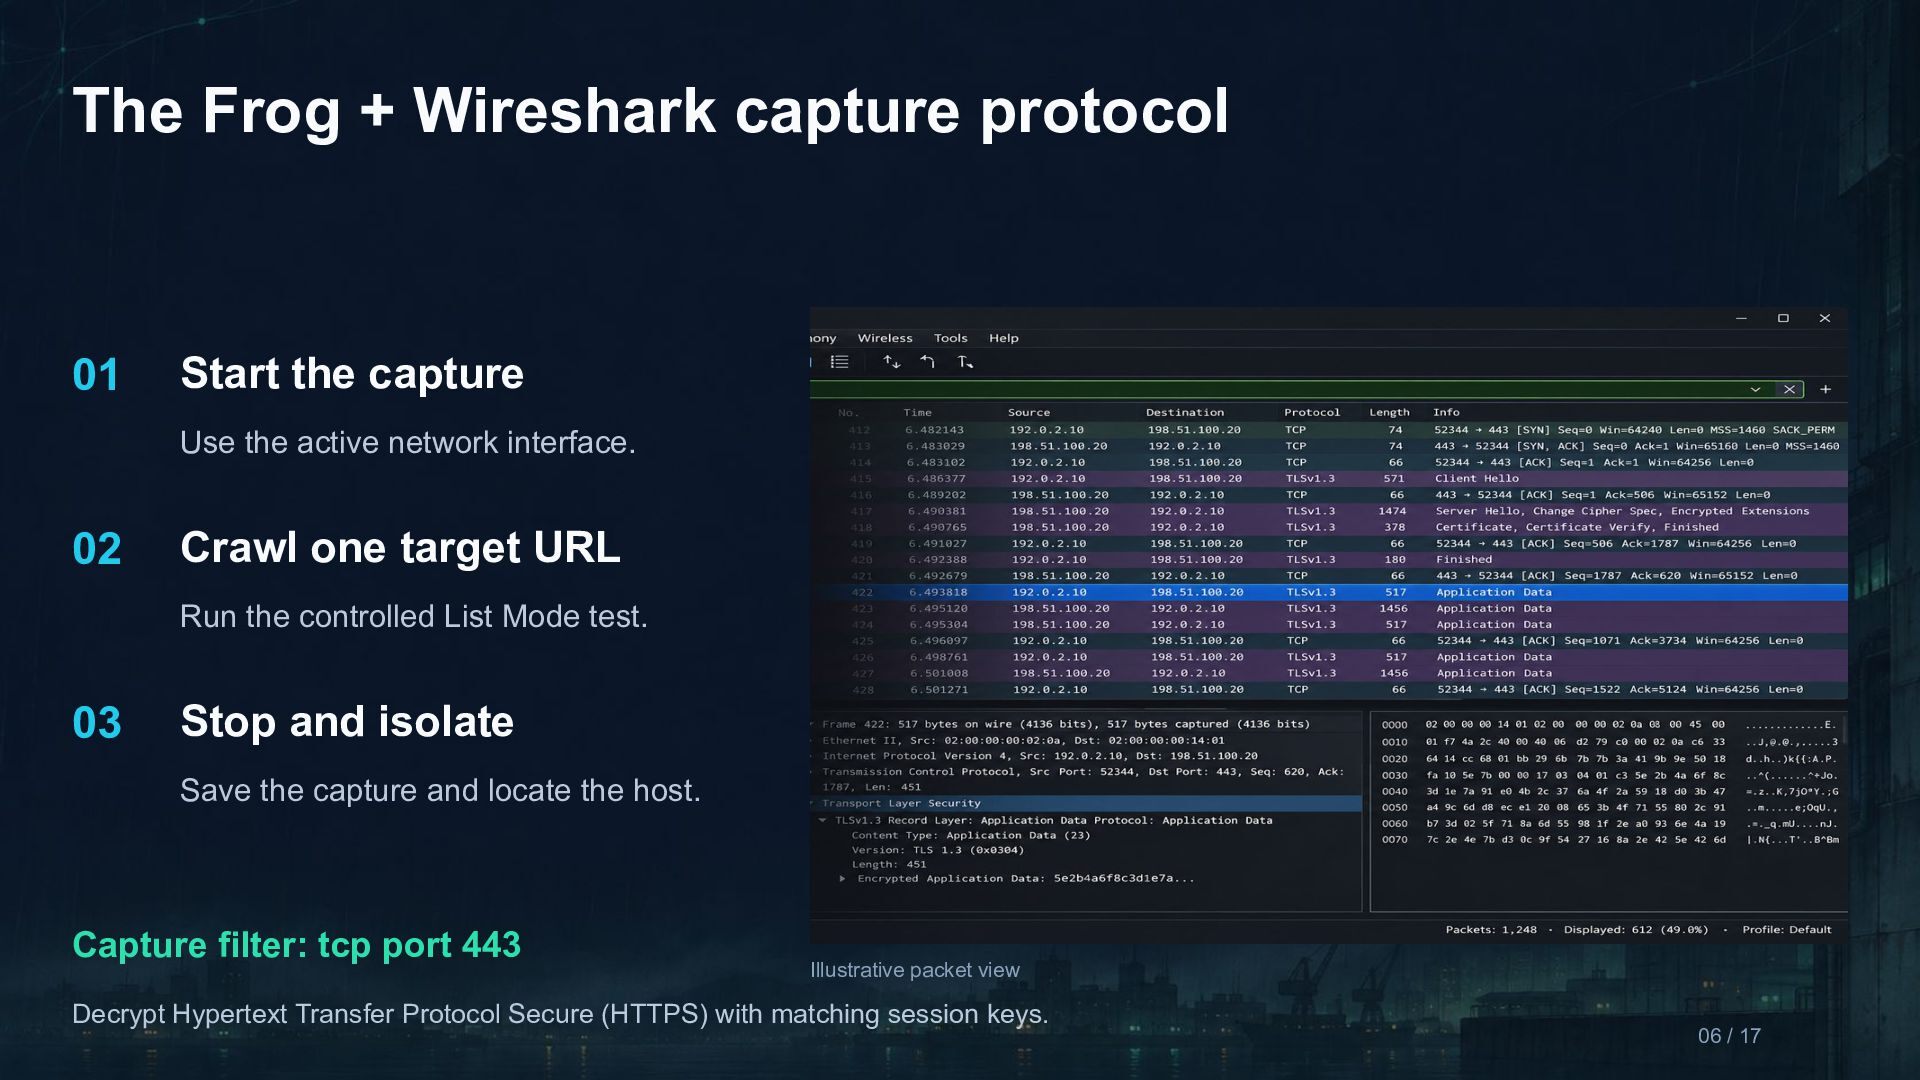
  6. The Frog + Wireshark capture protocol 01 Start the capture

    Use the active network interface. 02 Crawl one target URL Run the controlled List Mode test. 03 Stop and isolate Save the capture and locate the host. Capture filter: tcp port 443 Illustrative packet view Decrypt Hypertext Transfer Protocol Secure (HTTPS) with matching session keys. 06 / 17
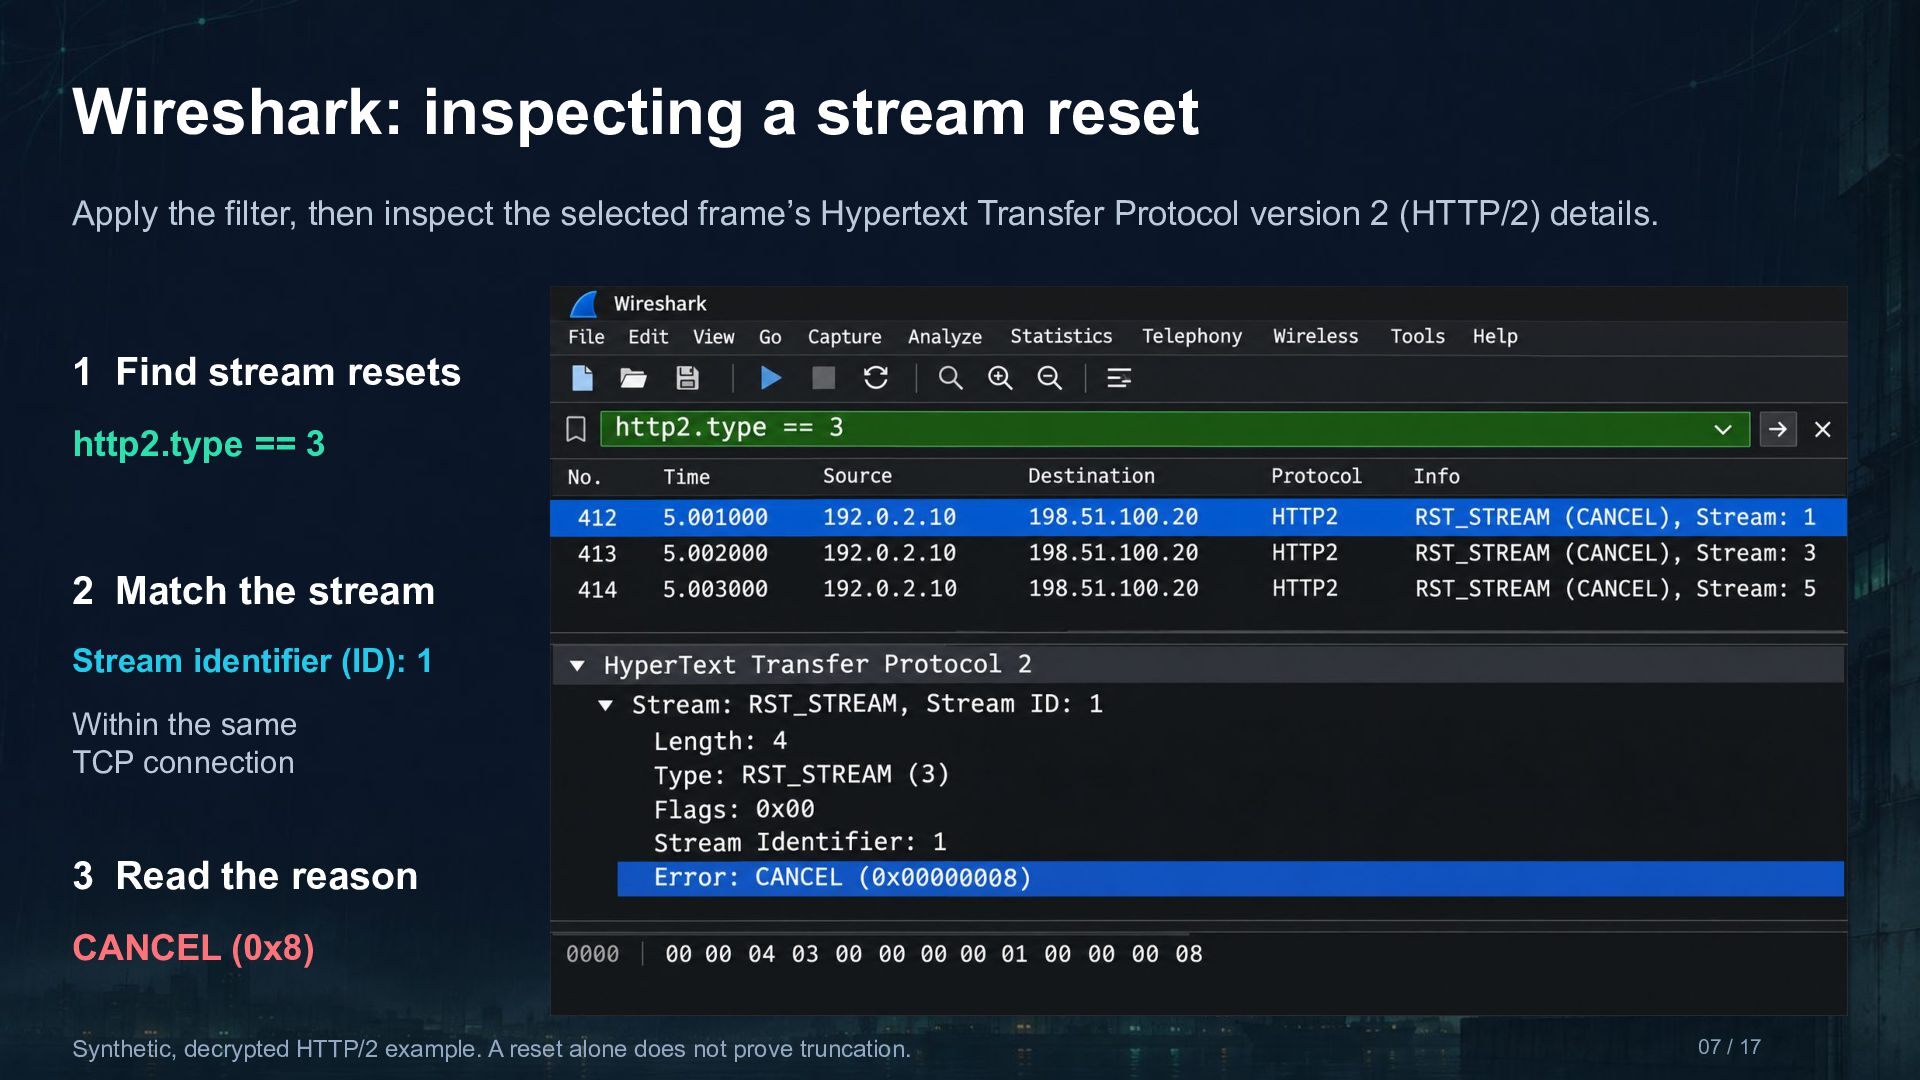
  7. Wireshark: inspecting a stream reset Apply the filter, then inspect

    the selected frame’s Hypertext Transfer Protocol version 2 (HTTP/2) details. 1 Find stream resets http2.type == 3 2 Match the stream Stream identifier (ID): 1 Within the same TCP connection 3 Read the reason CANCEL (0x8) Synthetic, decrypted HTTP/2 example. A reset alone does not prove truncation. 07 / 17
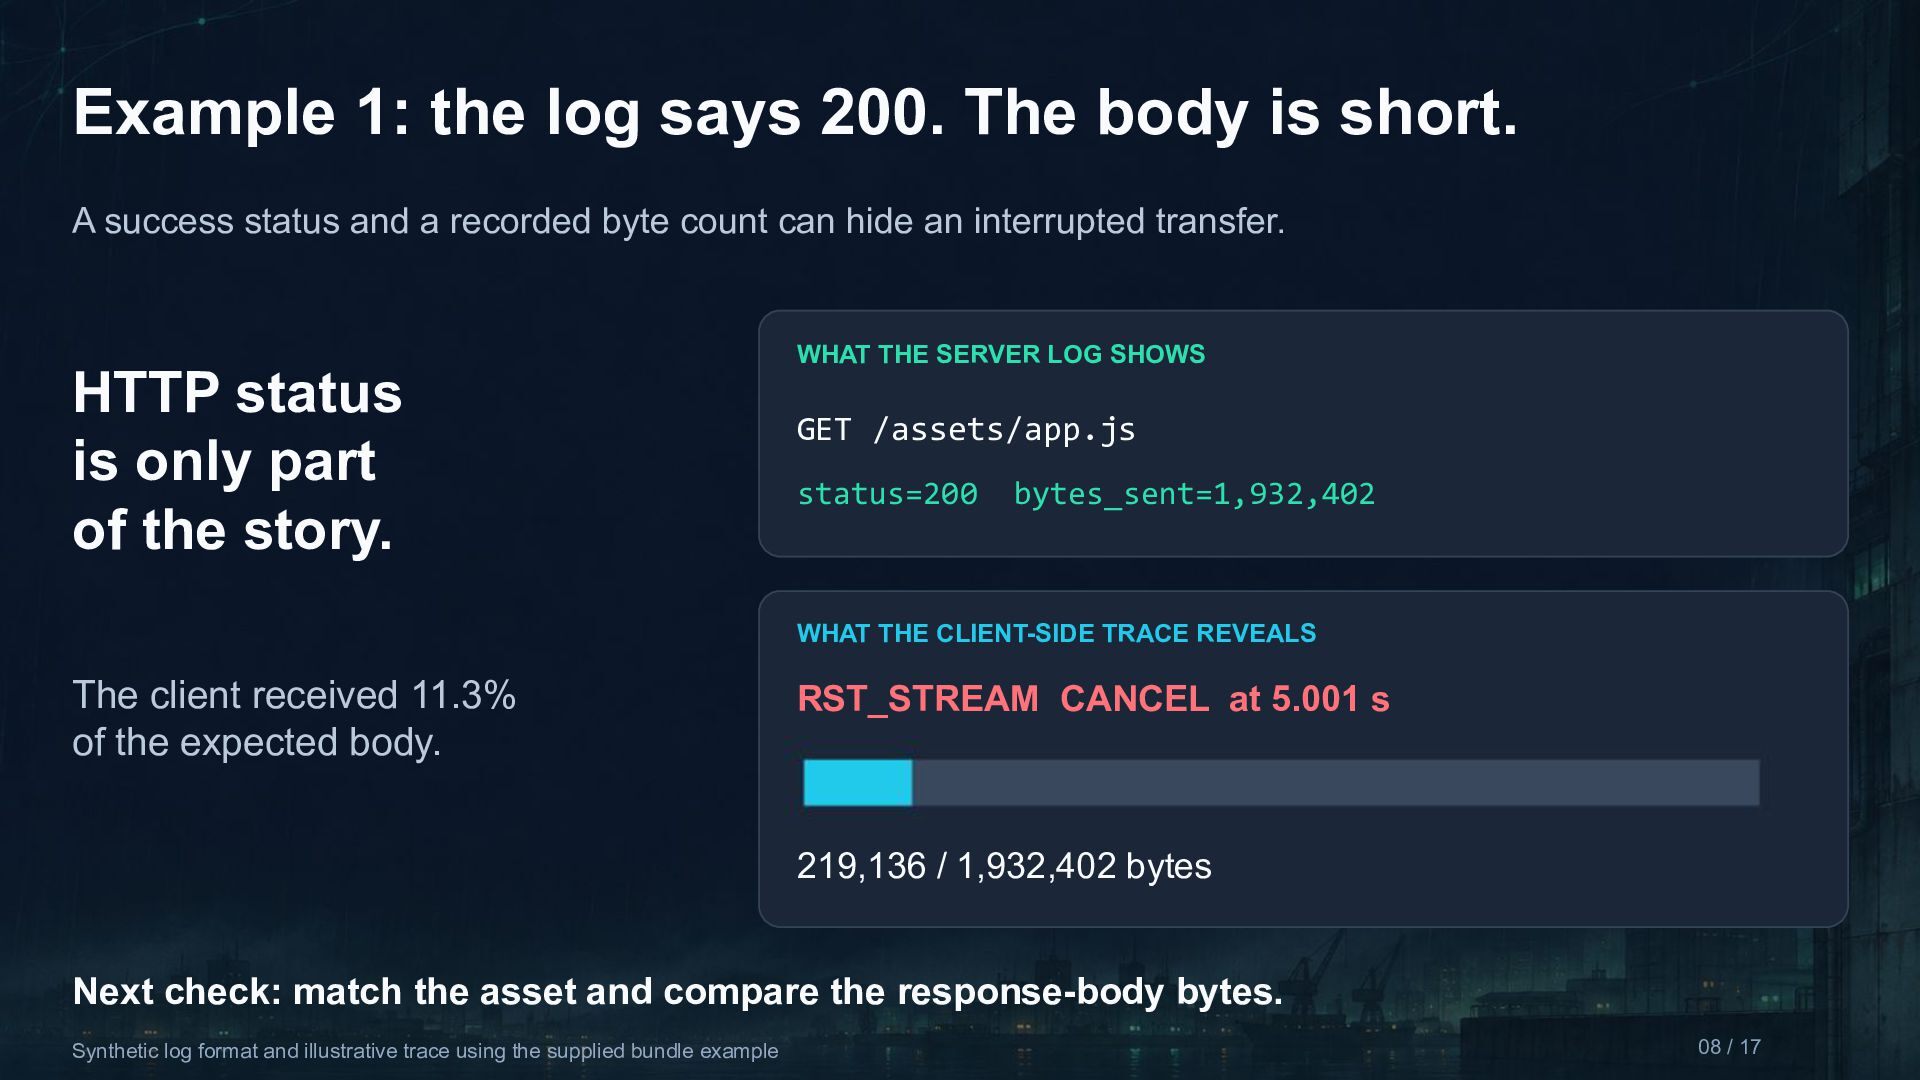
  8. Example 1: the log says 200. The body is short.

    A success status and a recorded byte count can hide an interrupted transfer. WHAT THE SERVER LOG SHOWS HTTP status is only part of the story. GET /assets/app.js status=200 bytes_sent=1,932,402 WHAT THE CLIENT-SIDE TRACE REVEALS The client received 11.3% of the expected body. RST_STREAM CANCEL at 5.001 s 219,136 / 1,932,402 bytes Next check: match the asset and compare the response-body bytes. Synthetic log format and illustrative trace using the supplied bundle example 08 / 17
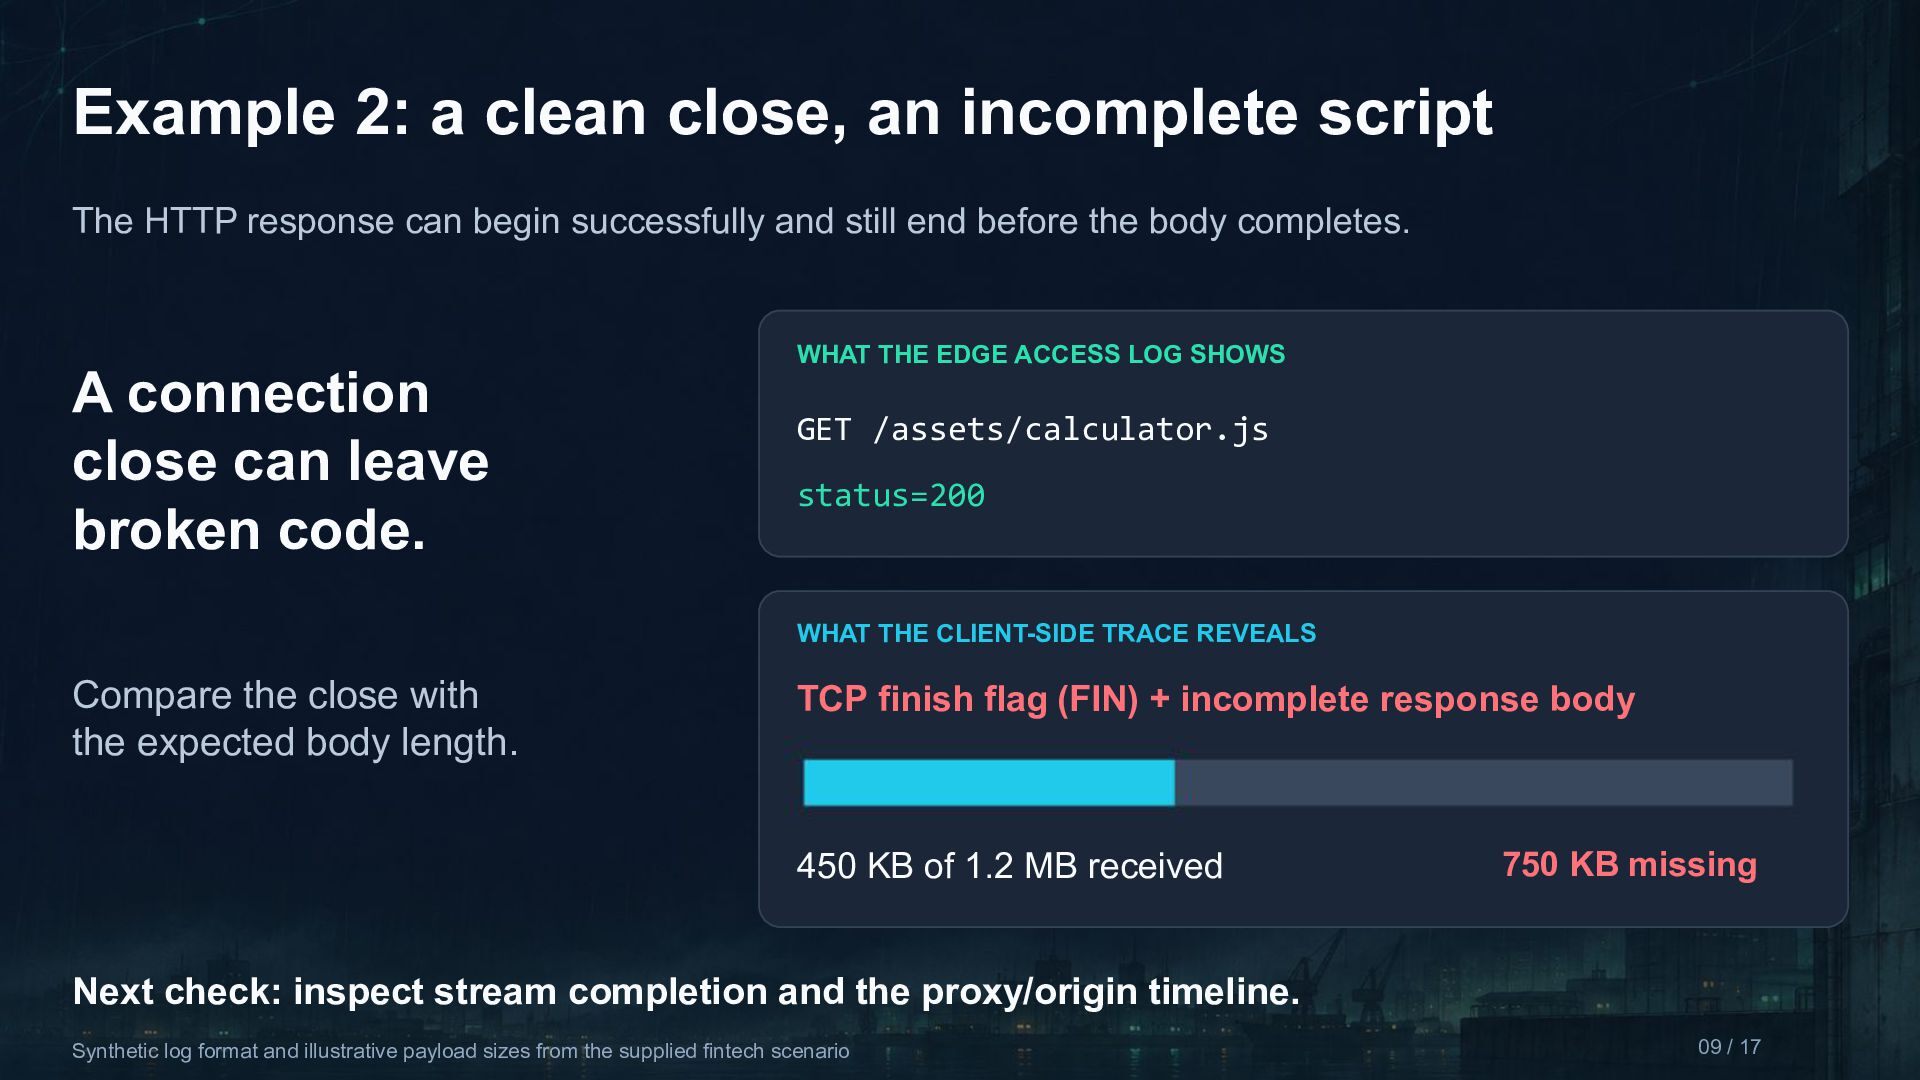
  9. Example 2: a clean close, an incomplete script The HTTP

    response can begin successfully and still end before the body completes. WHAT THE EDGE ACCESS LOG SHOWS A connection close can leave broken code. GET /assets/calculator.js status=200 WHAT THE CLIENT-SIDE TRACE REVEALS Compare the close with the expected body length. TCP finish flag (FIN) + incomplete response body 450 KB of 1.2 MB received 750 KB missing Next check: inspect stream completion and the proxy/origin timeline. Synthetic log format and illustrative payload sizes from the supplied fintech scenario 09 / 17
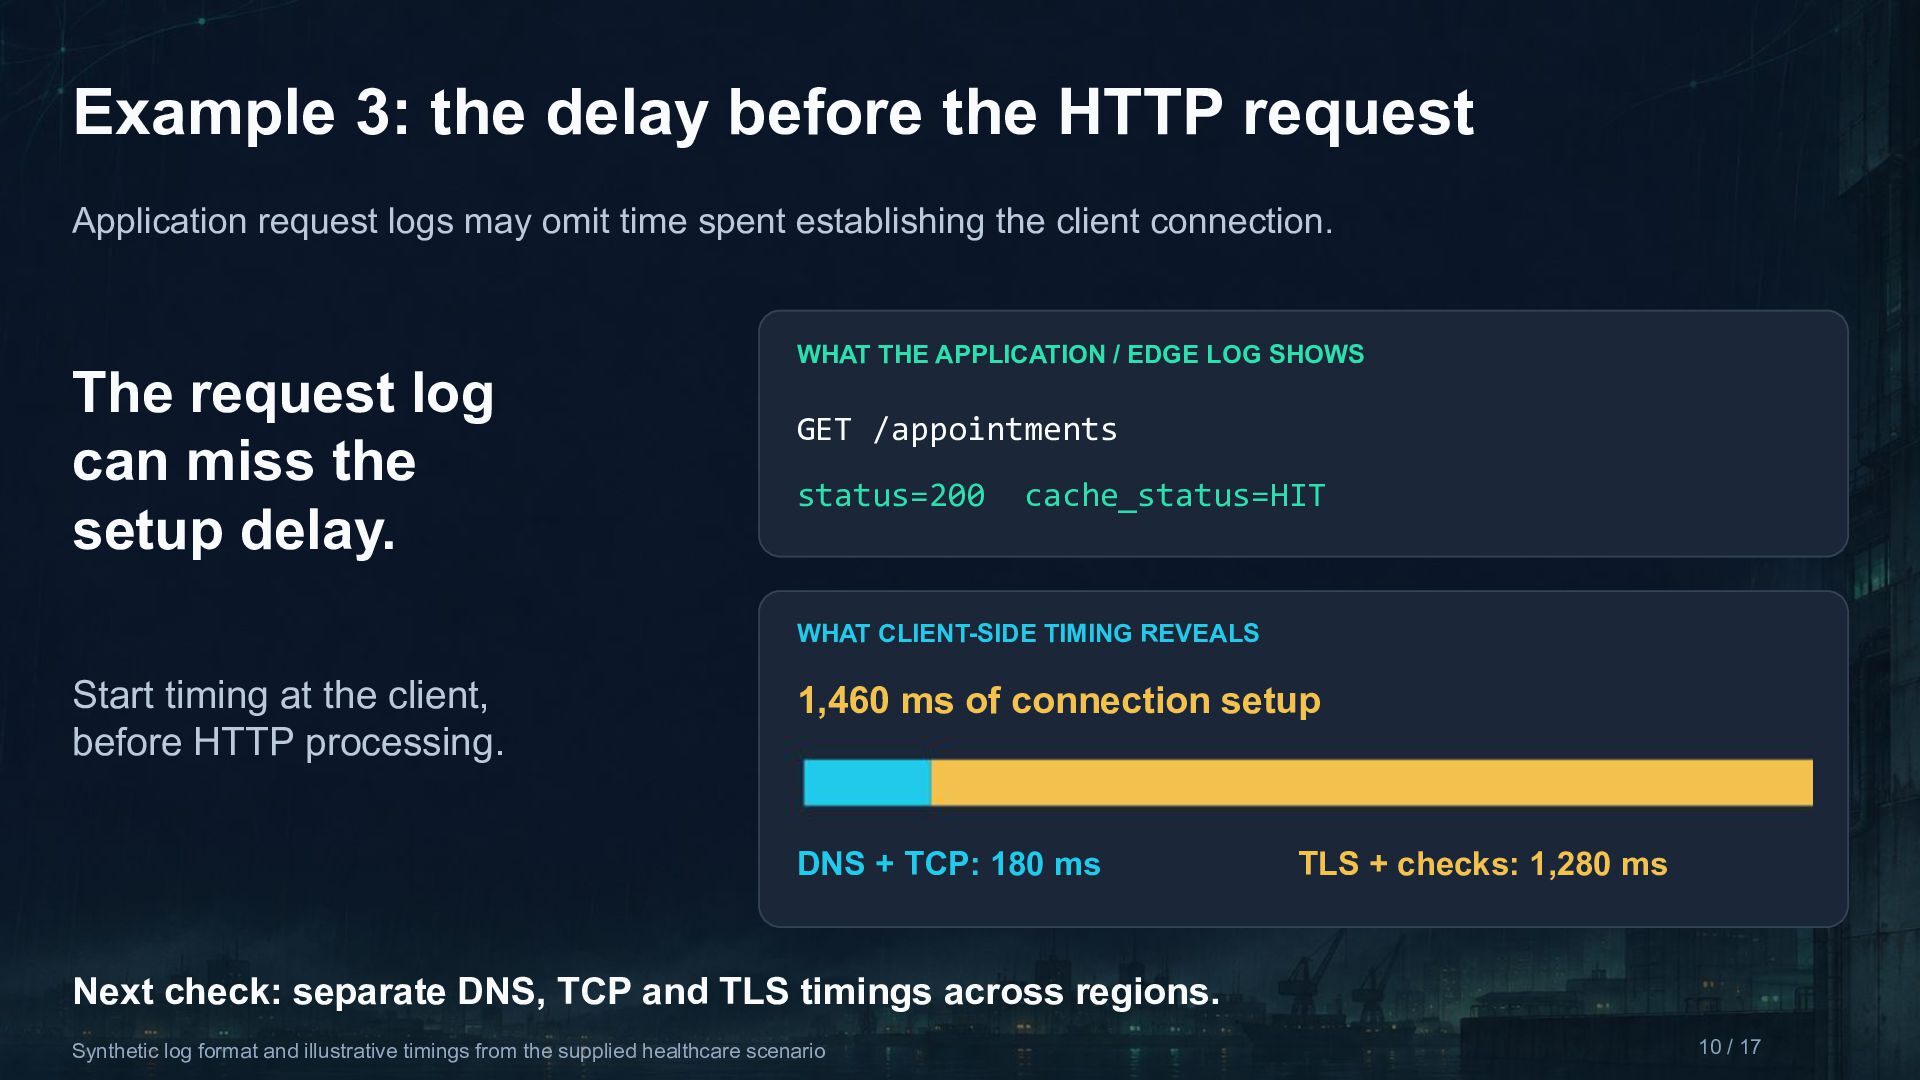
  10. Example 3: the delay before the HTTP request Application request

    logs may omit time spent establishing the client connection. WHAT THE APPLICATION / EDGE LOG SHOWS The request log can miss the setup delay. GET /appointments status=200 cache_status=HIT WHAT CLIENT-SIDE TIMING REVEALS Start timing at the client, before HTTP processing. 1,460 ms of connection setup DNS + TCP: 180 ms TLS + checks: 1,280 ms Next check: separate DNS, TCP and TLS timings across regions. Synthetic log format and illustrative timings from the supplied healthcare scenario 10 / 17
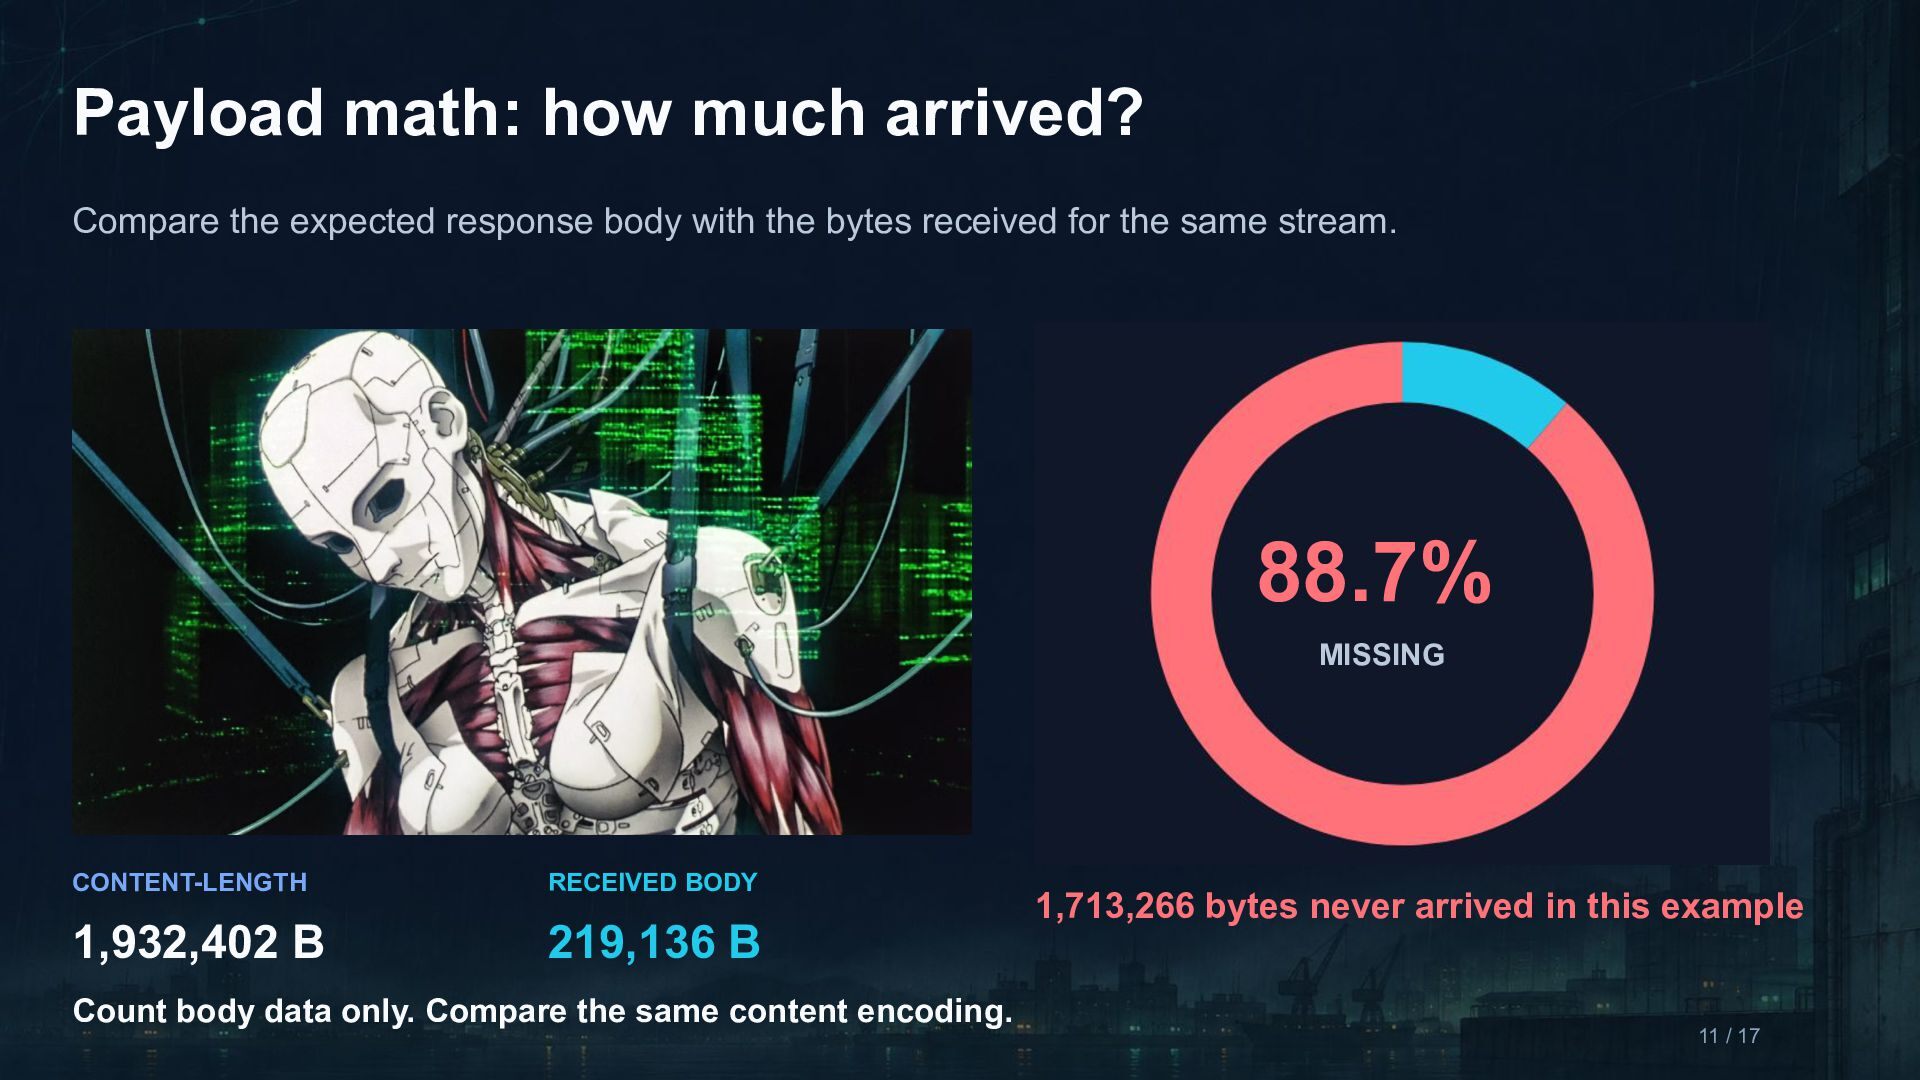
  11. Payload math: how much arrived? Compare the expected response body

    with the bytes received for the same stream. 88.7% MISSING CONTENT-LENGTH RECEIVED BODY 1,932,402 B 219,136 B Count body data only. Compare the same content encoding. 1,713,266 bytes never arrived in this example 11 / 17
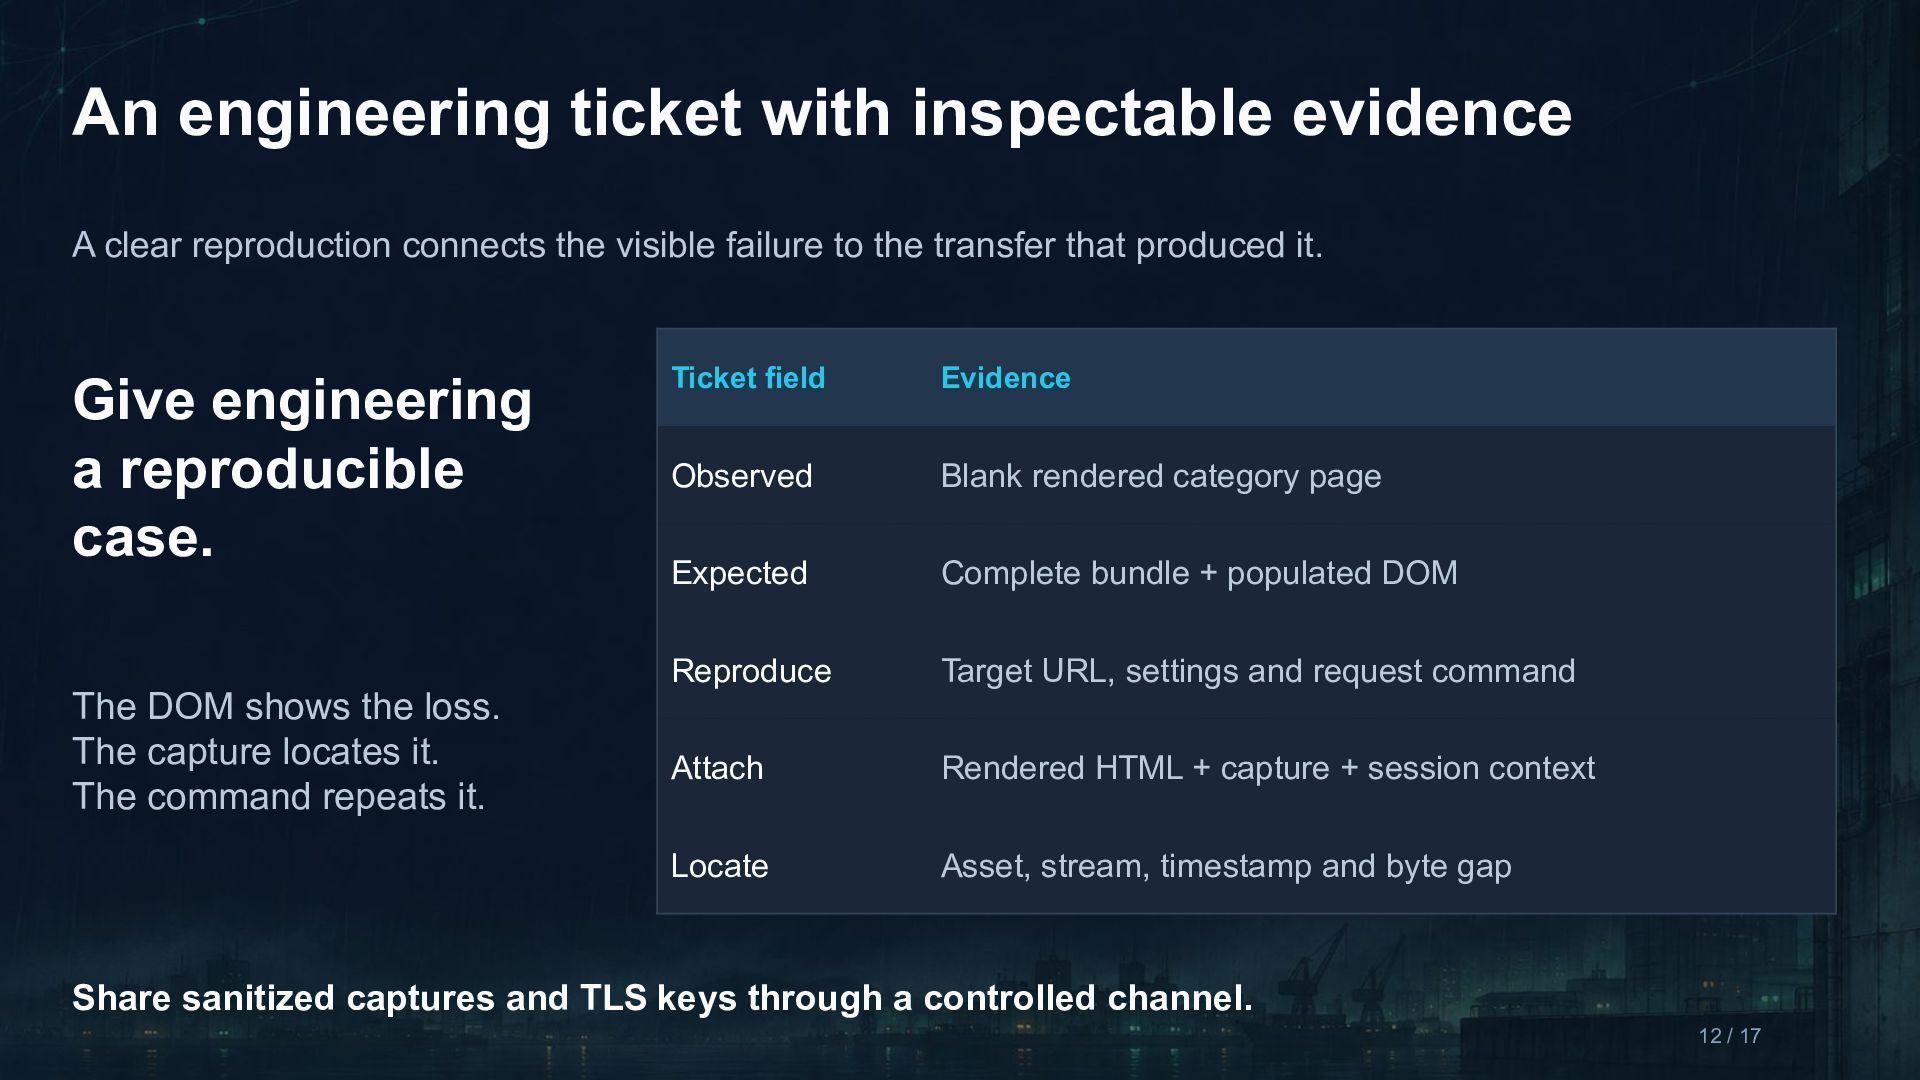
  12. An engineering ticket with inspectable evidence A clear reproduction connects

    the visible failure to the transfer that produced it. Give engineering a reproducible case. The DOM shows the loss. The capture locates it. The command repeats it. Ticket field Evidence Observed Blank rendered category page Expected Complete bundle + populated DOM Reproduce Target URL, settings and request command Attach Rendered HTML + capture + session context Locate Asset, stream, timestamp and byte gap Share sanitized captures and TLS keys through a controlled channel. 12 / 17
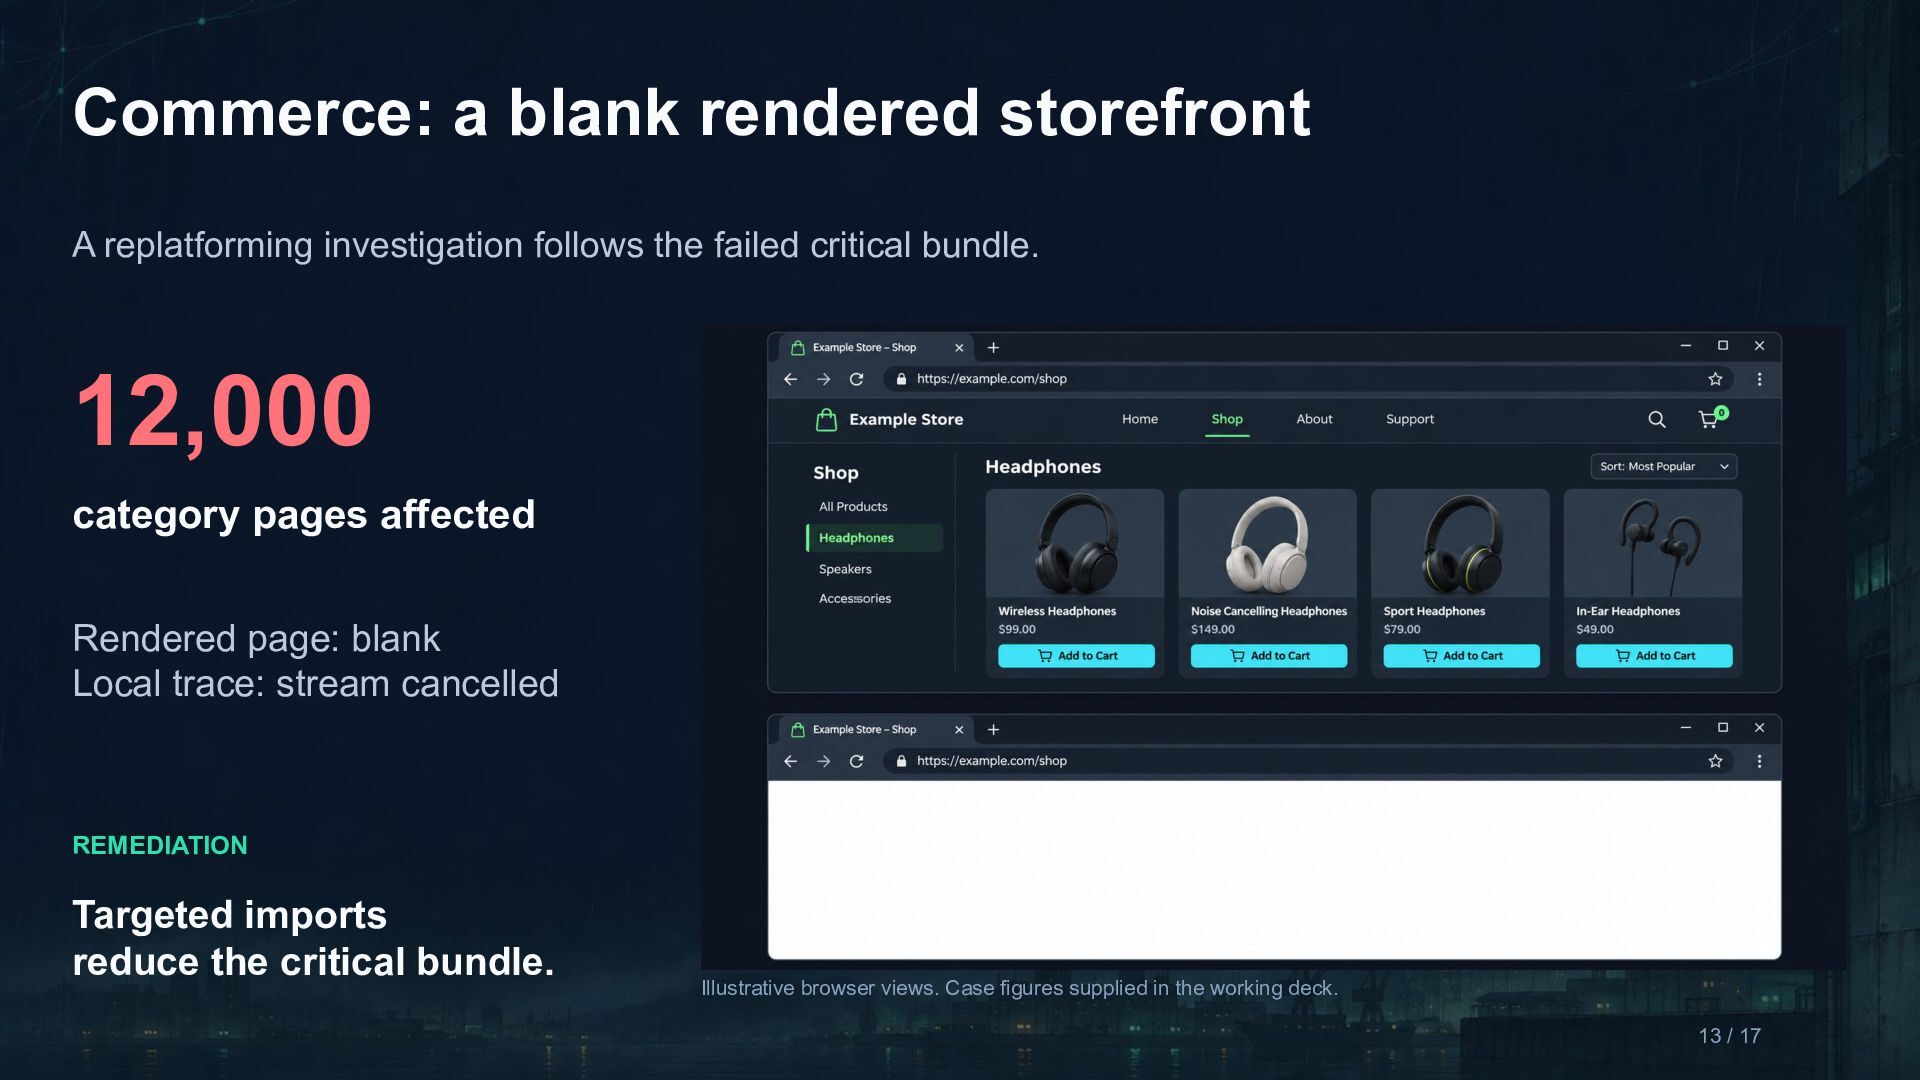
  13. Commerce: a blank rendered storefront A replatforming investigation follows the

    failed critical bundle. 12,000 category pages affected Rendered page: blank Local trace: stream cancelled REMEDIATION Targeted imports reduce the critical bundle. Illustrative browser views. Case figures supplied in the working deck. 13 / 17
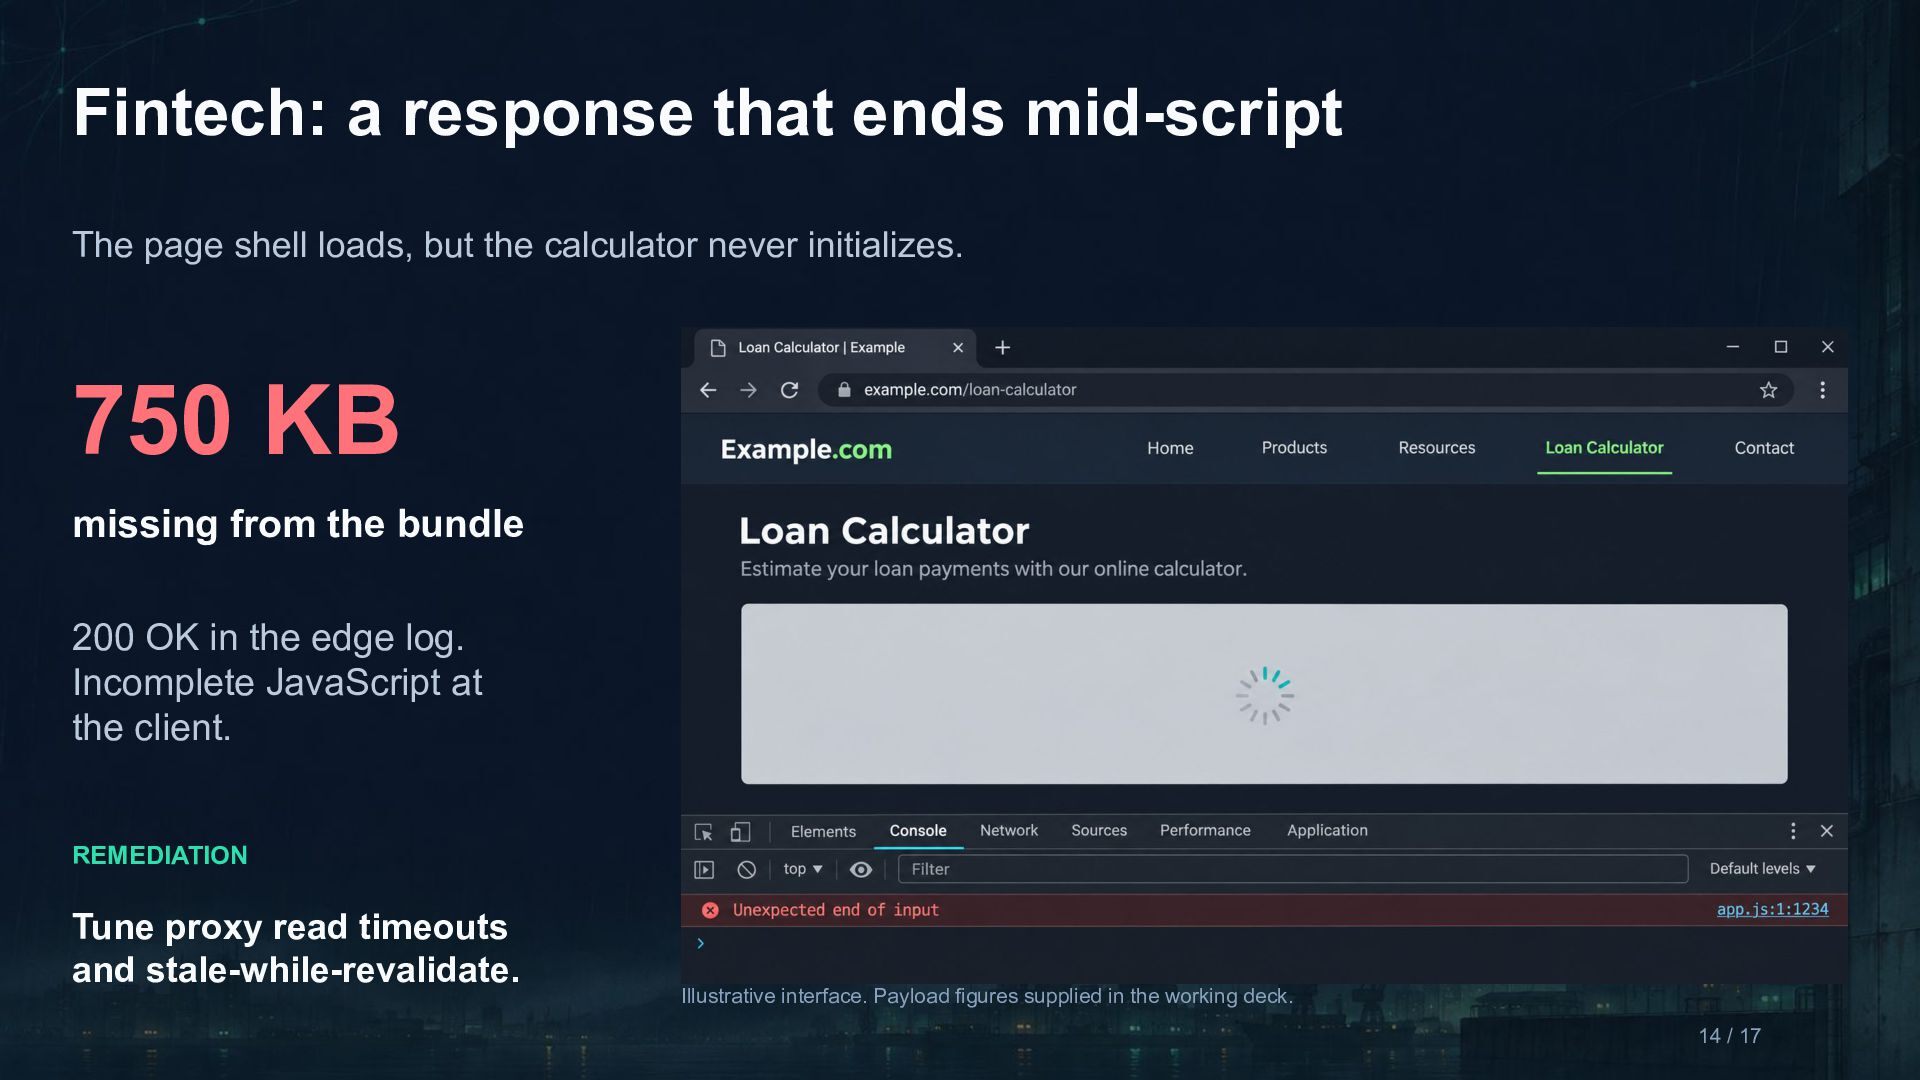
  14. Fintech: a response that ends mid-script The page shell loads,

    but the calculator never initializes. 750 KB missing from the bundle 200 OK in the edge log. Incomplete JavaScript at the client. REMEDIATION Tune proxy read timeouts and stale-while-revalidate. Illustrative interface. Payload figures supplied in the working deck. 14 / 17
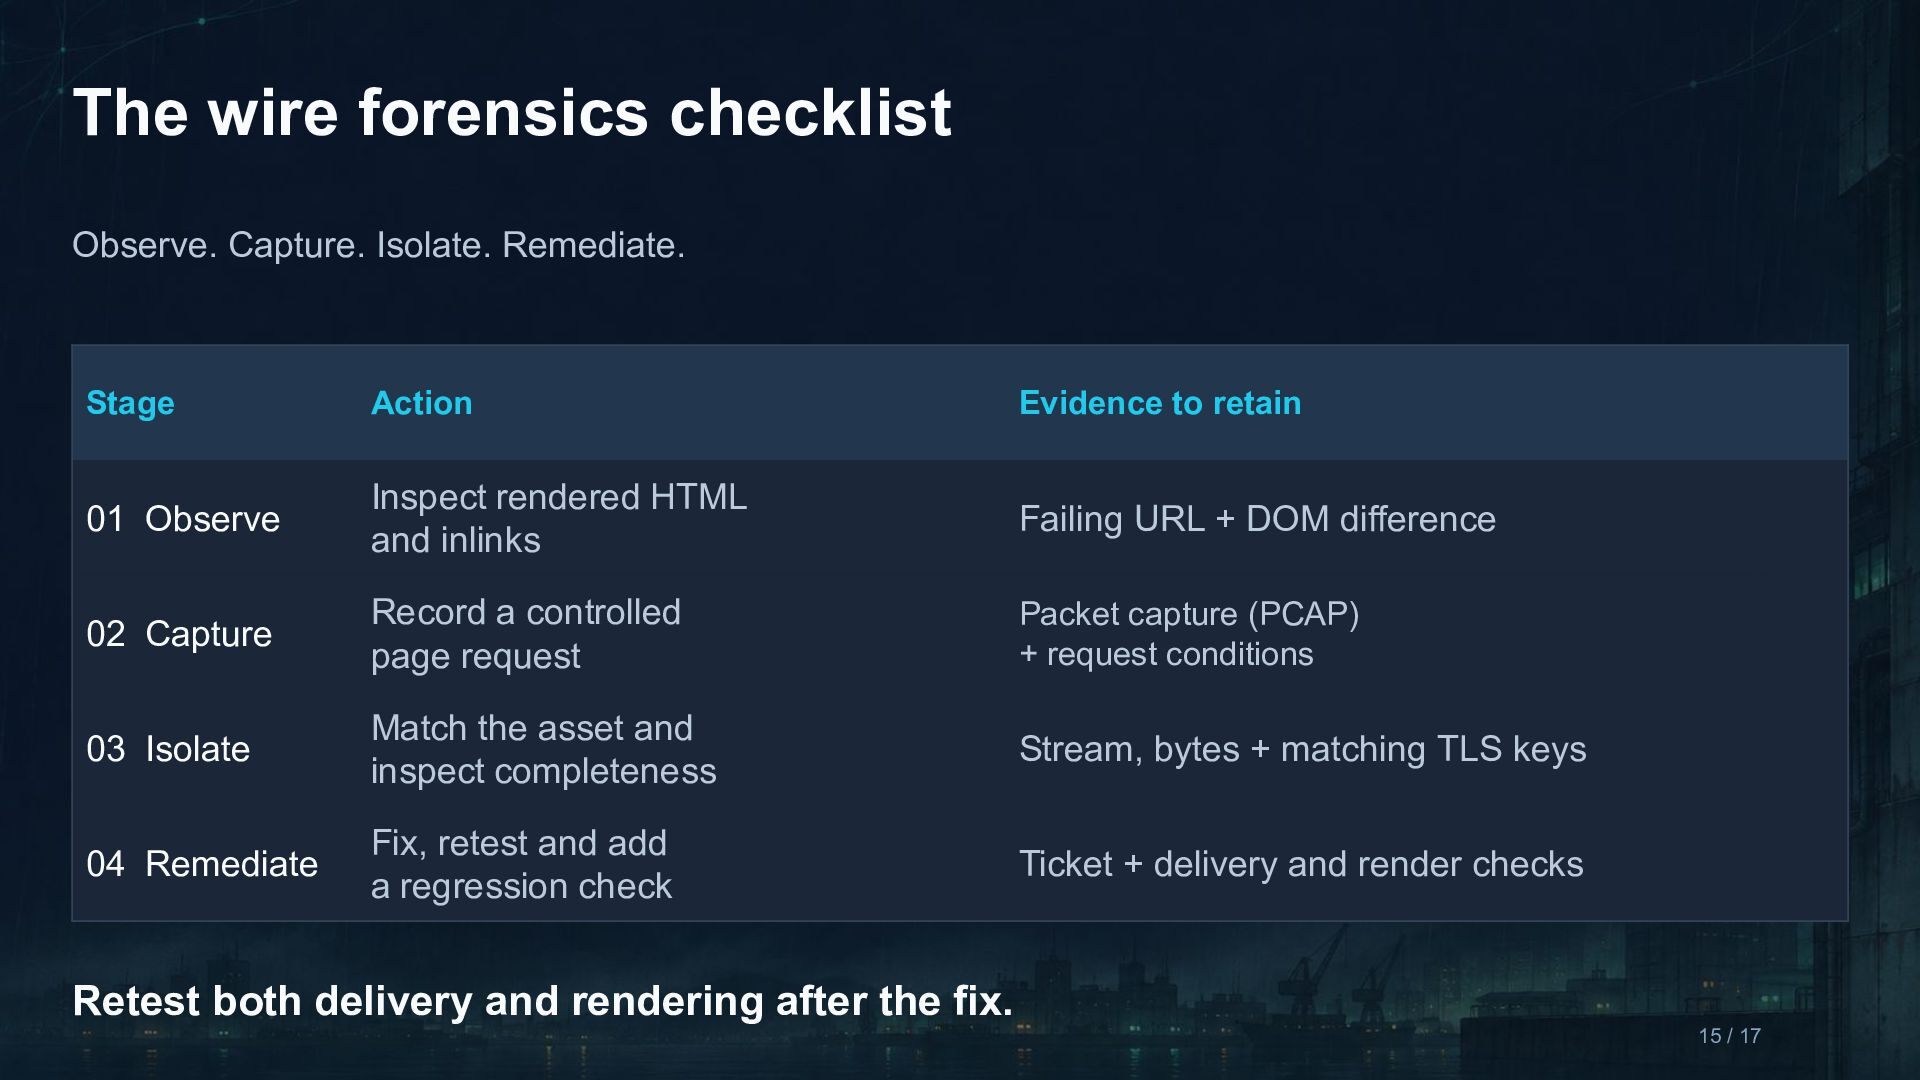
  15. The wire forensics checklist Observe. Capture. Isolate. Remediate. Stage Action

    Evidence to retain 01 Observe Inspect rendered HTML and inlinks Failing URL + DOM difference 02 Capture Record a controlled page request Packet capture (PCAP) + request conditions 03 Isolate Match the asset and inspect completeness Stream, bytes + matching TLS keys 04 Remediate Fix, retest and add a regression check Ticket + delivery and render checks Retest both delivery and rendering after the fix. 15 / 17
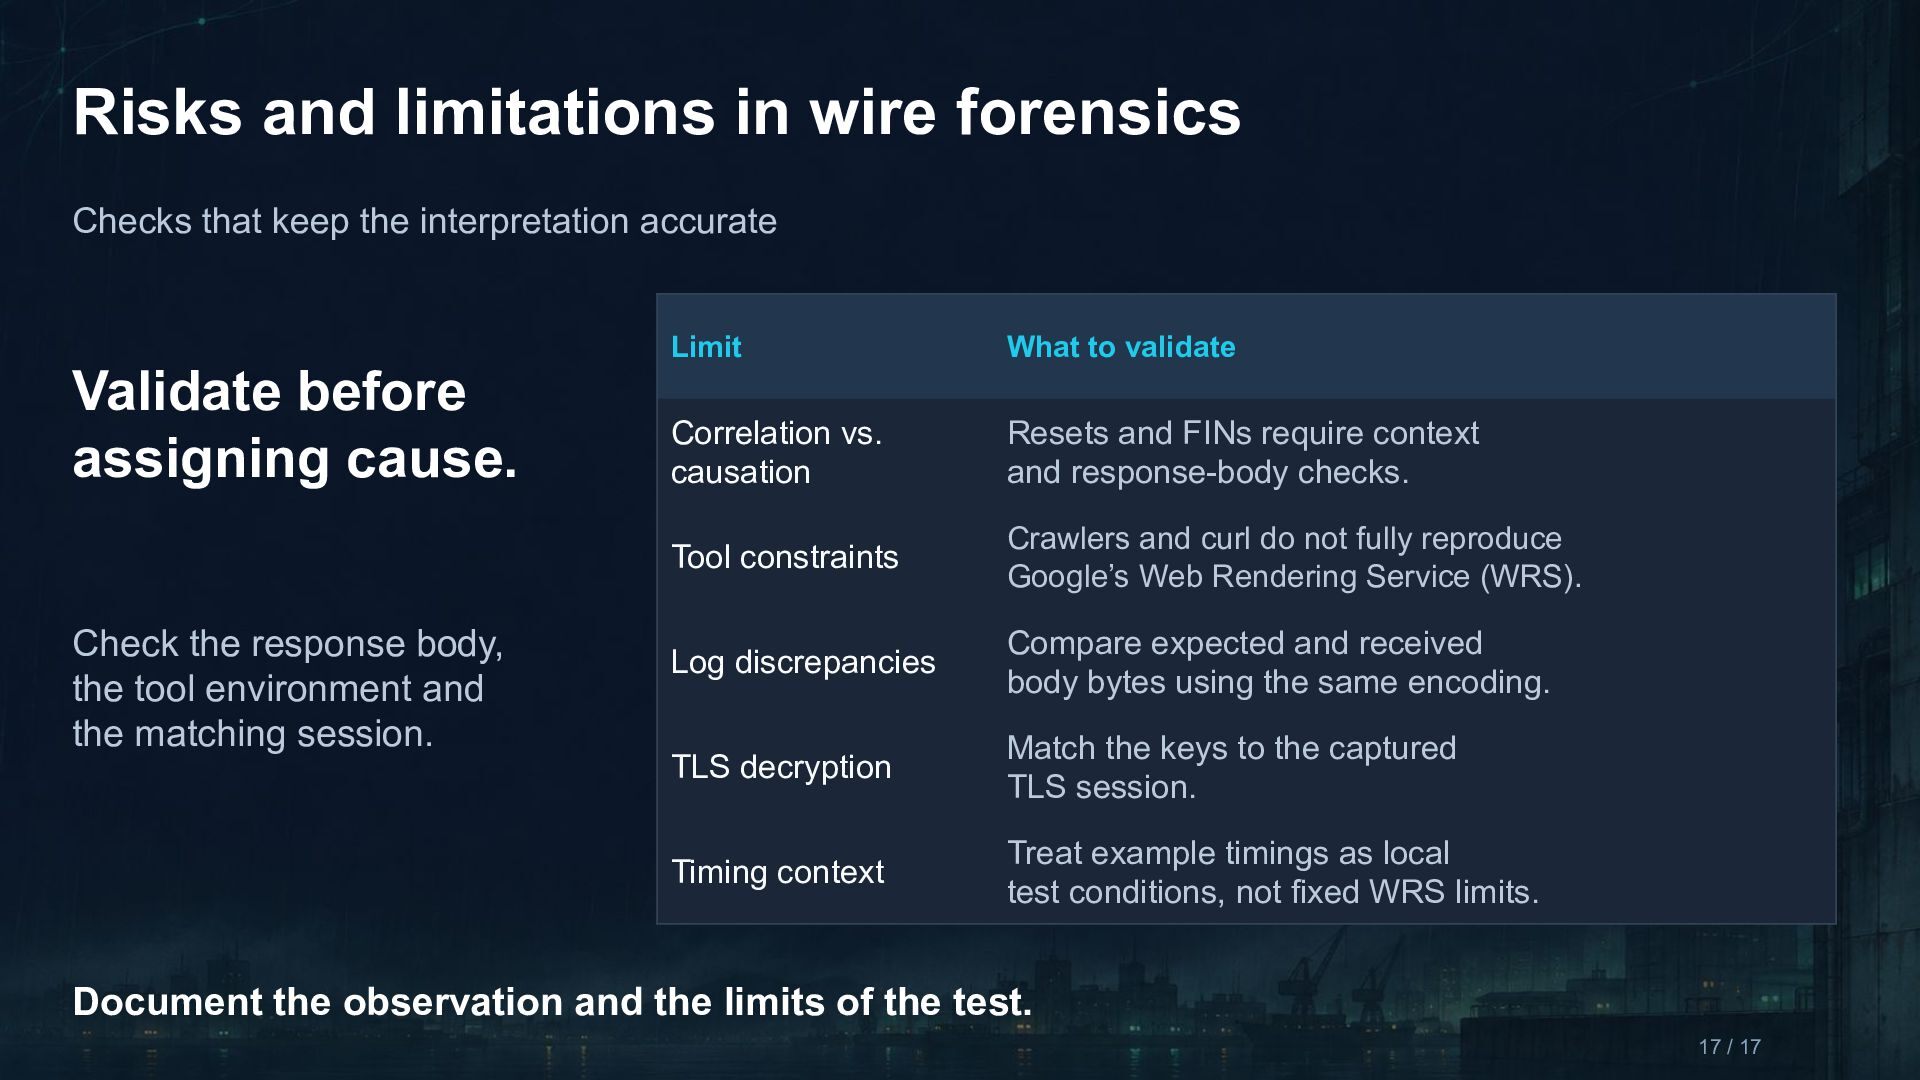
  16. Risks and limitations in wire forensics Checks that keep the

    interpretation accurate Validate before assigning cause. Check the response body, the tool environment and the matching session. Limit What to validate Correlation vs. causation Resets and FINs require context and response-body checks. Tool constraints Crawlers and curl do not fully reproduce Google’s Web Rendering Service (WRS). Log discrepancies Compare expected and received body bytes using the same encoding. TLS decryption Match the keys to the captured TLS session. Timing context Treat example timings as local test conditions, not fixed WRS limits. Document the observation and the limits of the test. 17 / 17
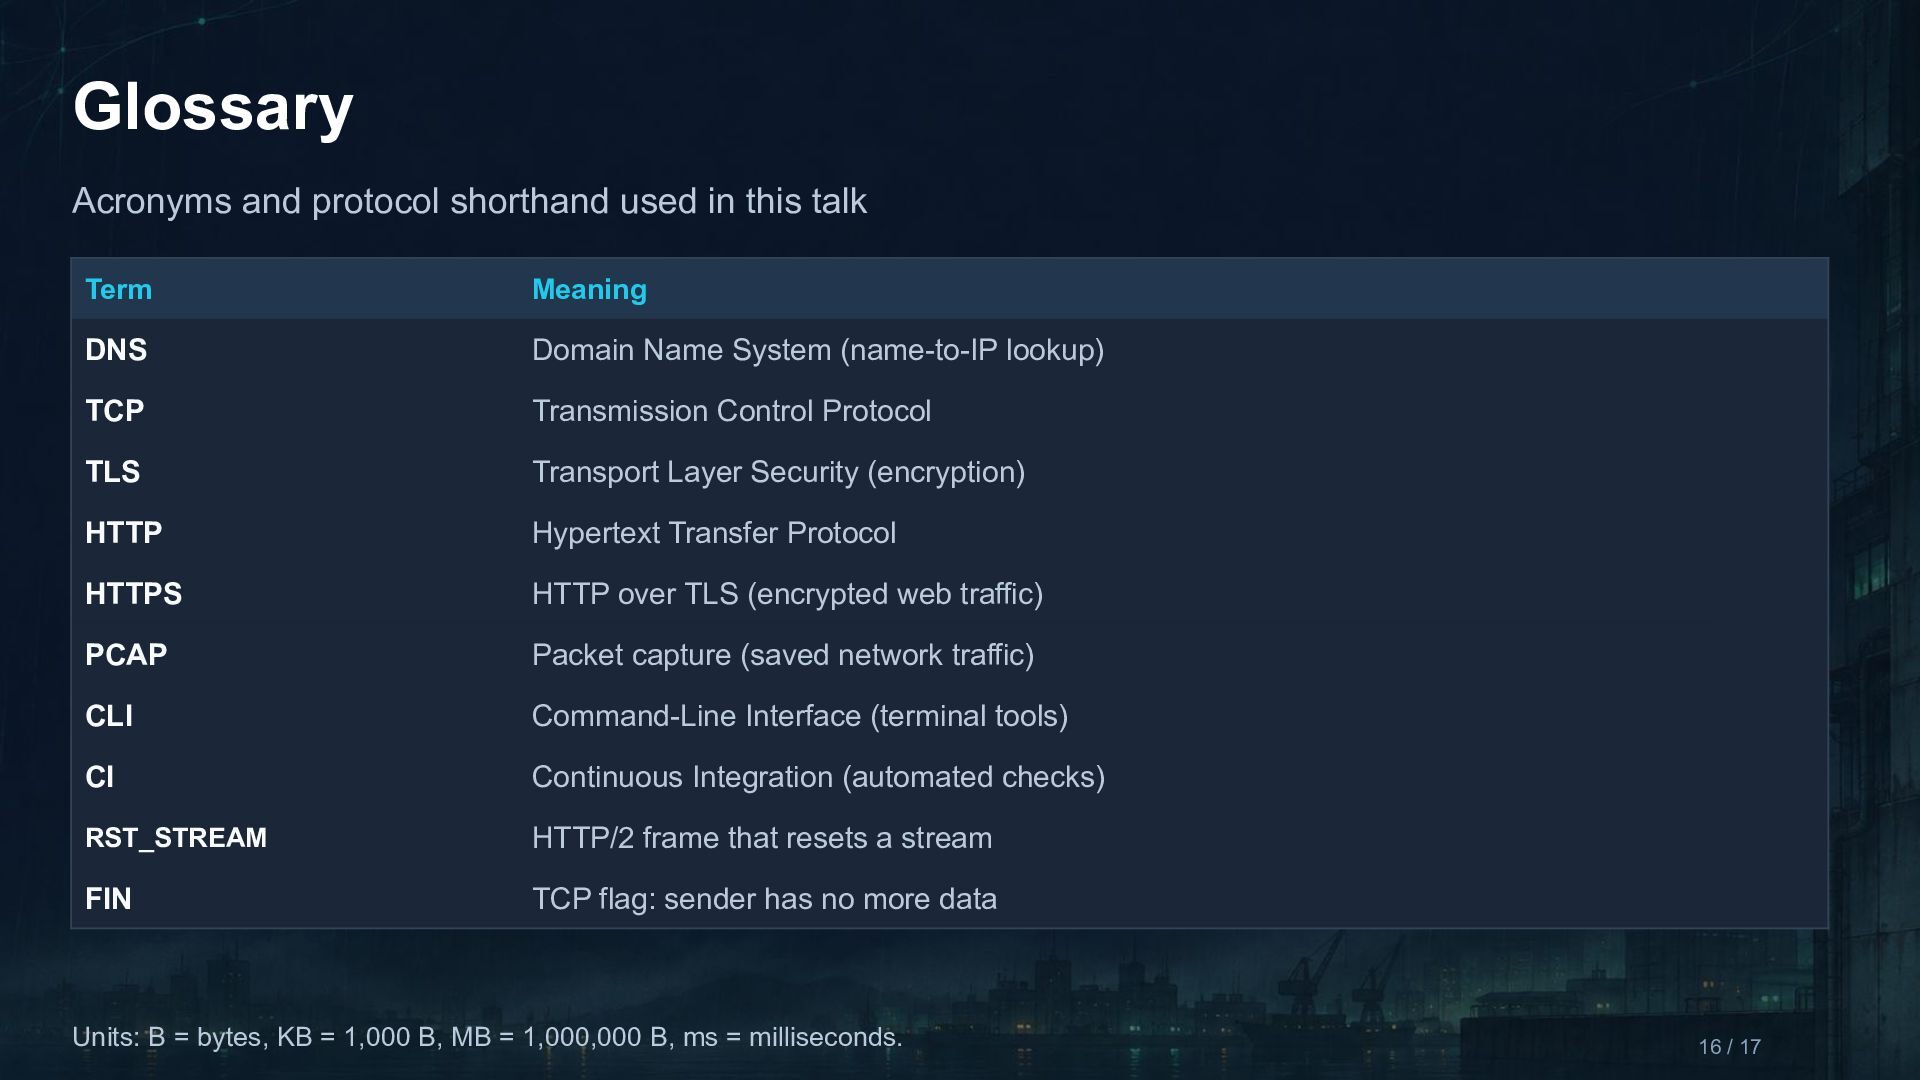
  17. Glossary Acronyms and protocol shorthand used in this talk Term

    Meaning DNS Domain Name System (name-to-IP lookup) TCP Transmission Control Protocol TLS Transport Layer Security (encryption) HTTP Hypertext Transfer Protocol HTTPS HTTP over TLS (encrypted web traffic) PCAP Packet capture (saved network traffic) CLI Command-Line Interface (terminal tools) CI Continuous Integration (automated checks) RST_STREAM HTTP/2 frame that resets a stream FIN TCP flag: sender has no more data Units: B = bytes, KB = 1,000 B, MB = 1,000,000 B, ms = milliseconds. 16 / 17

More Decks by Tech SEO Connect

Other Decks in Marketing & SEO