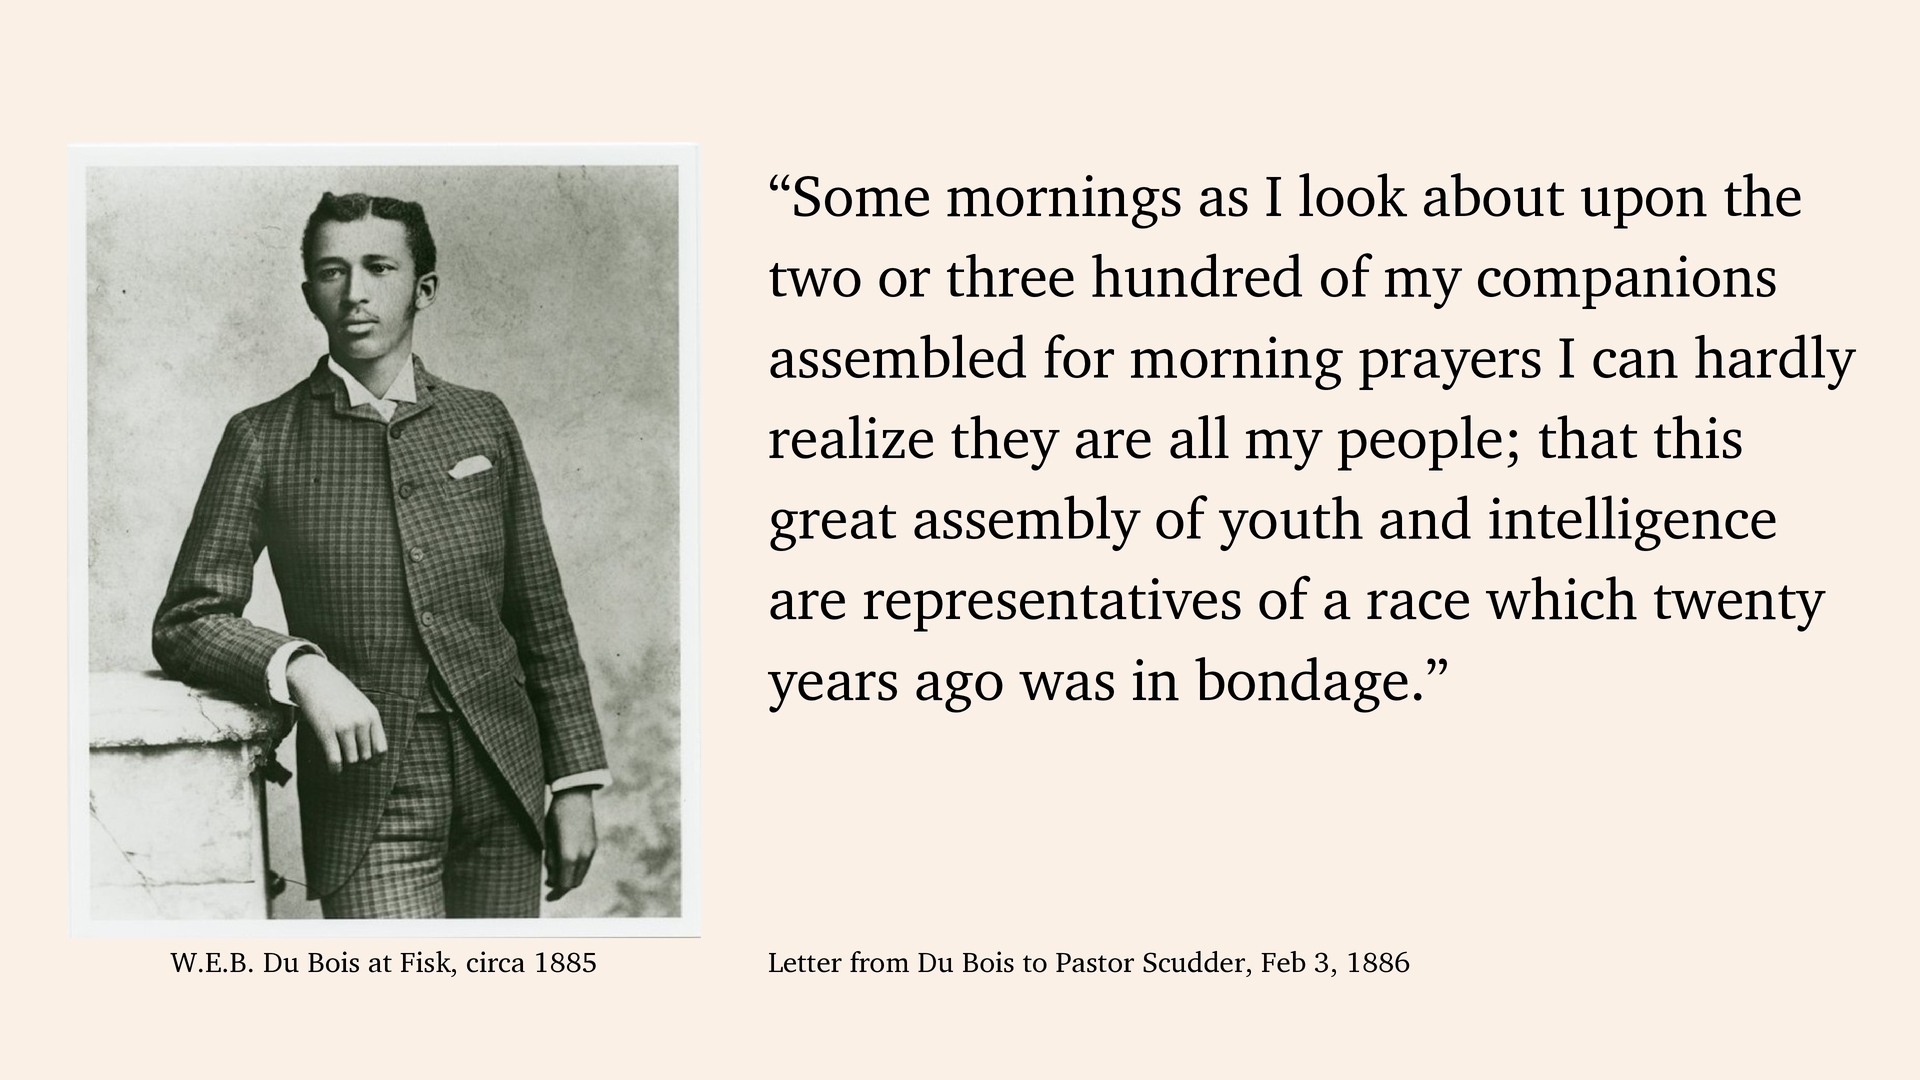
three hundred of my companions assembled for morning prayers I can hardly realize they are all my people; that this great assembly of youth and intelligence are representatives of a race which twenty years ago was in bondage.” Letter from Du Bois to Pastor Scudder, Feb 3, 1886 W.E.B. Du Bois at Fisk, circa 1885
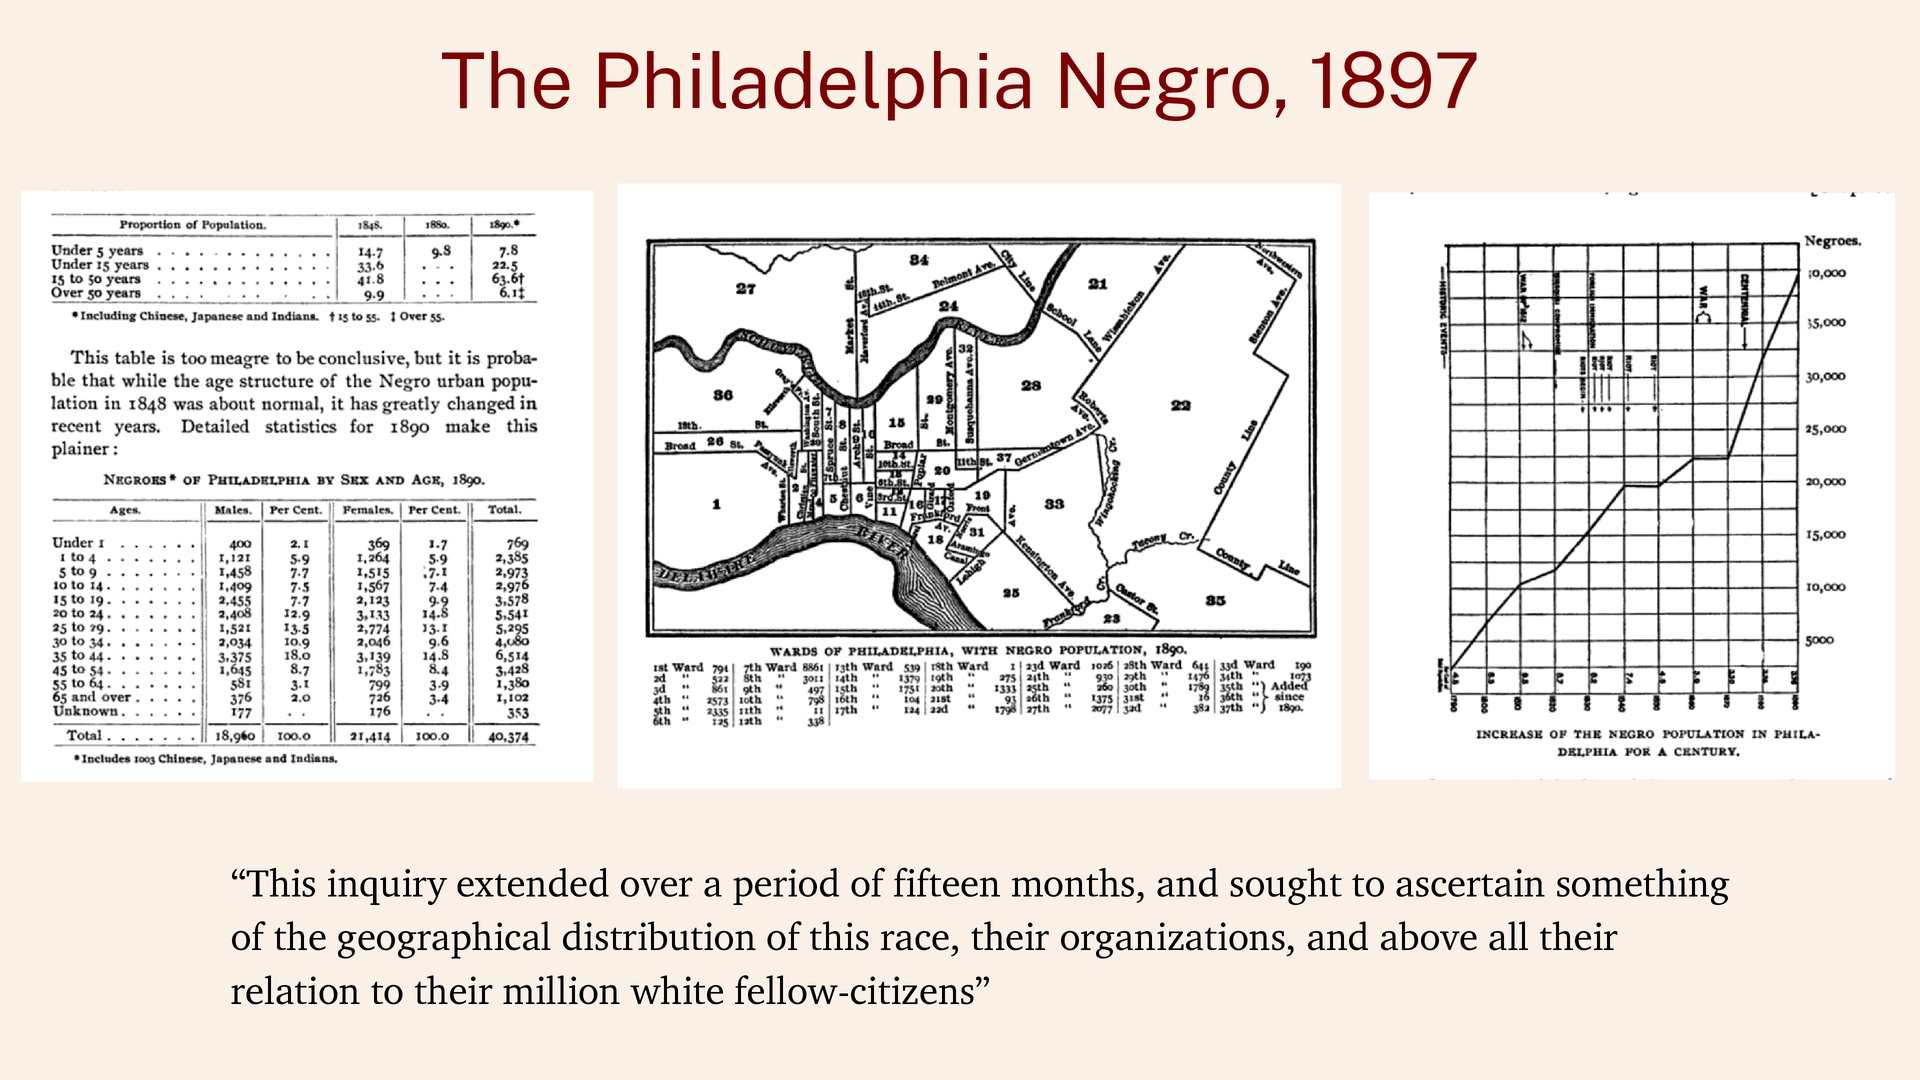
of fifteen months, and sought to ascertain something of the geographical distribution of this race, their organizations, and above all their relation to their million white fellow-citizens”
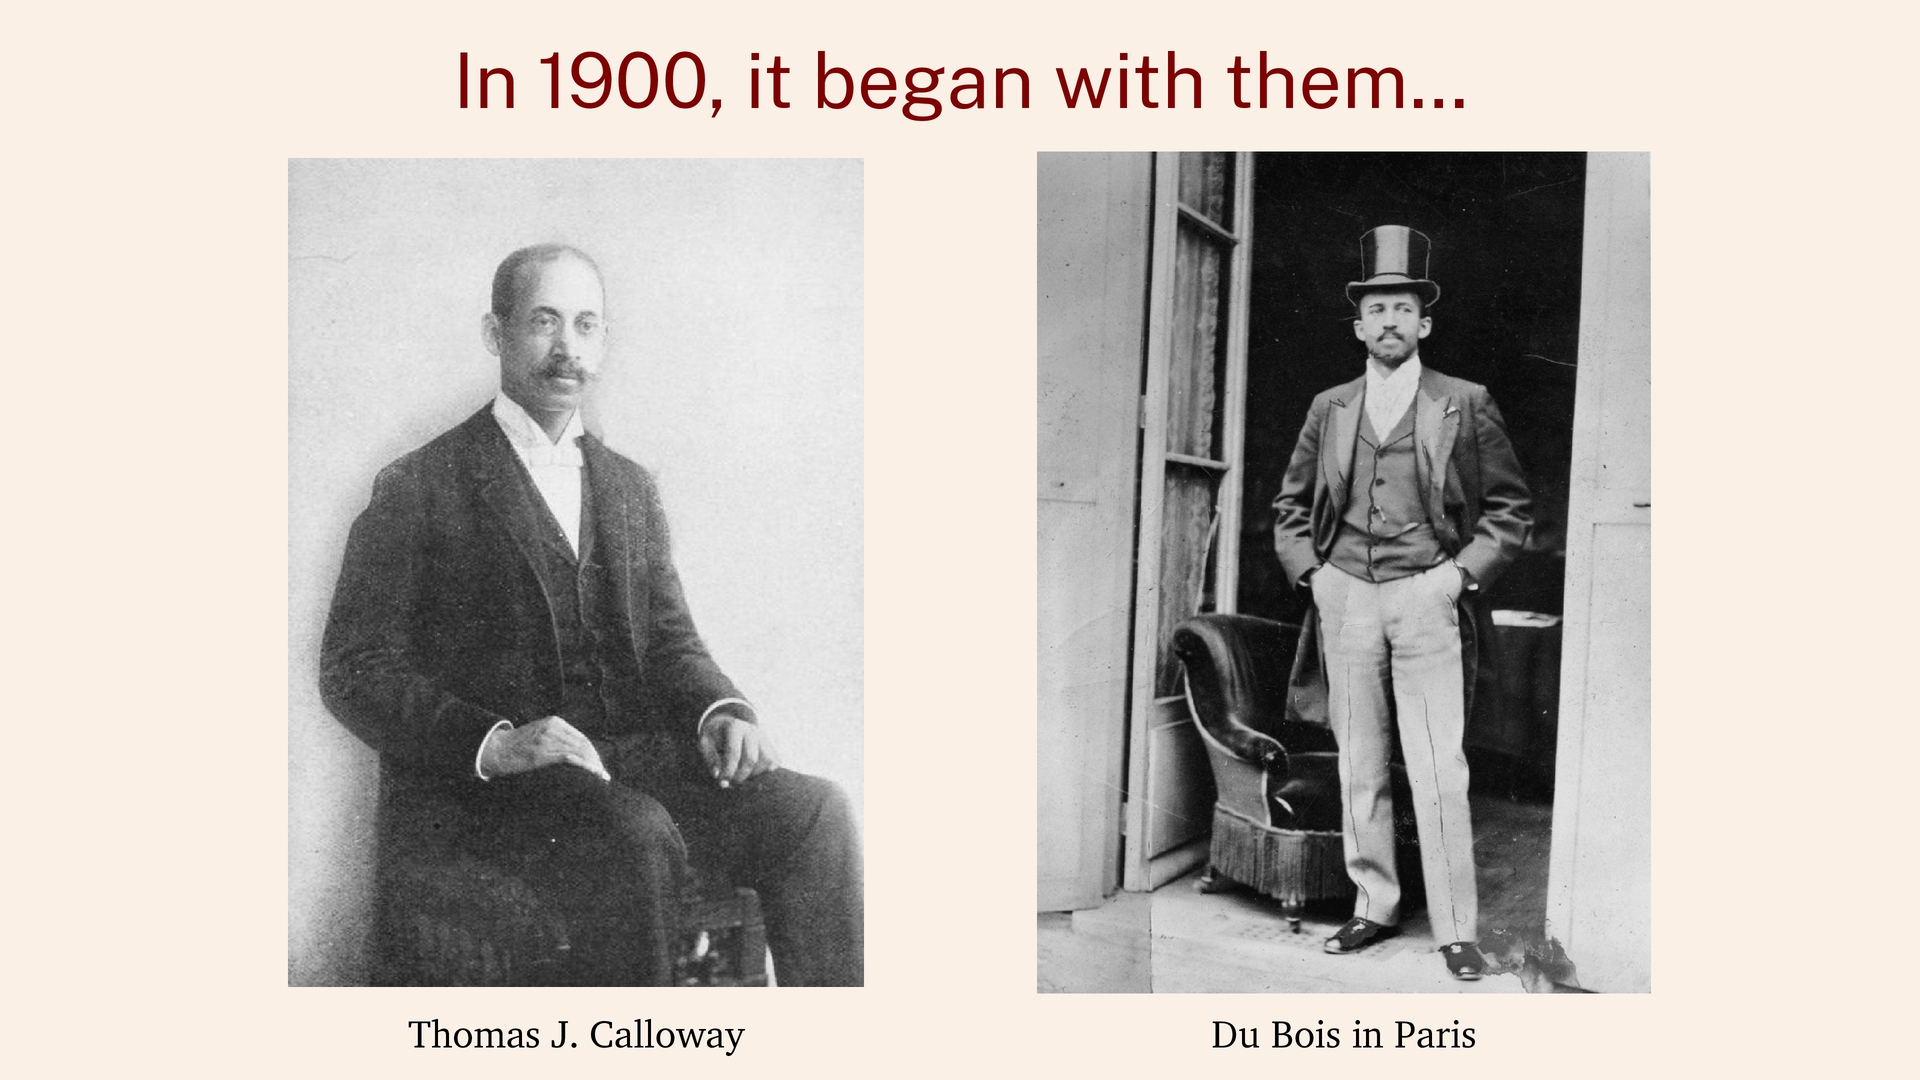
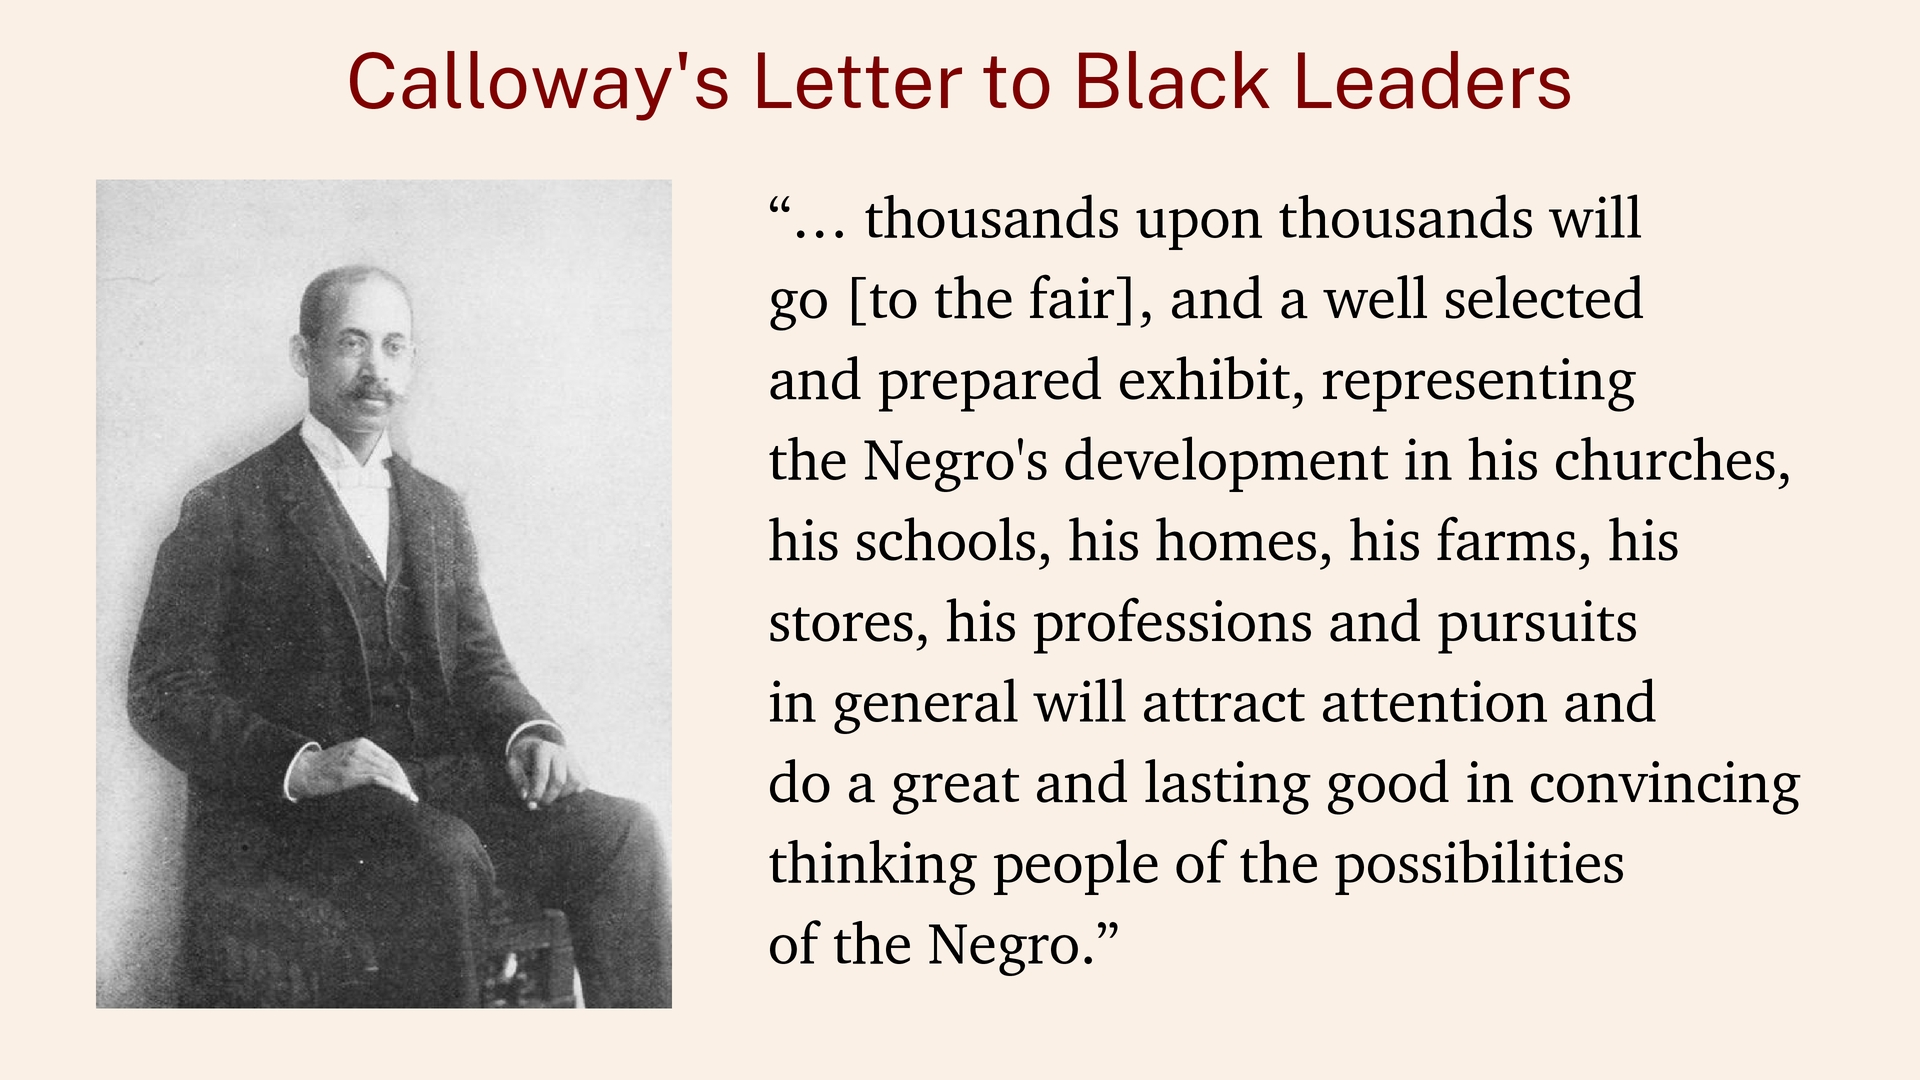
go [to the fair], and a well selected and prepared exhibit, representing the Negro's development in his churches, his schools, his homes, his farms, his stores, his professions and pursuits in general will attract attention and do a great and lasting good in convincing thinking people of the possibilities of the Negro.”
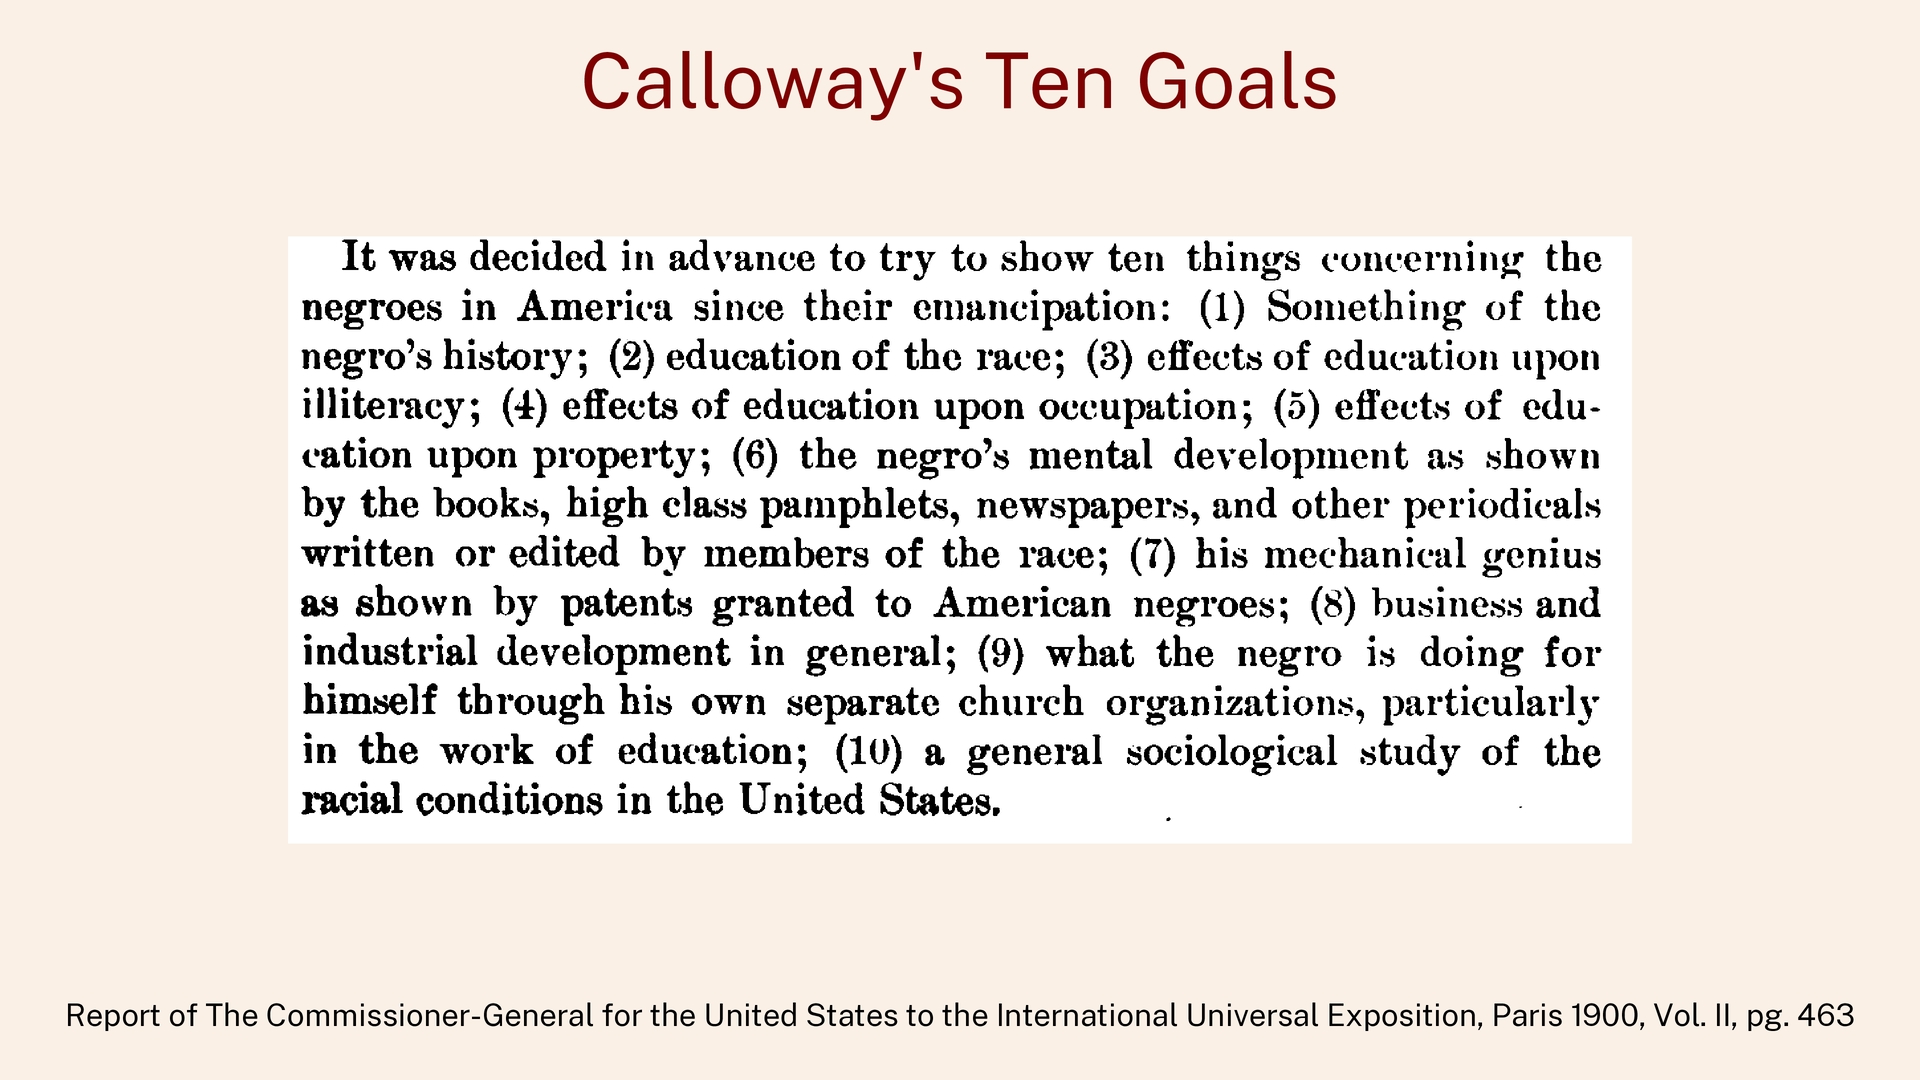
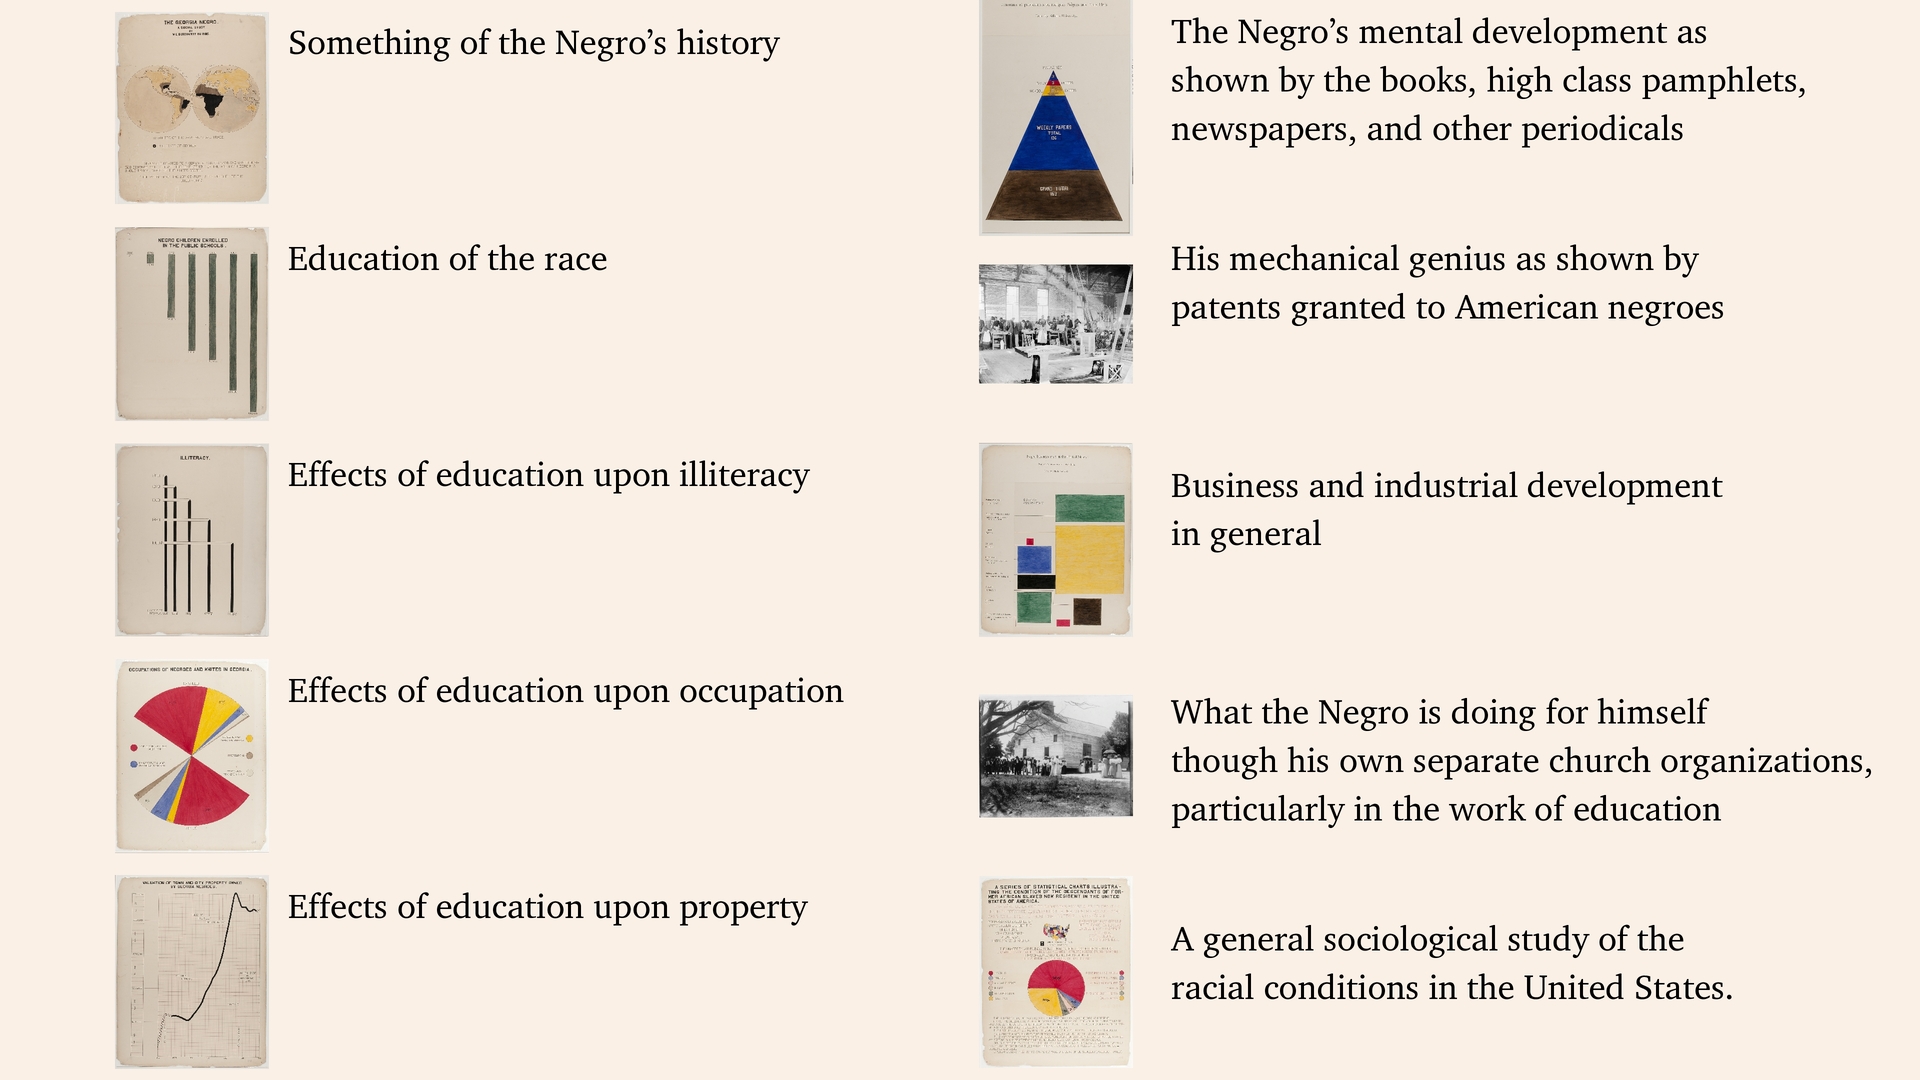
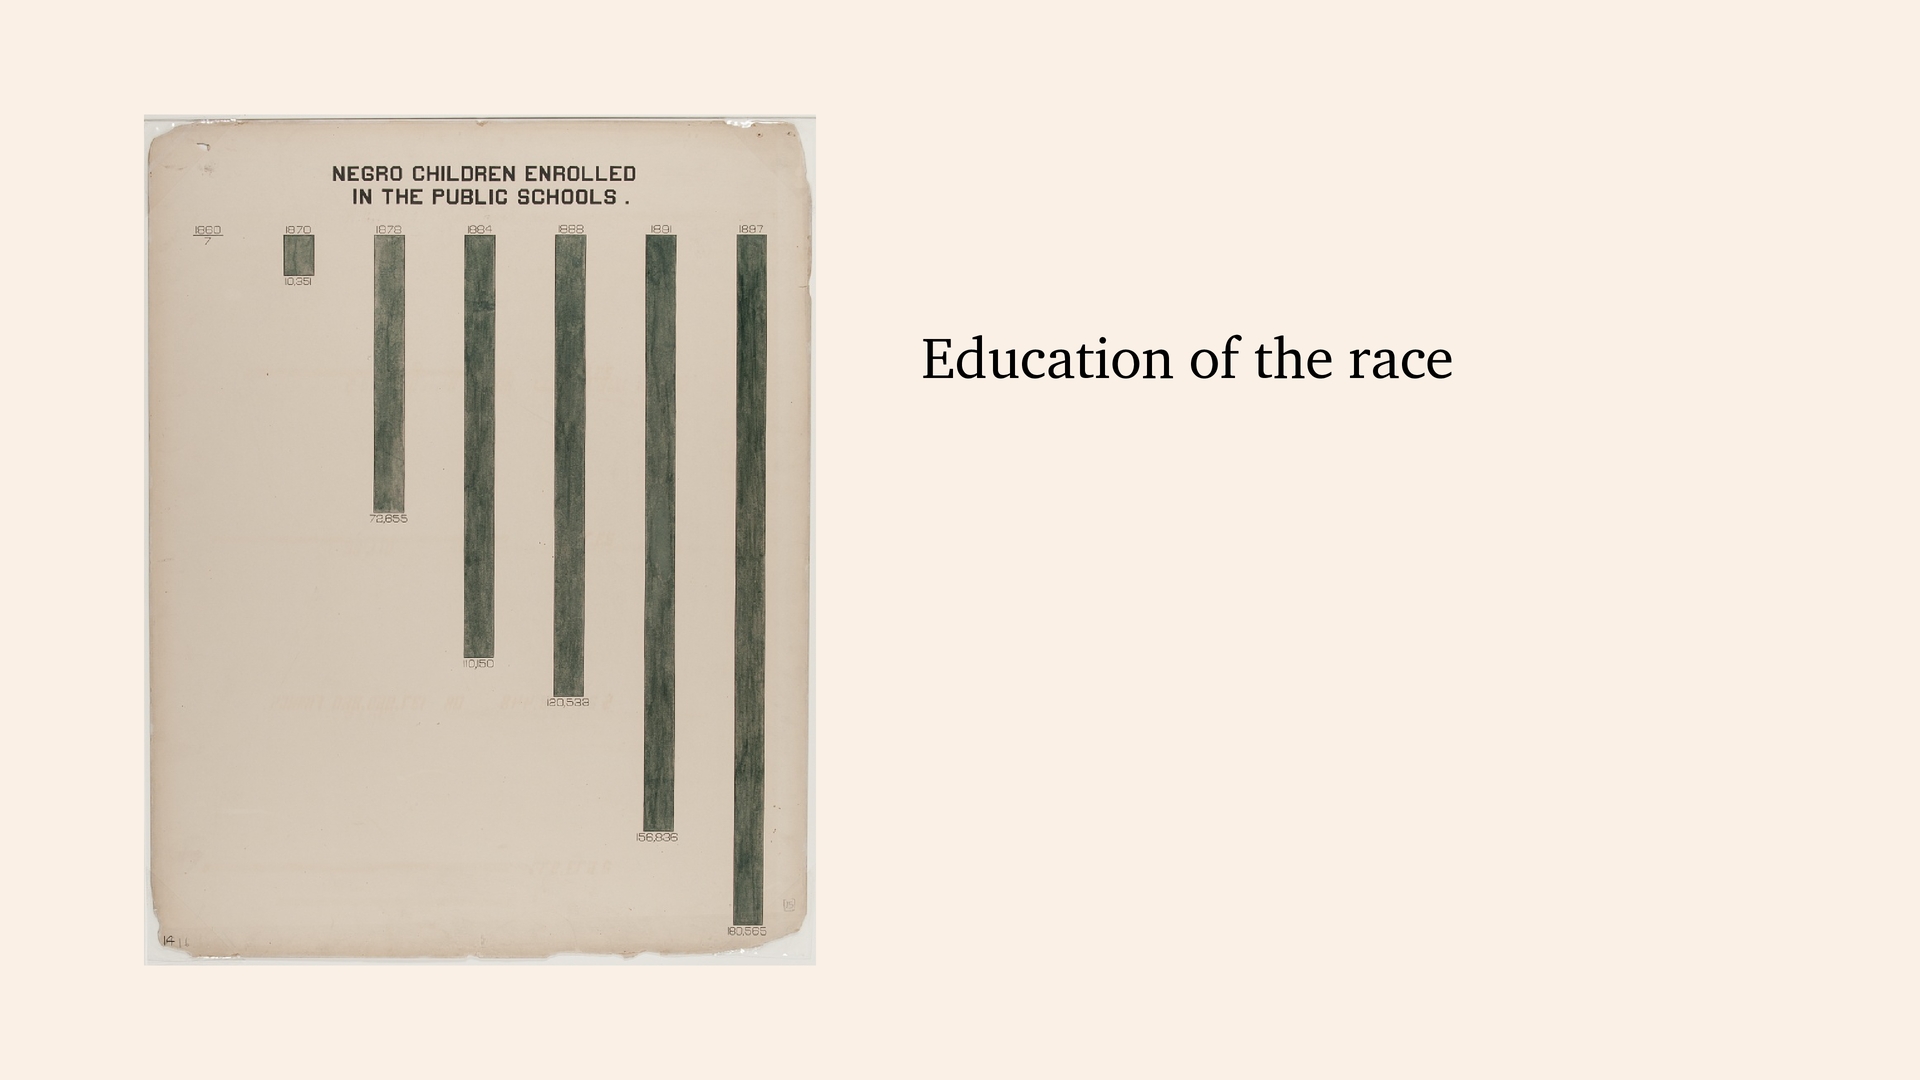
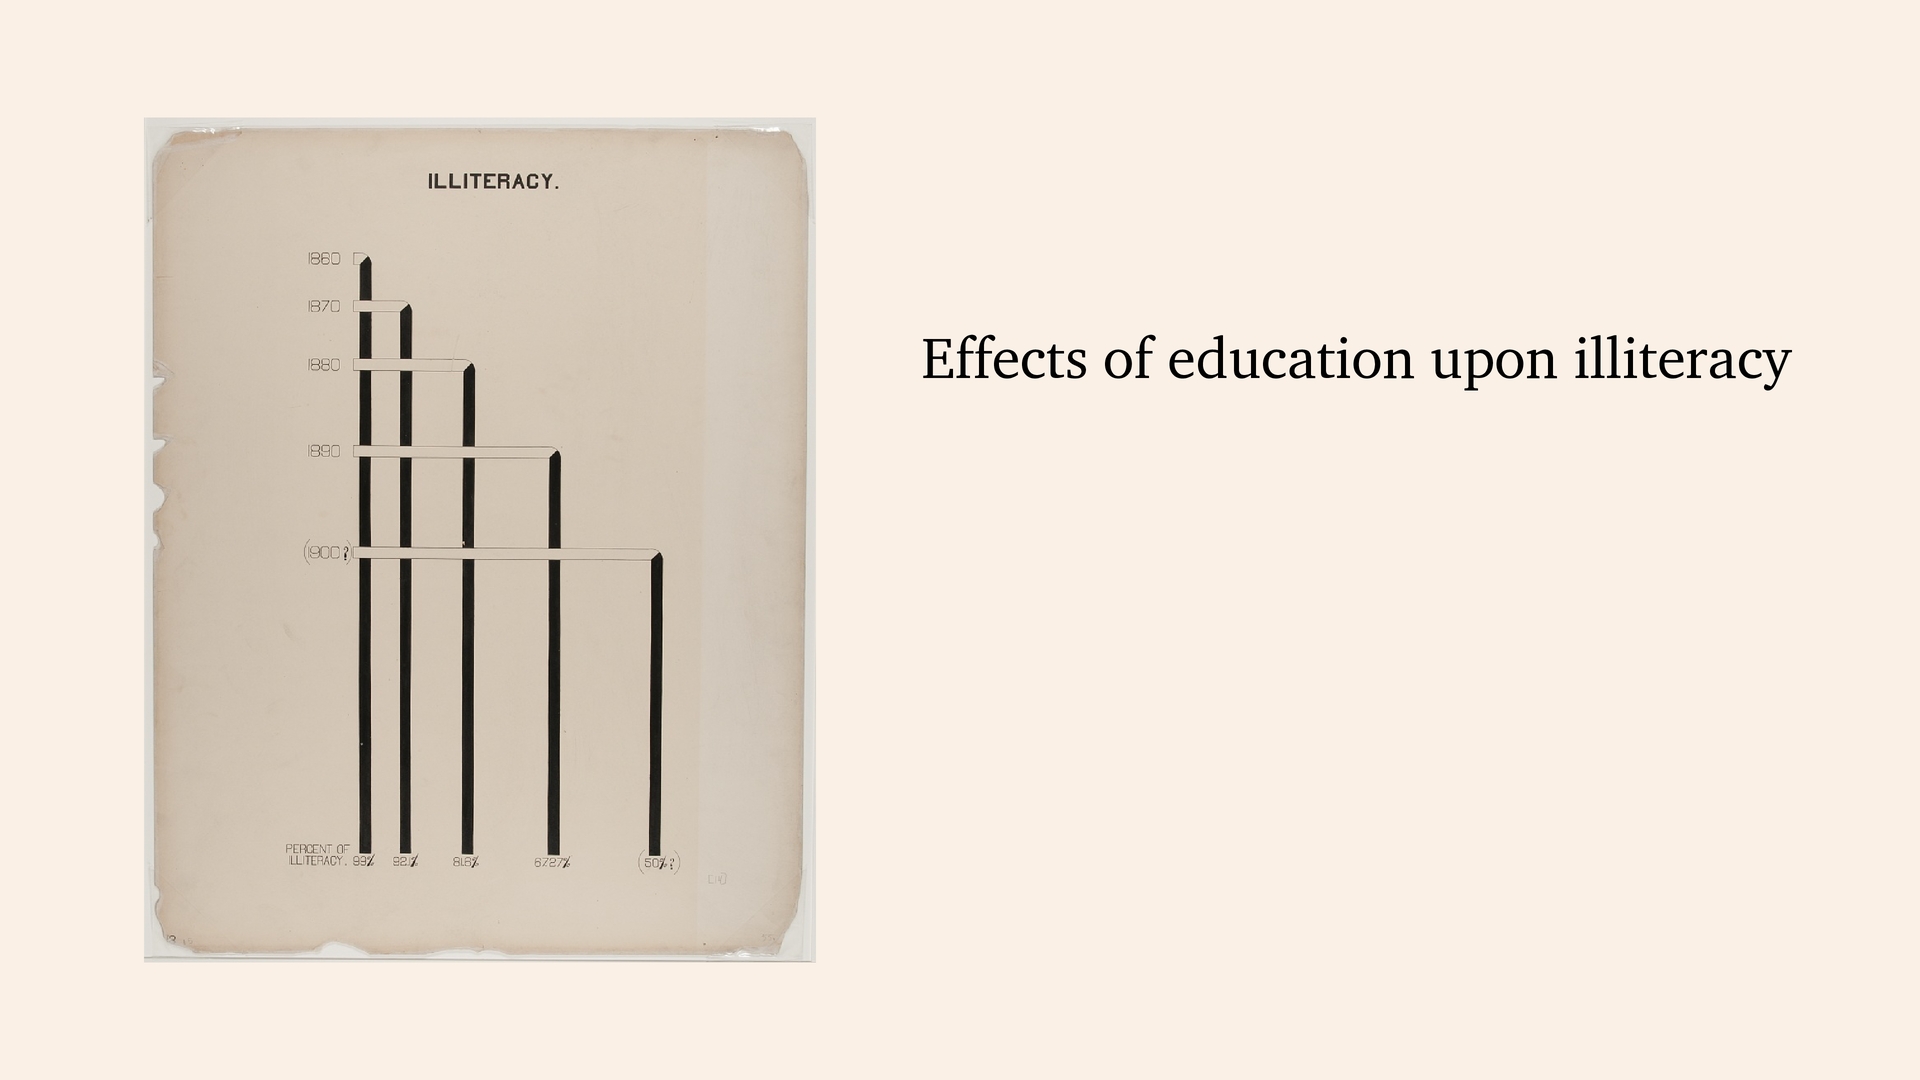
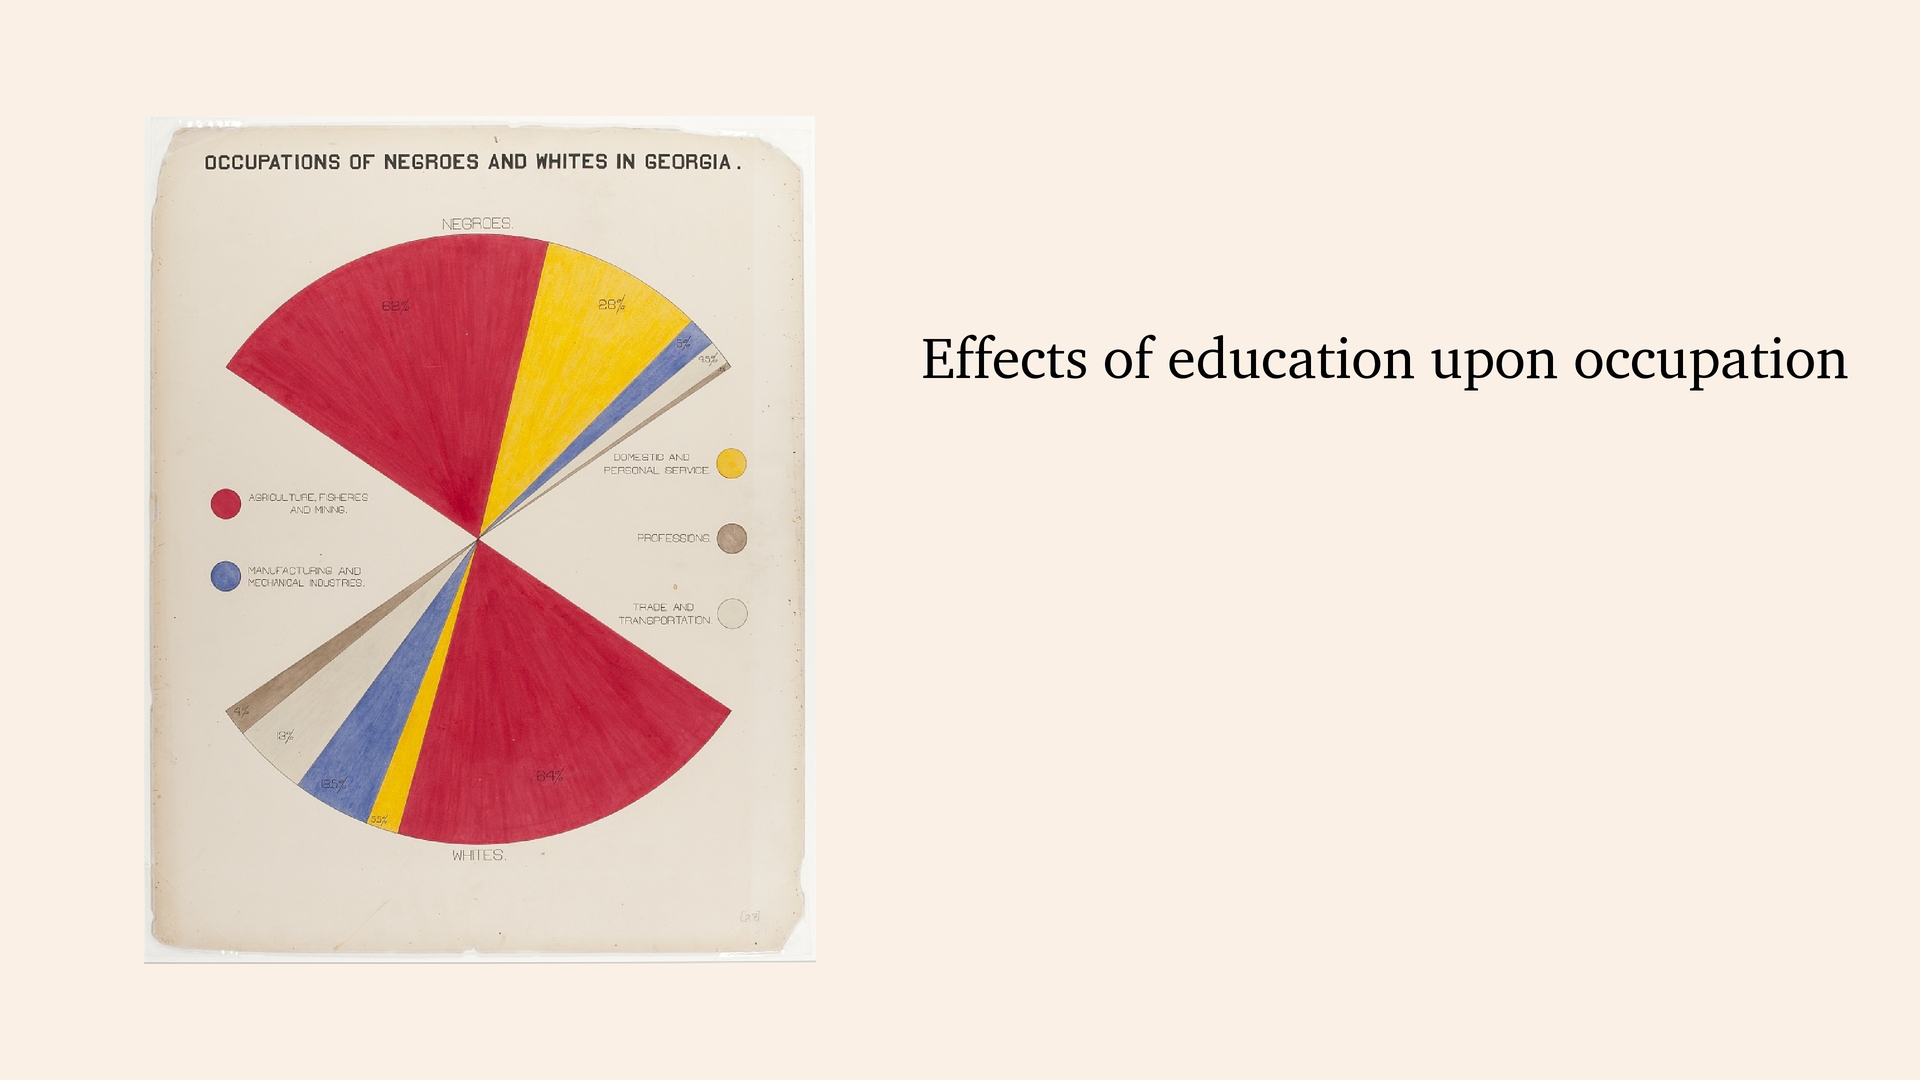
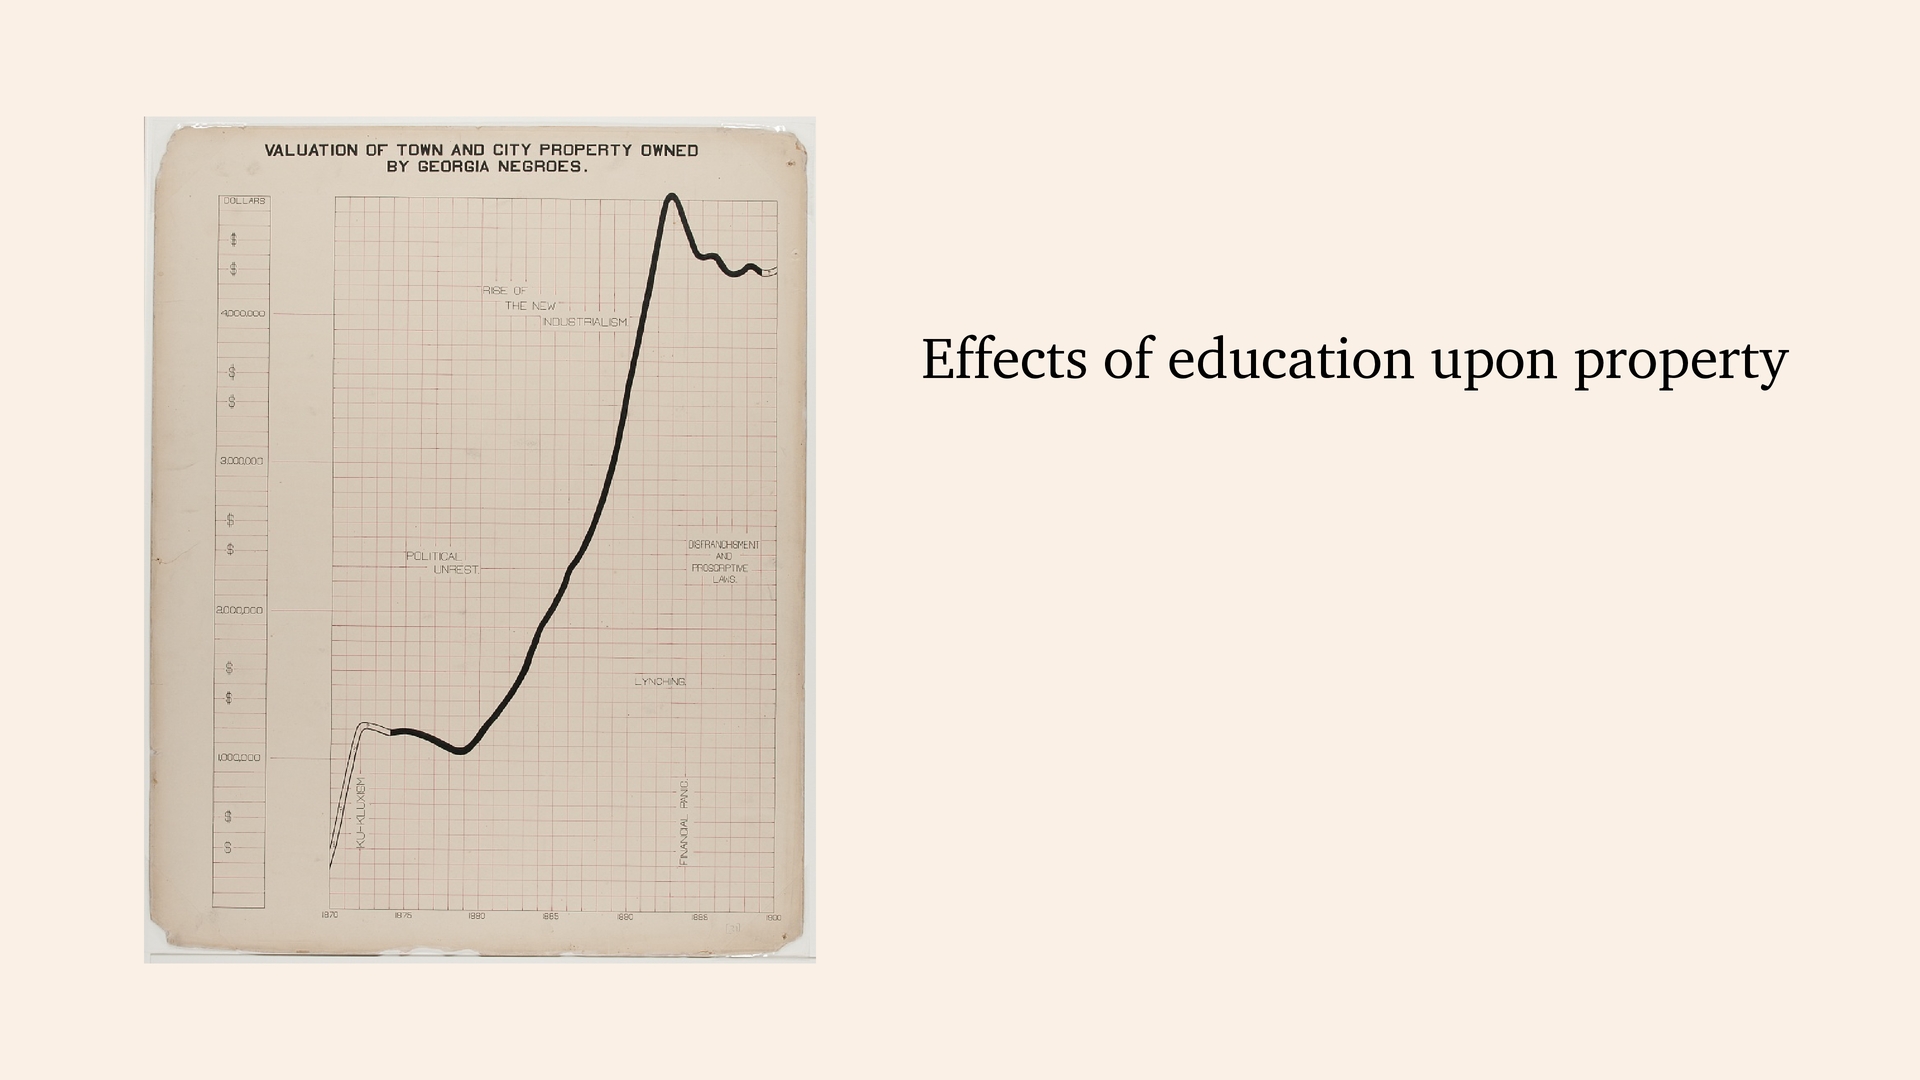
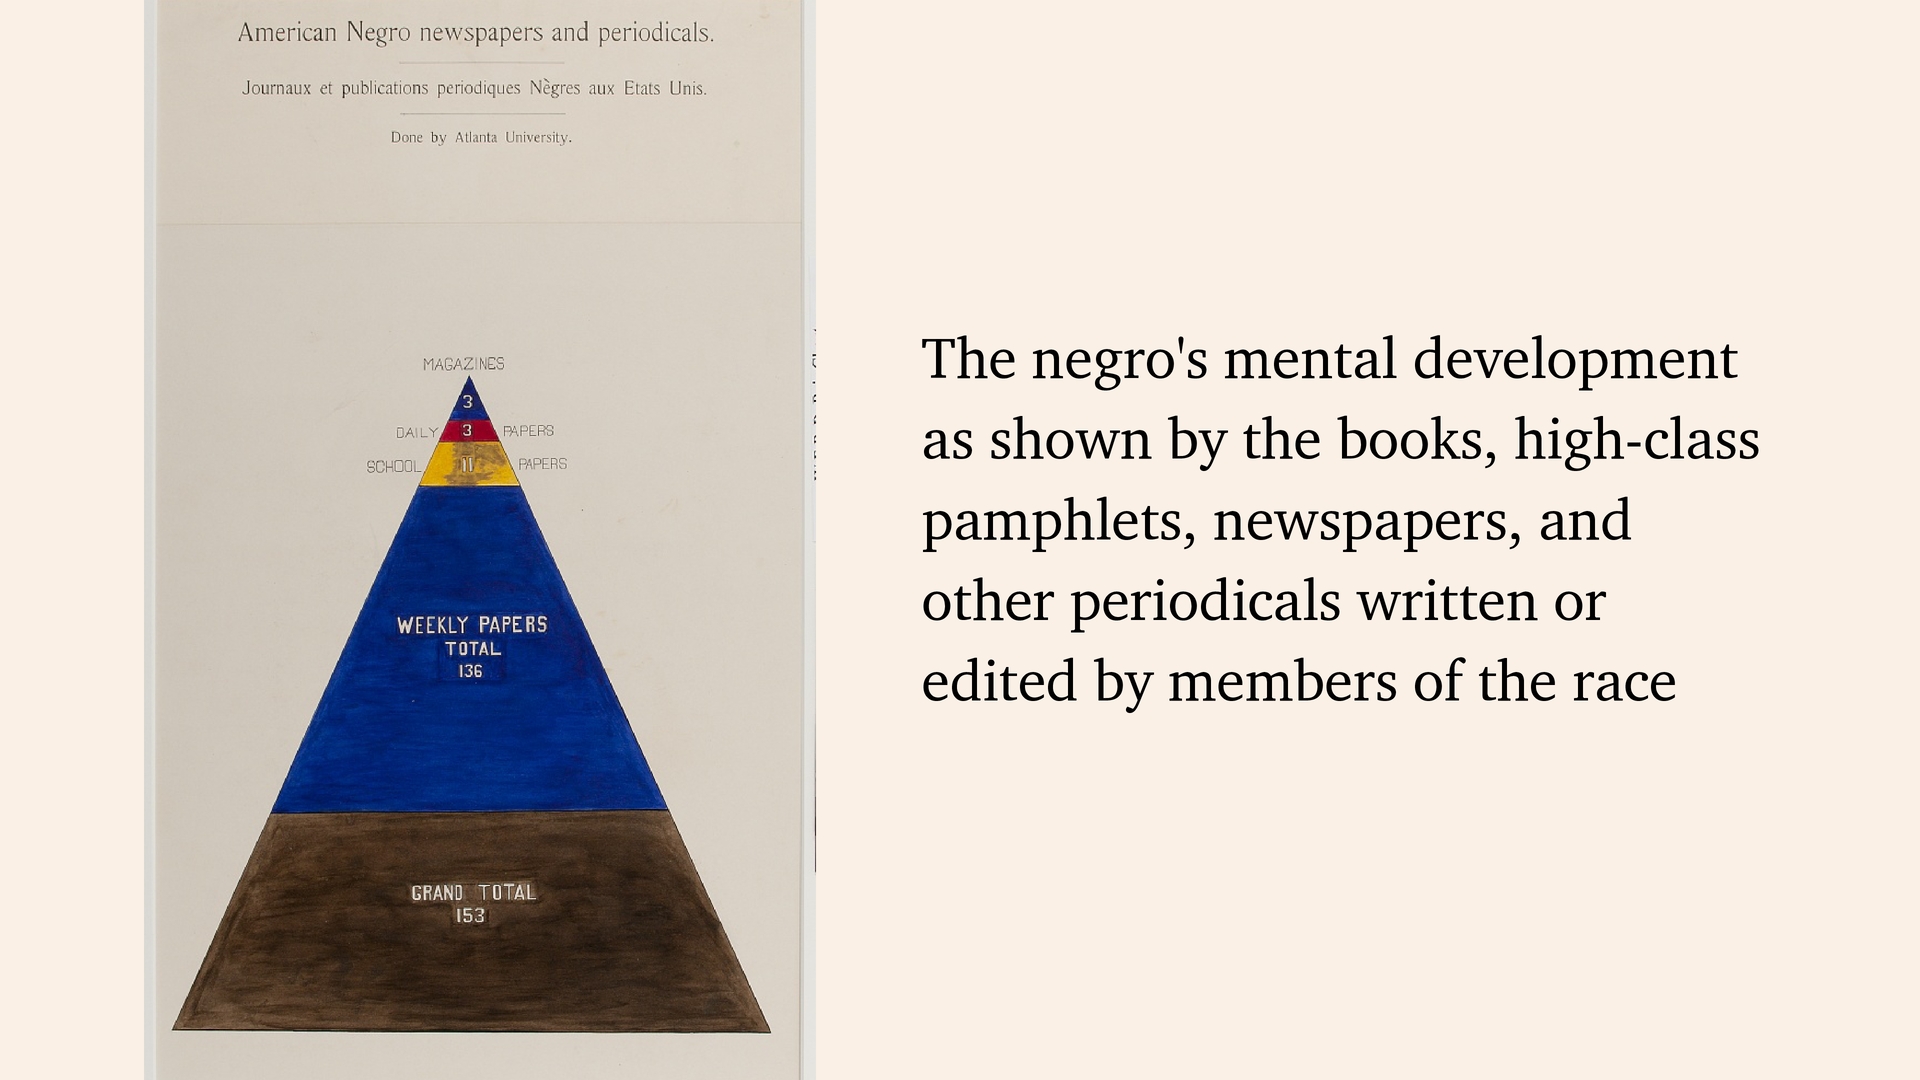
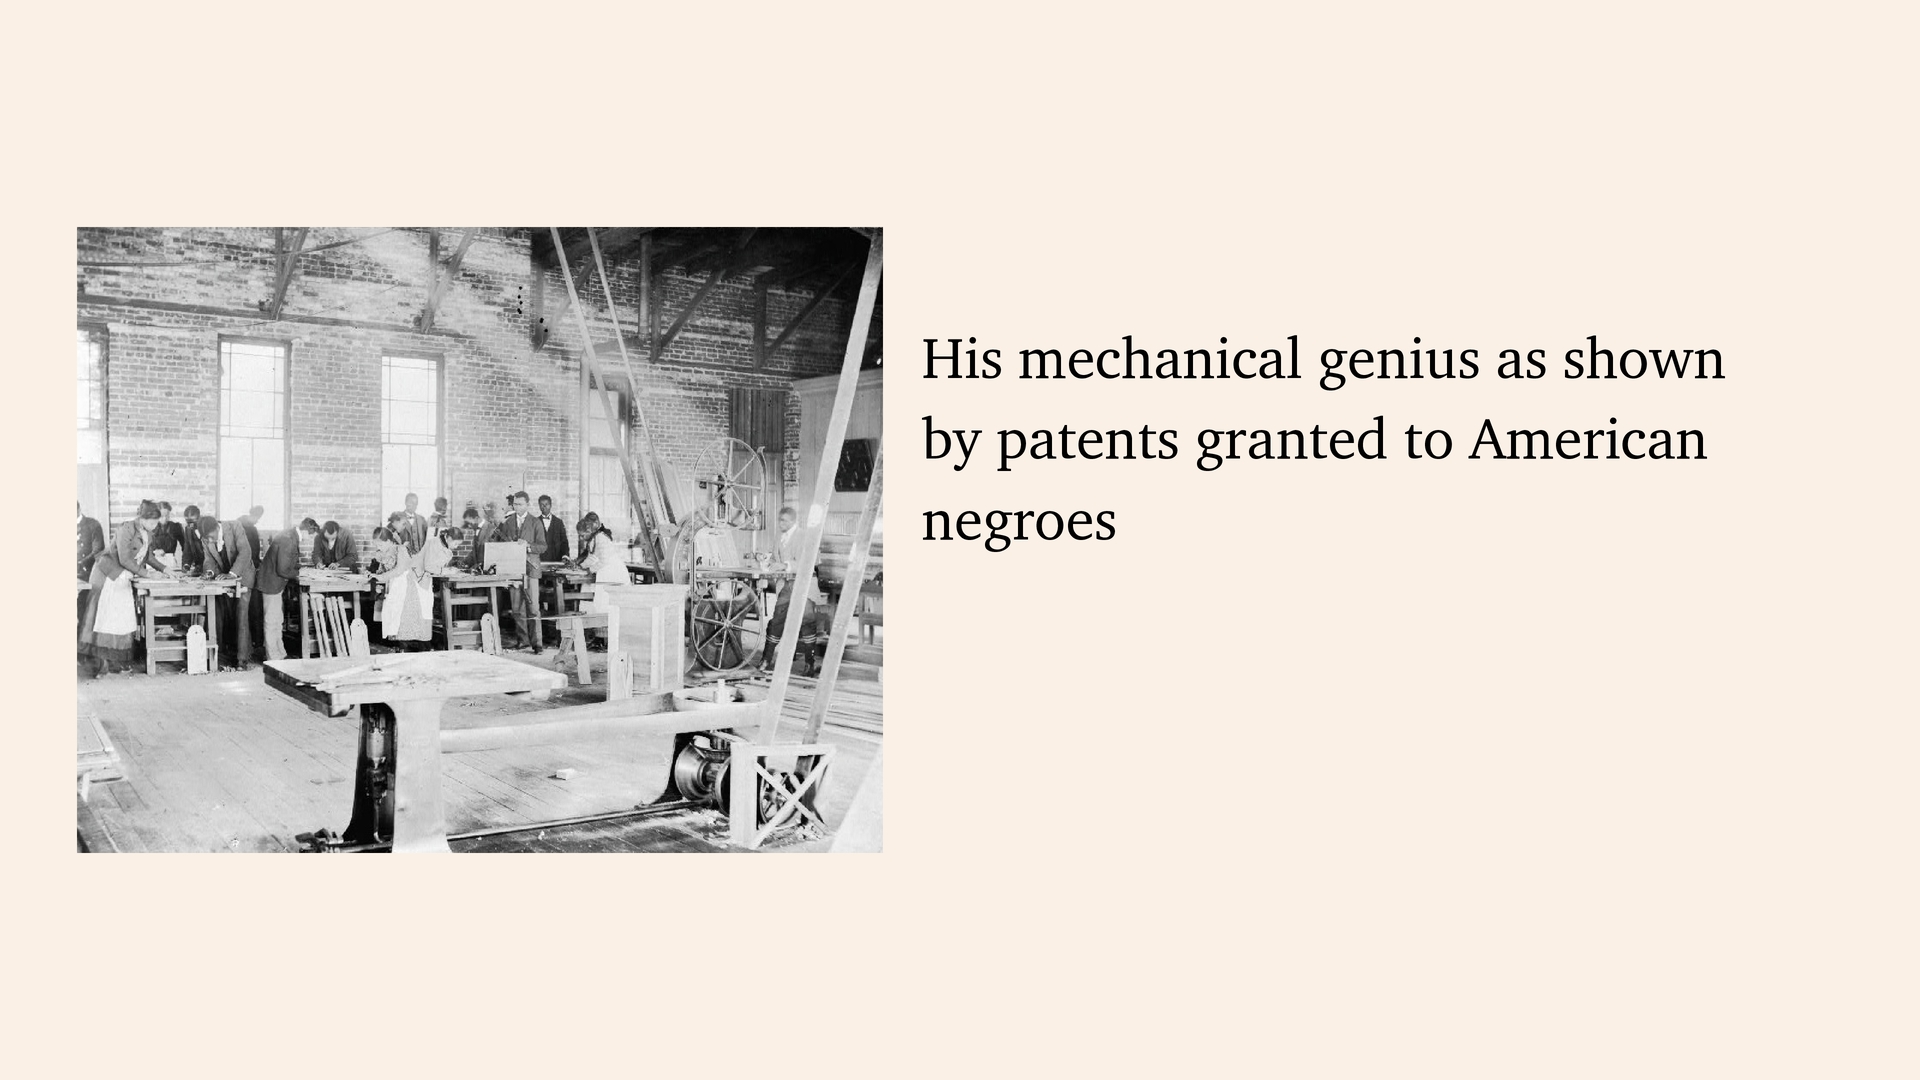
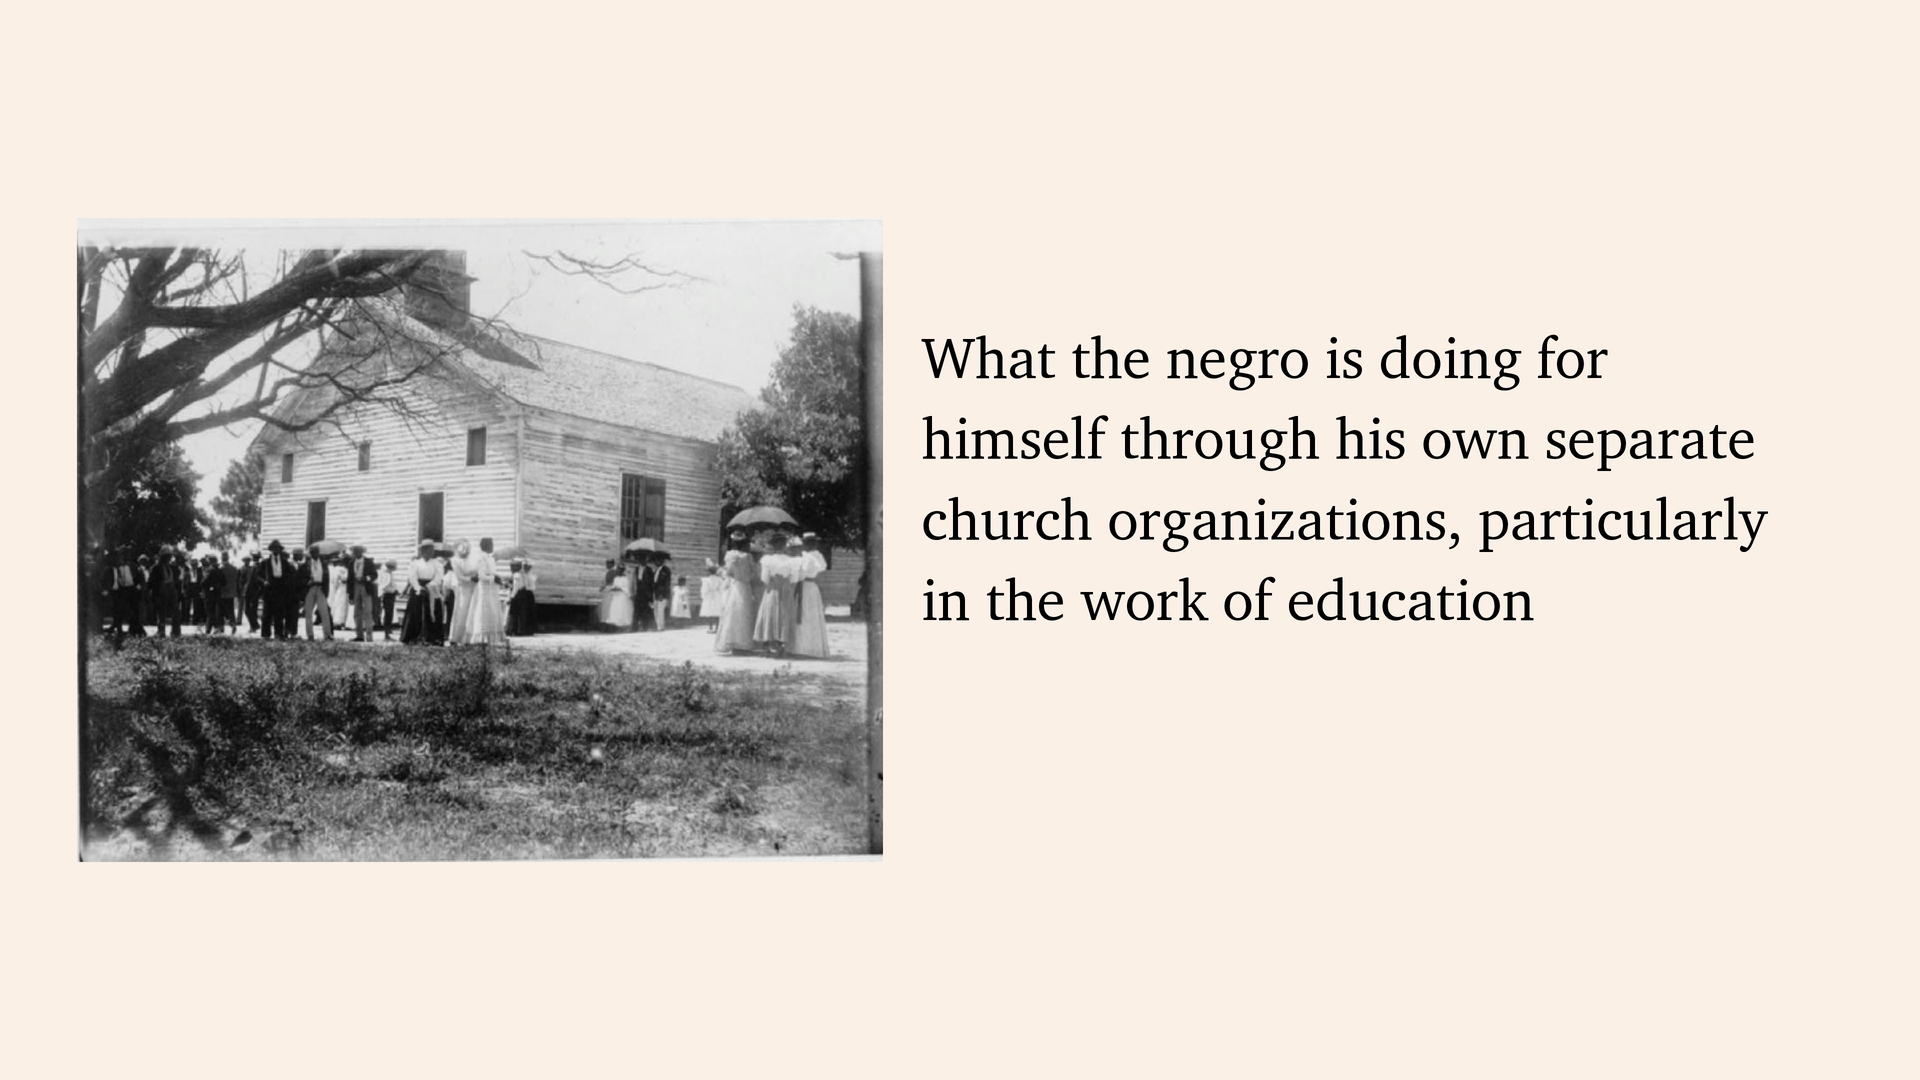
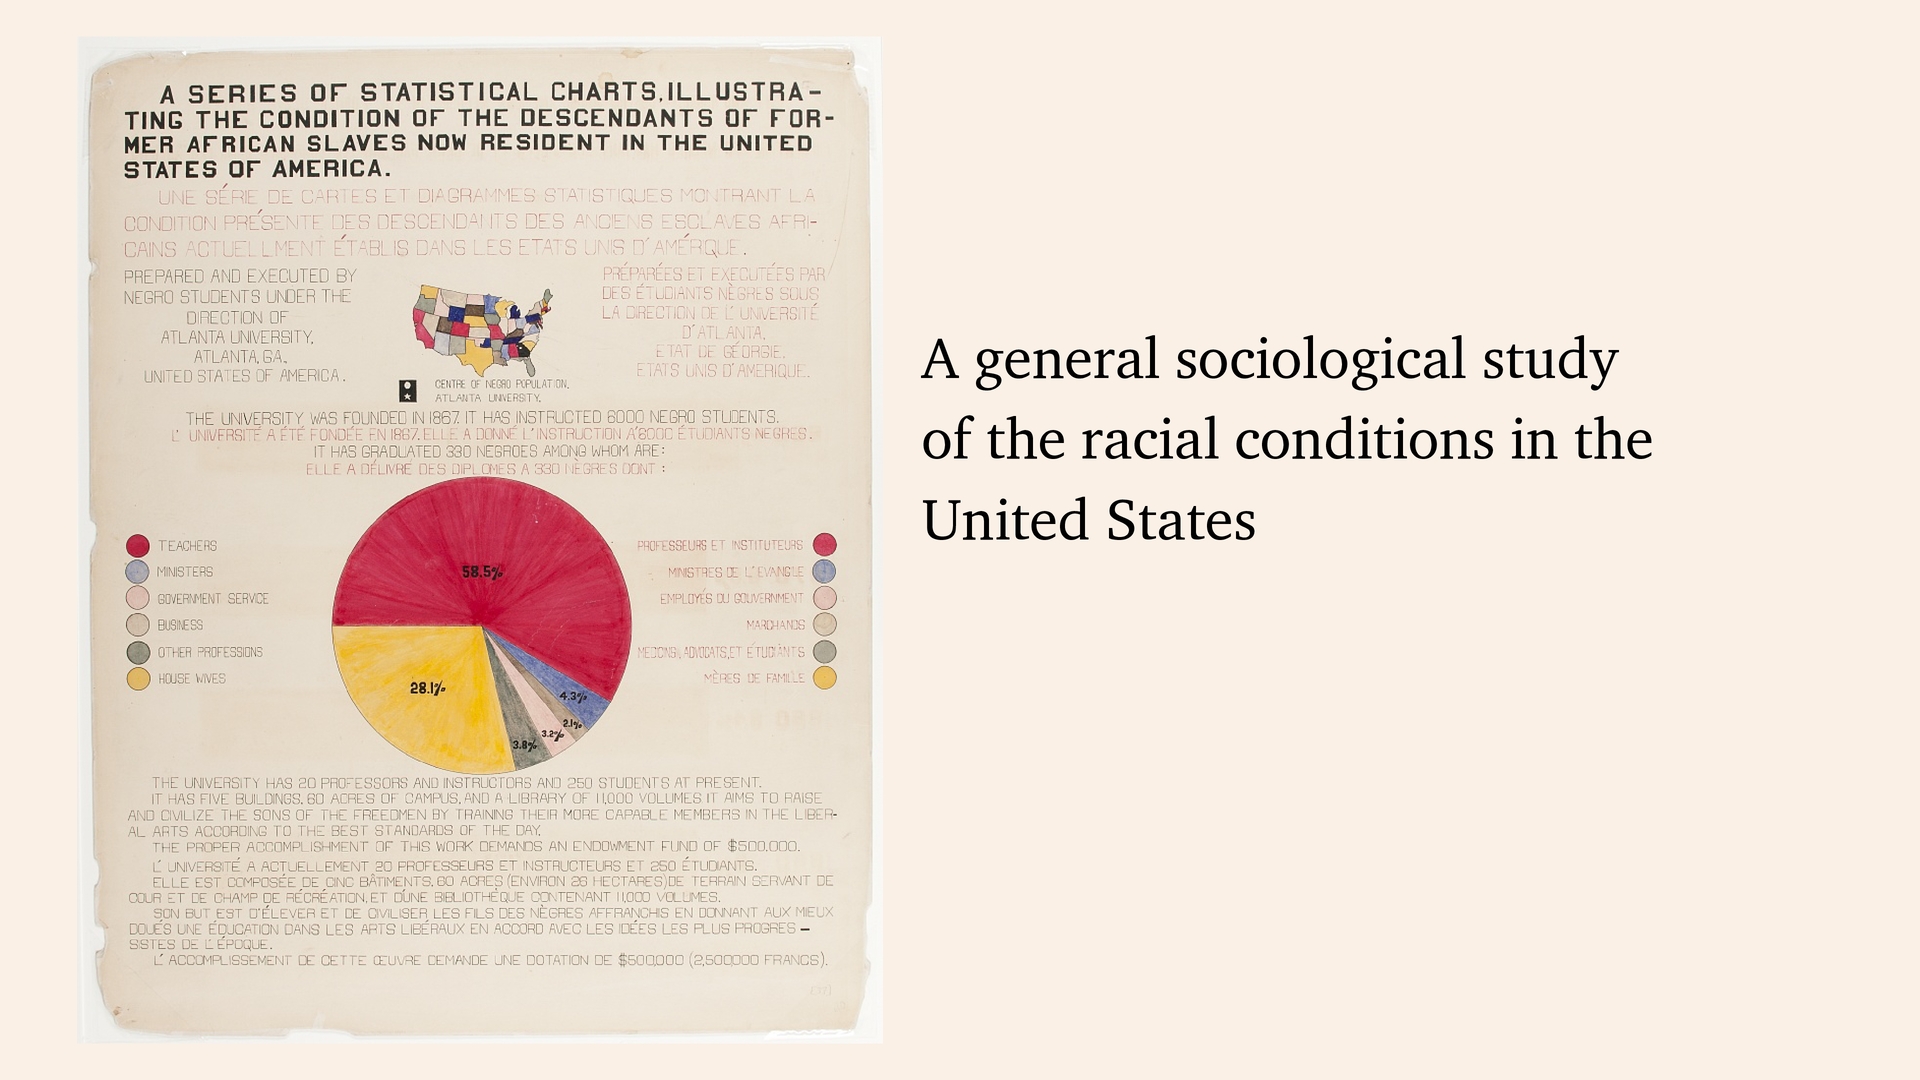
of education upon illiteracy Effects of education upon occupation Effects of education upon property The Negro’s mental development as shown by the books, high class pamphlets, newspapers, and other periodicals His mechanical genius as shown by patents granted to American negroes Business and industrial development in general What the Negro is doing for himself though his own separate church organizations, particularly in the work of education A general sociological study of the racial conditions in the United States.
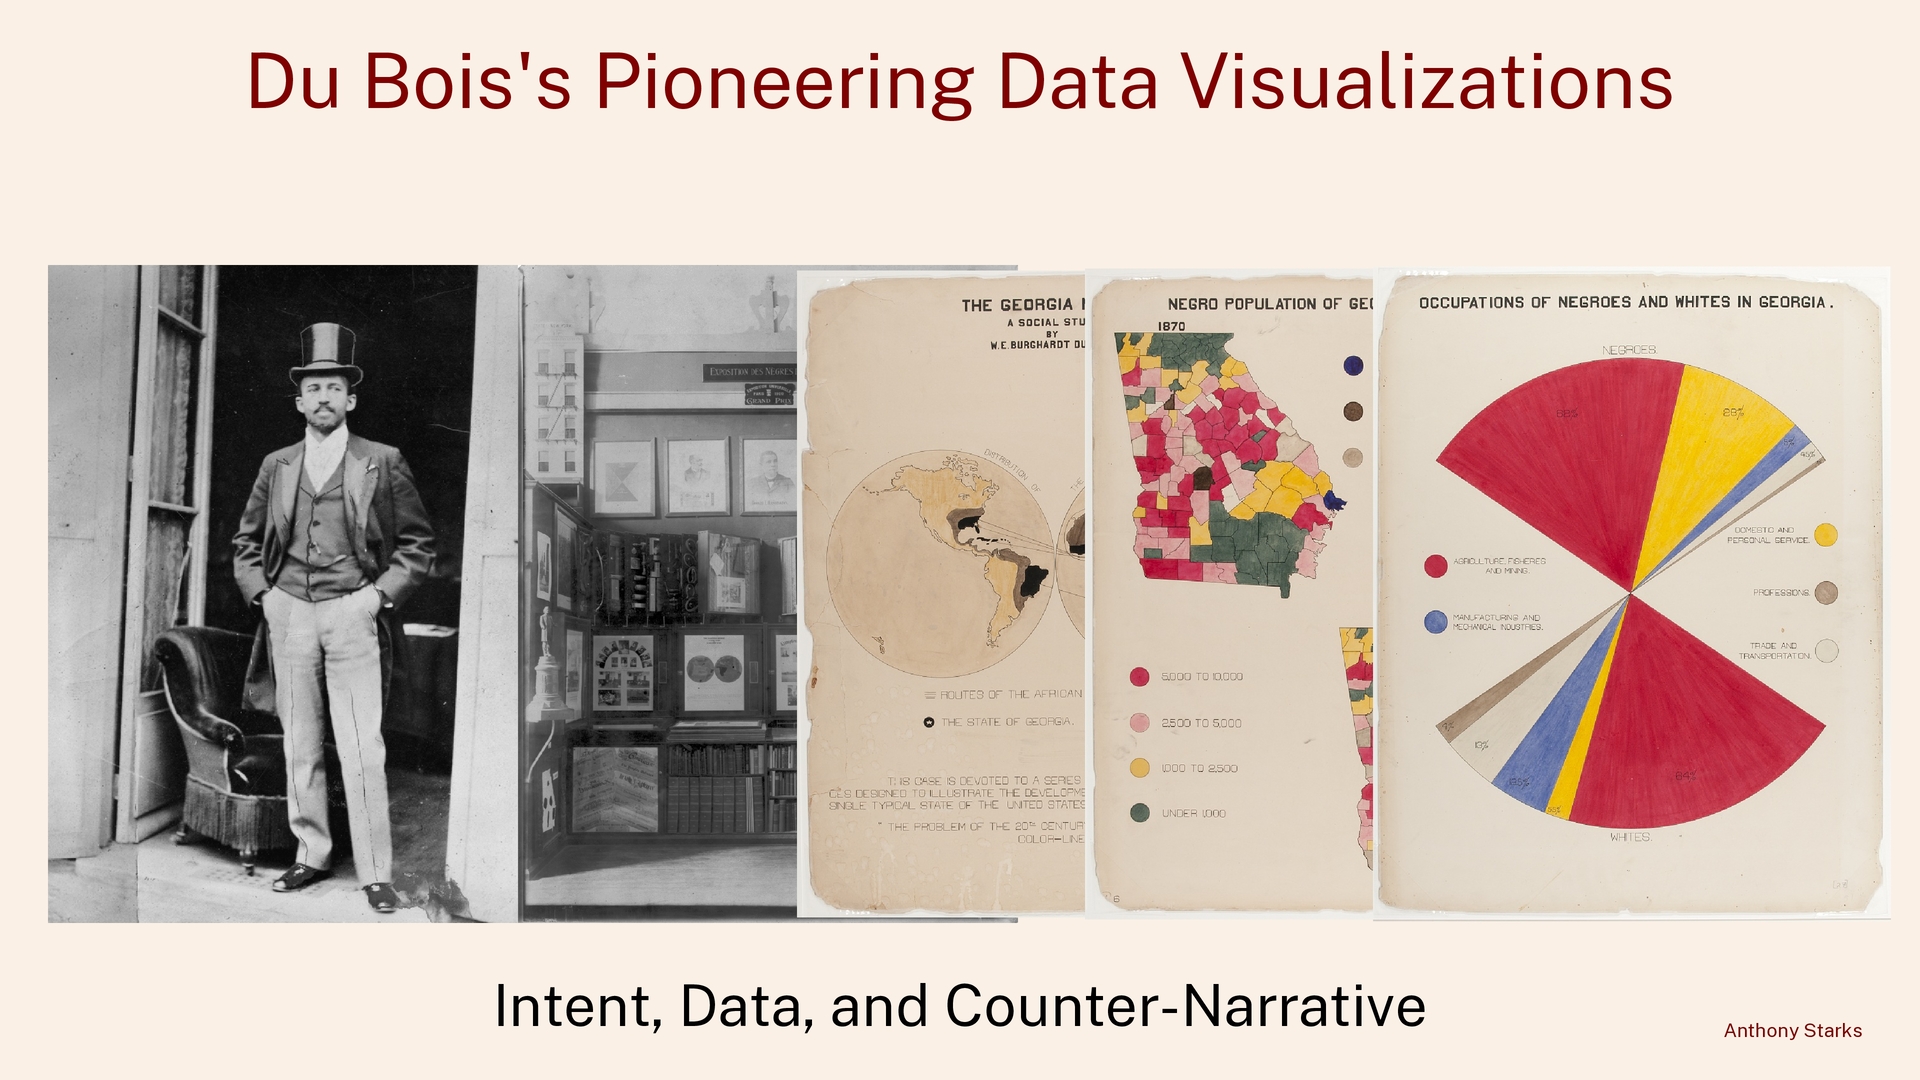
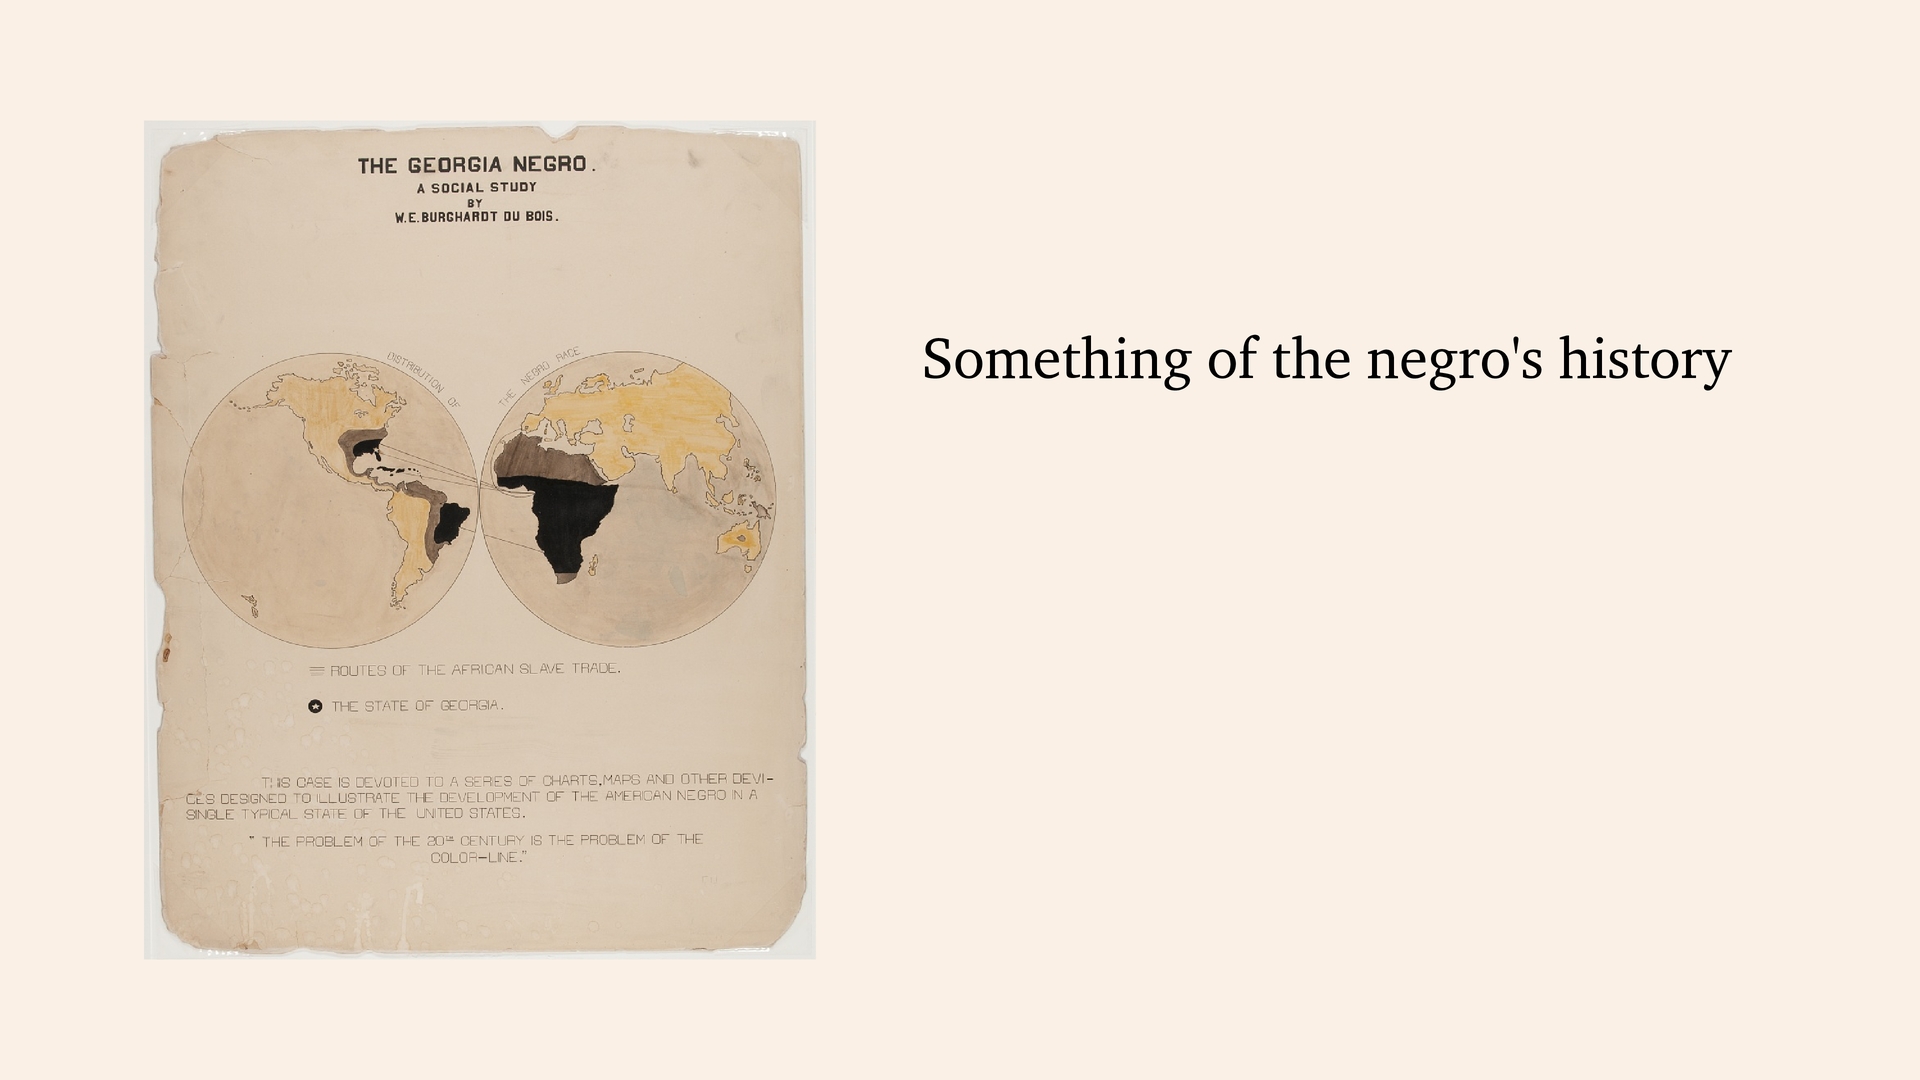
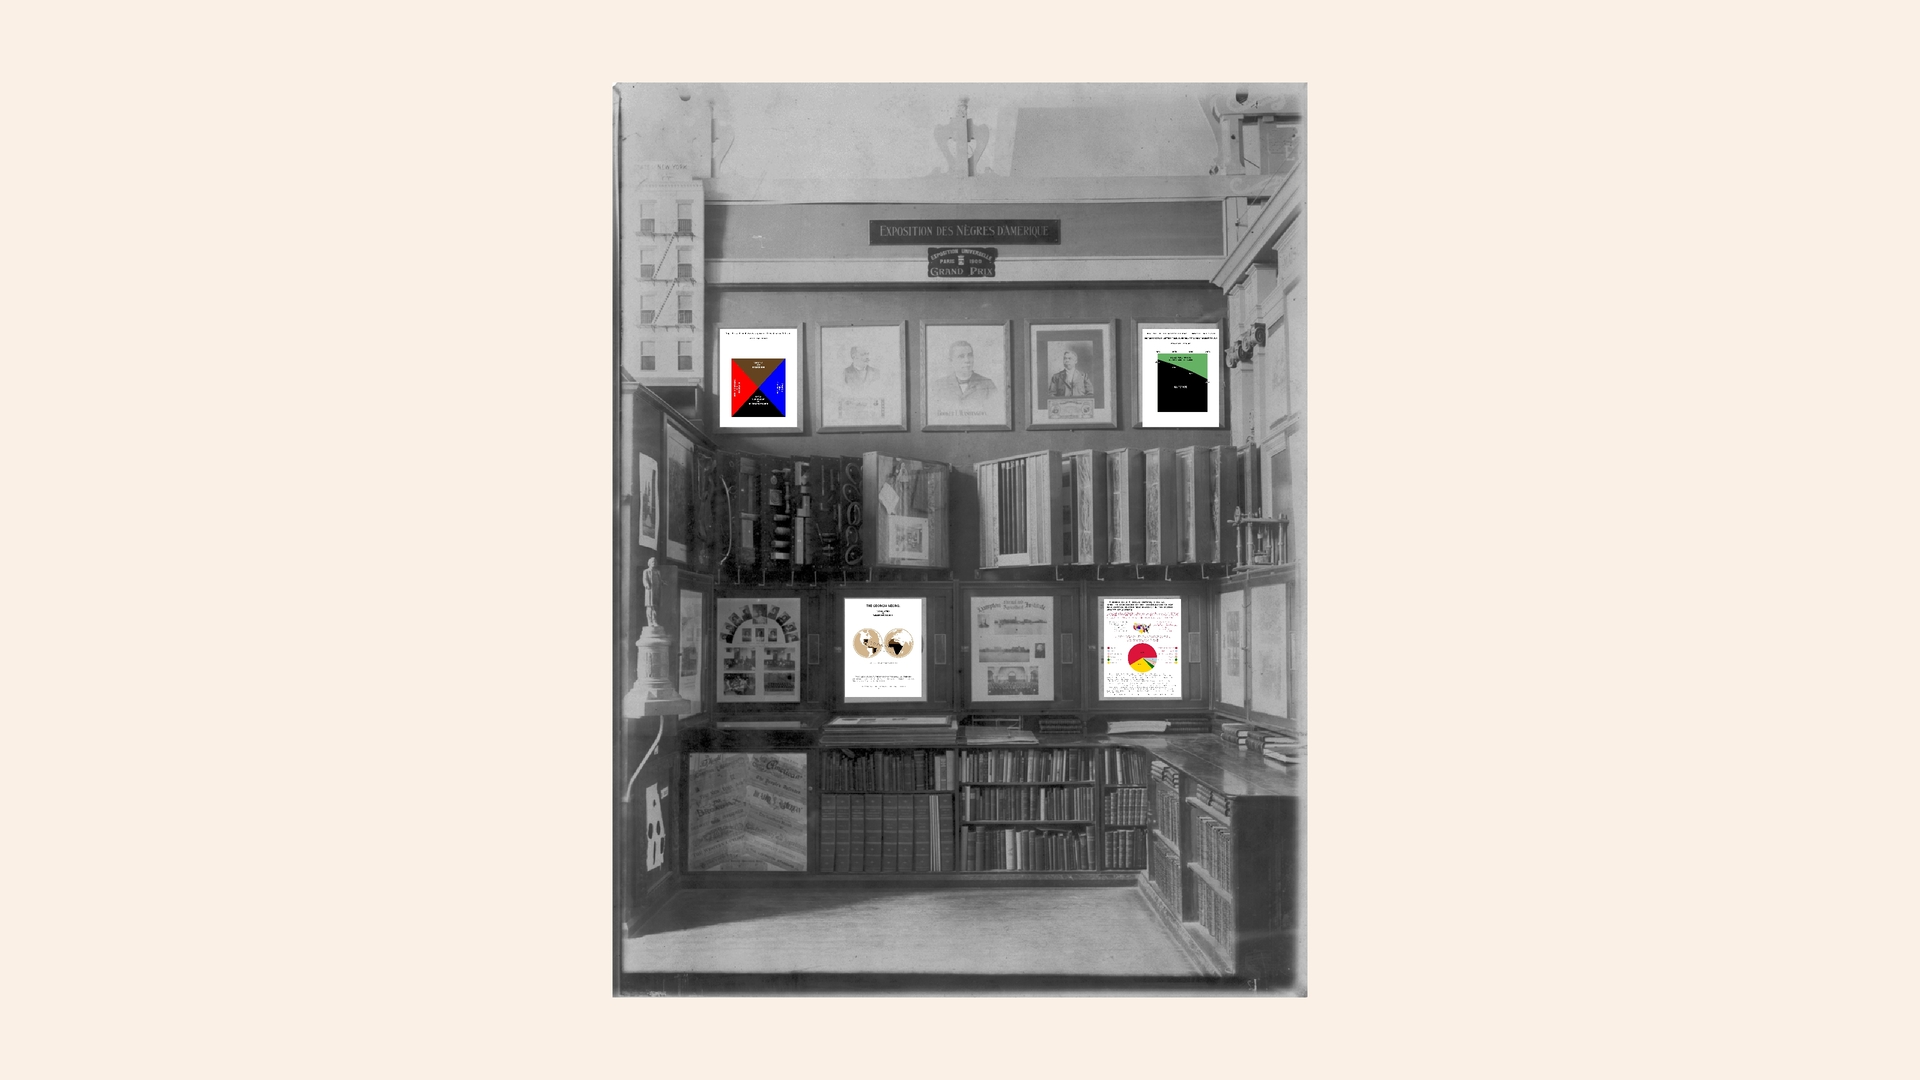
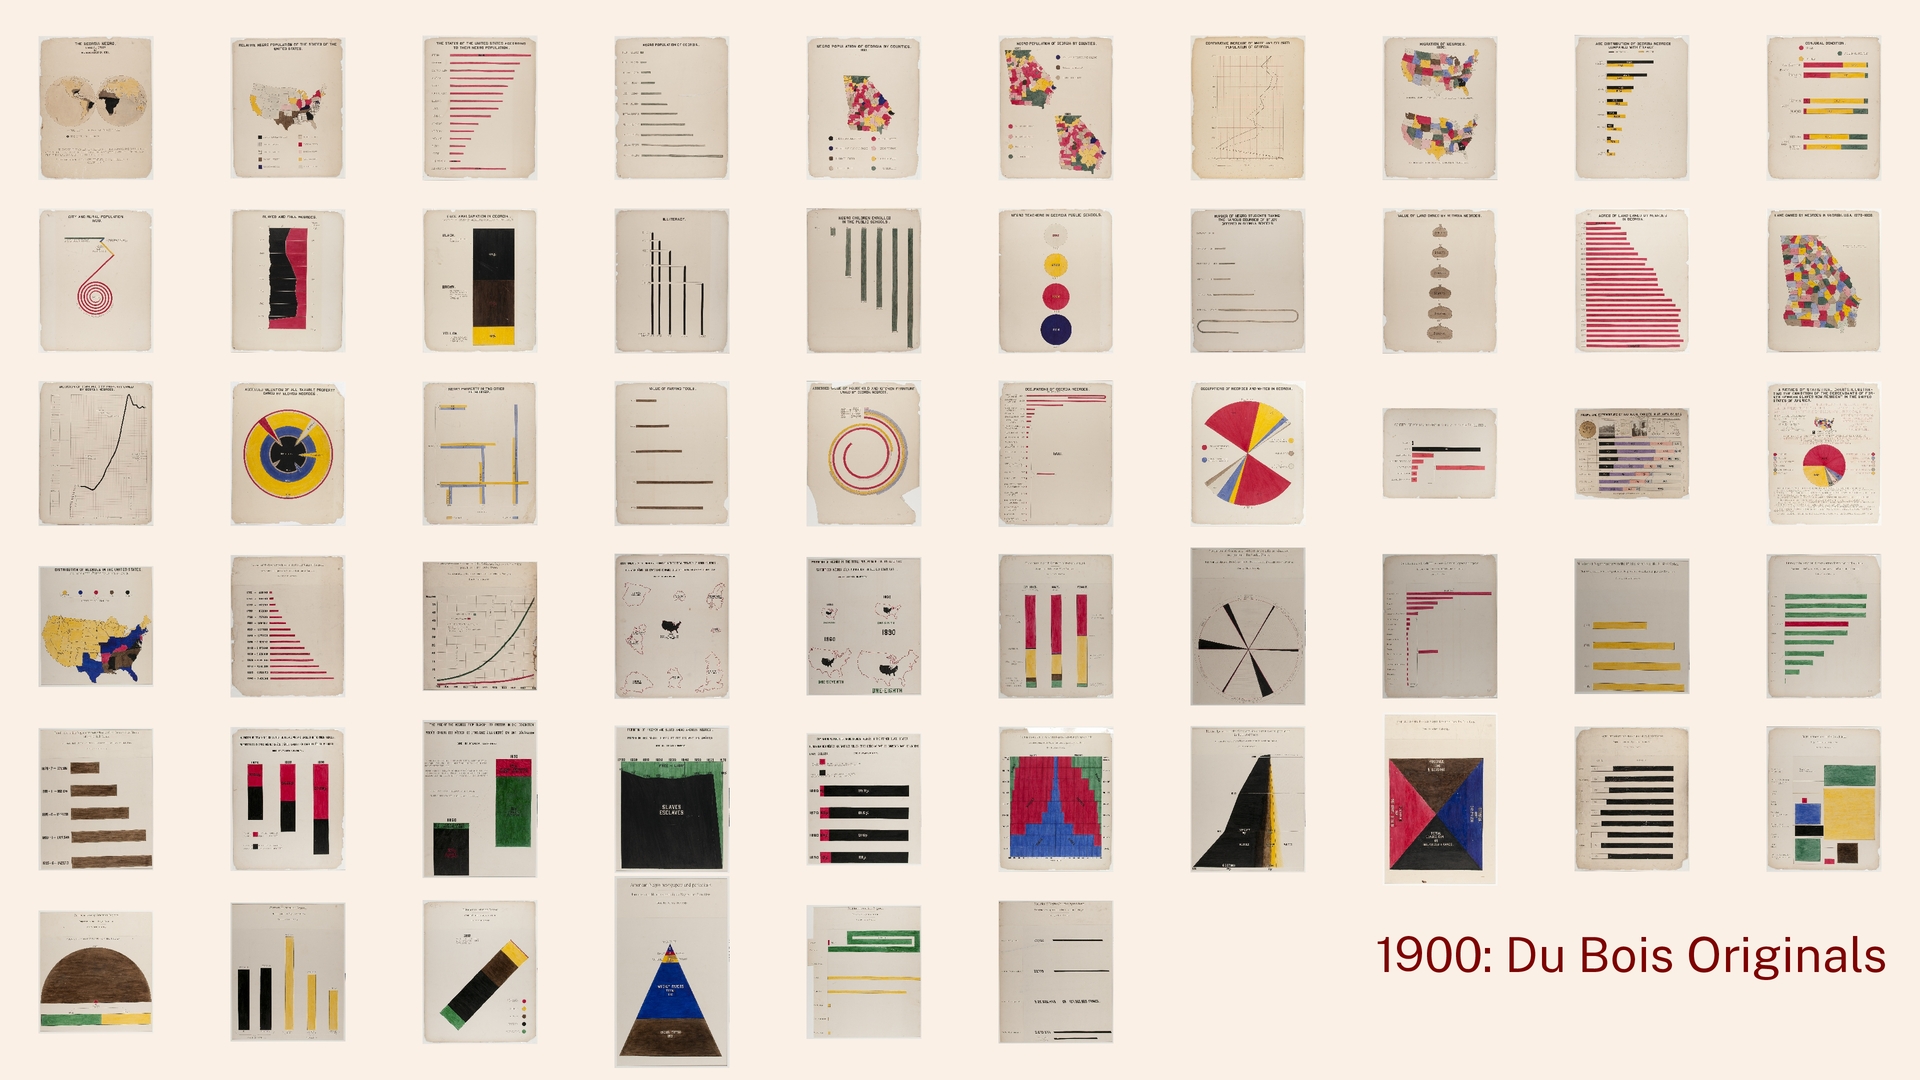
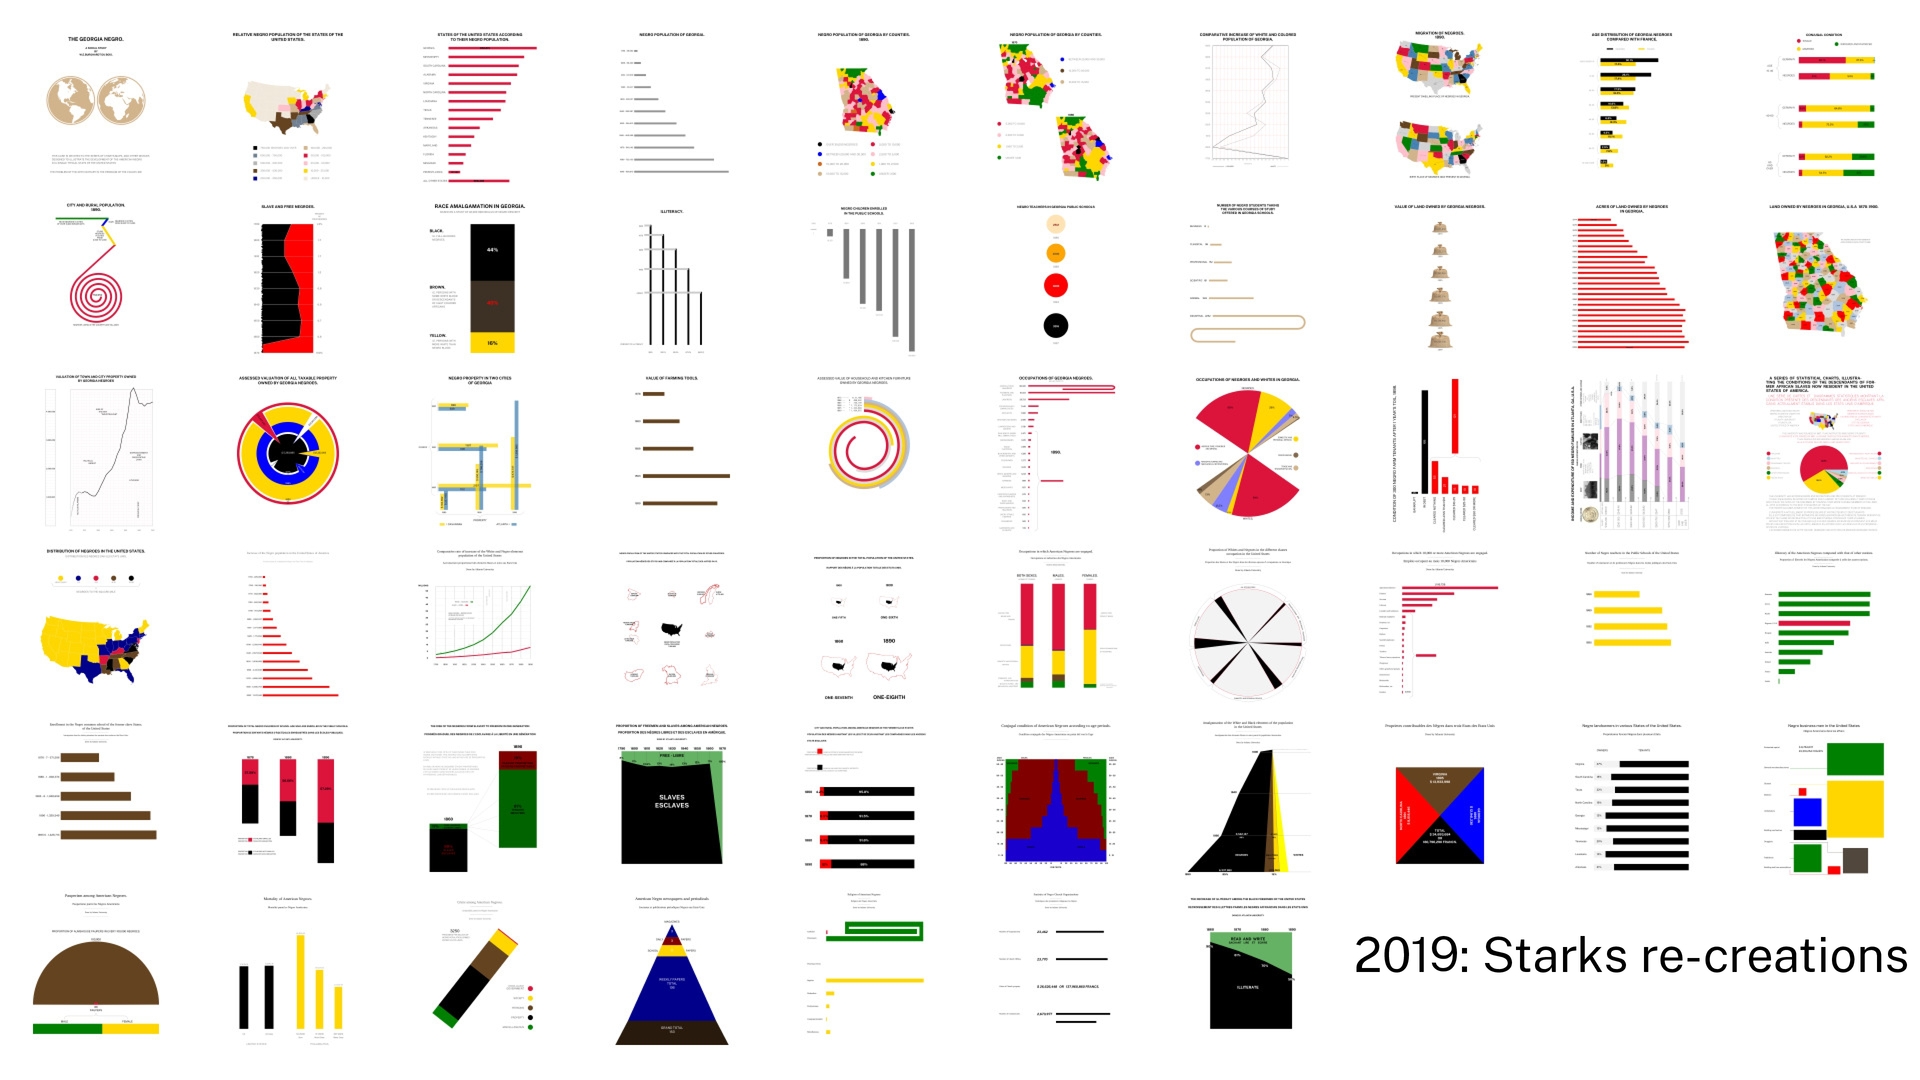
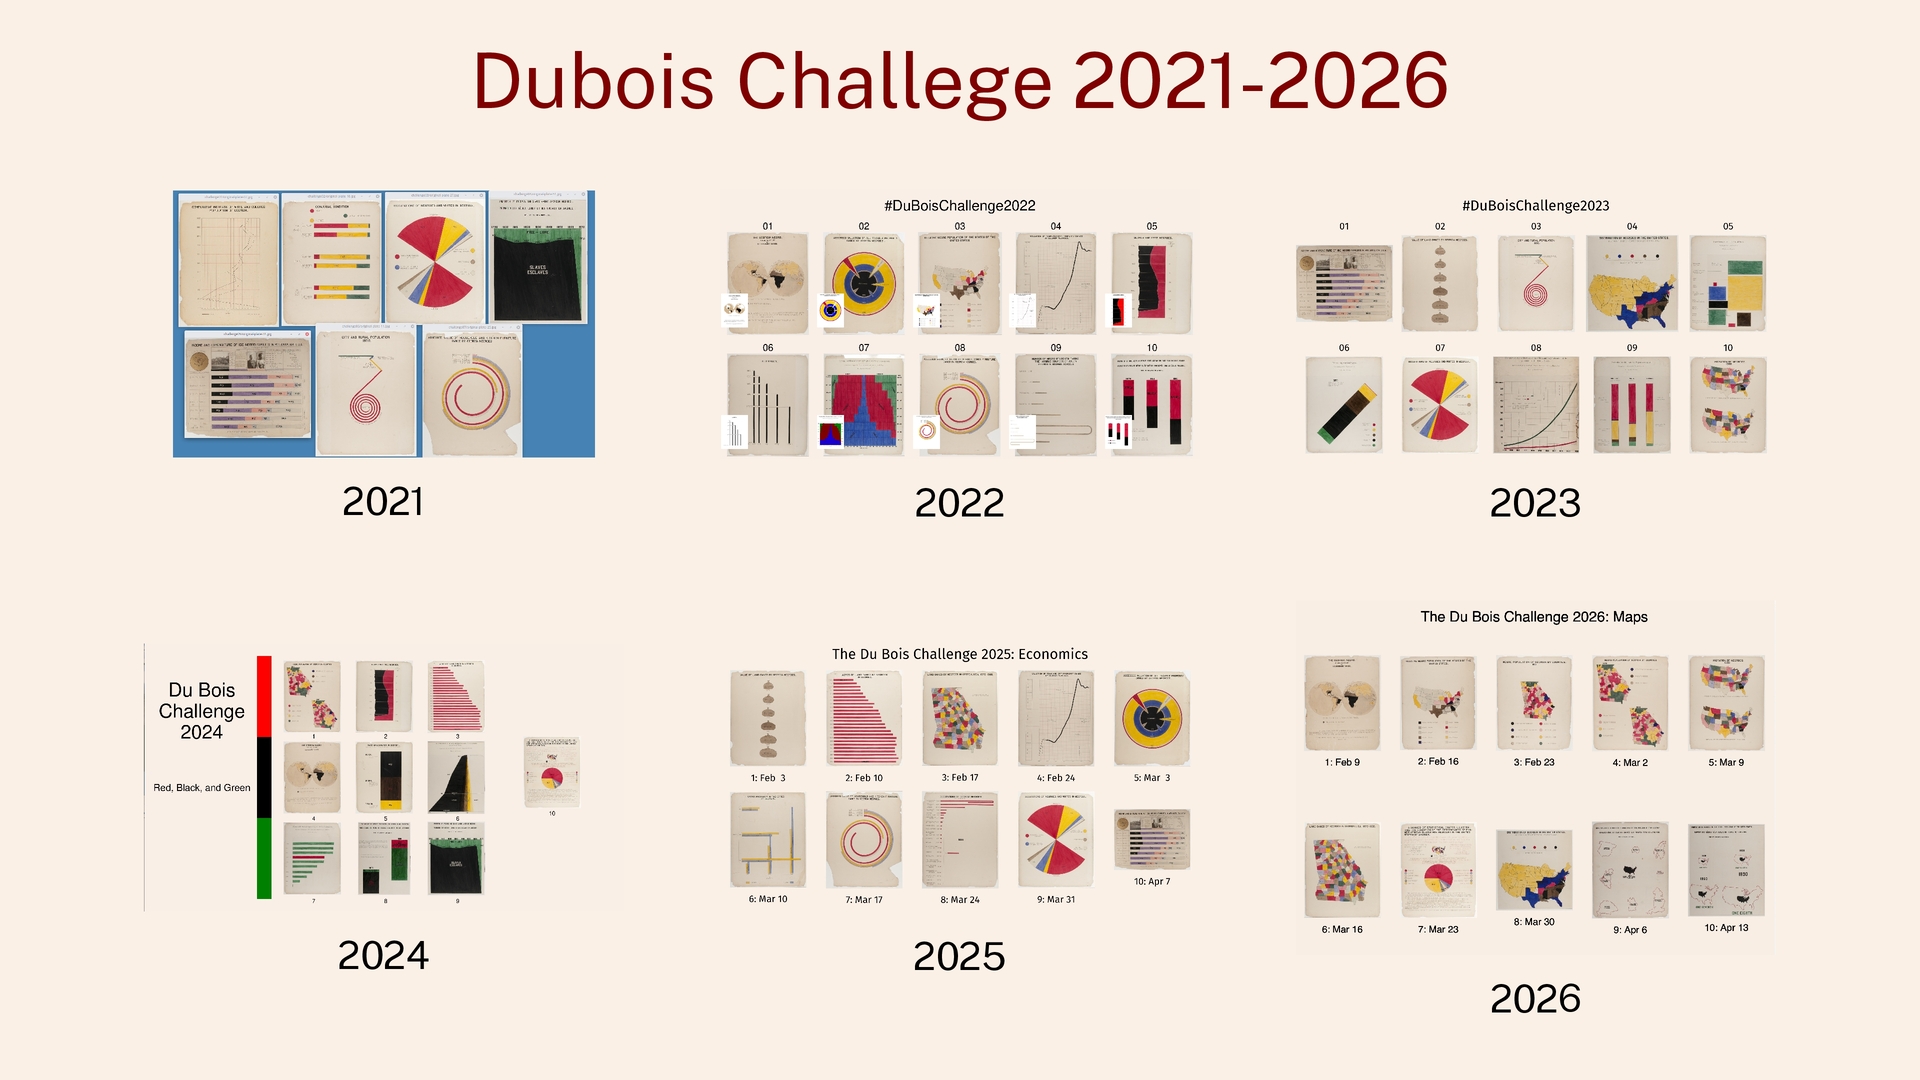
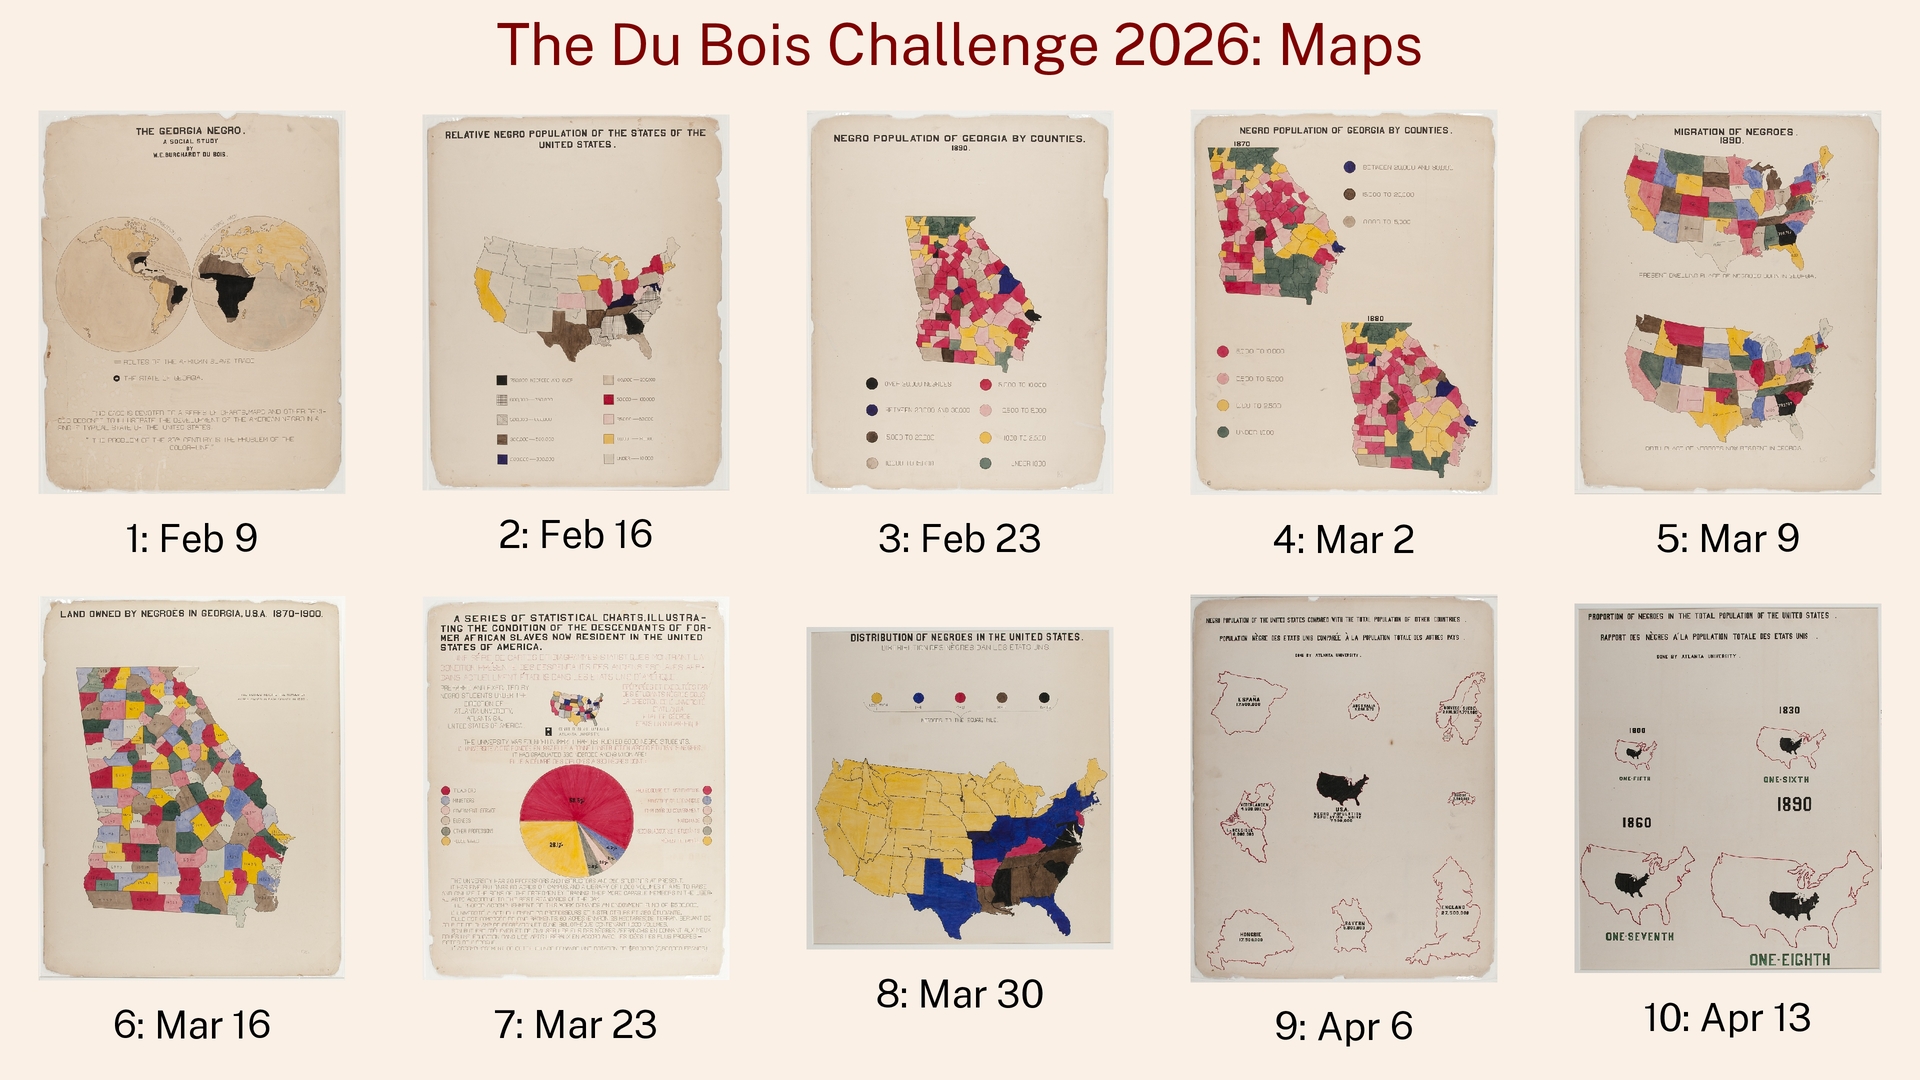
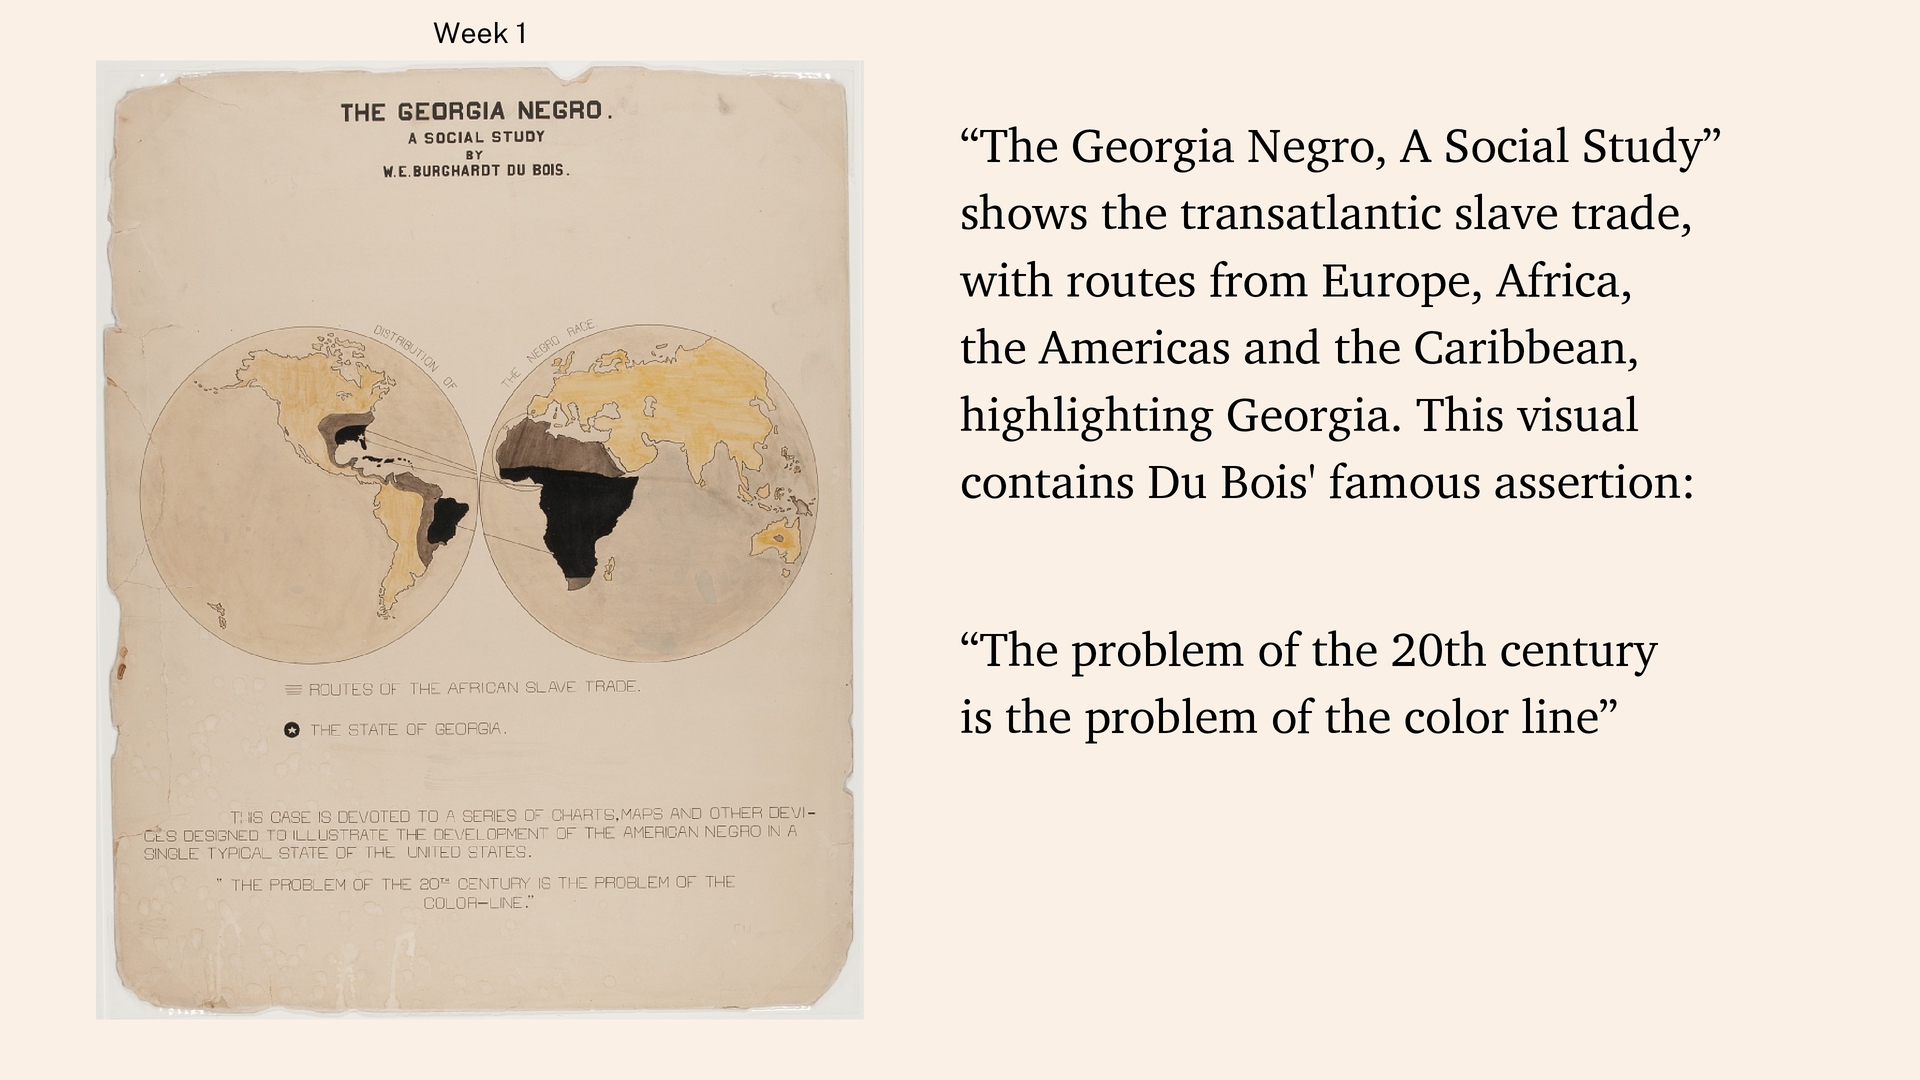
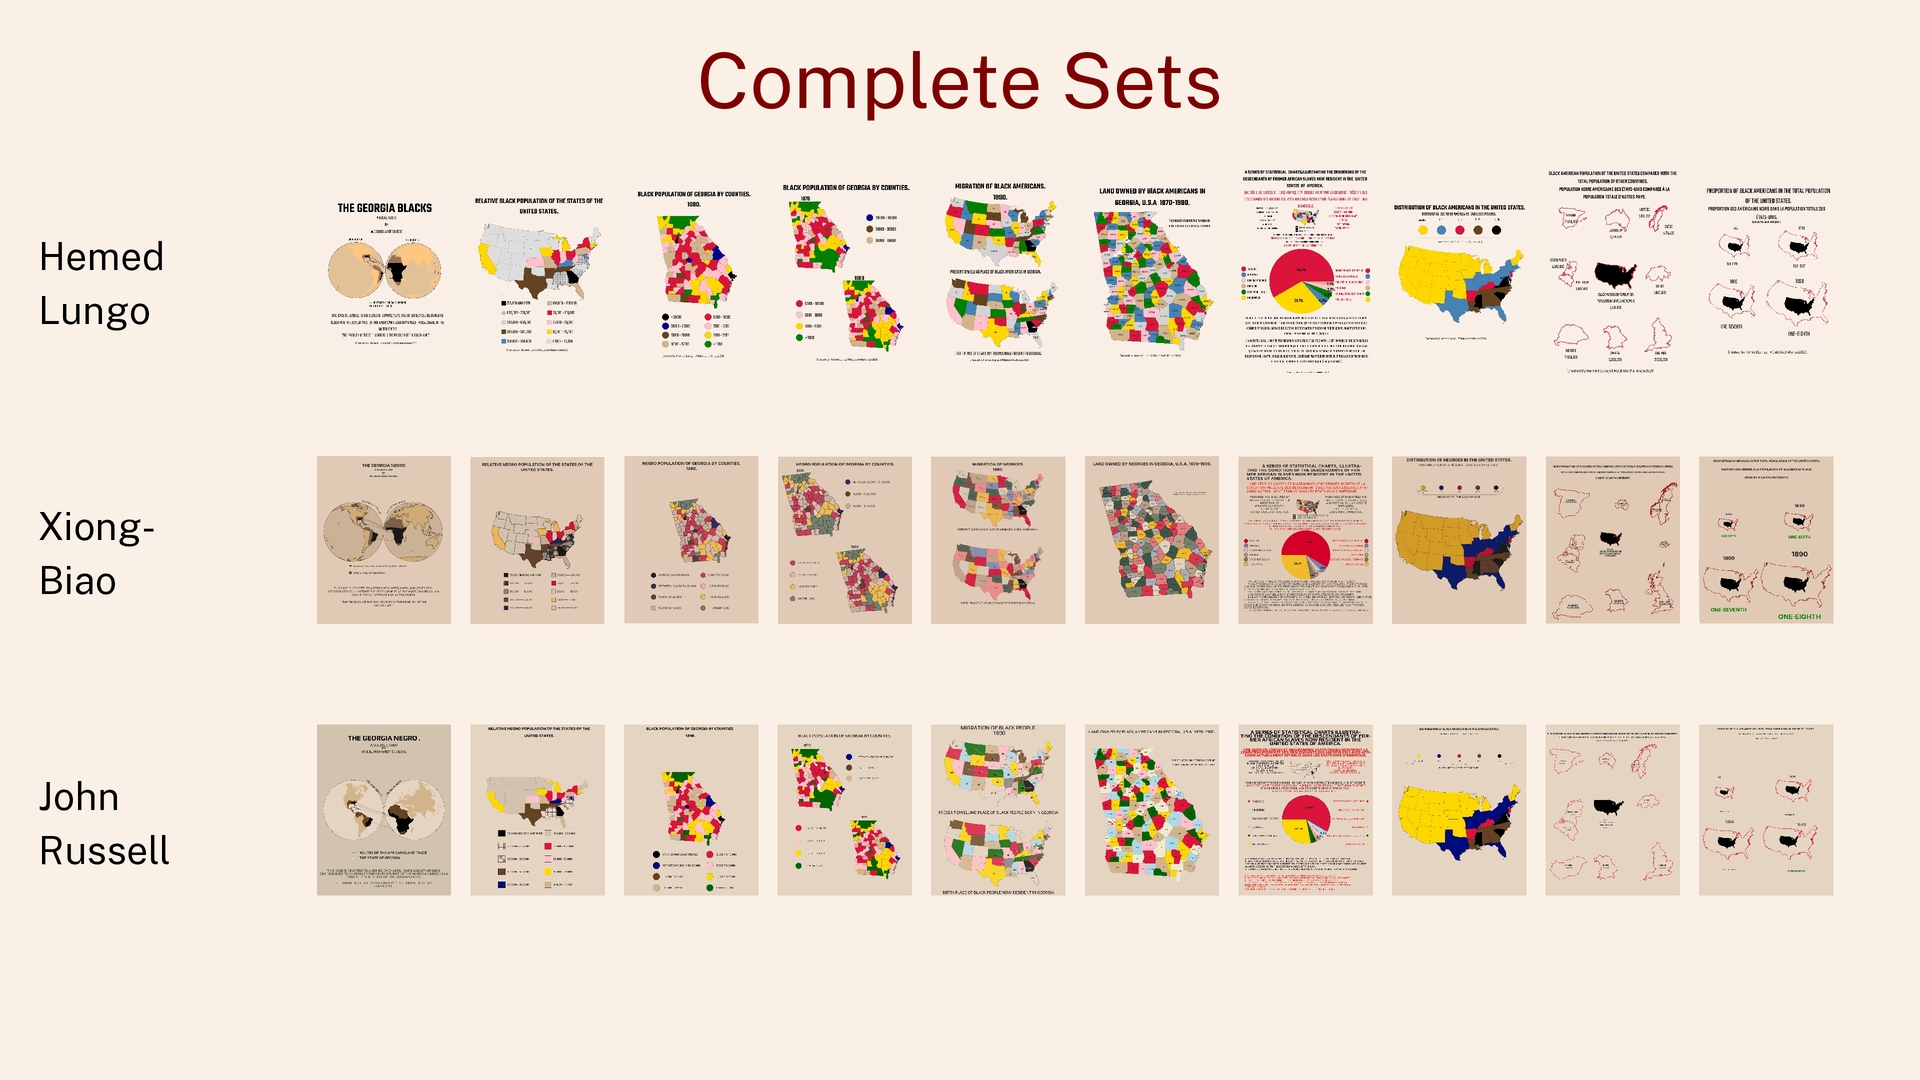
transatlantic slave trade, with routes from Europe, Africa, the Americas and the Caribbean, highlighting Georgia. This visual contains Du Bois' famous assertion: “The problem of the 20th century is the problem of the color line”
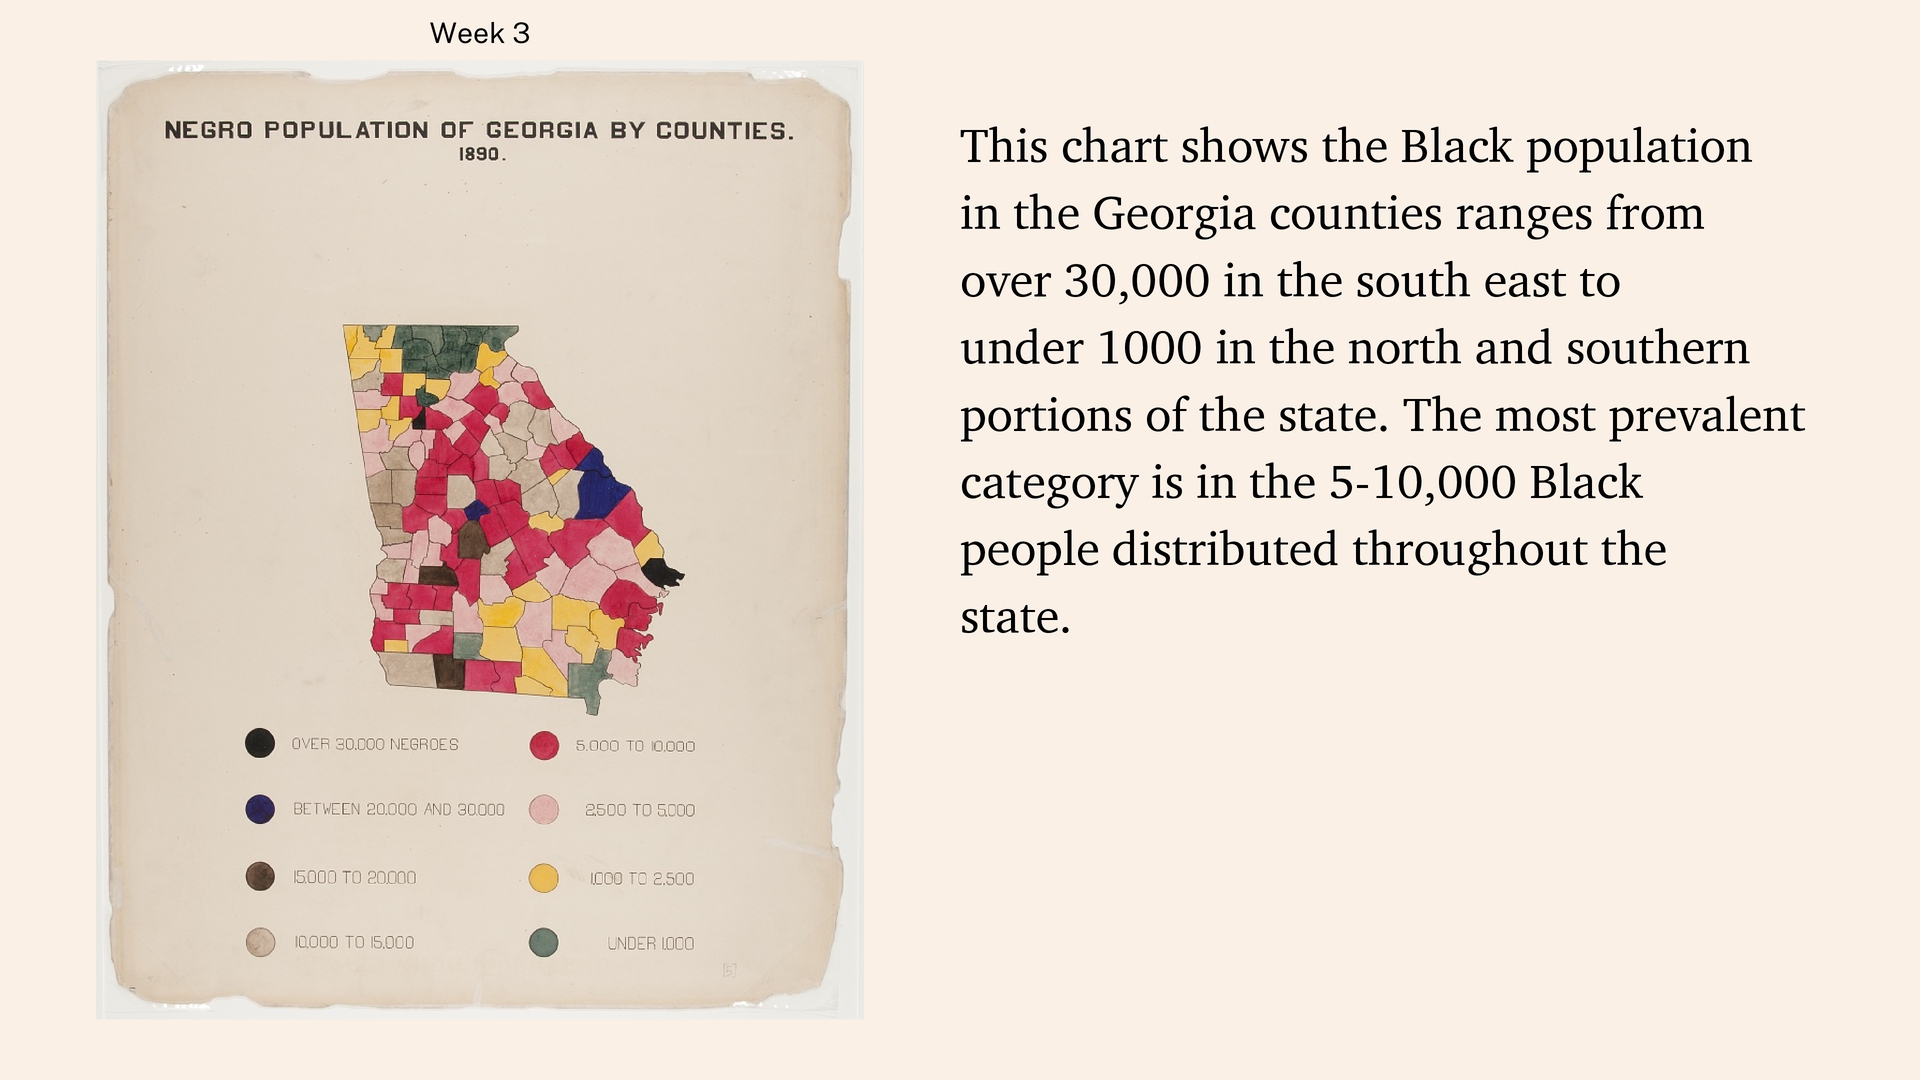
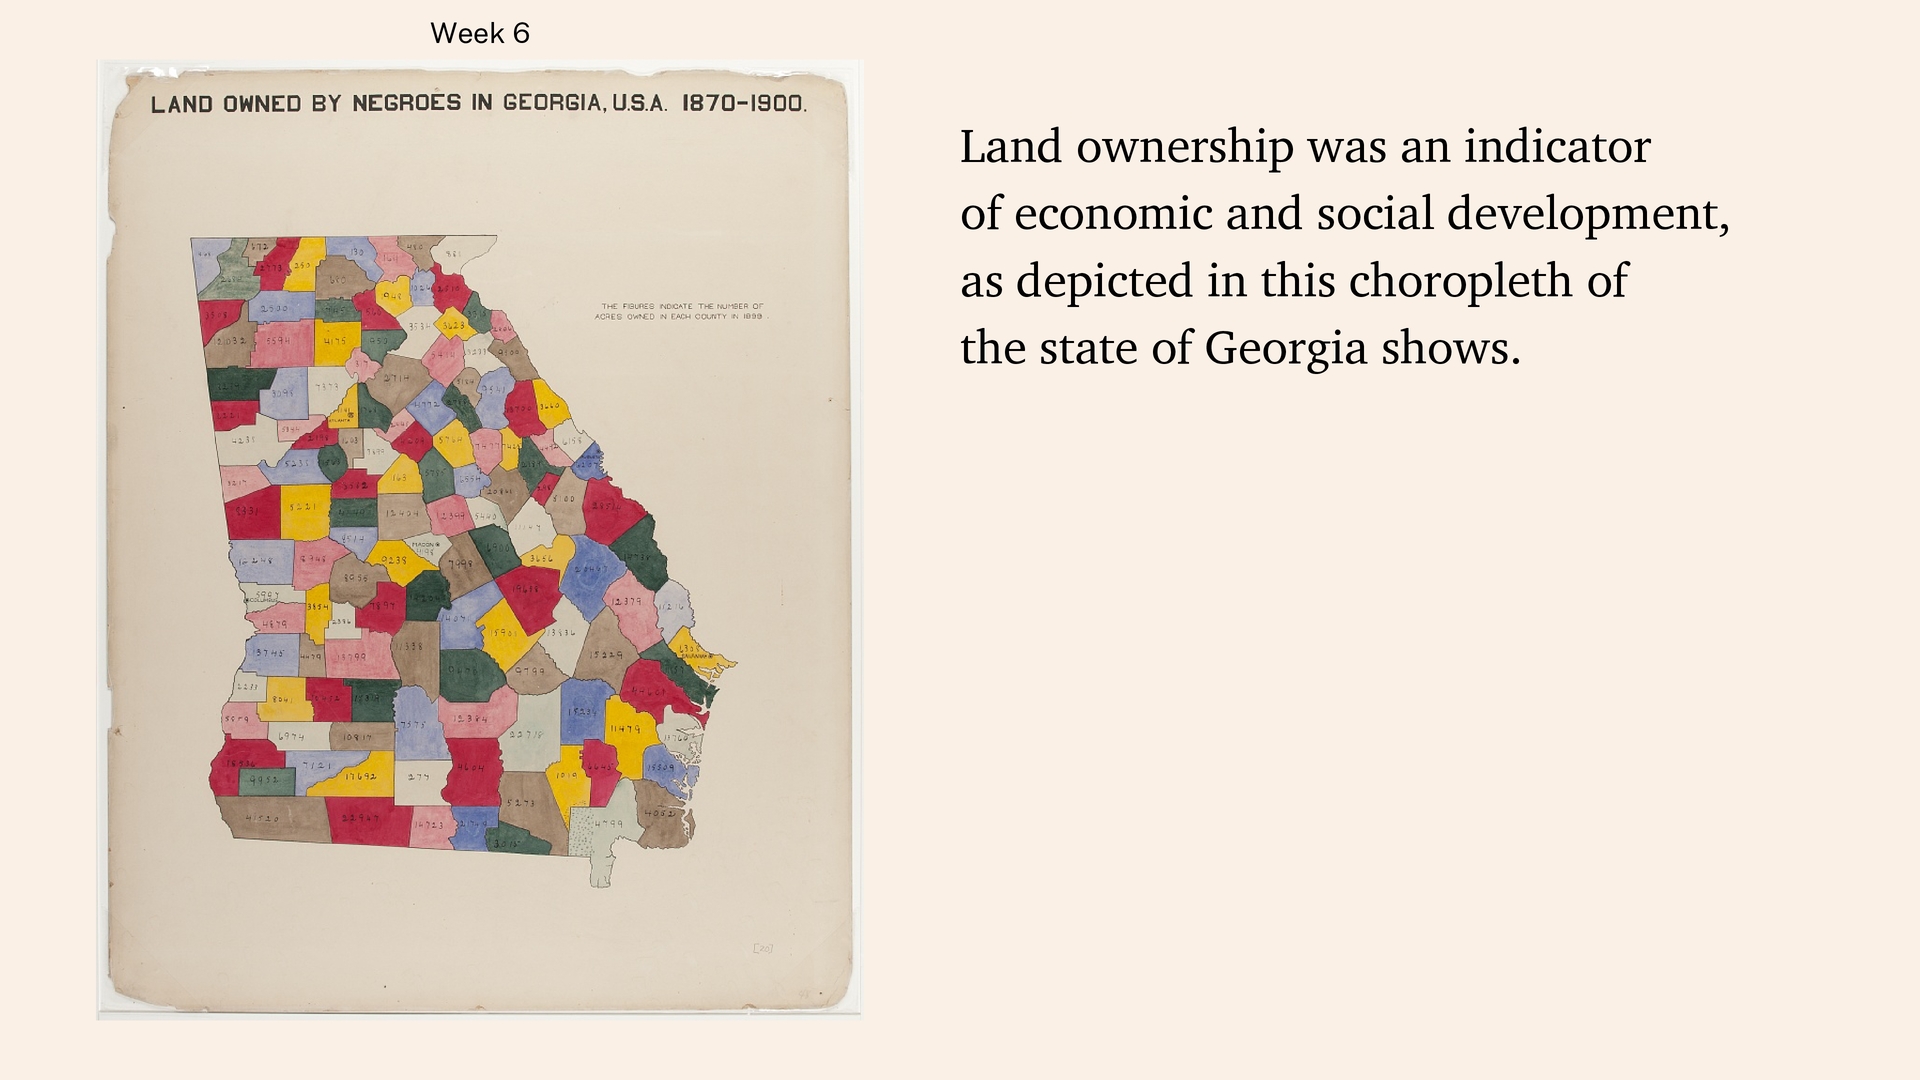
Georgia counties ranges from over 30,000 in the south east to under 1000 in the north and southern portions of the state. The most prevalent category is in the 5-10,000 Black people distributed throughout the state.
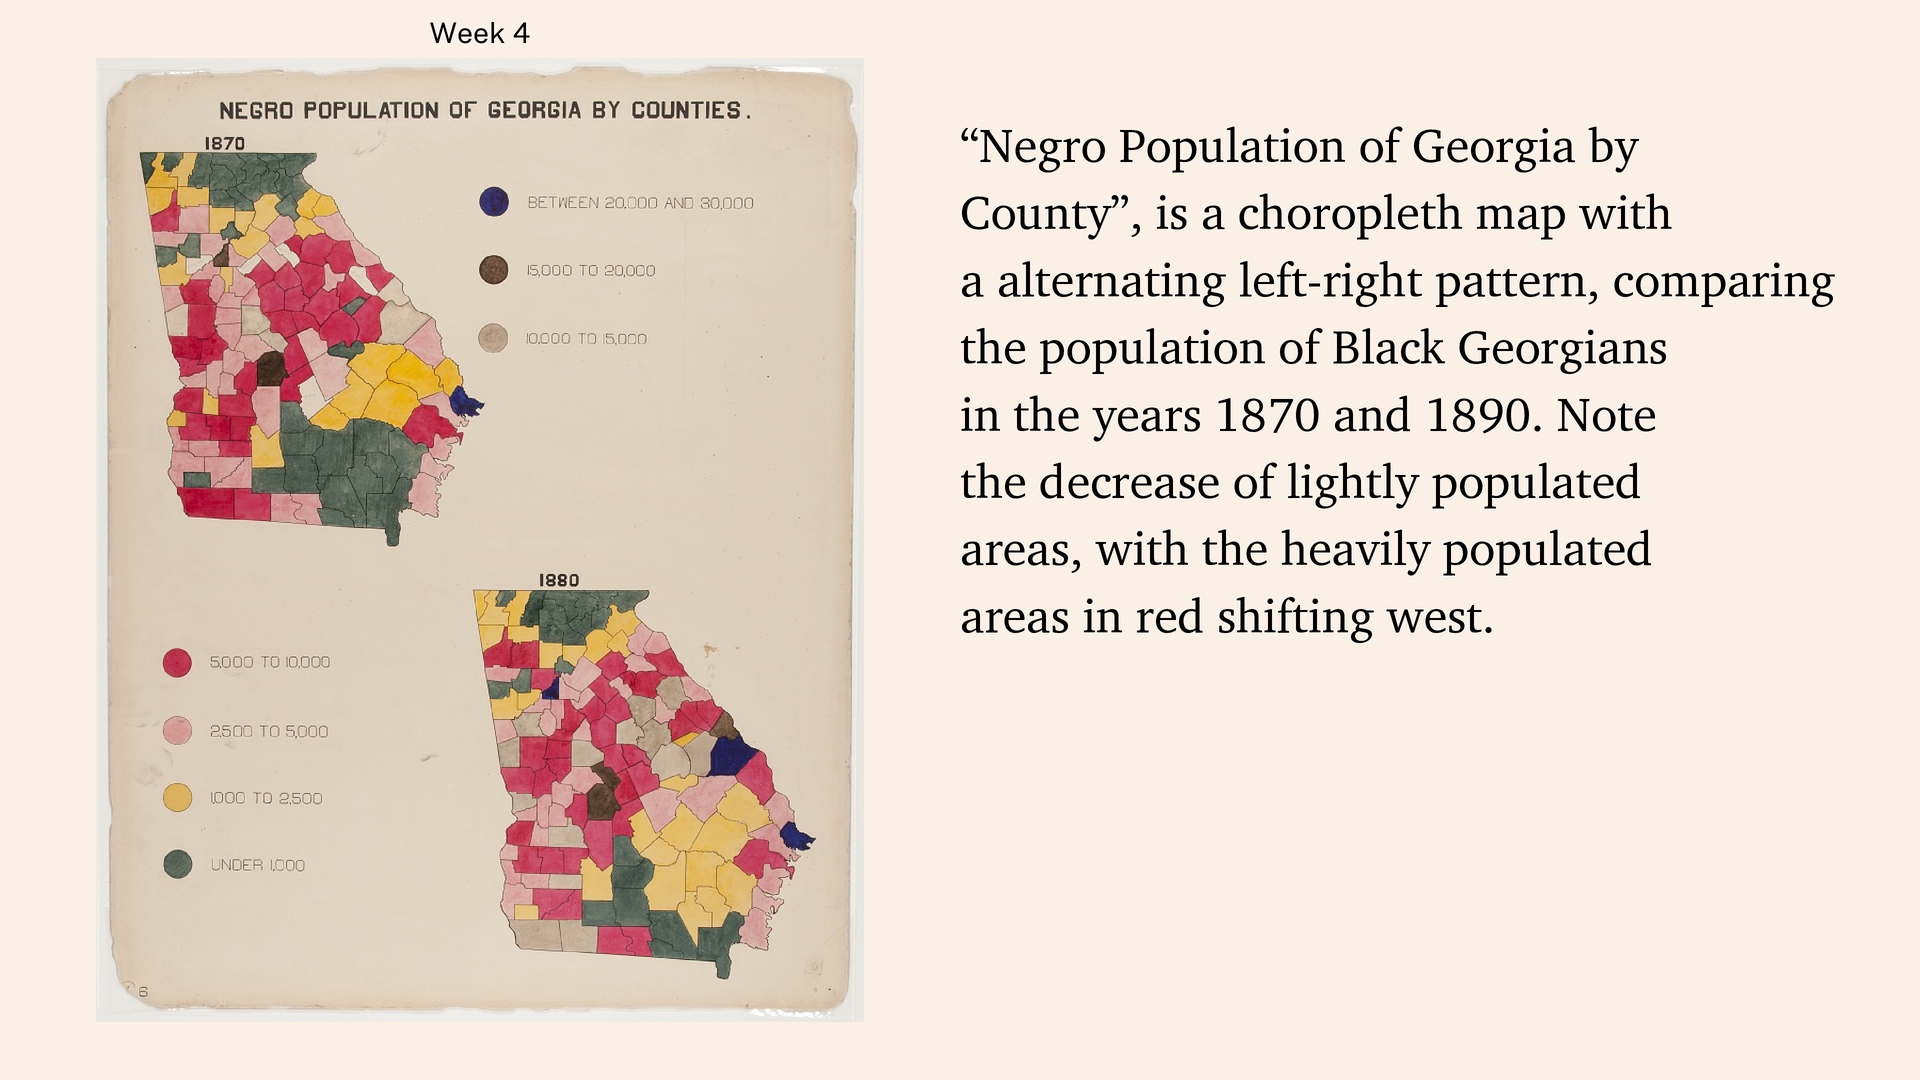
choropleth map with a alternating left-right pattern, comparing the population of Black Georgians in the years 1870 and 1890. Note the decrease of lightly populated areas, with the heavily populated areas in red shifting west.
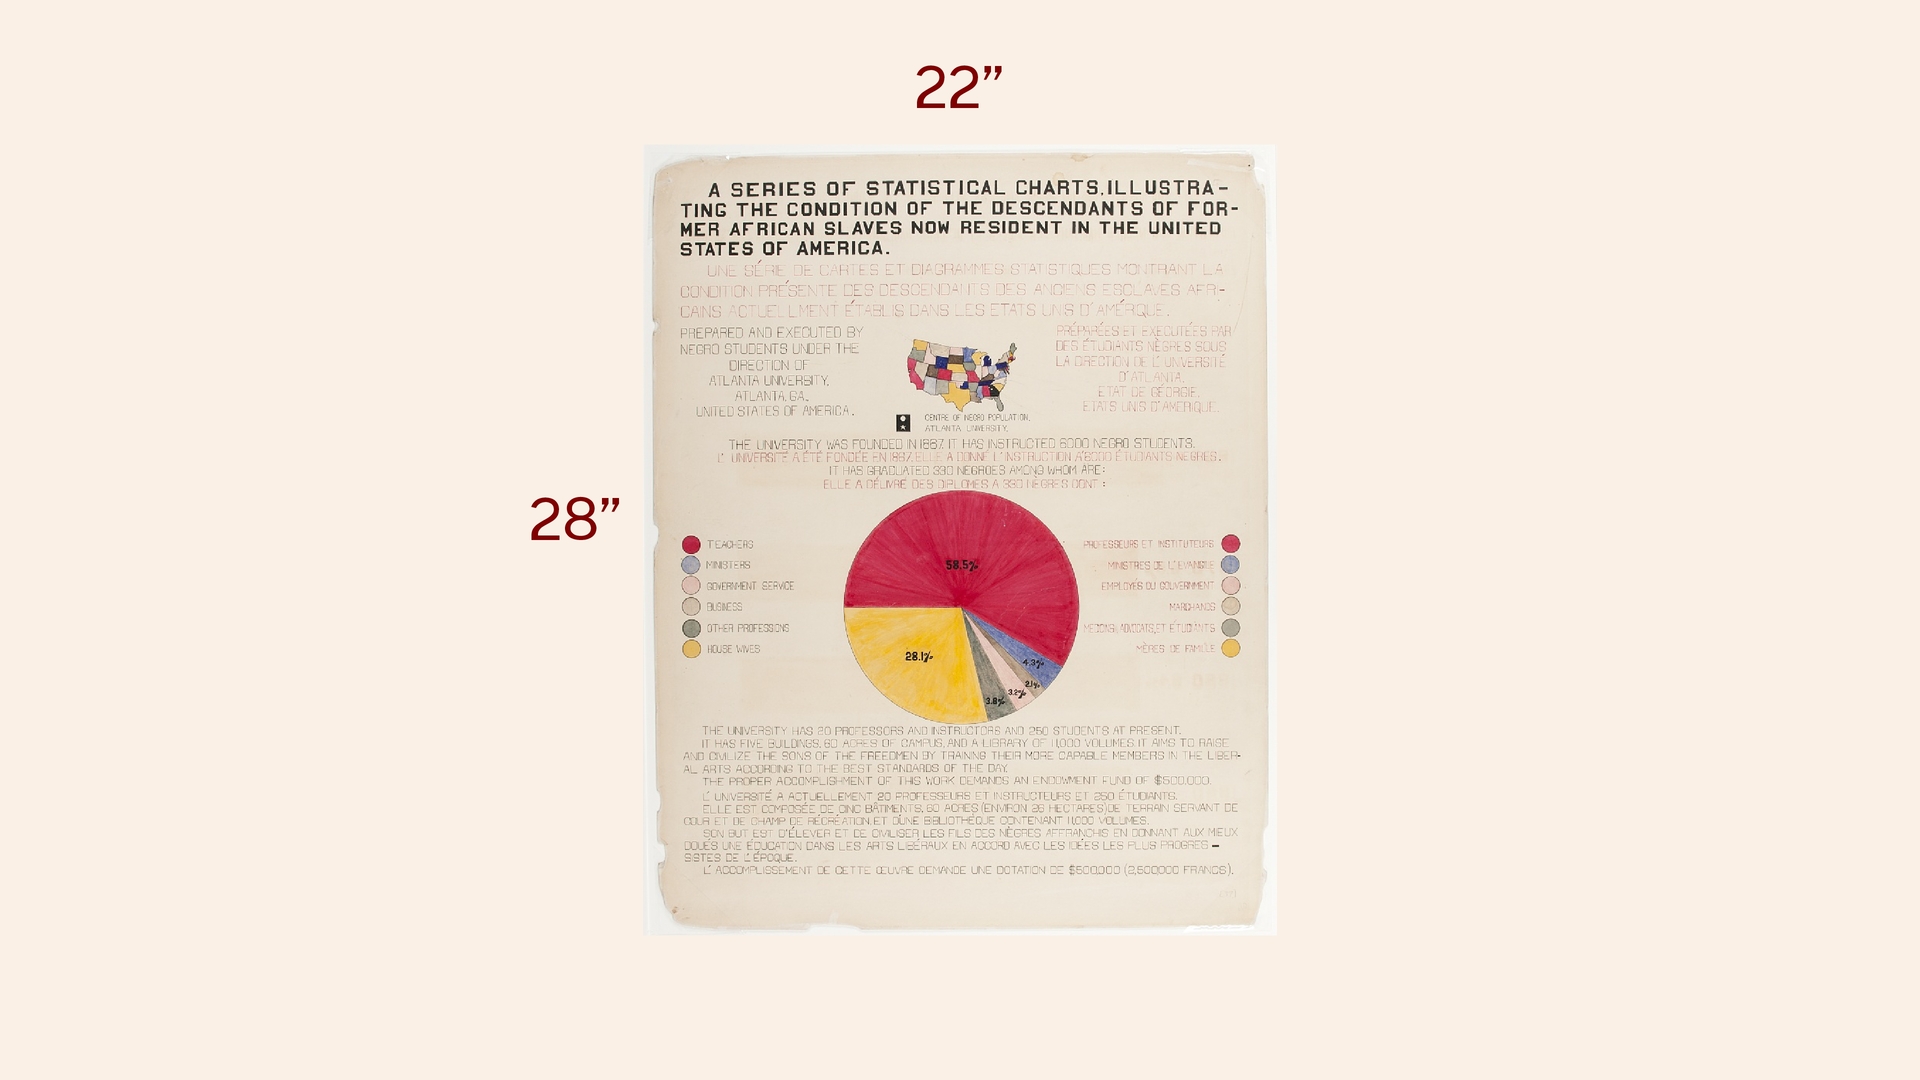
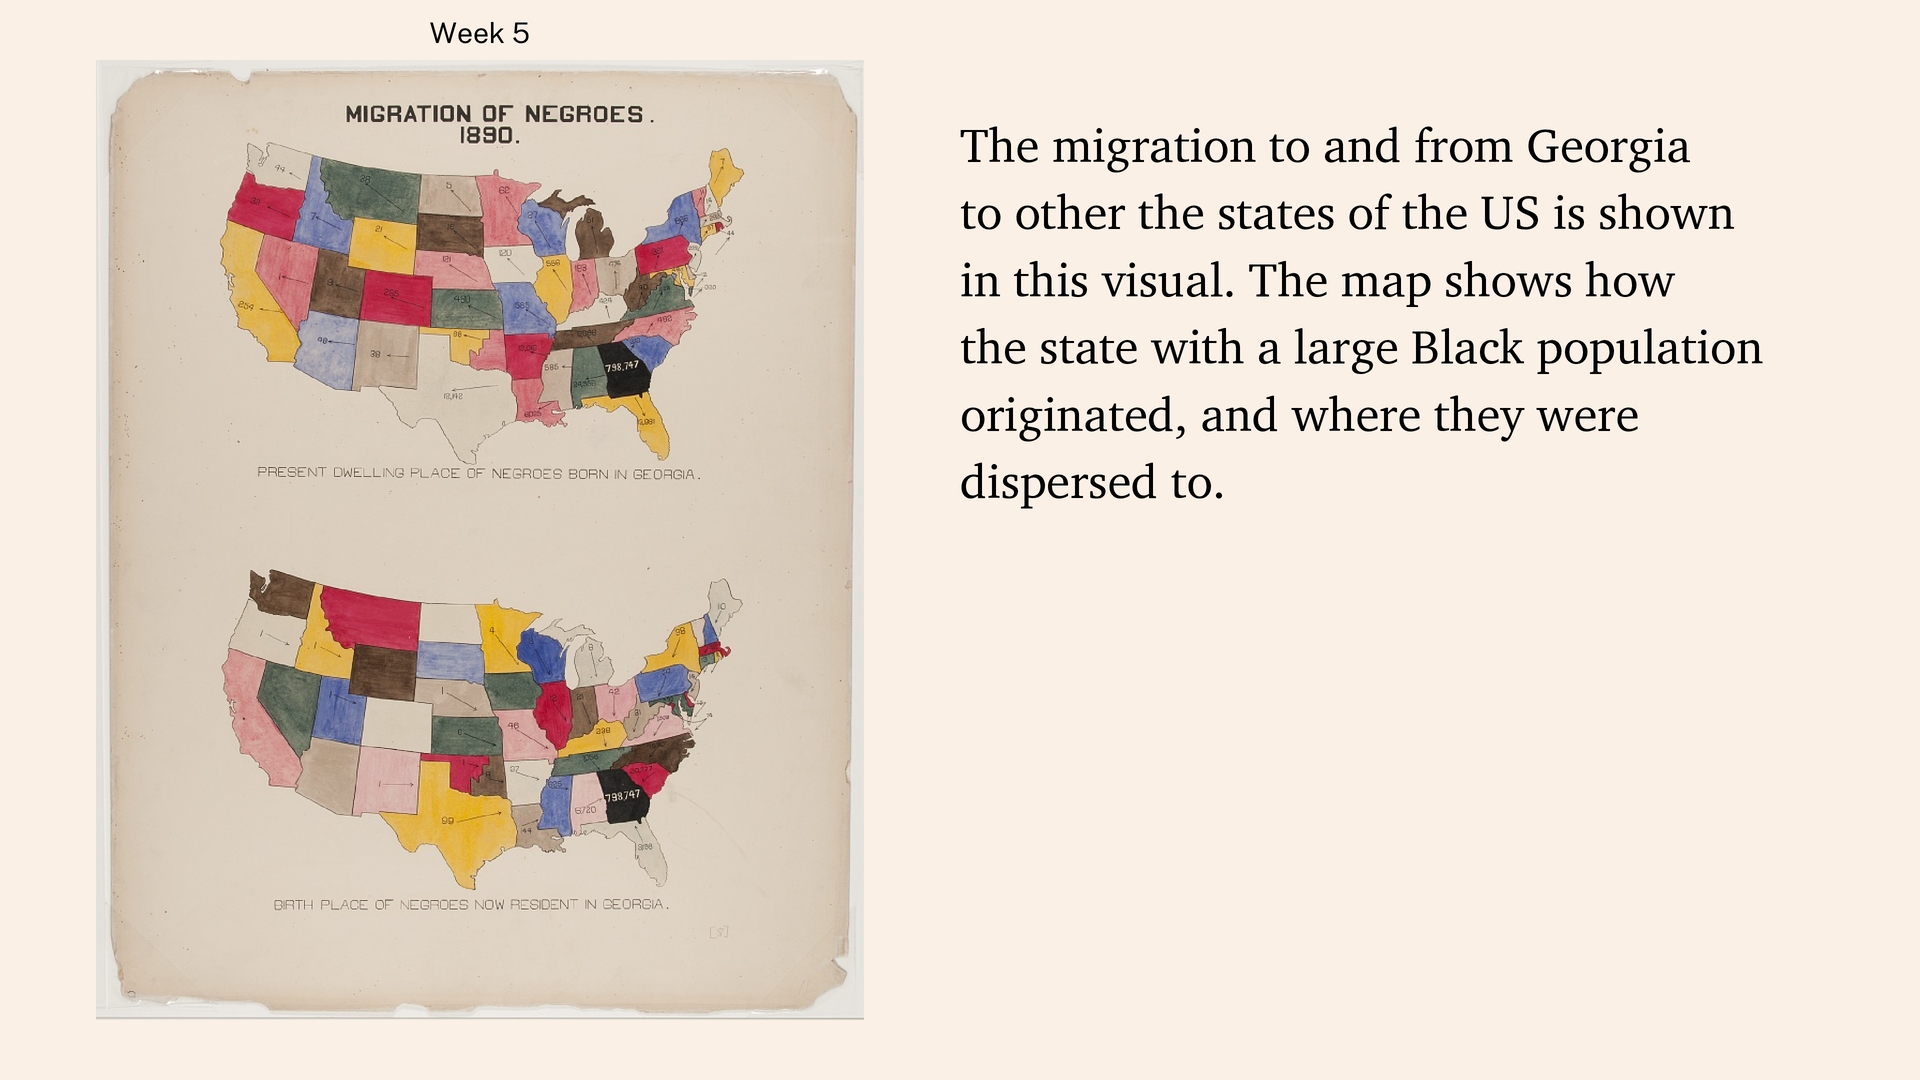
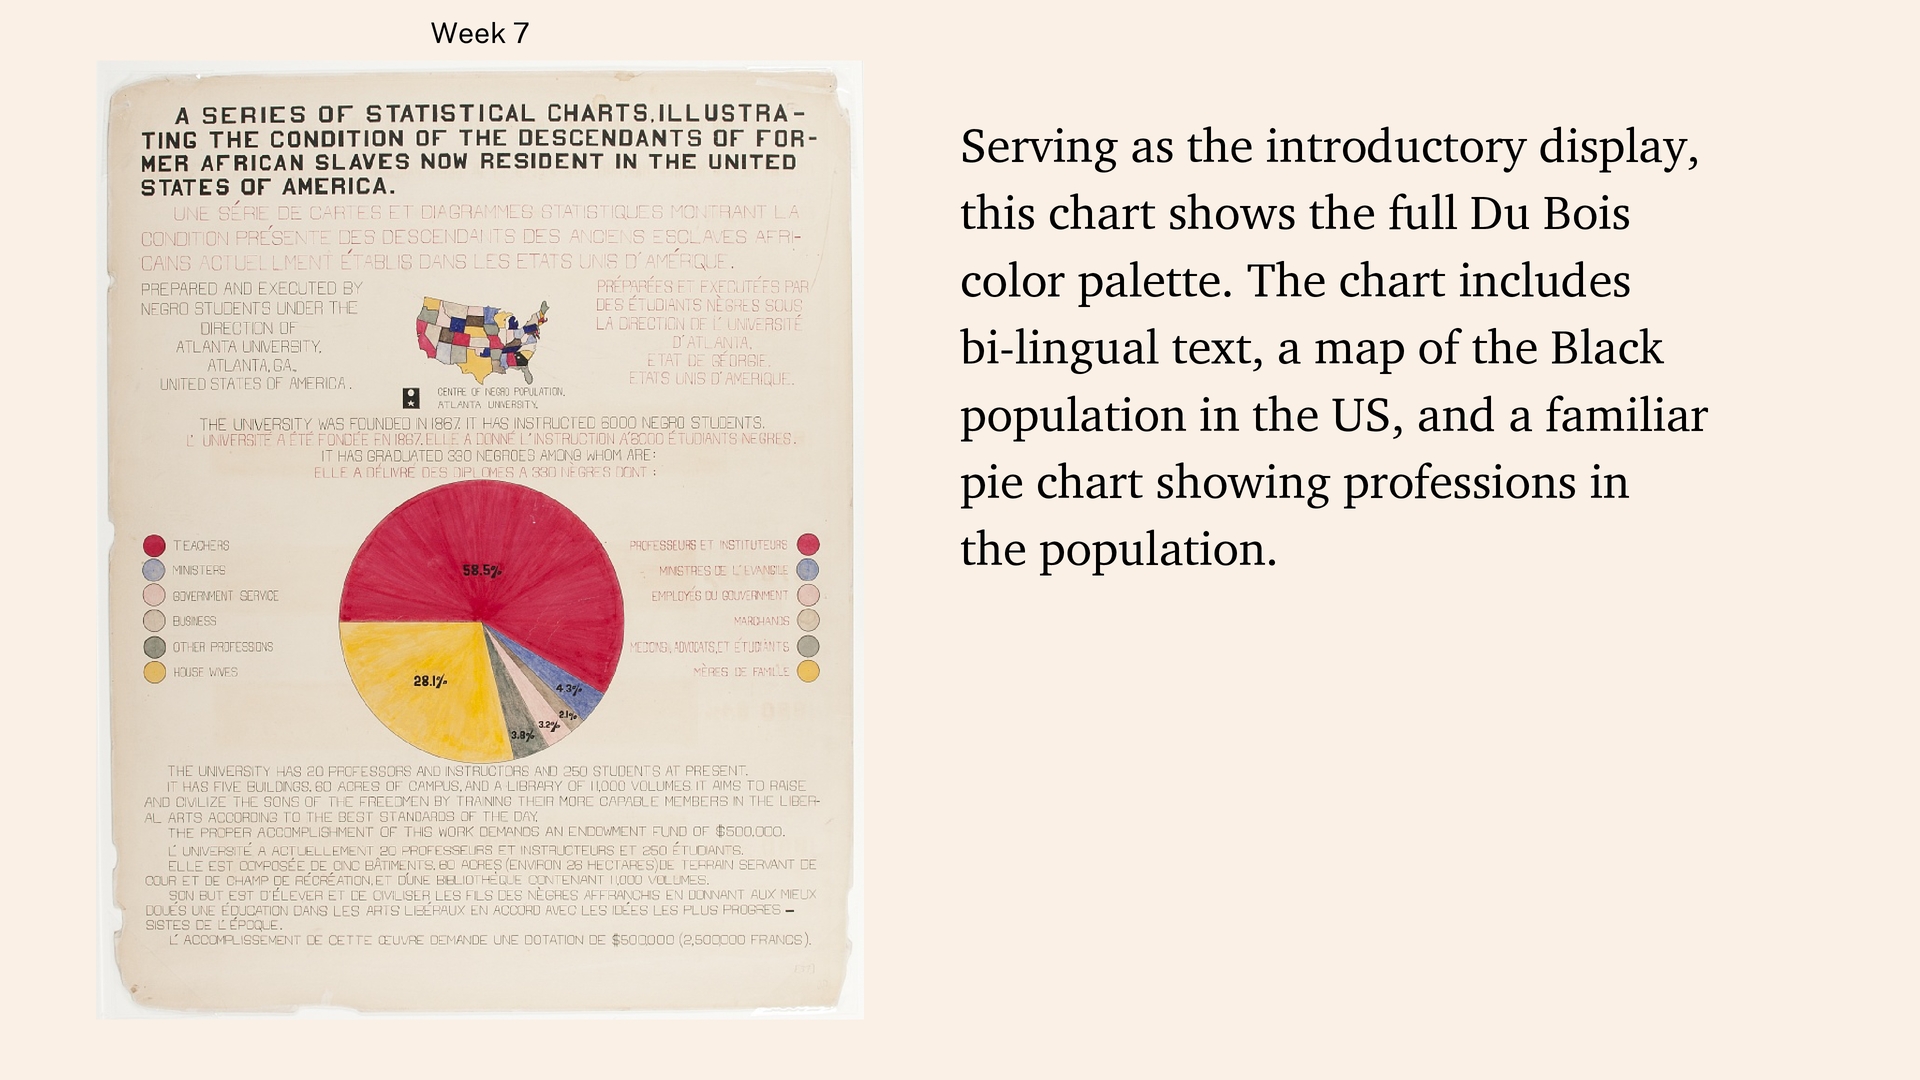
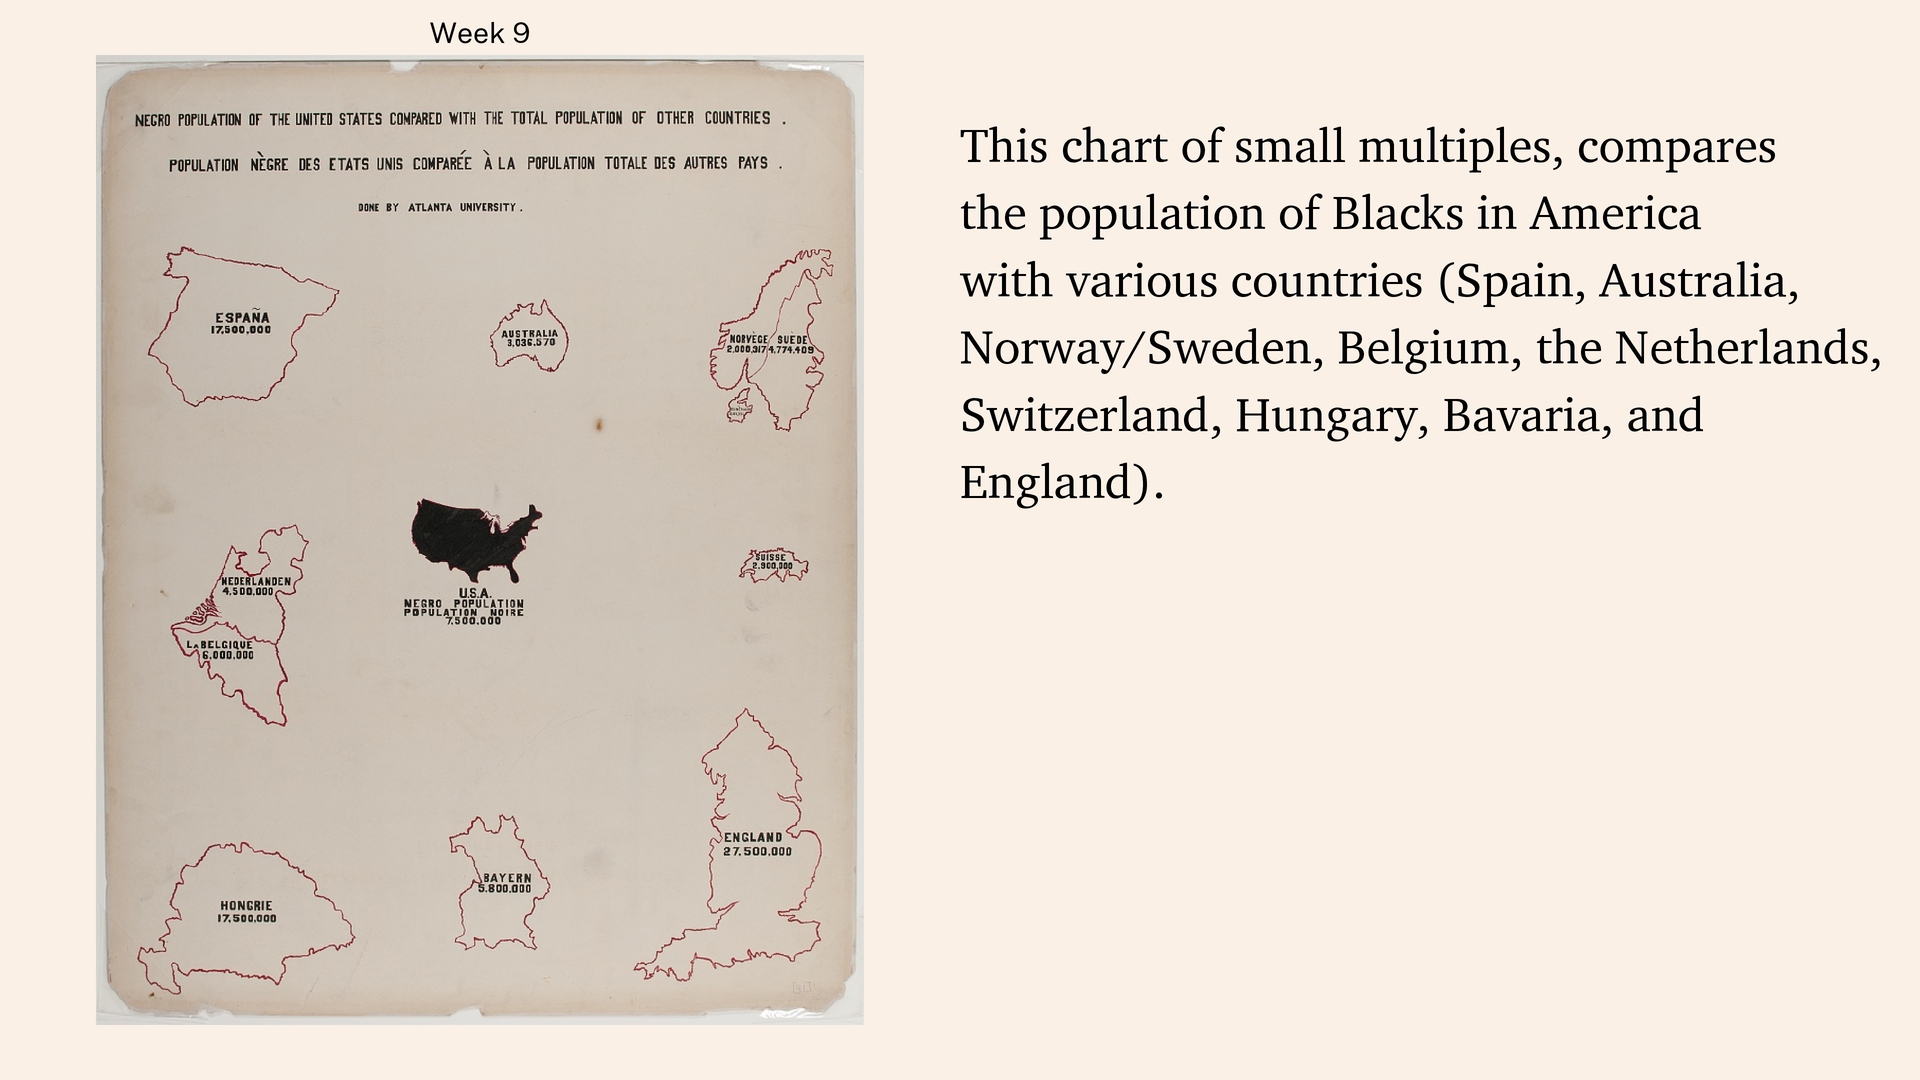
the full Du Bois color palette. The chart includes bi-lingual text, a map of the Black population in the US, and a familiar pie chart showing professions in the population.
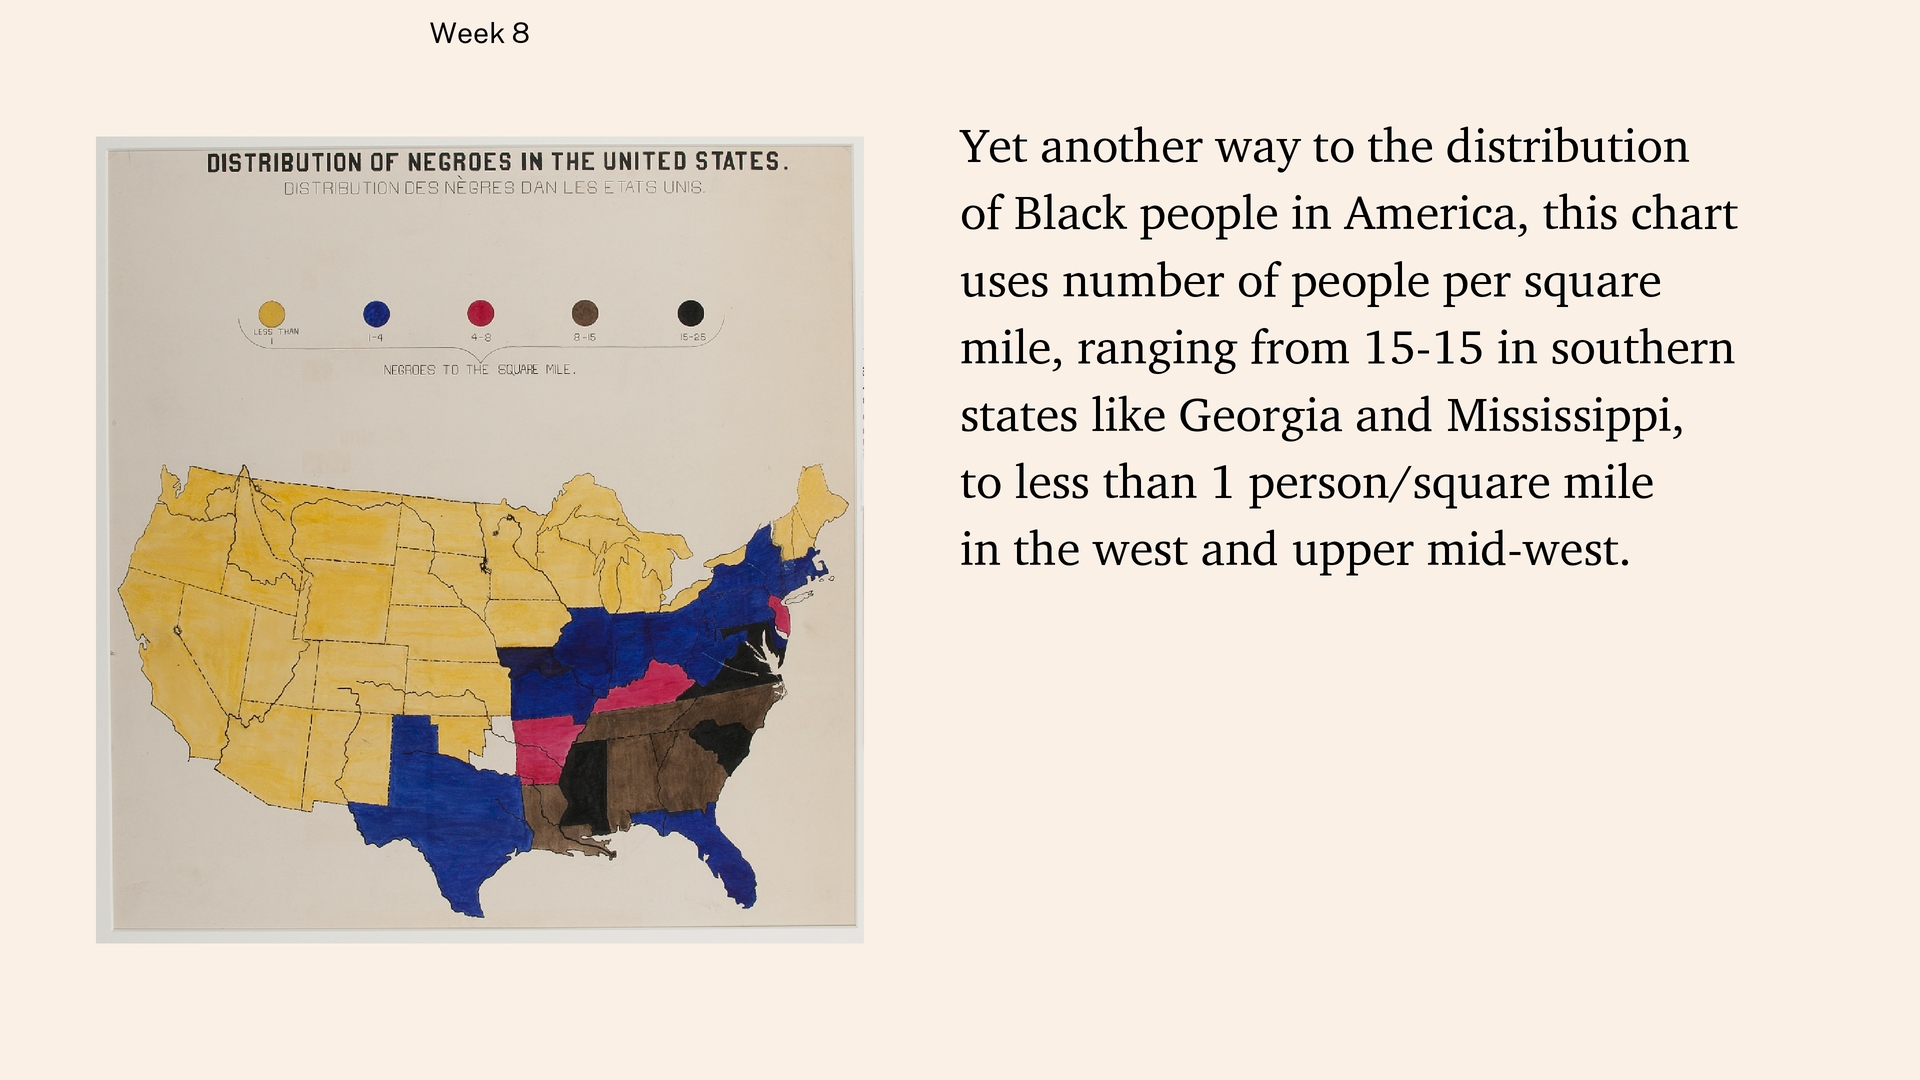
people in America, this chart uses number of people per square mile, ranging from 15-15 in southern states like Georgia and Mississippi, to less than 1 person/square mile in the west and upper mid-west.
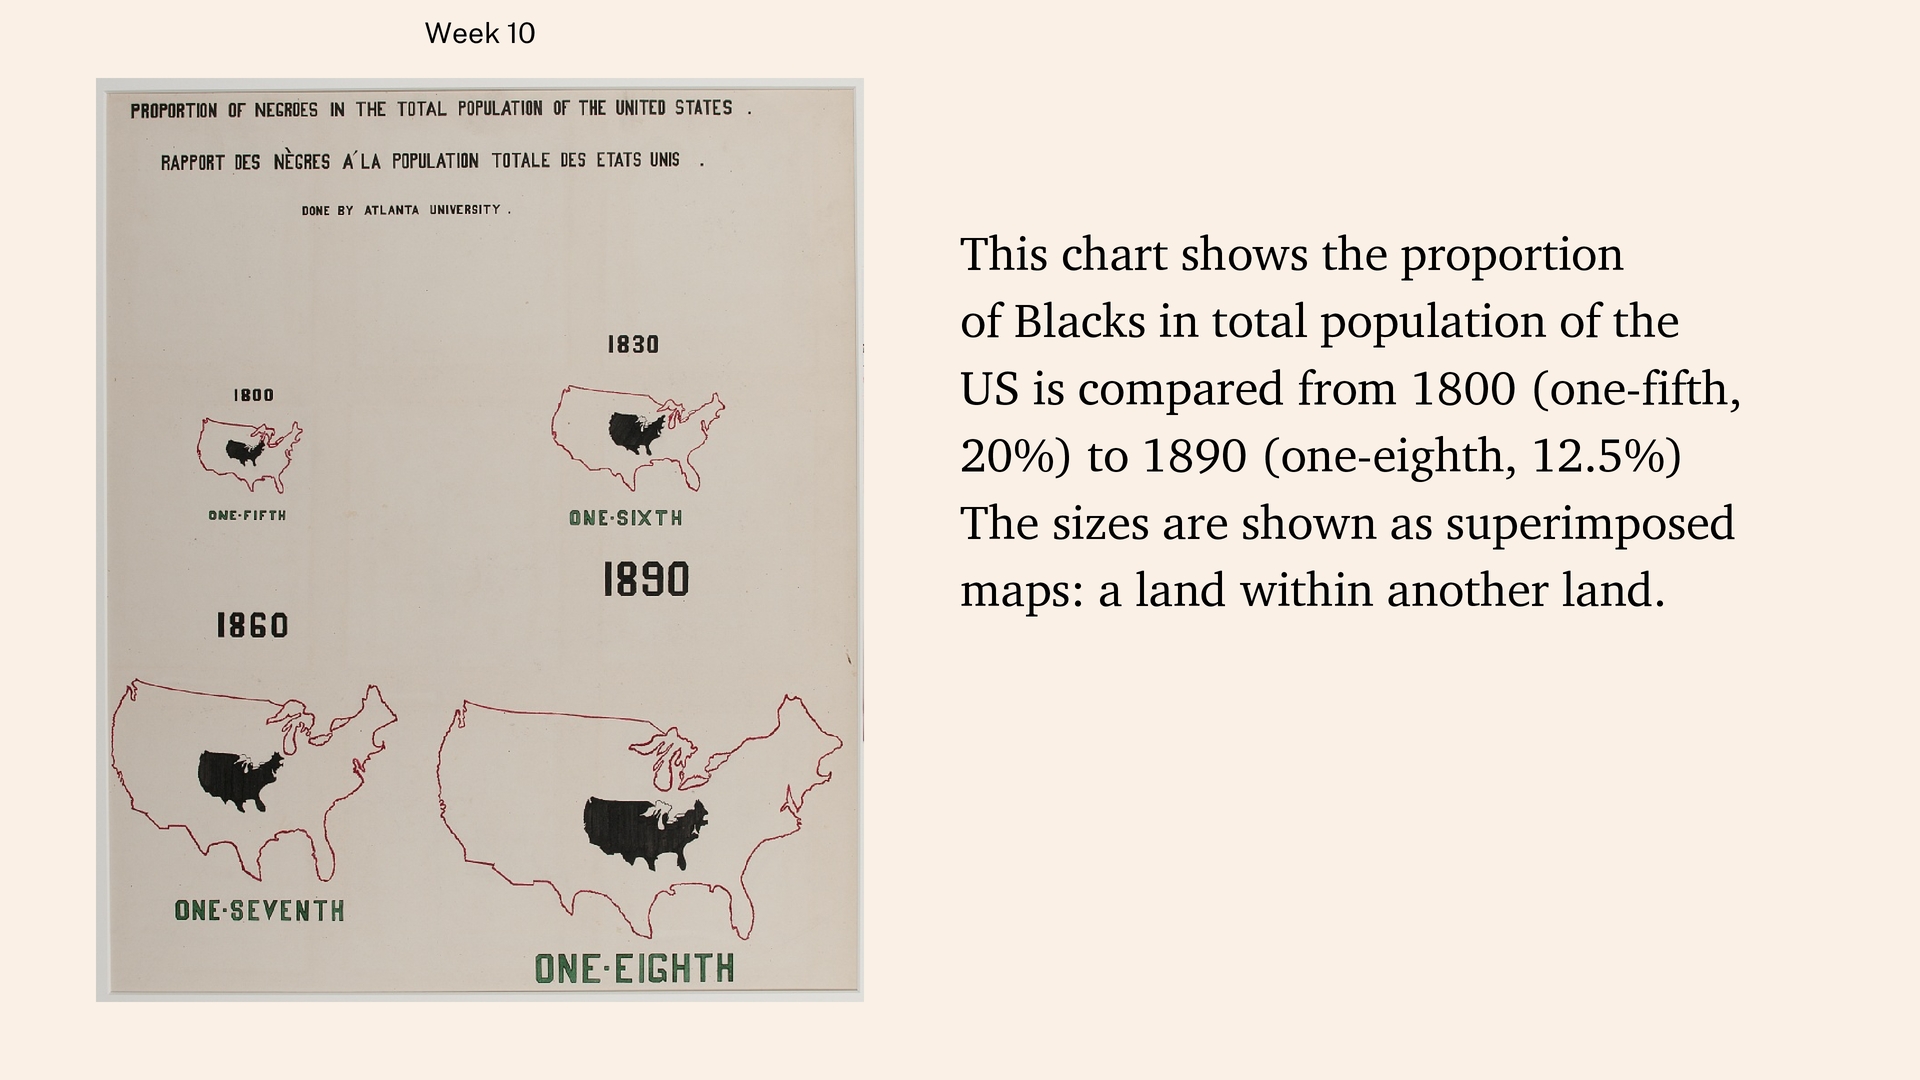
total population of the US is compared from 1800 (one-fifth, 20%) to 1890 (one-eighth, 12.5%) The sizes are shown as superimposed maps: a land within another land.
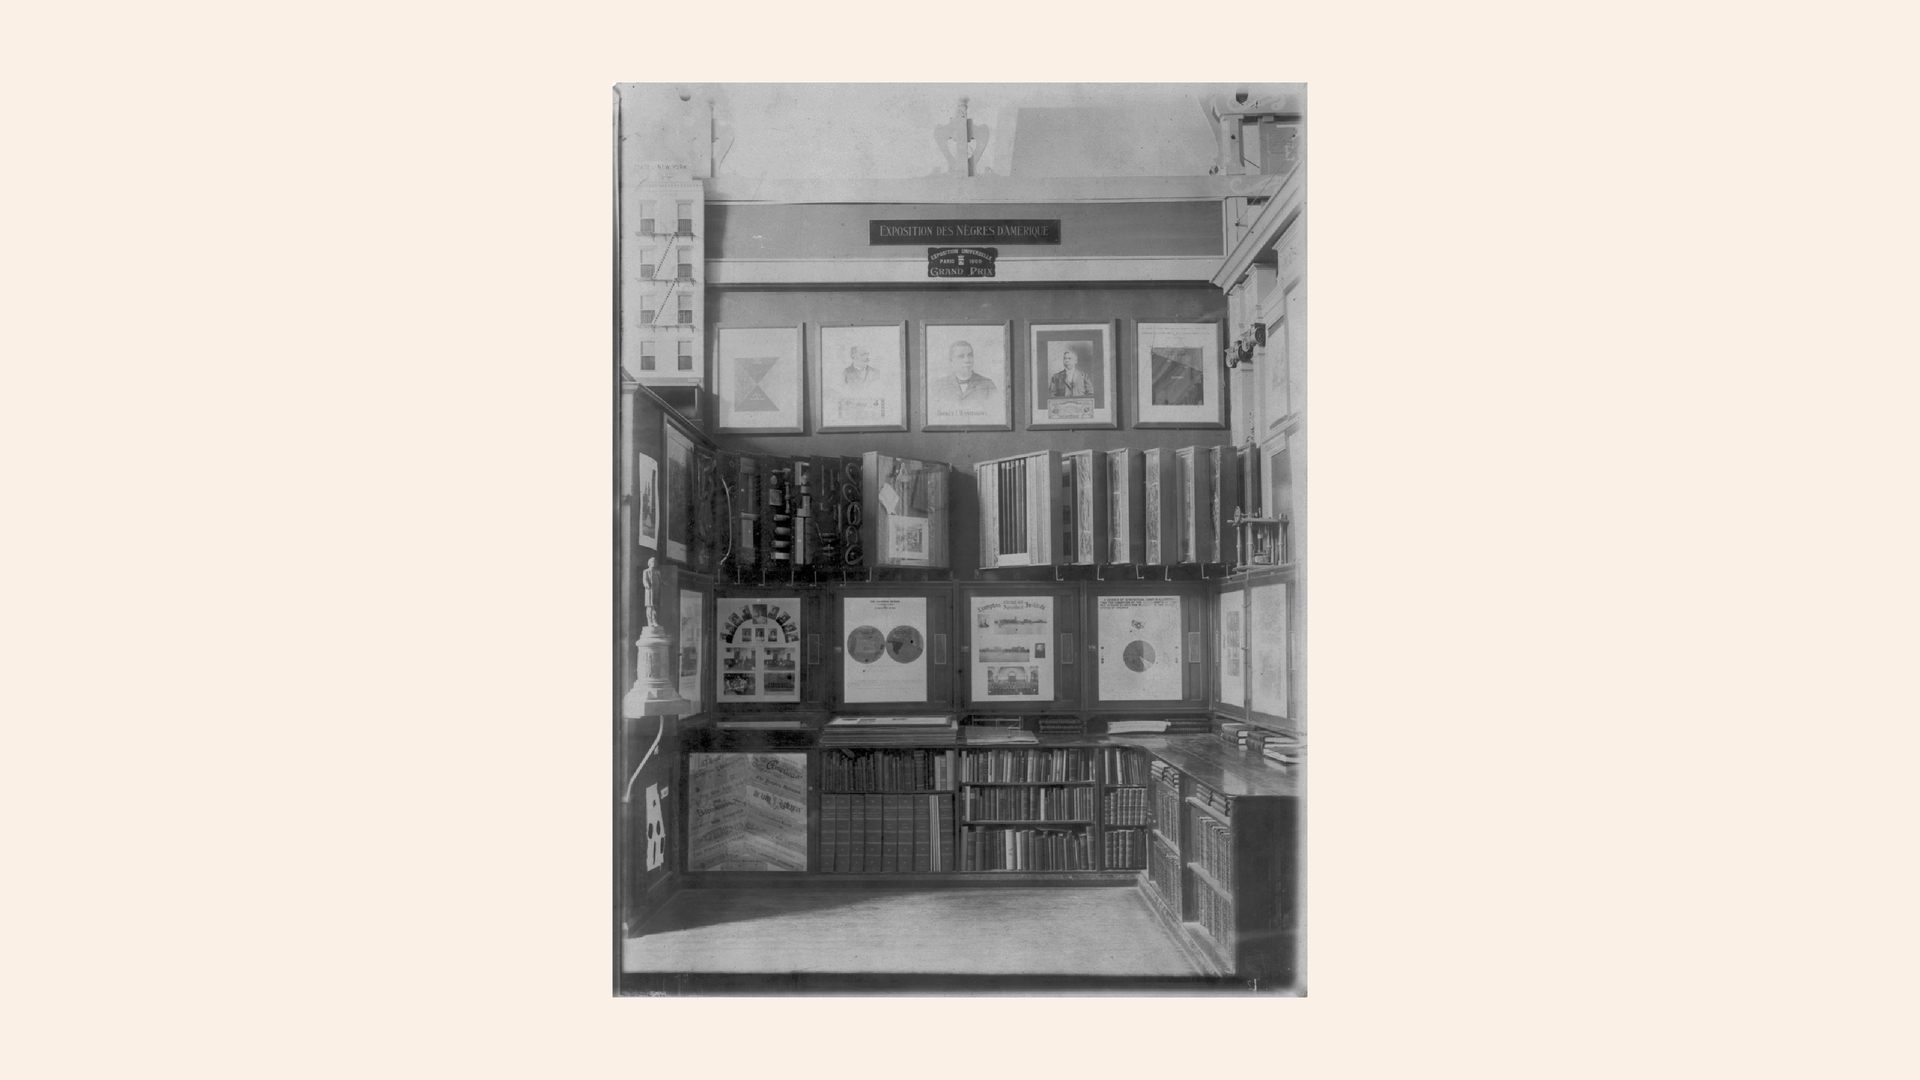
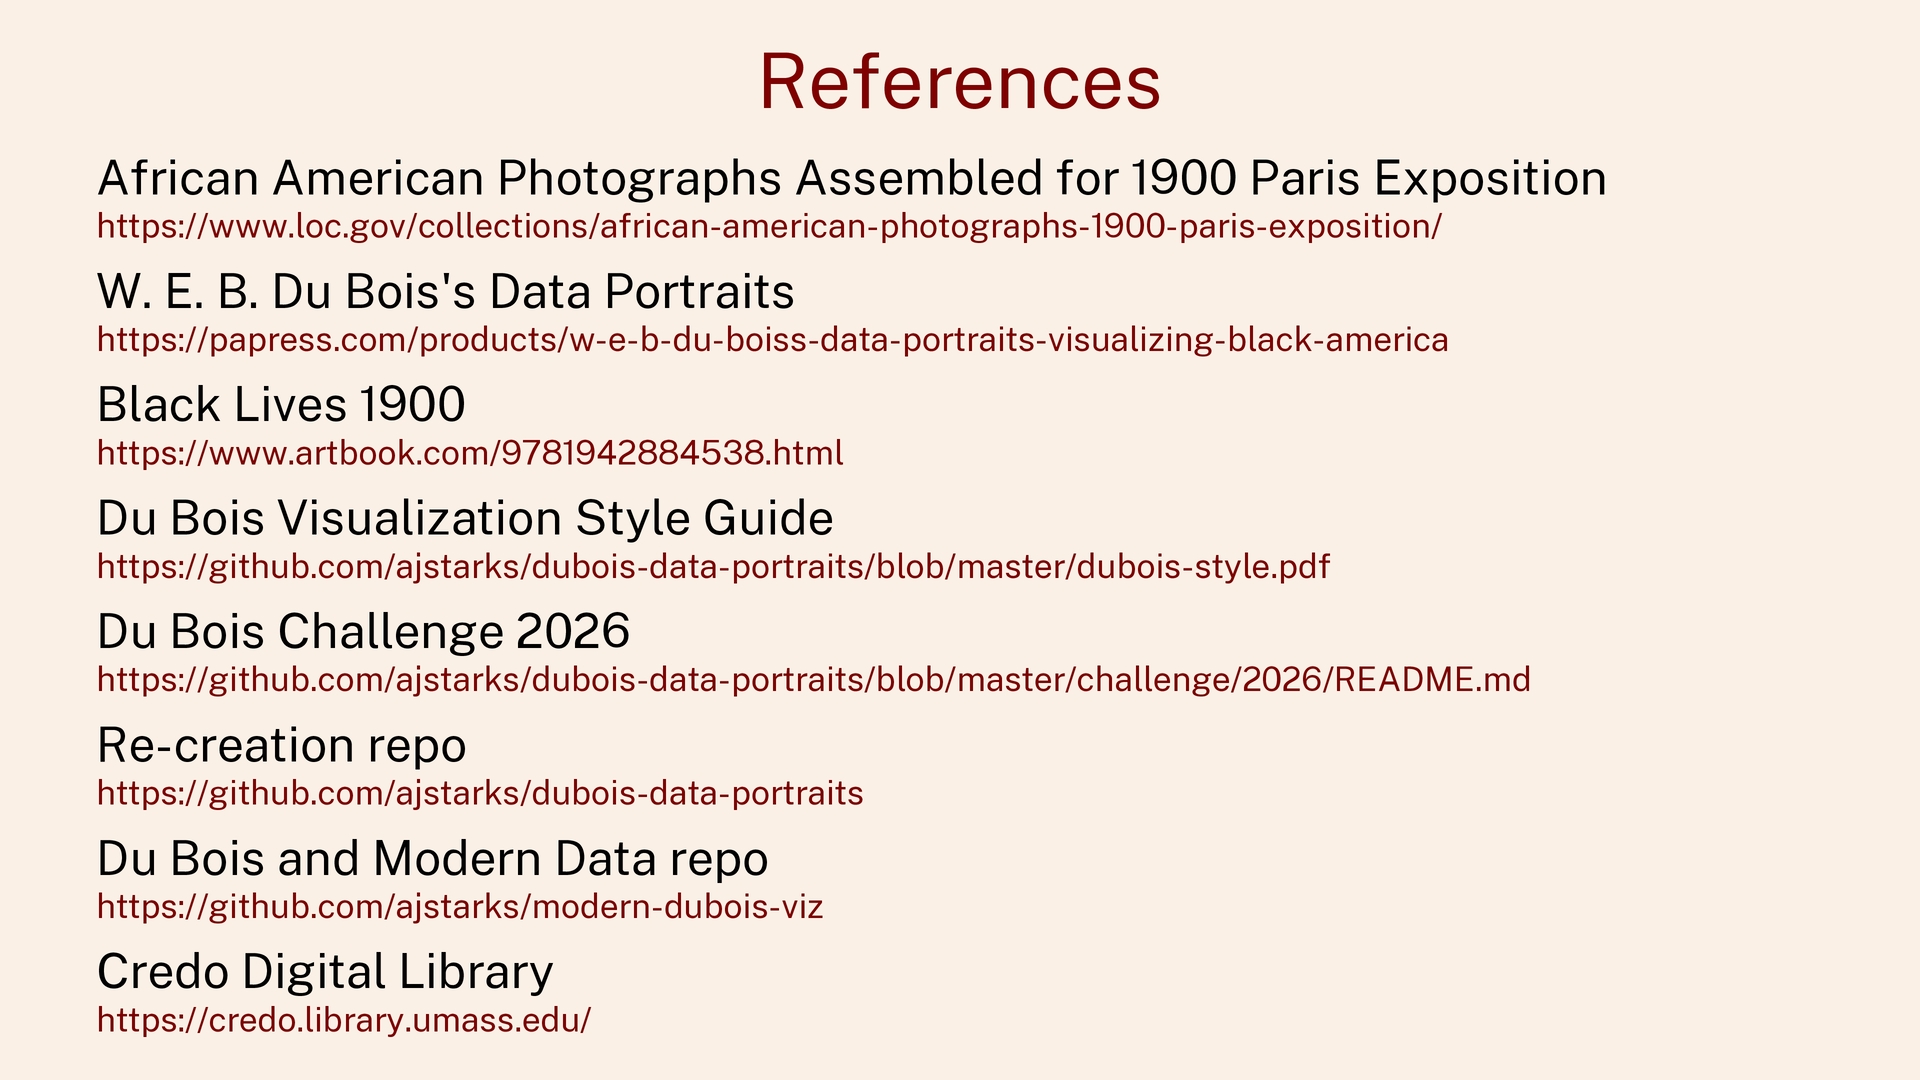
E. B. Du Bois's Data Portraits Black Lives 1900 Du Bois Visualization Style Guide Du Bois Challenge 2026 Re-creation repo Du Bois and Modern Data repo Credo Digital Library https://www.loc.gov/collections/african-american-photographs-1900-paris-exposition/ https://papress.com/products/w-e-b-du-boiss-data-portraits-visualizing-black-america https://www.artbook.com/9781942884538.html https://github.com/ajstarks/dubois-data-portraits/blob/master/dubois-style.pdf https://github.com/ajstarks/dubois-data-portraits/blob/master/challenge/2026/README.md https://github.com/ajstarks/dubois-data-portraits https://github.com/ajstarks/modern-dubois-viz https://credo.library.umass.edu/


 ajstarks
 garyuten
 cygames
 nagatsu
 keita_yoshikawa
 kimichan
 shosira
 ottatto
 isaikaori
 goetter
 seanvraj_arts
 toshihidemurata
 rabernat
 danielanewman
 gurzu
gurzu
 emna__ayadi
 katiecoart
 malarkey
 portentint
 aleyda
 madoxten
 katarinadahlin
 lara
lara






![Anthony J. Starks Art + Code [email protected] github.com/ajstarks speakerdeck.com/ajstarks @ajstarks](https://files.speakerdeck.com/presentations/410e718ff5b74cc09d5f371e50e5c10a/slide_52.jpg)