Upgrade to Pro
— share decks privately, control downloads, hide ads and more …
Speaker Deck
Sign up for free
Menu
Search
Features
All features
Private URLs
Password Protection
Custom URLS
Scheduled publishing
Remove Branding
Restrict embedding
Deck Collections
Notes
Features
All features
Private URLs
Password Protection
Custom URLS
Scheduled publishing
Remove Branding
Restrict embedding
Deck Collections
Notes
Explore
Featured decks
Featured speakers
Programming
Technology
Storyboards
Explore
Featured decks
Featured speakers
Programming
Technology
Storyboards
Pricing
Search
Sign in
Sign up for free
GRADE 9 LINE GRAPHS
Search
Alison Tutors
PRO
October 19, 2026
Education
2
0
Share
Embed
Copy iframe code
Copy JS code
Copy link
Start on current slide
GRADE 9 LINE GRAPHS
These are questions on Line Graphs . They involve drawing and interpretation of line graphs
Alison Tutors
PRO
October 19, 2026
More Decks by Alison Tutors
See All by Alison Tutors
Grade 9 Line Graphs Answers
alisontutors23
PRO
0
3
Grade 9 Histograms Questions
alisontutors23
PRO
0
2
Grade 9 histogram answers
alisontutors23
PRO
0
2
GRADE 9 AVERAGES AND RANGES
alisontutors23
PRO
0
1
Angles in a triangle
alisontutors23
PRO
0
8
Grade 9 Angles in a triangle
alisontutors23
PRO
0
5
Angles in a triangle 2
alisontutors23
PRO
0
9
GRADE 9 CAMBRIDGE IGCSE NUMBERS QUESTIONS
alisontutors23
PRO
0
5
GRADE 9 CAMBRIDGE IGCSE NUMBERS ANSWERS
alisontutors23
PRO
0
4
Other Decks in Education
See All in Education
実践プレゼンテーション・デザイン
dragon2
1
420
マークシート試験のTeX言語を用いた自動採点について
doratex
0
6k
Réunion des directrices et directeurs des écoles de la circonscription de Jonzac - 31 août 2026
fmarot
0
160
INTRODUCTION TO THE CELL
pawan_pharm
0
330
[2026後期火5] 論理学(京都大学文学部 後期 第1回)「名前はあるのに、誰なのかわからない」
yatabe
0
150
新型コロナ禍をともに「楽しみながら開いていこう!」 :中門 吉松 会員(2720 Japan O.K.ロータリーEクラブ)卓話 : 2026.10.19.例会・卓話
2720japanoke
0
150
日本における応用言語学・言語教育学 これまでとこれから
terasawat
0
160
Book-keeping
bvr7352
0
130
2026年度秋学期 統計学 第1回 イントロダクション ー 統計的なものの見方・考え方について (2026. 9. 29)
akiraasano
PRO
0
250
響け!ユーフォニアムと考える「決め方」/Thinking About Decision-Making with Sound! Euphonium
3l4l5
1
200
AIでアウトプットできる時代だからこそ、自分の言葉で考えることの大切さ / What's Left to Think, When AI Can Write?
masakiokuda
1
360
Design Guidelines and Models - Lecture 5 - Human-Computer Interaction (1023841ANR)
signer
PRO
0
1.7k
Featured
See All Featured
The Director’s Chair: Orchestrating AI for Truly Effective Learning
tmiket
1
330
Tips & Tricks on How to Get Your First Job In Tech
honzajavorek
1
800
Build The Right Thing And Hit Your Dates
maggiecrowley
39
3.5k
The MySQL Ecosystem @ GitHub 2015
samlambert
251
13k
Evolution of real-time – Irina Nazarova, EuRuKo, 2024
irinanazarova
9
1.6k
GraphQLの誤解/rethinking-graphql
sonatard
75
12k
Designing for humans not robots
tammielis
254
26k
Design and Strategy: How to Deal with People Who Don’t "Get" Design
morganepeng
133
20k
Leveraging LLMs for student feedback in introductory data science courses - posit::conf(2025)
minecr
1
430
Unsuck your backbone
ammeep
672
58k
Paper Plane
katiecoart
PRO
5
54k
Scaling GitHub
holman
464
140k
Transcript
Name: Exam Style Questions Ensure you have: Pencil, pen, ruler,
protractor, pair of compasses and eraser You may use tracing paper if needed Guidance 1. Read each question carefully before you begin answering it. 2. Donʼt spend too long on one question. 3. Attempt every question. 4. Check your answers seem right. 5. Always show your workings Revision for this topic © Corbettmaths 2015
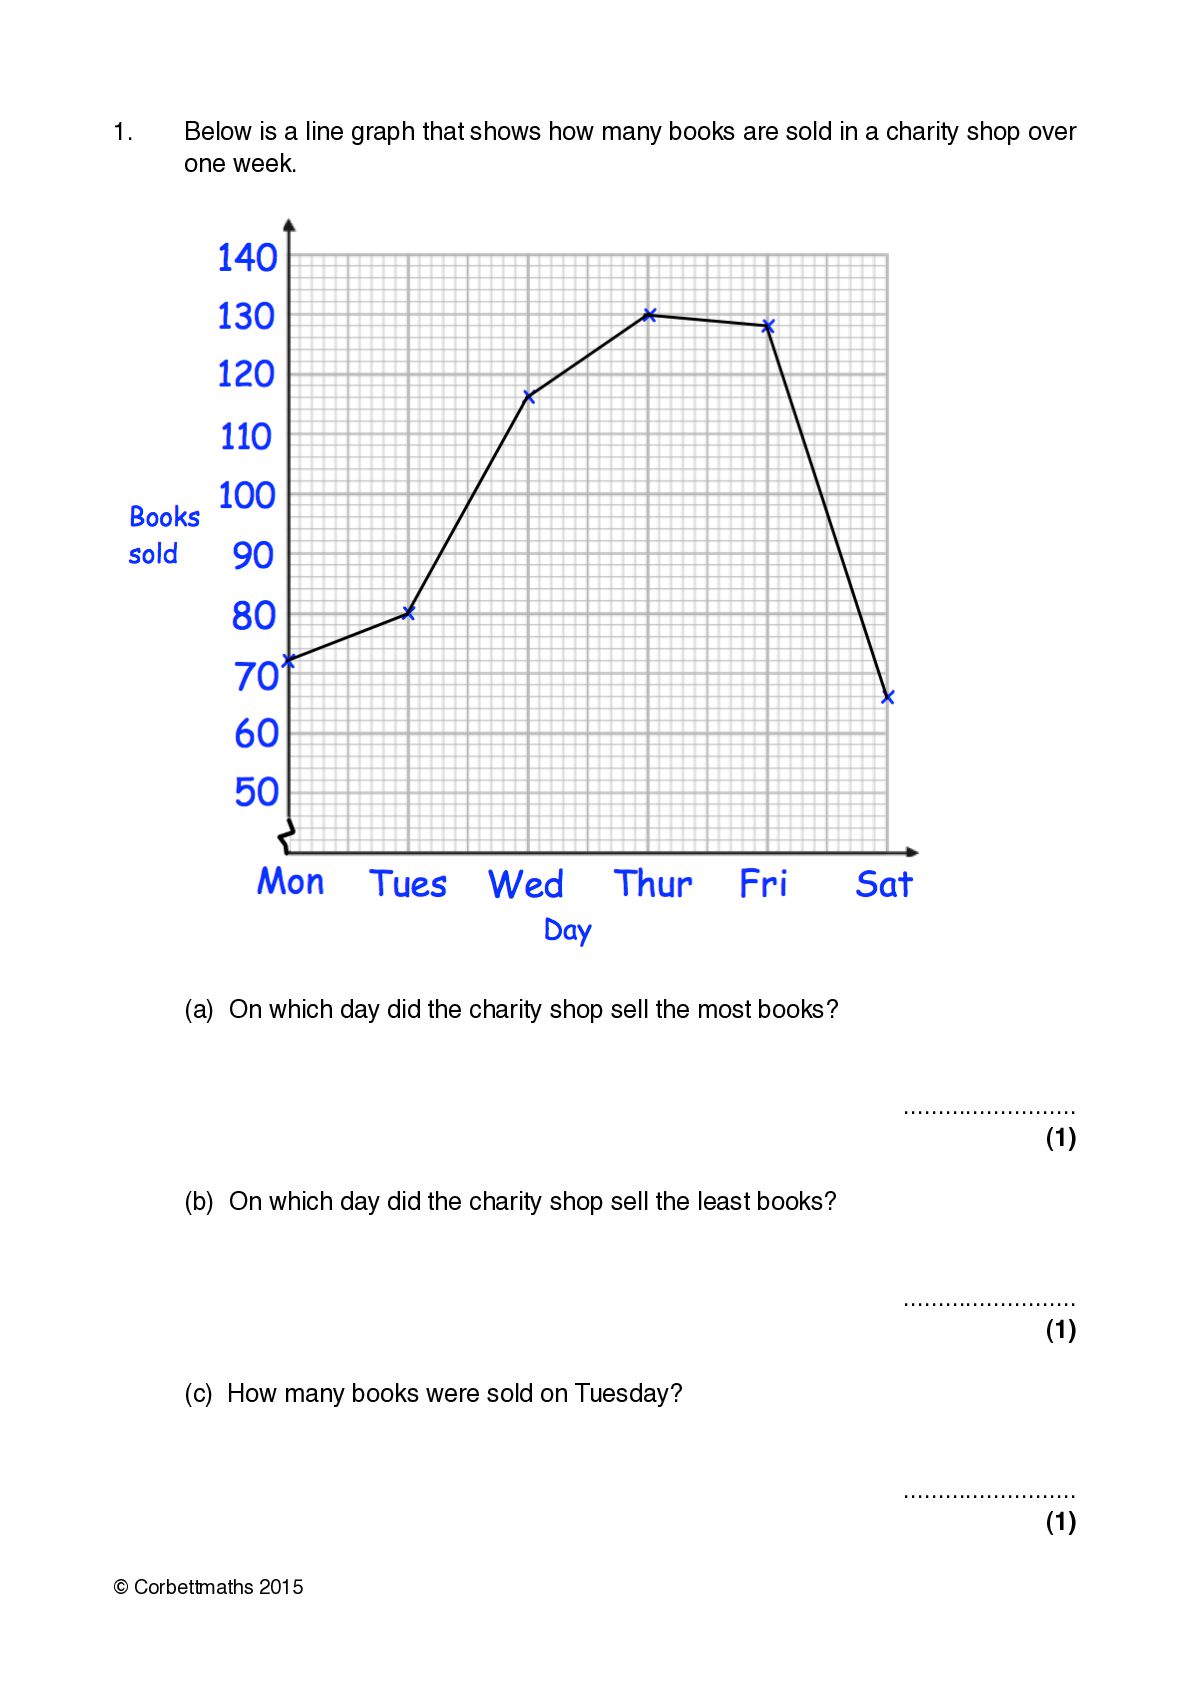
1.! ! Below is a line graph that shows how
many books are sold in a charity shop over one week. ! (a) On which day did the charity shop sell the most books? ......................... (1) ! (b) On which day did the charity shop sell the least books? ......................... (1) ! (c) How many books were sold on Tuesday? ......................... (1) © Corbettmaths 2015
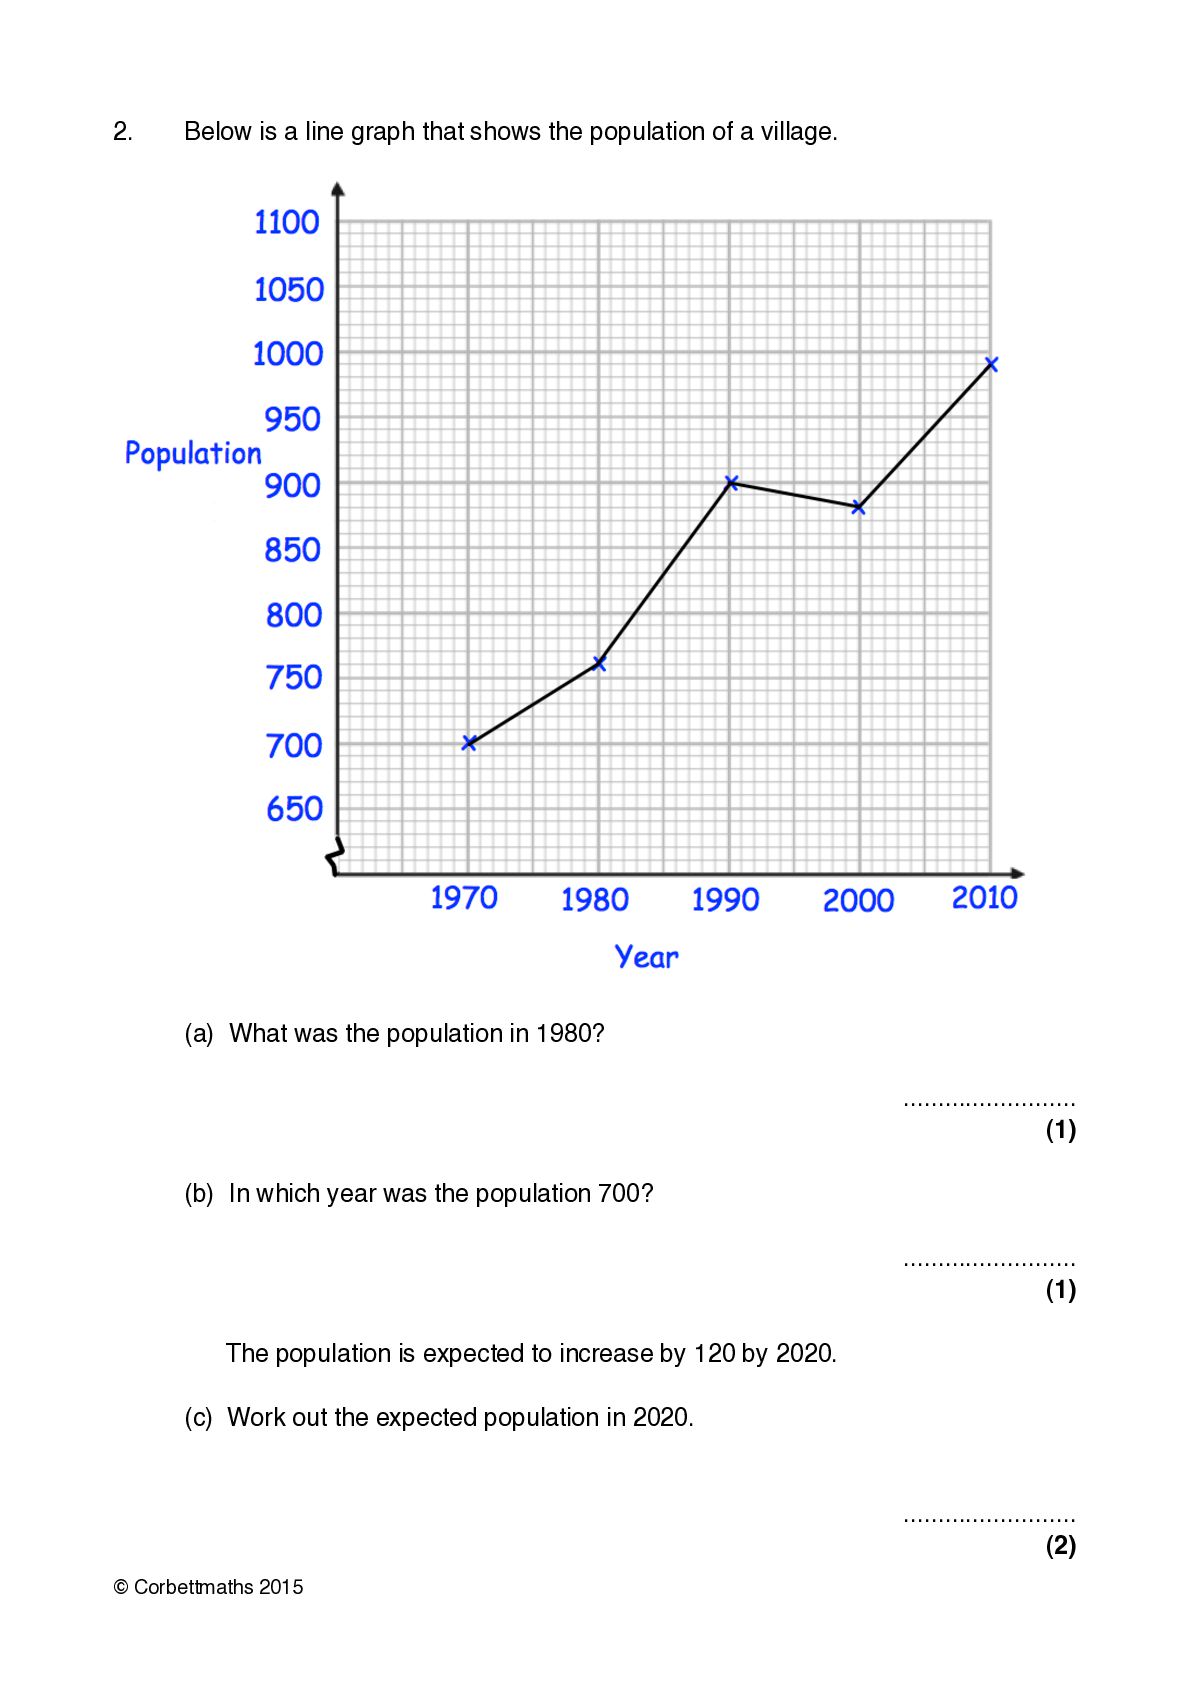
2.! Below is a line graph that shows the population
of a village. ! (a) What was the population in 1980? ......................... (1) ! (b) In which year was the population 700? ......................... (1) ! ! The population is expected to increase by 120 by 2020. (c) Work out the expected population in 2020. ......................... (2) © Corbettmaths 2015
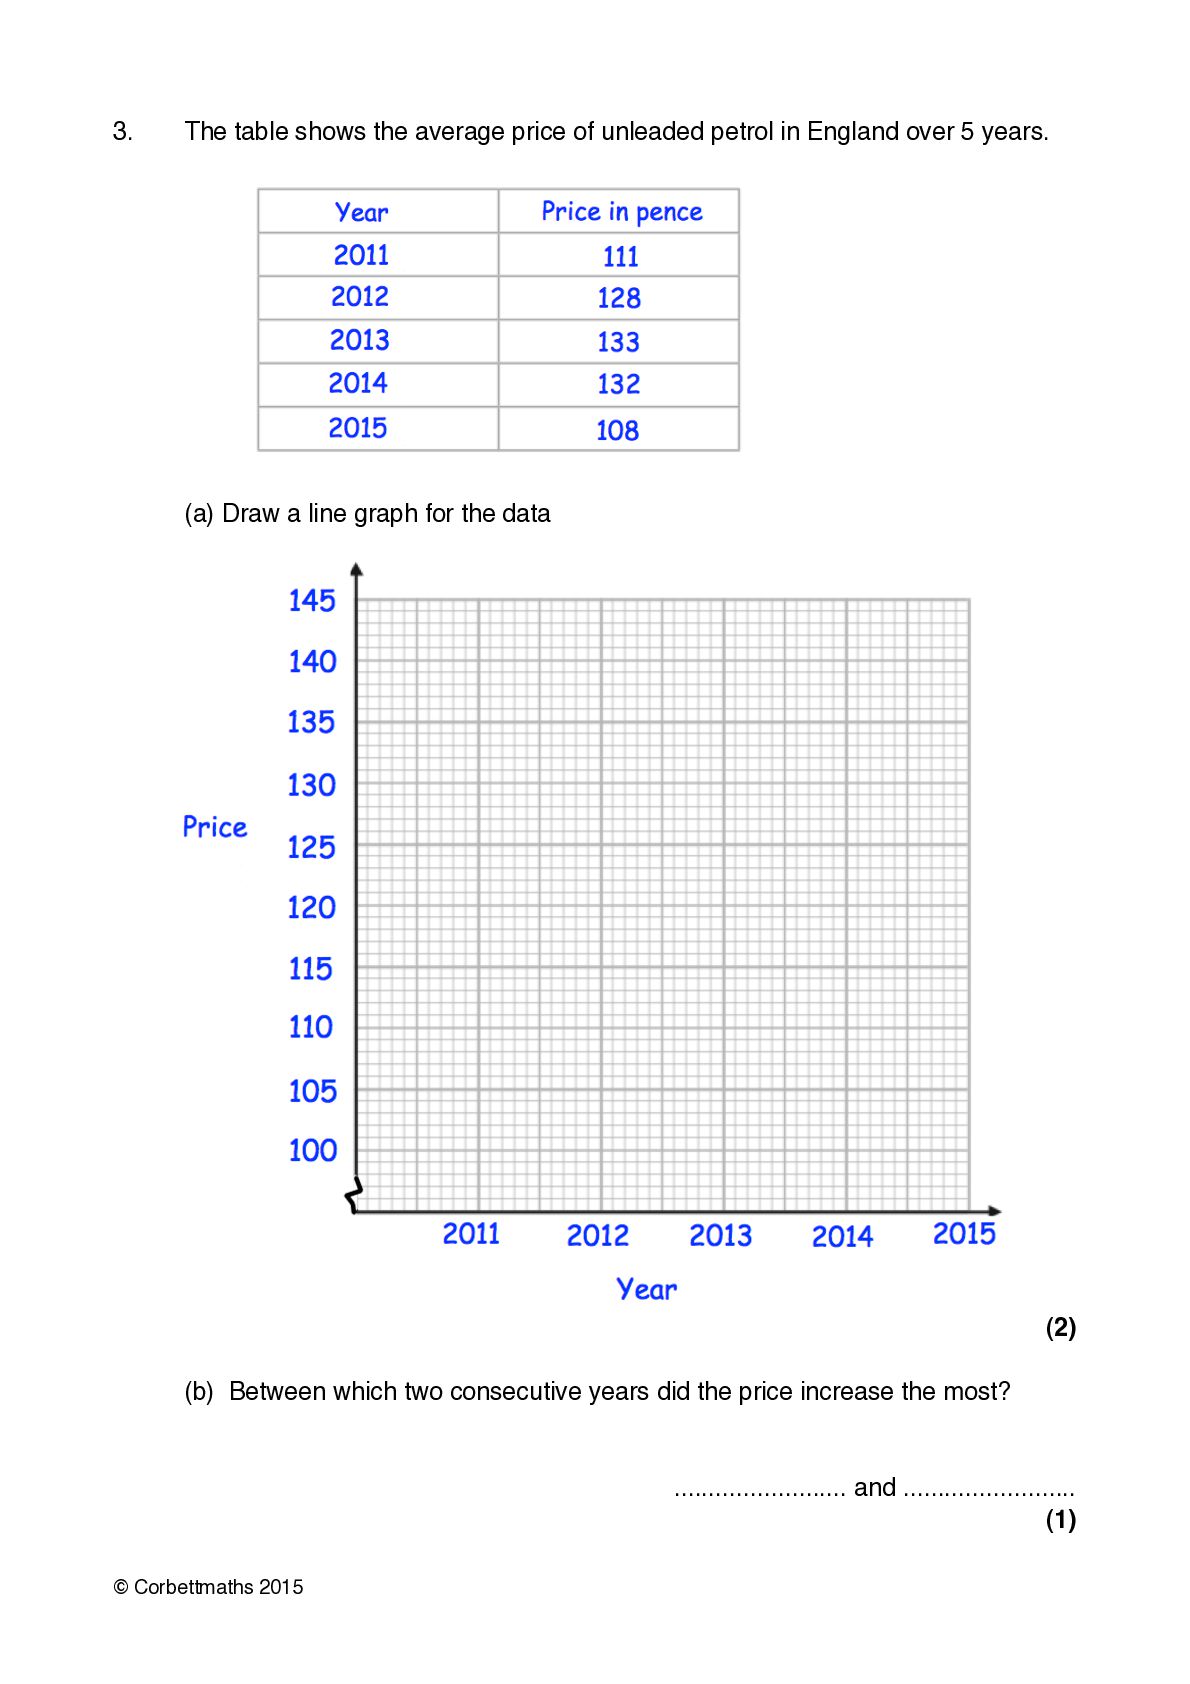
3.! The table shows the average price of unleaded petrol
in England over 5 years. ! ! ! (a) Draw a line graph for the data (2) ! (b) Between which two consecutive years did the price increase the most? ......................... and ......................... (1) © Corbettmaths 2015
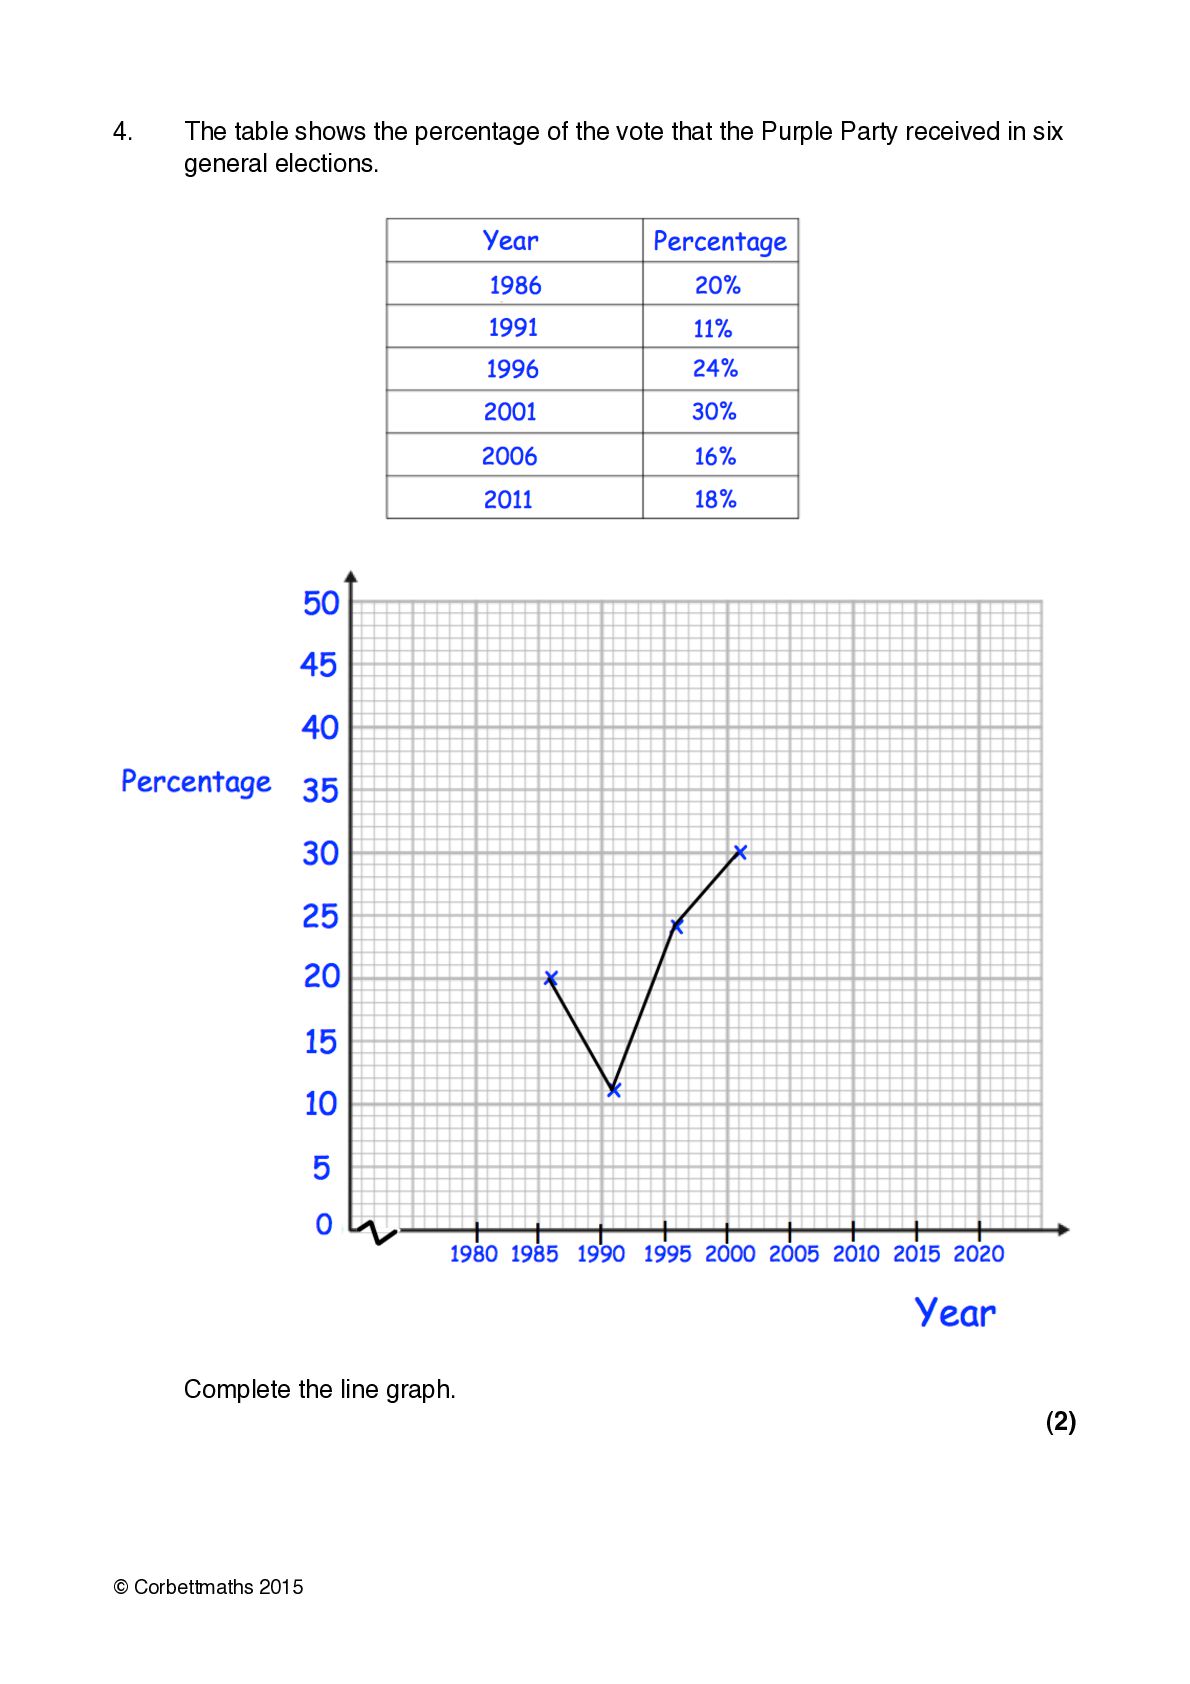
4.! ! The table shows the percentage of the vote
that the Purple Party received in six general elections. ! Complete the line graph. (2) © Corbettmaths 2015
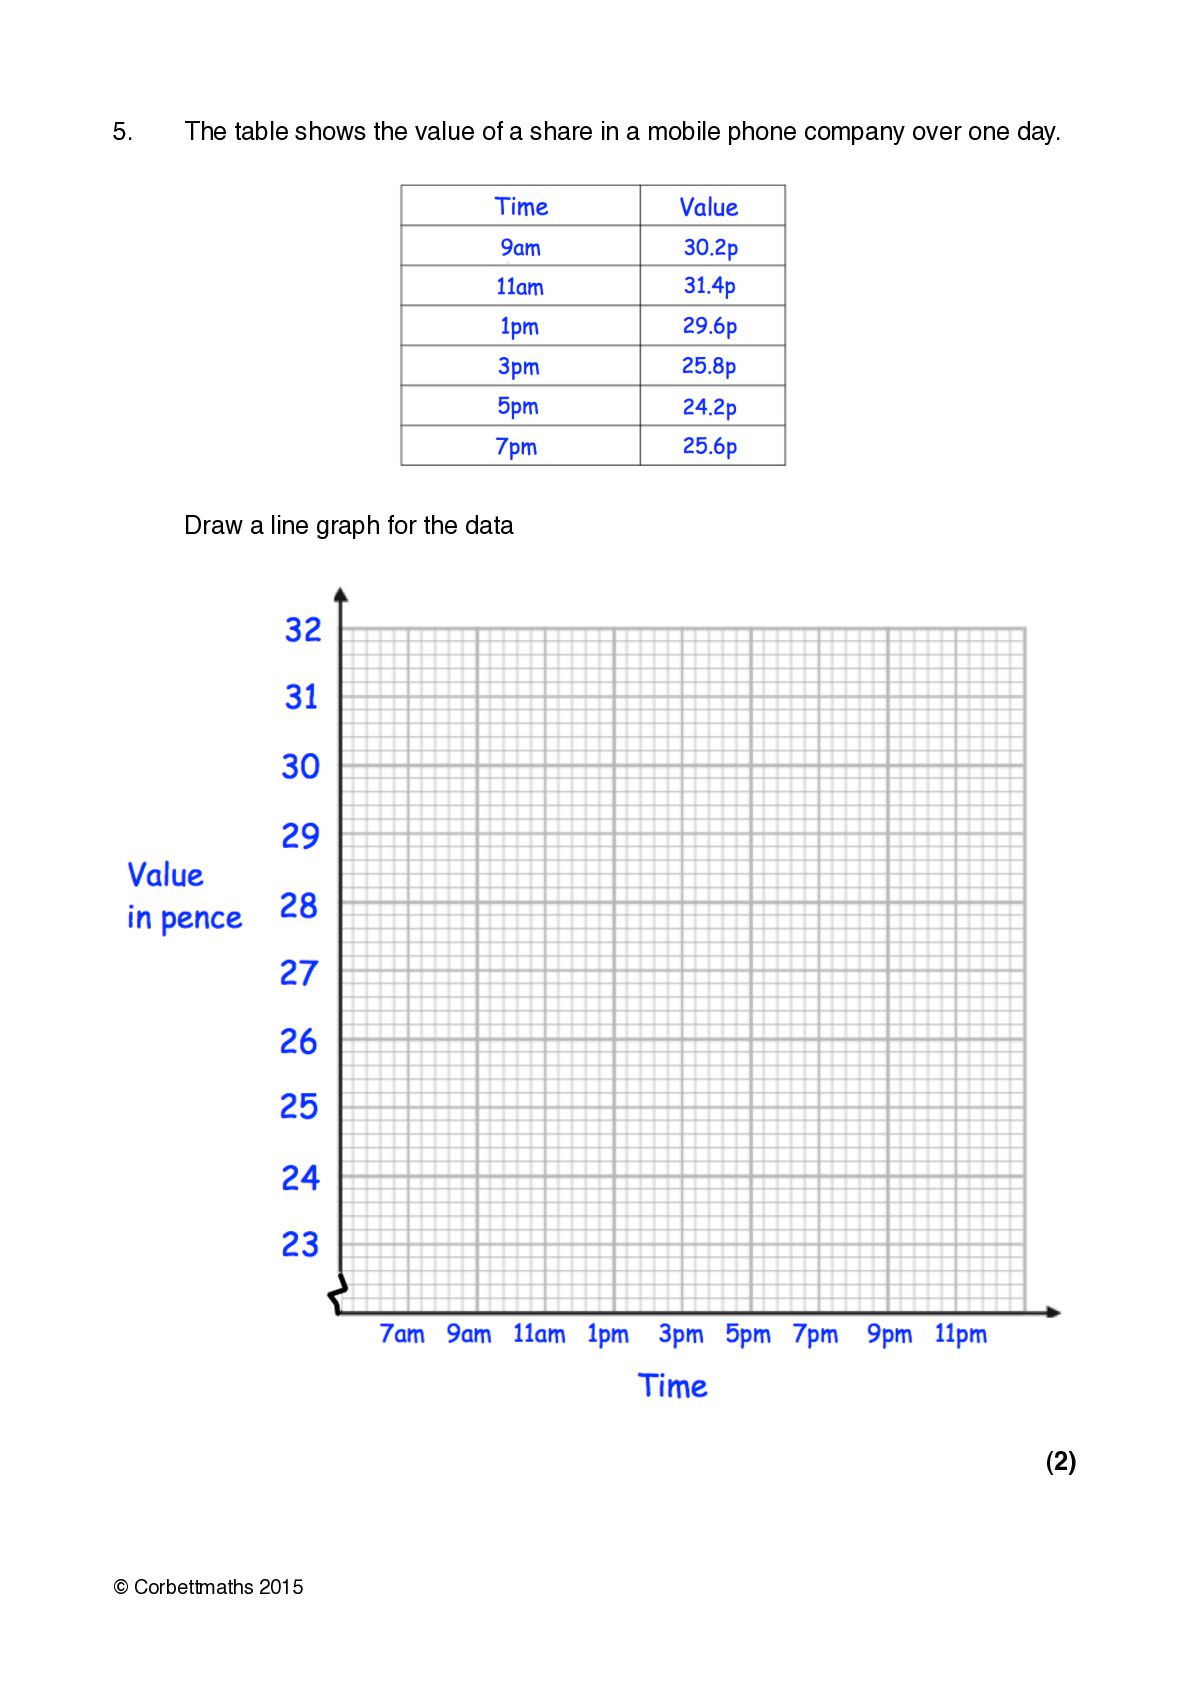
5.! The table shows the value of a share in
a mobile phone company over one day. ! Draw a line graph for the data (2) © Corbettmaths 2015
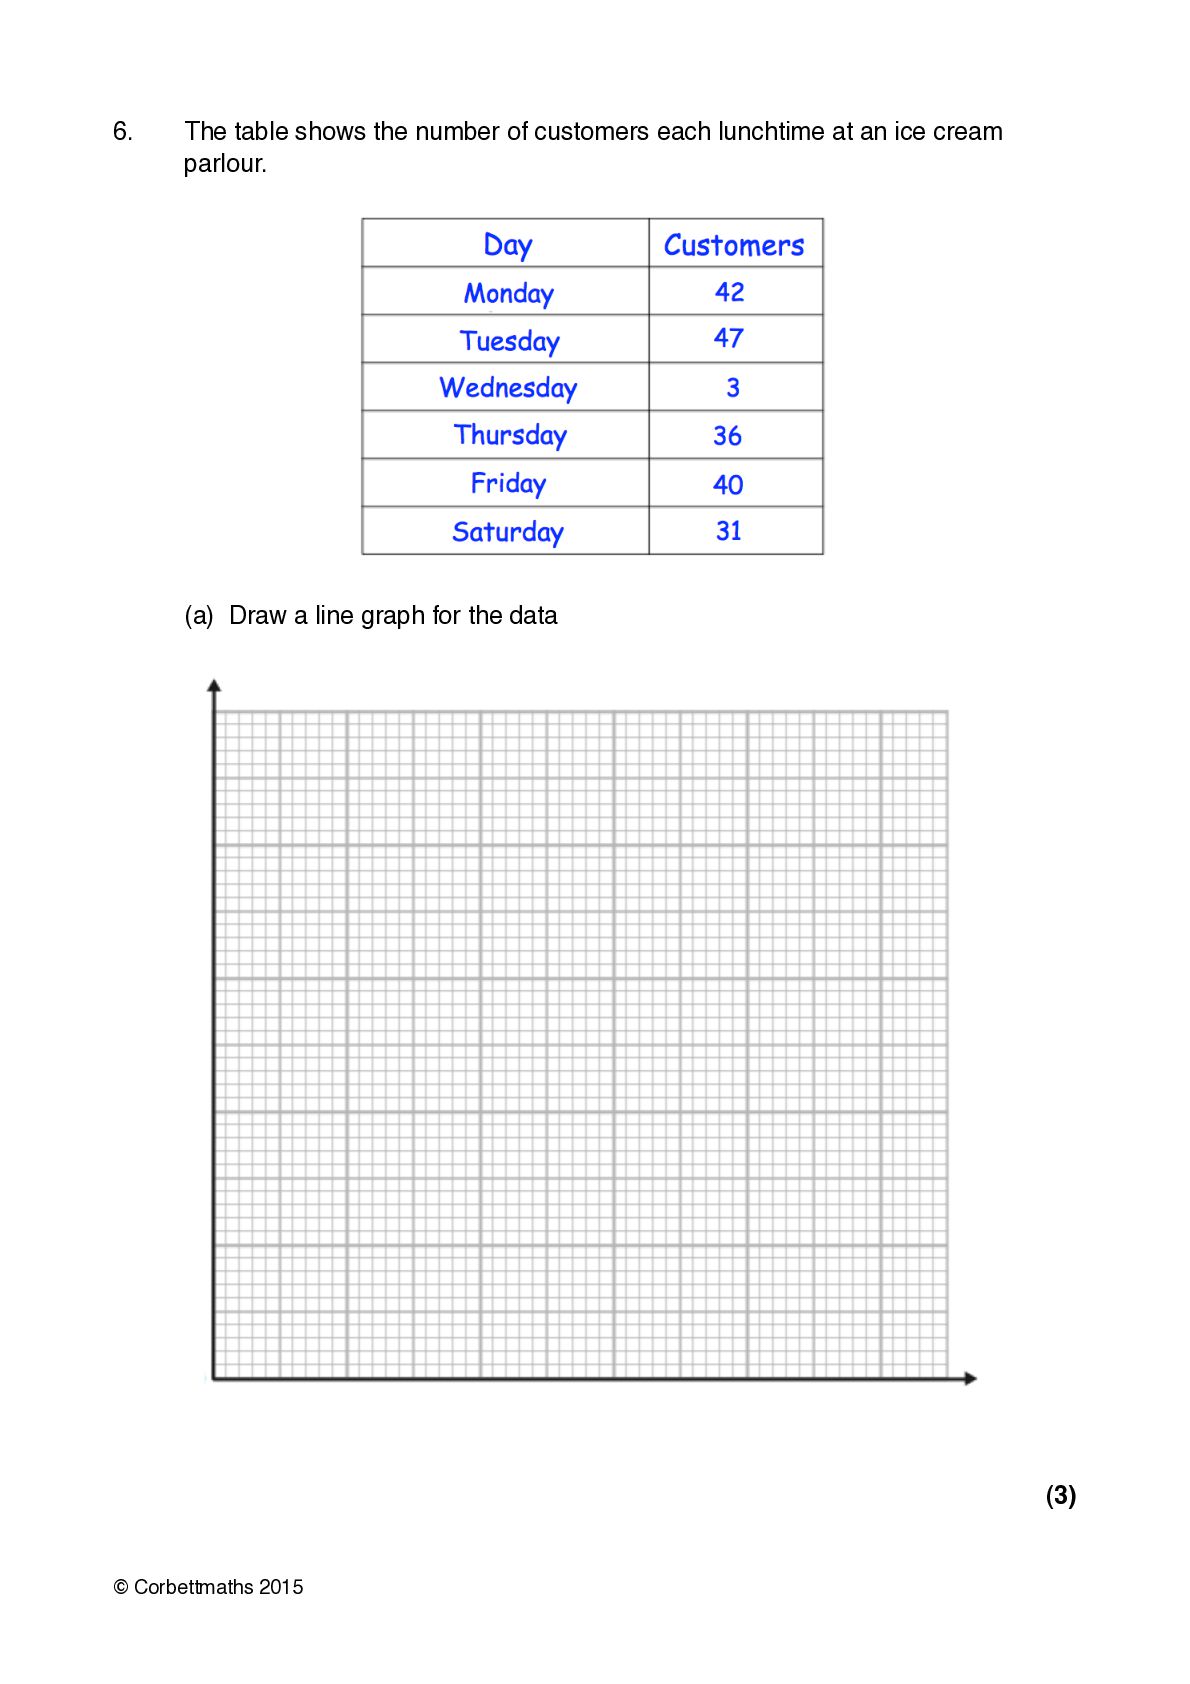
6.! ! The table shows the number of customers each
lunchtime at an ice cream parlour. ! (a) Draw a line graph for the data (3) © Corbettmaths 2015
! (b) On which day did the ice cream parlour
have the most customers? ......................... (1) ! (c) Work out how many customers visited the ice cream parlour in total. ......................... (2) ! ! (d) Give a possible reason why there were only 3 visitors to the ice cream parlour on Wednesday. ......................................................................................................................... ......................................................................................................................... ......................................................................................................................... (1) © Corbettmaths 2015


 alisontutors23
 dragon2
 doratex
 fmarot
 pawan_pharm
 yatabe
 2720japanoke
 terasawat
 bvr7352
 akiraasano
 3l4l5
 masakiokuda
 signer
 tmiket
 honzajavorek
 maggiecrowley
 samlambert
 irinanazarova
 sonatard
 tammielis
 morganepeng
 minecr
 ammeep
 katiecoart
 holman