Upgrade to Pro
— share decks privately, control downloads, hide ads and more …
Speaker Deck
Features
Speaker Deck
PRO
Sign in
Sign up for free
Search
Search
Debugging and Profiling Rails App
Search
David Paluy
January 28, 2013
How-to & DIY
240
3
Share
Embed
Copy iframe code
Copy JS code
Copy link
Start on current slide
Debugging and Profiling Rails App
Overview of Debugging and Profiling tools for Rails
David Paluy
January 28, 2013
More Decks by David Paluy
See All by David Paluy
LLM Telemetry & Evals as First Class Rails Concerns - BlueRidgeRuby 2026
dpaluy
0
44
Tools to help you better understand the code
dpaluy
0
150
Ruby On Rails coding conventions, standards and best practices
dpaluy
1
1.5k
Faster on Rails
dpaluy
2
230
How to Prepare 3 min Fundraising Presentation
dpaluy
0
1k
Other Decks in How-to & DIY
See All in How-to & DIY
キャリア科目では教えてくれない、就活を生き抜く法則
logica0419
2
300
生成AIは 『コードを書く』だけじゃない アーキテクチャ設計から環境構築まで——社内データ活用DXの全貌
punipuni_mint
0
210
Goカードゲームを 作ってみた!
senoue
0
280
Node-REDで制御できるエッジカメラのreCameraを触る #iotlt #JLCPCB #recamera
n0bisuke2
0
190
JAWS-UG/AWSコミュニティ アップデート (JAWS-UG函館支部)
awsjcpm
3
170
画面の向こうから「気づき」を得る 画面の向こうを「物差し」として捉える
subroh0508
1
390
EmbeddingGemmaをDifyから使いたいけどAPI経由はつまらん #iotlt #gemma #dify
n0bisuke2
0
210
チームパフォーマンスを高めるための2種類のセルフマネジメント / Two Types of Self-Management for Improving Team Performance
iwashi86
4
810
Burnoutとの「対話」 〜 アジャイルコーチングを活用した、燃え尽き症候群を克服するスキル 〜 / Dialogue with Burnout by Using Agile Coaching Skills
hageyahhoo
0
1k
ROSAというLLM使ったROSエージェントをおもちゃに実装してみた話
takeofuture
0
250
AIツール“三種の神器”ではじめる 自動運転AIチャレンジ
covao
0
100
파이썬 토룡신점 운영후기
lqez
0
560
Featured
See All Featured
The Director’s Chair: Orchestrating AI for Truly Effective Learning
tmiket
1
220
Product Roadmaps are Hard
iamctodd
55
12k
How to Think Like a Performance Engineer
csswizardry
28
2.7k
Ecommerce SEO: The Keys for Success Now & Beyond - #SERPConf2024
aleyda
1
2.1k
Building Better People: How to give real-time feedback that sticks.
wjessup
370
20k
Heart Work Chapter 1 - Part 1
lfama
PRO
8
36k
Deep Space Network (abreviated)
tonyrice
0
230
Leo the Paperboy
mayatellez
8
1.9k
Measuring Dark Social's Impact On Conversion and Attribution
stephenakadiri
2
240
The State of eCommerce SEO: How to Win in Today's Products SERPs - #SEOweek
aleyda
2
11k
Marketing Yourself as an Engineer | Alaka | Gurzu
gurzu
0
260
Exploring the relationship between traditional SERPs and Gen AI search
raygrieselhuber
PRO
2
4.2k
Transcript
Debugging and Profiling Rails App David Paluy January 2013
None
Ruby is eating RAM
Agenda • “Winter is coming!” • Garbage Collector • Debug
Tools • Profiling Tools
The Task: Send ~30,000 e-mails
Result Before
How Ruby Works? Physical RAM Process Heap Ruby Heap Ruby
Heap Ruby Object Ruby Object Ruby Object Ruby Object Ruby Object Ruby Object
New Object allocation Free List A L L O C
A T E D F R E E
New Object allocation Free List A L L O C
A T E D
New Object allocation Free List is empty A L L
O C A T E D
New Object allocation Free List is empty – Call GC
A L L O C A T E D
GC Process • GC finds non-reachable objects and adds them
to Free List • If Free List is still empty, another Heap allocated
MRI GC • “Conservative”: any bit pattern could be a
pointer (may produce false positive) • “Stop the world”: no other Ruby code can execute during GC • “Mark & Sweep”: mark all objects in use, than sweep away unmarked objects
More Objects => Longer GC => Slow
In our case – Out of Memory!
How to Debug? • gem "pry-debugger" https://github.com/nixme/pry-debugger • gem "debugger-pry"
https://github.com/pry/debugger-pry
Tools • ObjectSpace.count_objects • GC debug - Enable heap dump
support • gdb.rb (only Linux) Note: memprof works only with Ruby 1.8
ObjectSpace.count_objects
Enable heap dump support to Ruby Install custom patched version
of ruby Usage:
https://github.com/tmm1/gdb.rb Attached to existing process and examine the HEAP
Result After
Profiling Tools • Ruby Benchmark • ruby-prof • perftools.rb (Google
perftools for Ruby)
Benchmark • gem 'benchmark_suite' https://github.com/evanphx/benchmark_suite
ruby-prof gem 'ruby-prof' https://github.com/rdp/ruby-prof
ruby-prof Measurements • process time (RubyProf::PROCESS_TIME) • wall time (RubyProf::WALL_TIME)
• cpu time (RubyProf::CPU_TIME) • object allocations (RubyProf::ALLOCATIONS) • memory usage (RubyProf::MEMORY) • garbage collections runs (RubyProf::GC_RUNS) • garbage collection time (RubyProf::GC_TIME)
perftools.rb https://github.com/tmm1/perftools.rb gem 'rack-perftools_profiler', :require => 'rack/perftools_profiler'
rack-perftools_profiler usage
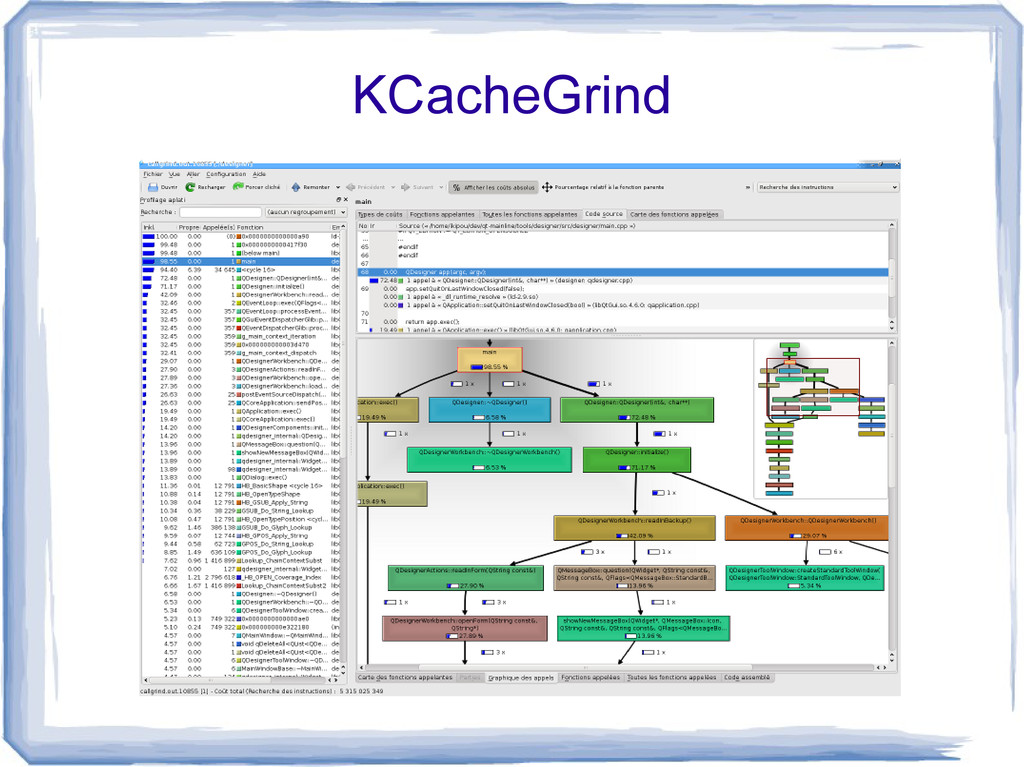
KCacheGrind
Summary • More Objects => Longer GC => Slow •
Examine your HEAP • Use Tools
Q&A http://dpaluy.github.com @dpaluy
[email protected]
http://www.linkedin.com/in/davidpaluy
![Q&A http://dpaluy.github.com @dpaluy [email protected] http://www.linkedin.com/in/davidpaluy](https://files.speakerdeck.com/presentations/247068904c18013061e712313d2a504d/slide_29.jpg)