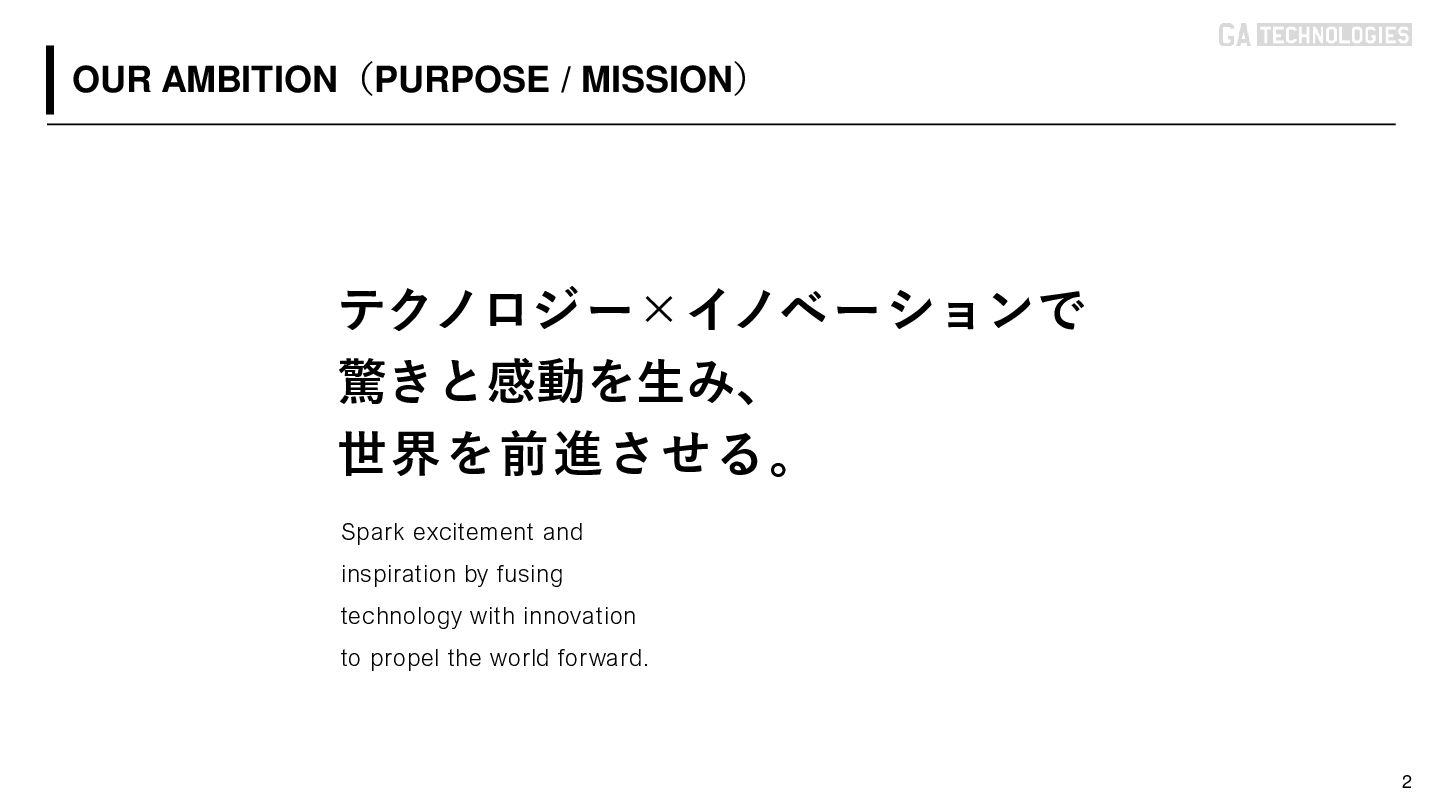
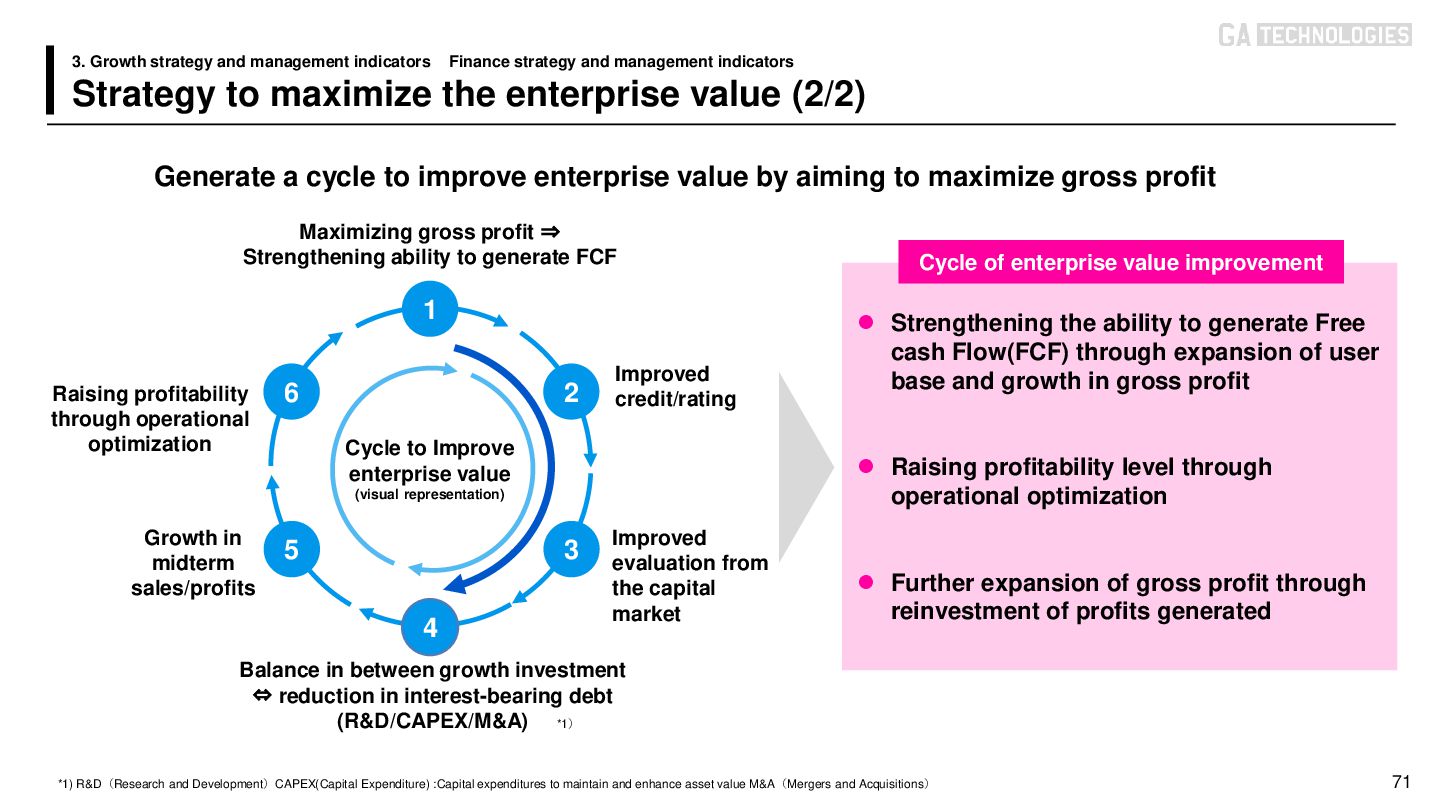
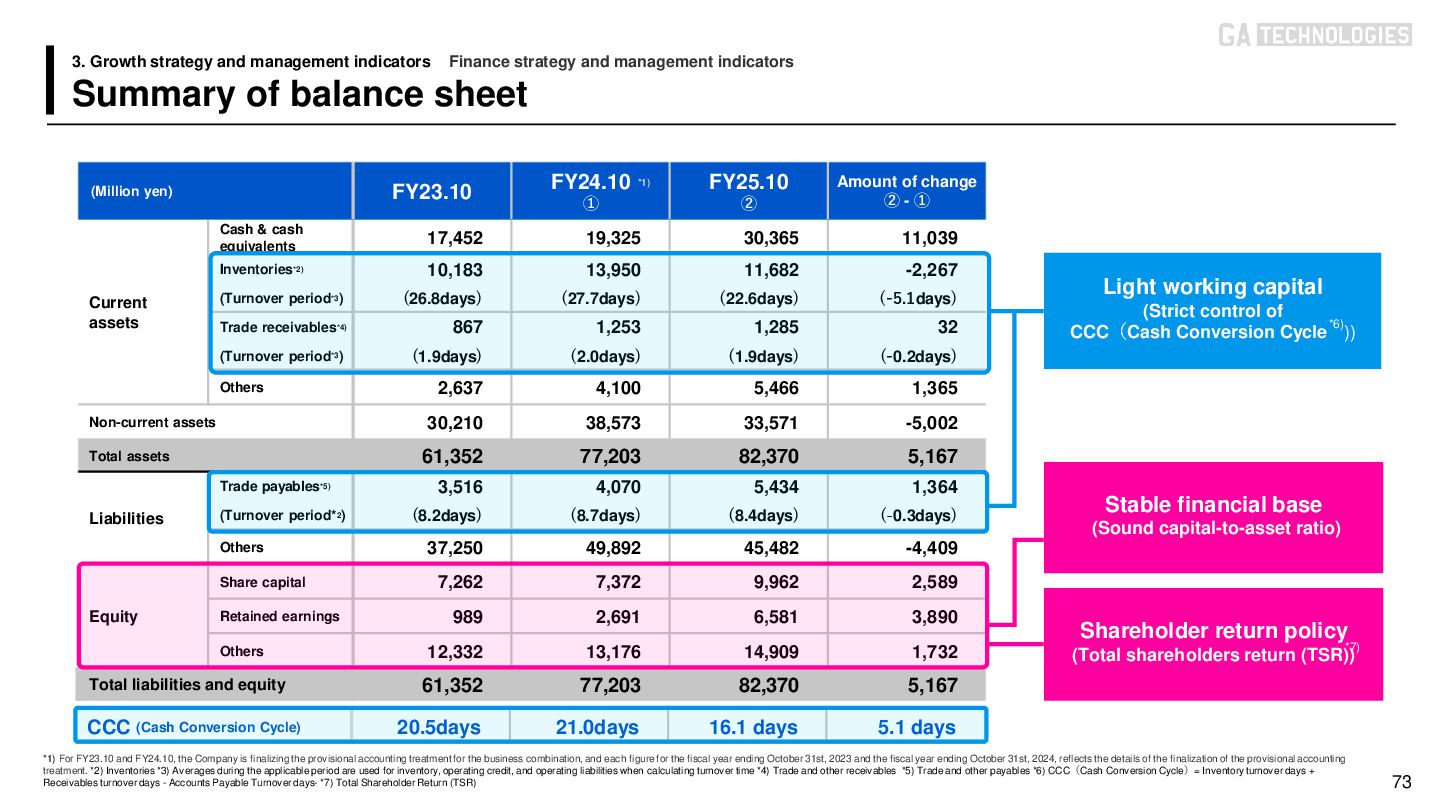
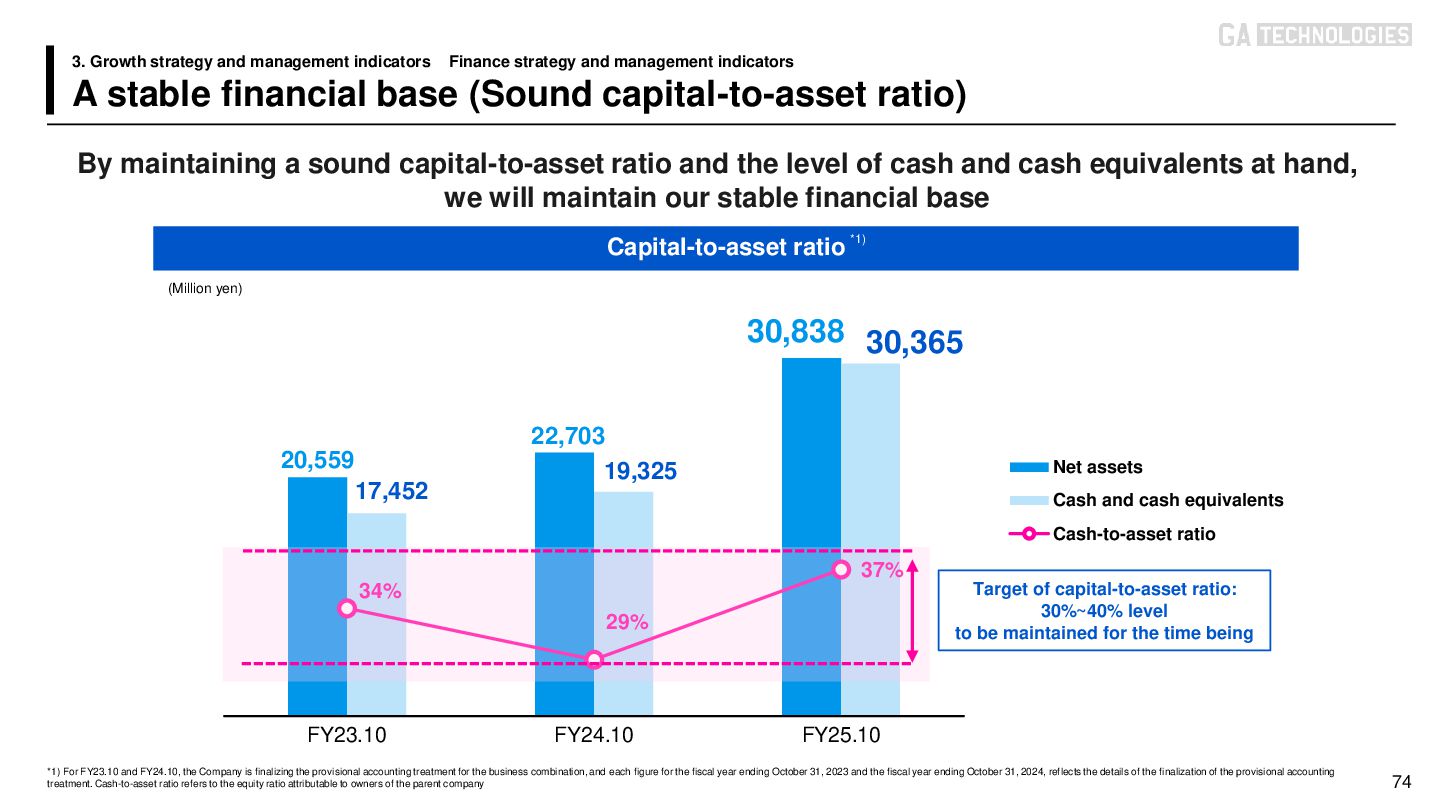
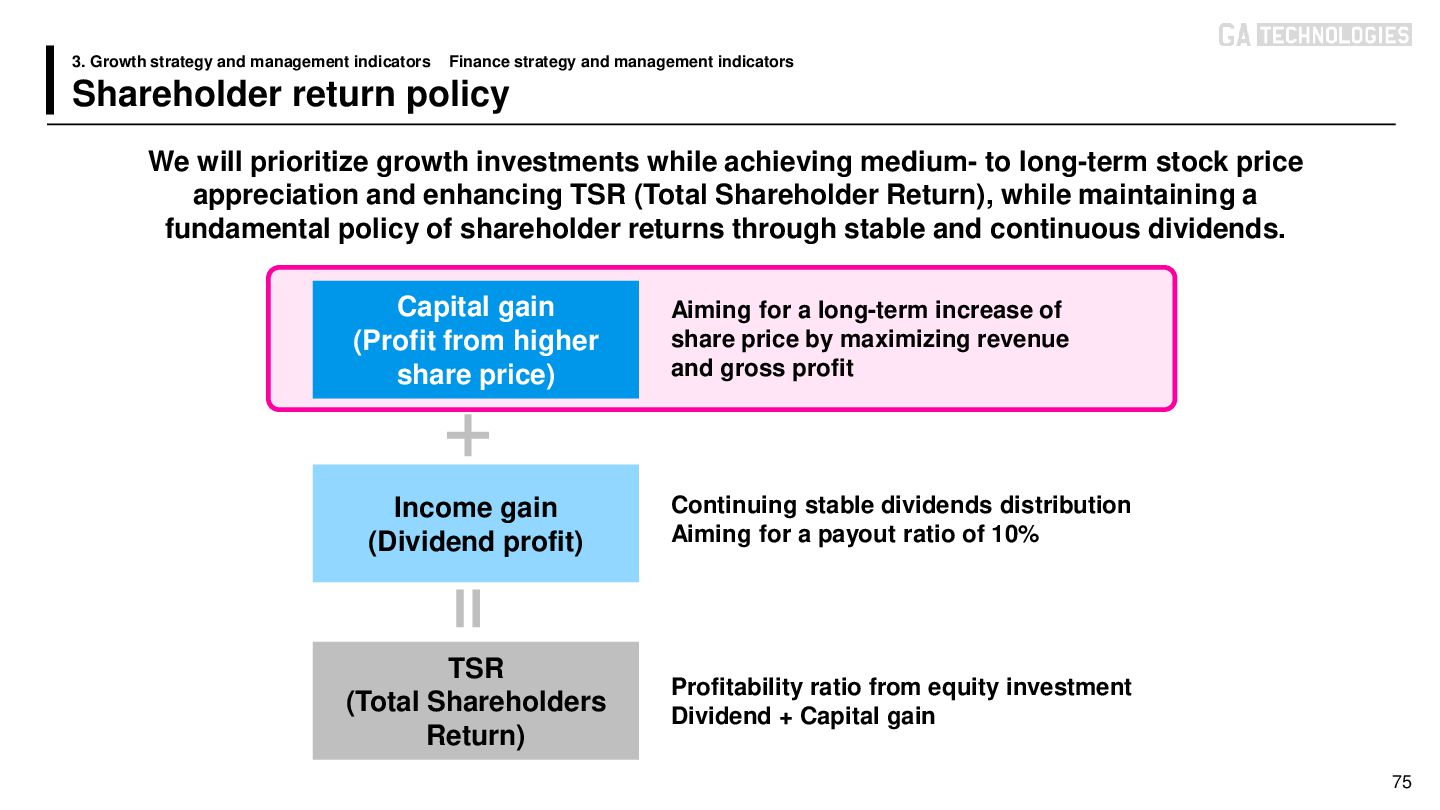
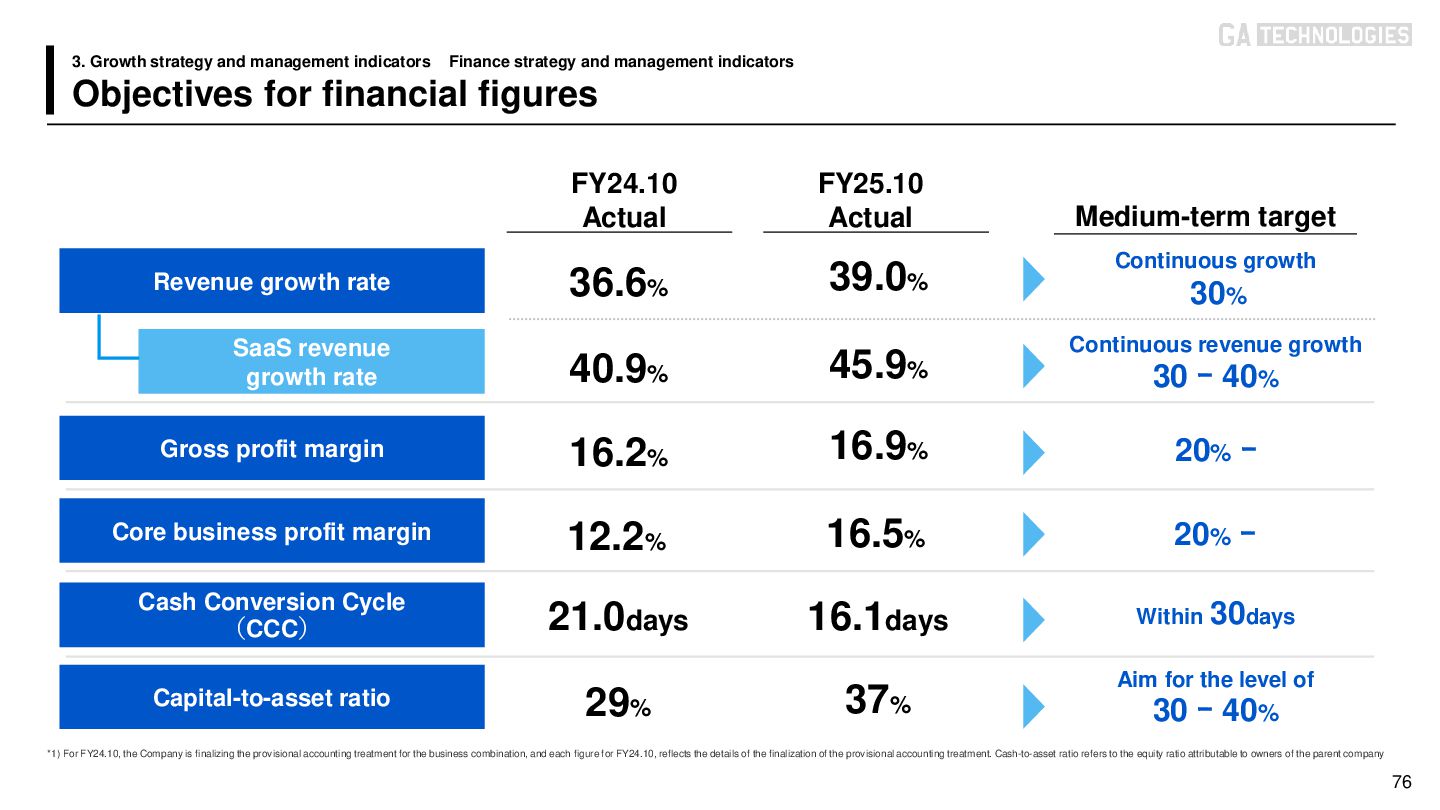
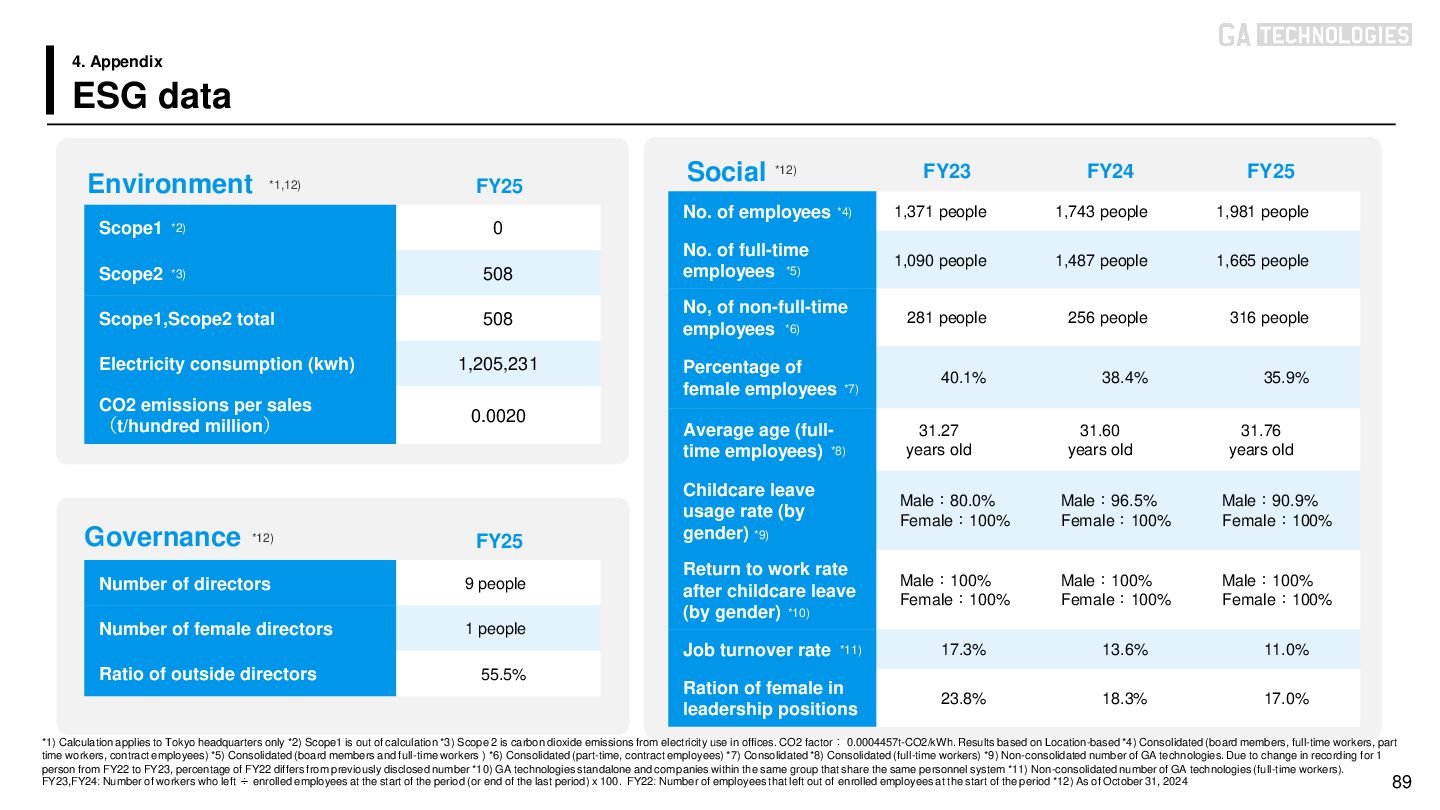
indicators Finance strategy and management indicators *1) For FY26.10, we finalized the provisional accounting treatment for the business combinations, and each figure for FY25.10 reflects the details of the finalization of the provisional accounting treatment *2) Inventories *3) Averages during the applicable period are used for inventory, operating credit, and operating liabilities when calculating turnover time *4) Trade and other receivables *5) Trade and other payables *6) CCC(Cash Conversion Cycle)= Inventory turnover days + Receivables turnover days - Accounts Payable Turnover days- *7) Total Shareholder Return (TSR) CCC (Cash Conversion Cycle) 20.5days 21.0days 16.1 days -5.1 days (Million yen) FY23.10 FY24.10 ① FY25.10 ② Amount of change ② - ① Current assets Cash & cash equivalents 17,452 19,325 30,365 11,039 Inventories*2) 10,183 13,950 11,682 -2,267 (Turnover period*3) (26.8days) (27.7days) (22.6days) (-5.1days) Trade receivables*4) 867 1,253 1,285 32 (Turnover period*3) (1.9days) (2.0days) (1.9days) (-0.2days) Others 2,637 4,100 5,466 1,365 Non-current assets 30,210 38,573 33,645 -4,928 Total assets 61,352 77,203 82,445 5,242 Liabilities Trade payables*5) 3,516 4,070 5,434 1,364 (Turnover period*2) (8.2days) (8.7days) (8.4days) (-0.3days) Others 37,250 49,892 45,579 -4,313 Equity Share capital 7,262 7,372 9,962 2,590 Retained earnings 989 2,691 6,560 3,869 Others 12,332 13,176 14,908 1,732 Total liabilities and equity 61,352 77,203 82,445 5,242 Light working capital (Strict control of CCC(Cash Conversion Cycle )) Stable financial base (Sound capital-to-asset ratio) Shareholder return policy (Total shareholders return (TSR)) *1) *6) *7)