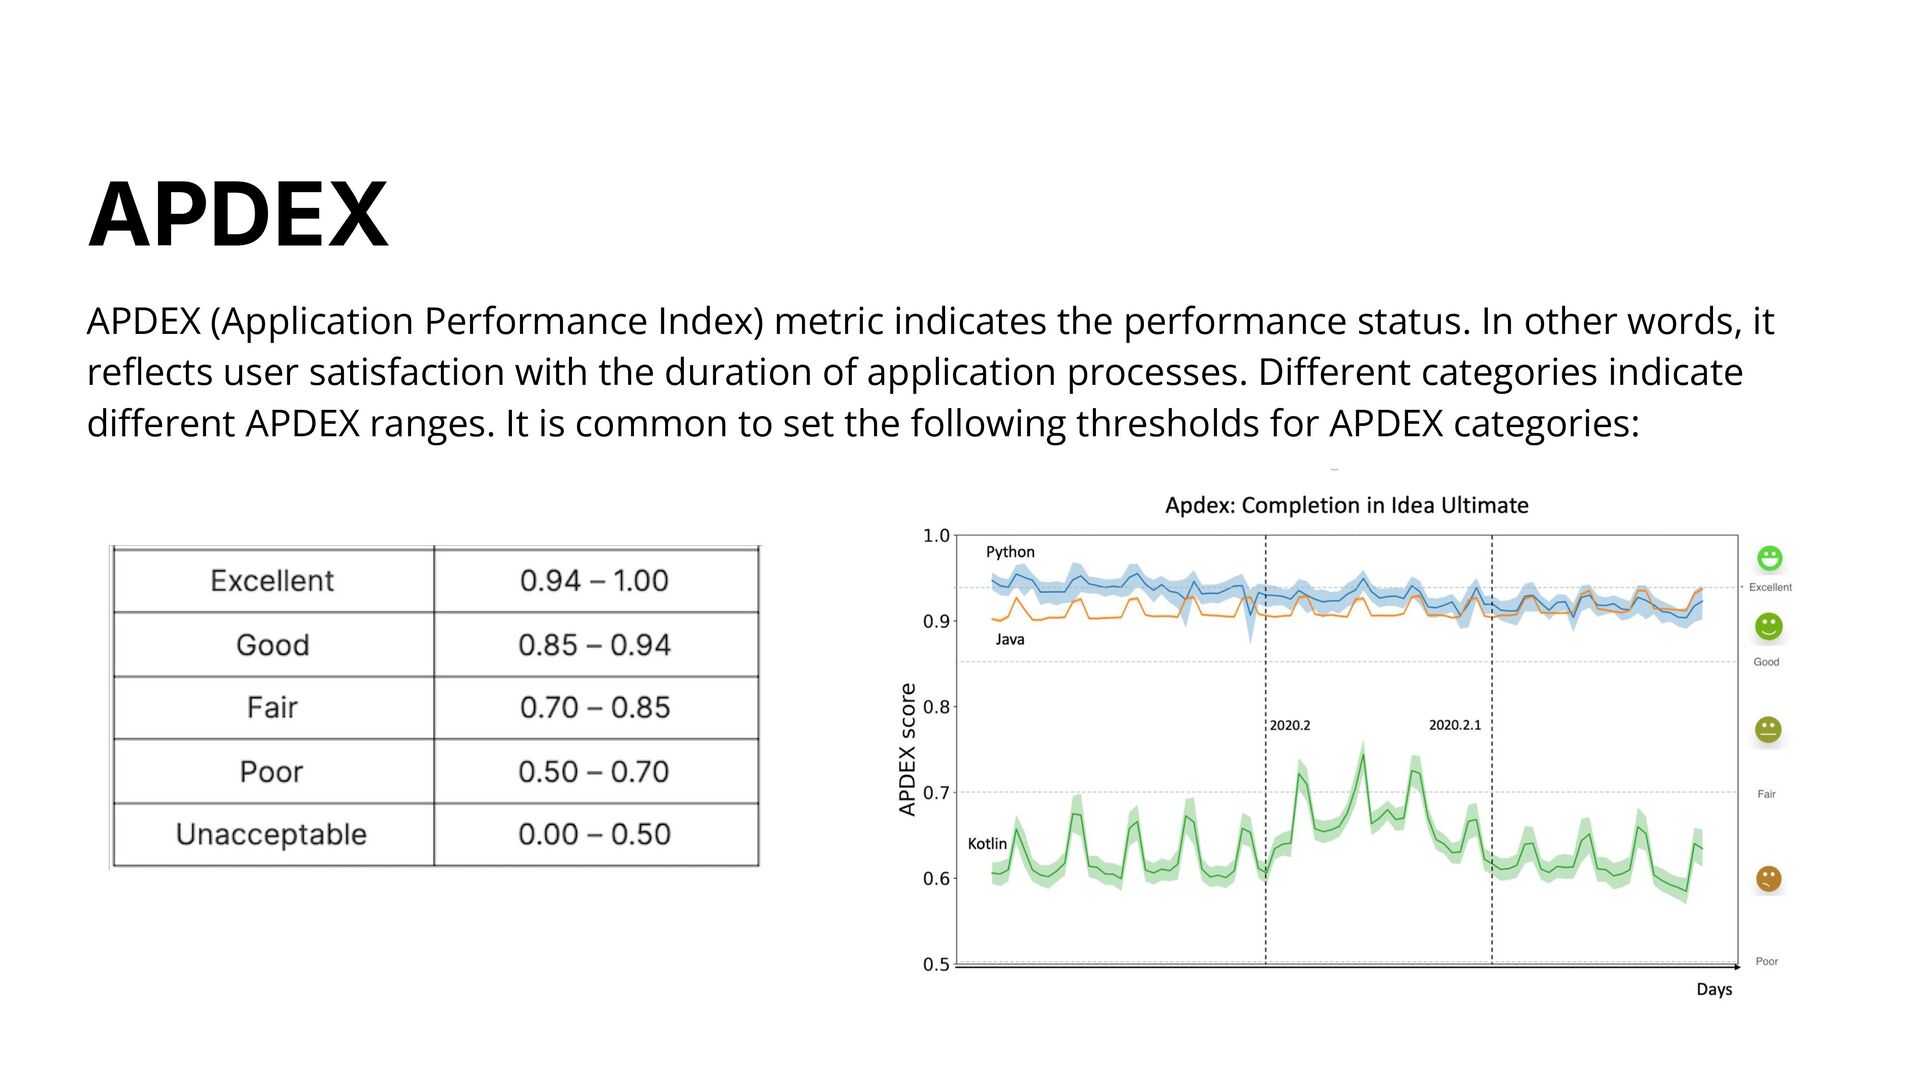
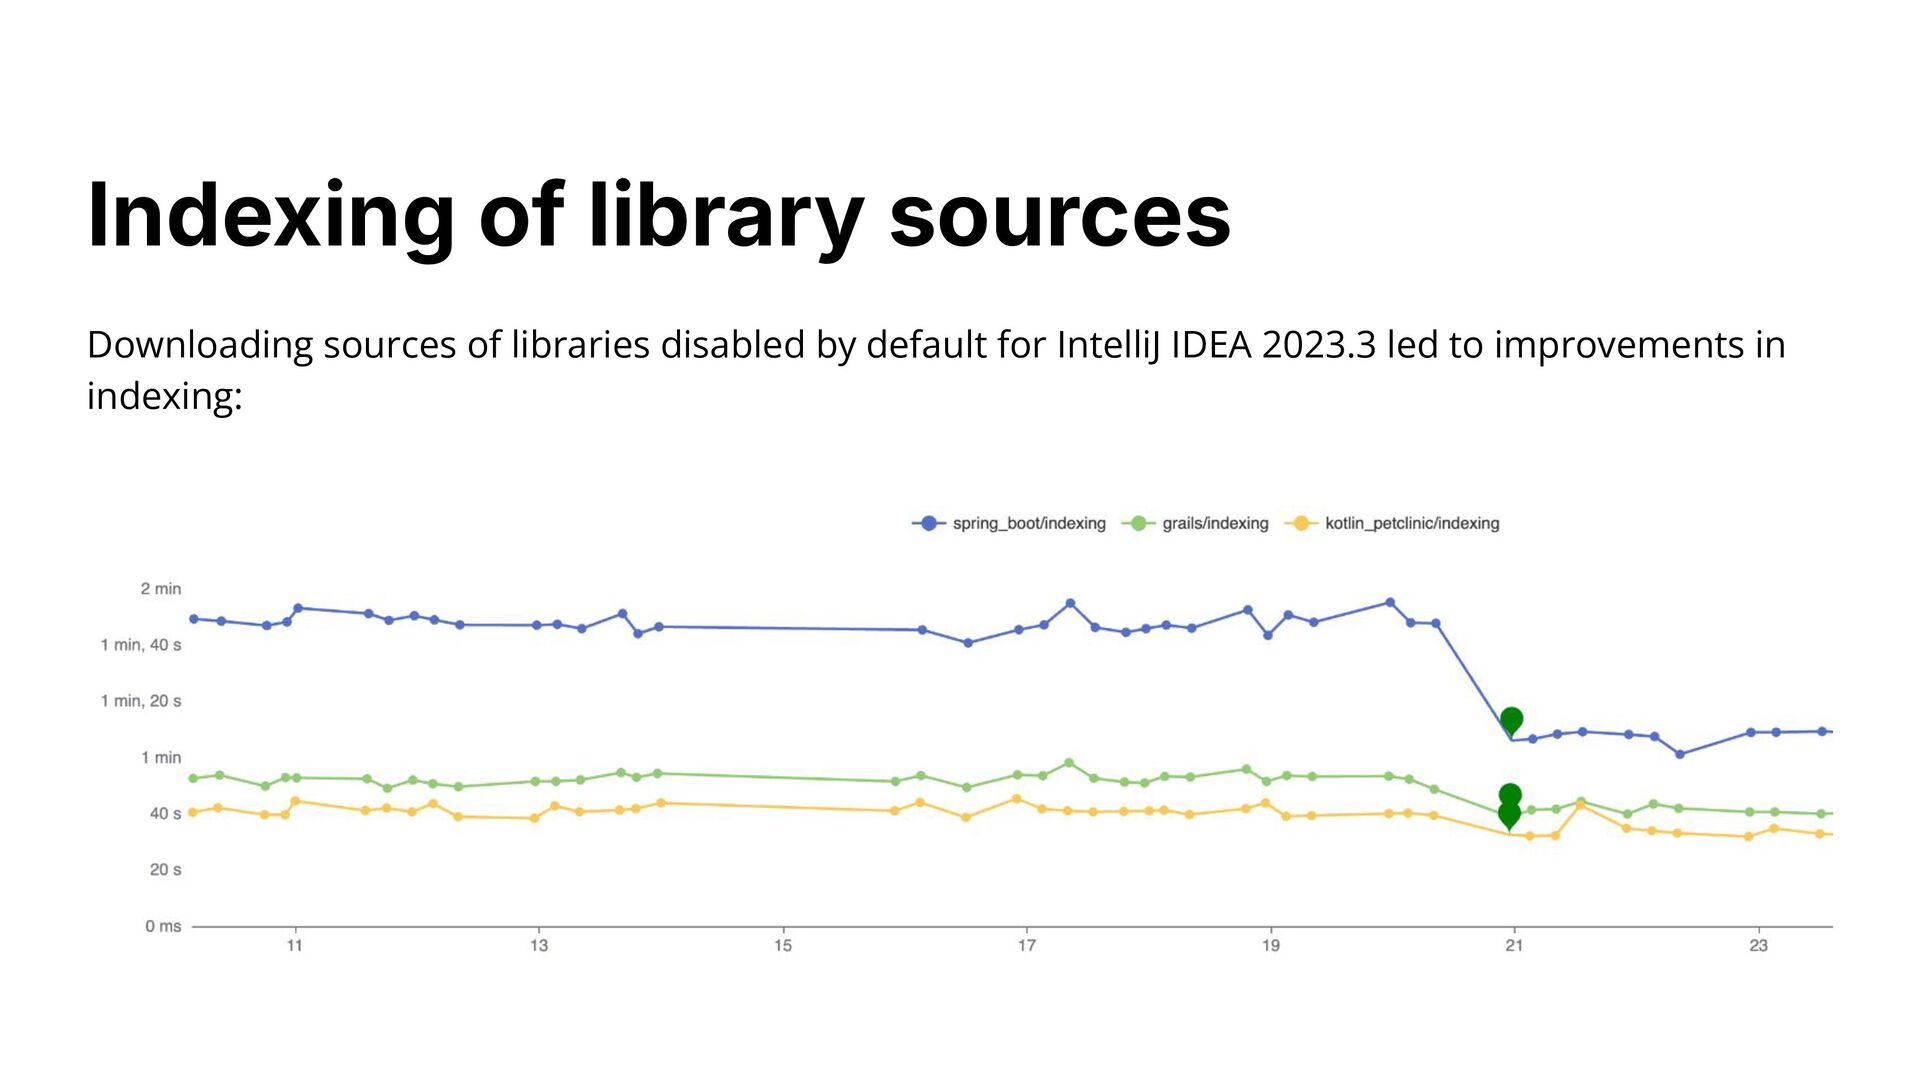
other words, it reflects user satisfaction with the duration of application processes. Different categories indicate different APDEX ranges. It is common to set the following thresholds for APDEX categories: APDEX
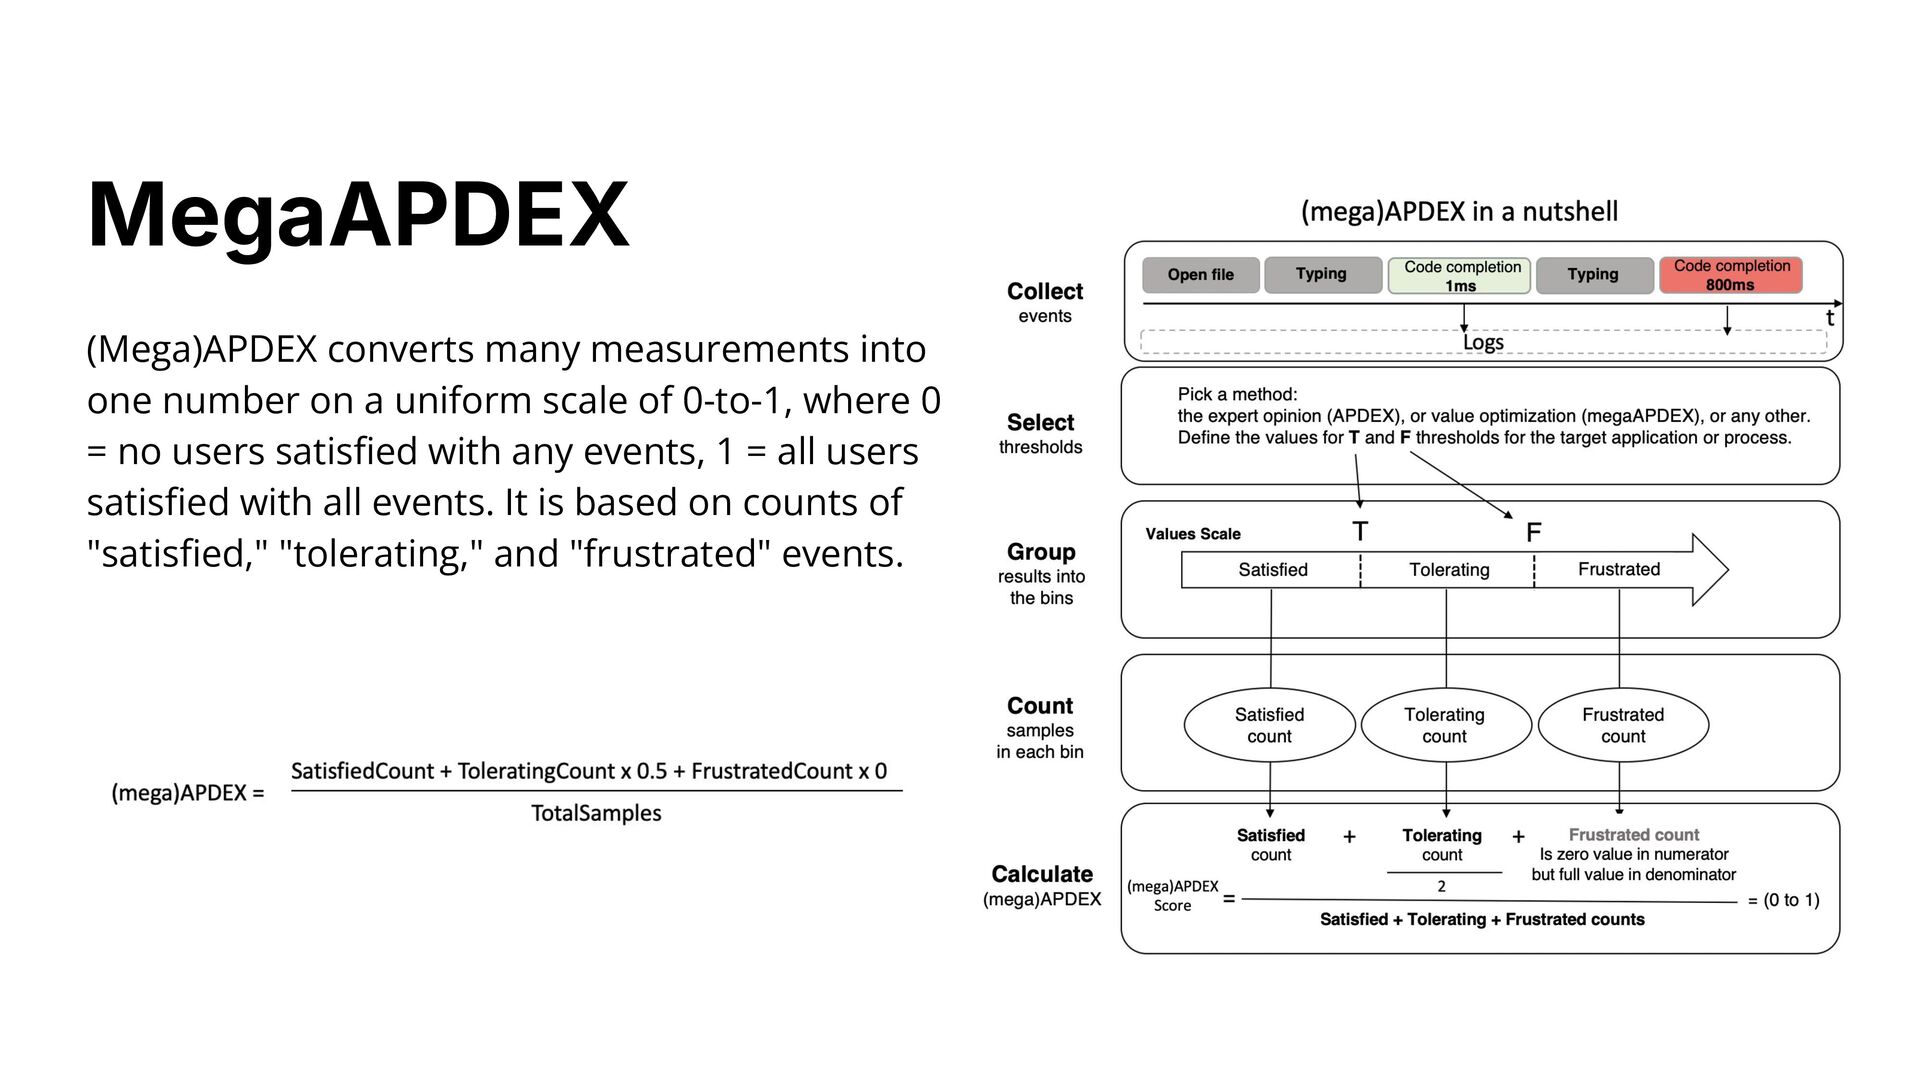
scale of 0-to-1, where 0 = no users satisfied with any events, 1 = all users satisfied with all events. It is based on counts of "satisfied," "tolerating," and "frustrated" events. MegaAPDEX
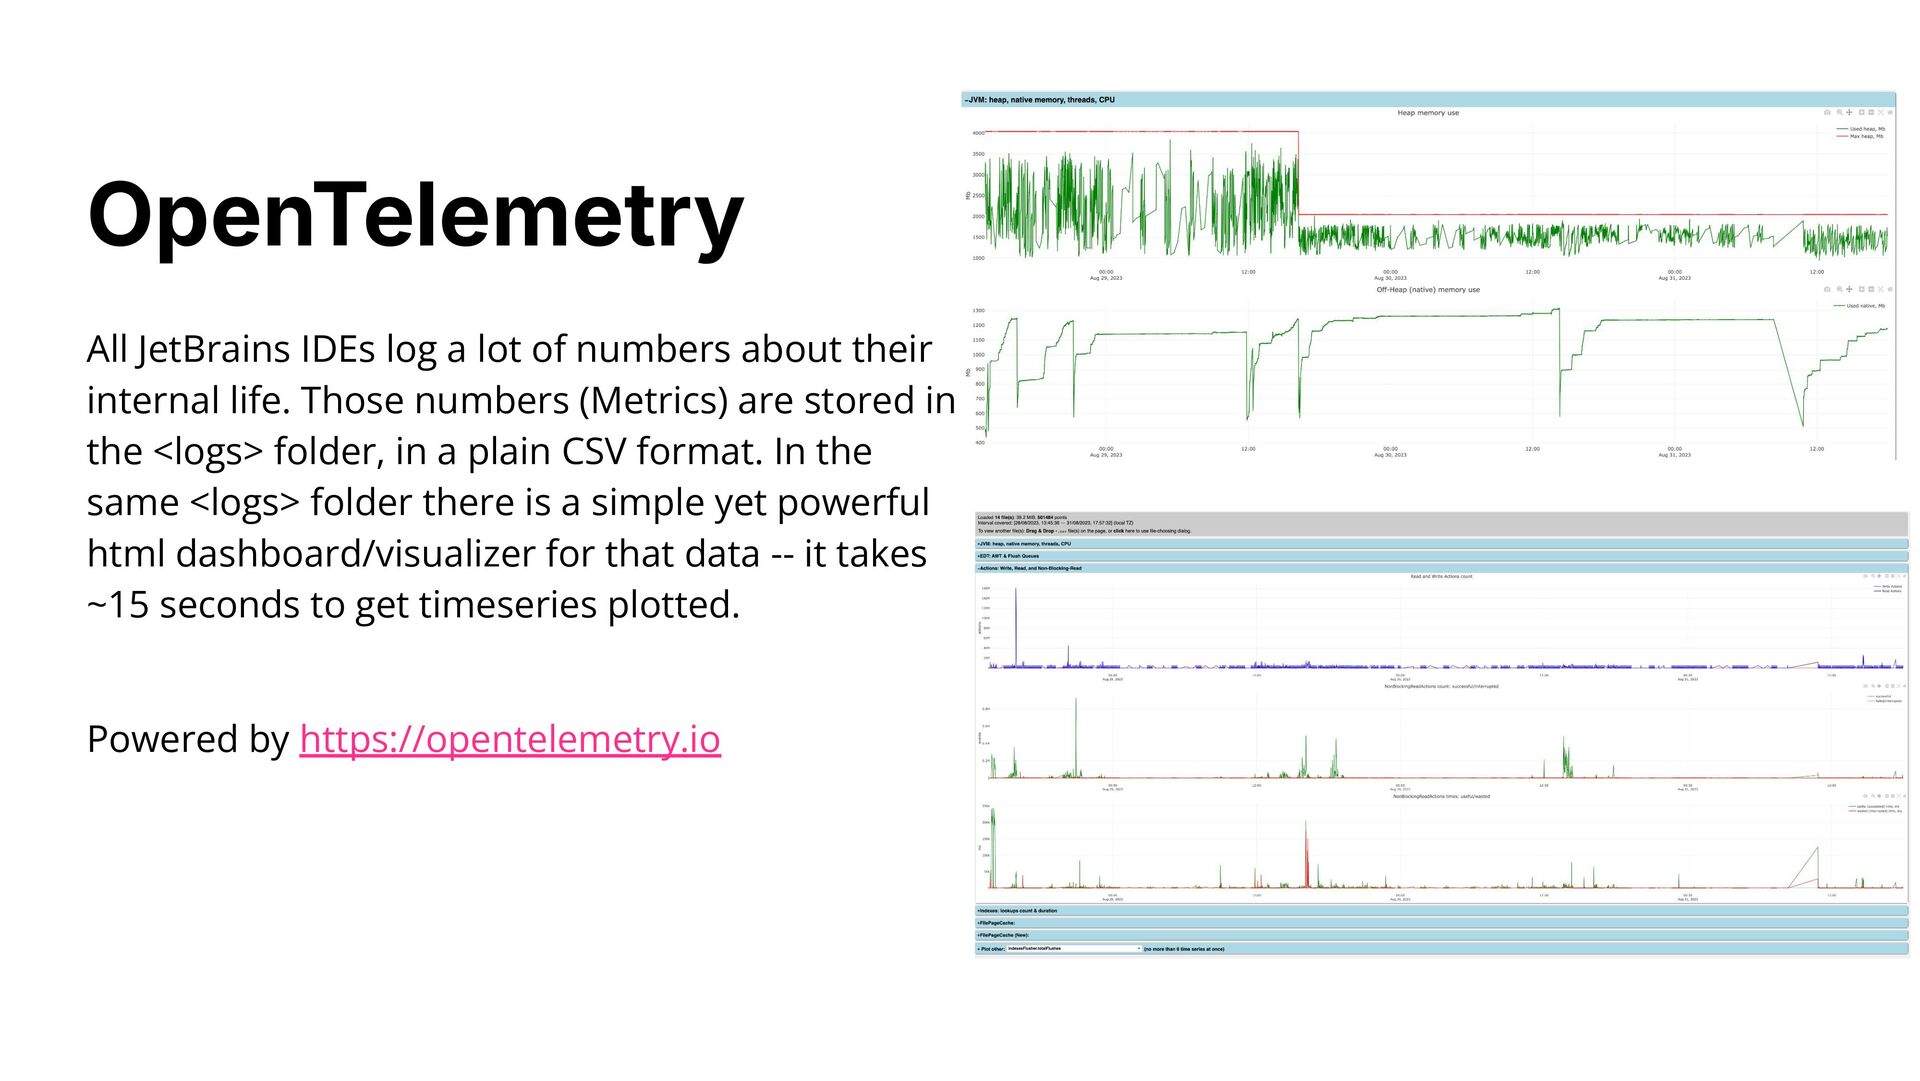
internal life. Those numbers (Metrics) are stored in the <logs> folder, in a plain CSV format. In the same <logs> folder there is a simple yet powerful html dashboard/visualizer for that data -- it takes ~15 seconds to get timeseries plotted. Powered by https://opentelemetry.io OpenTelemetry
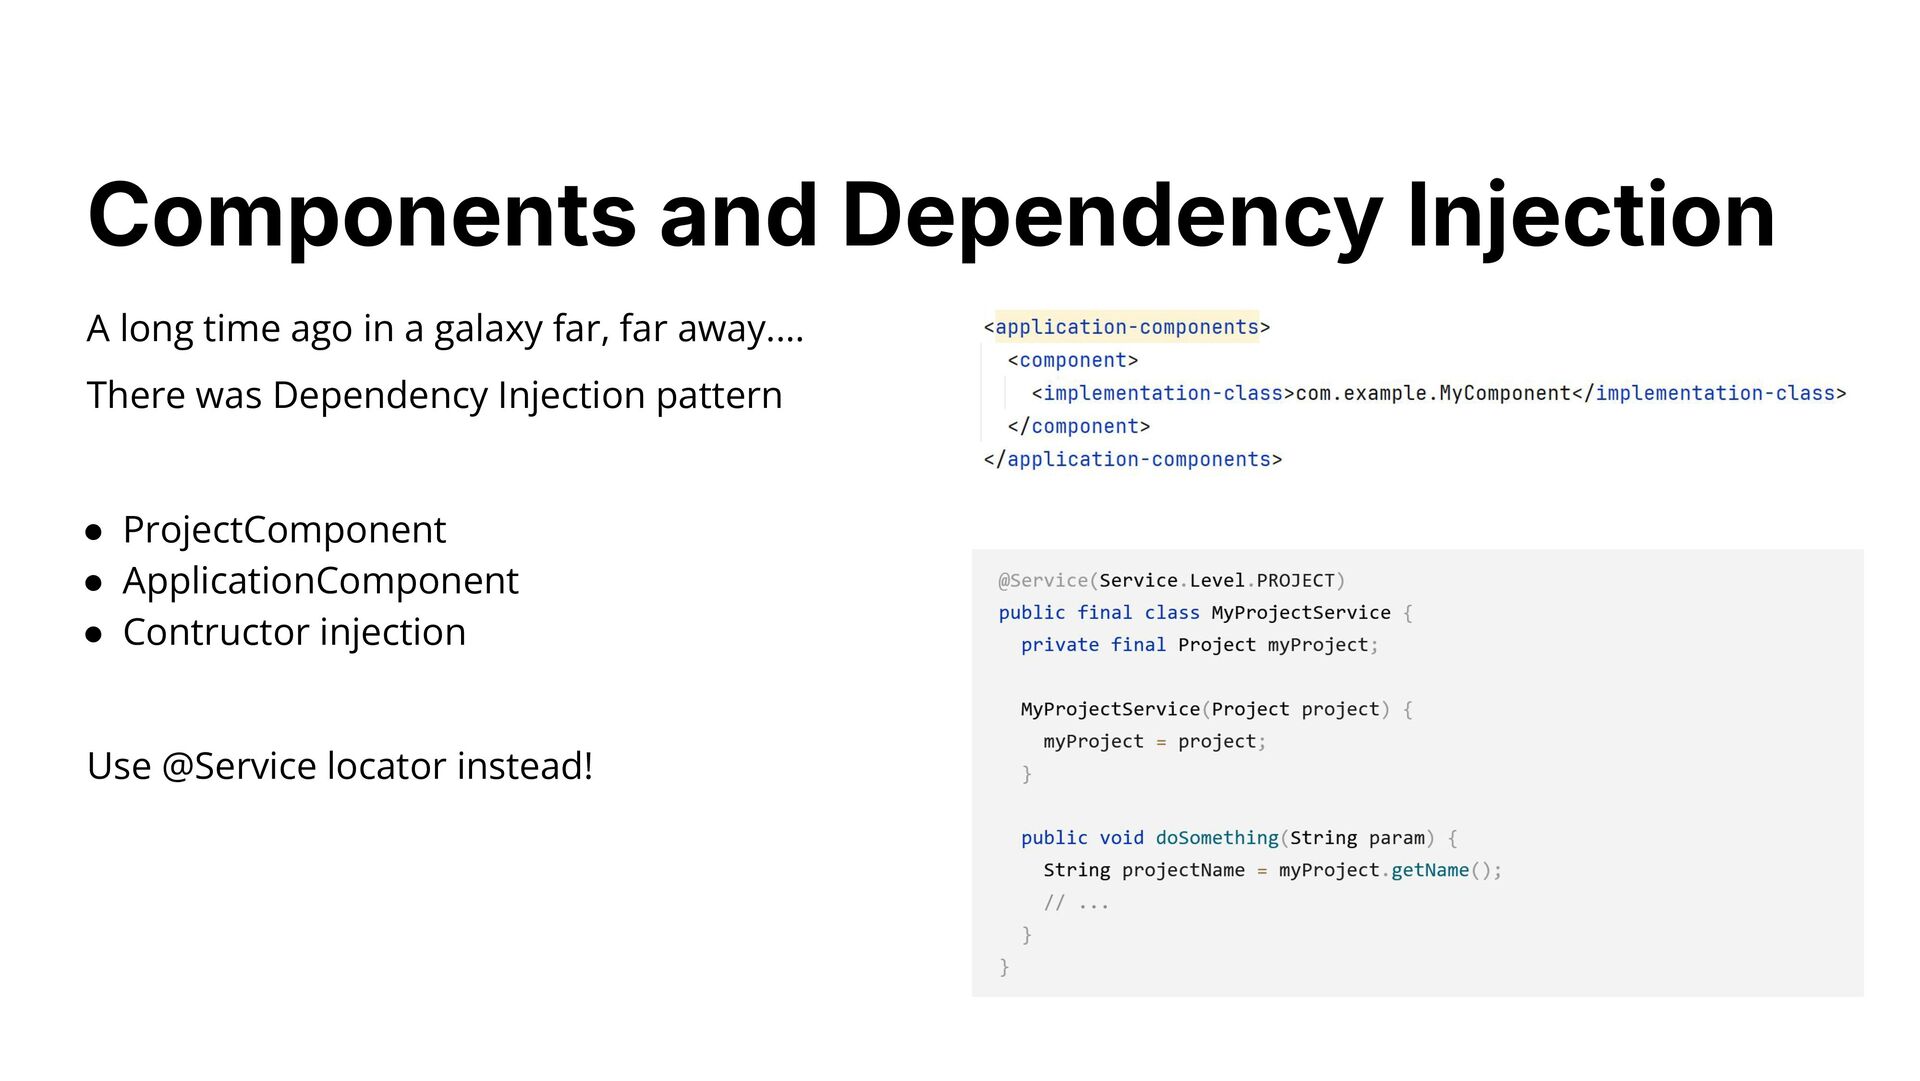
There was Dependency Injection pattern • ProjectComponent • ApplicationComponent • Contructor injection Use @Service locator instead! Components and Dependency Injection
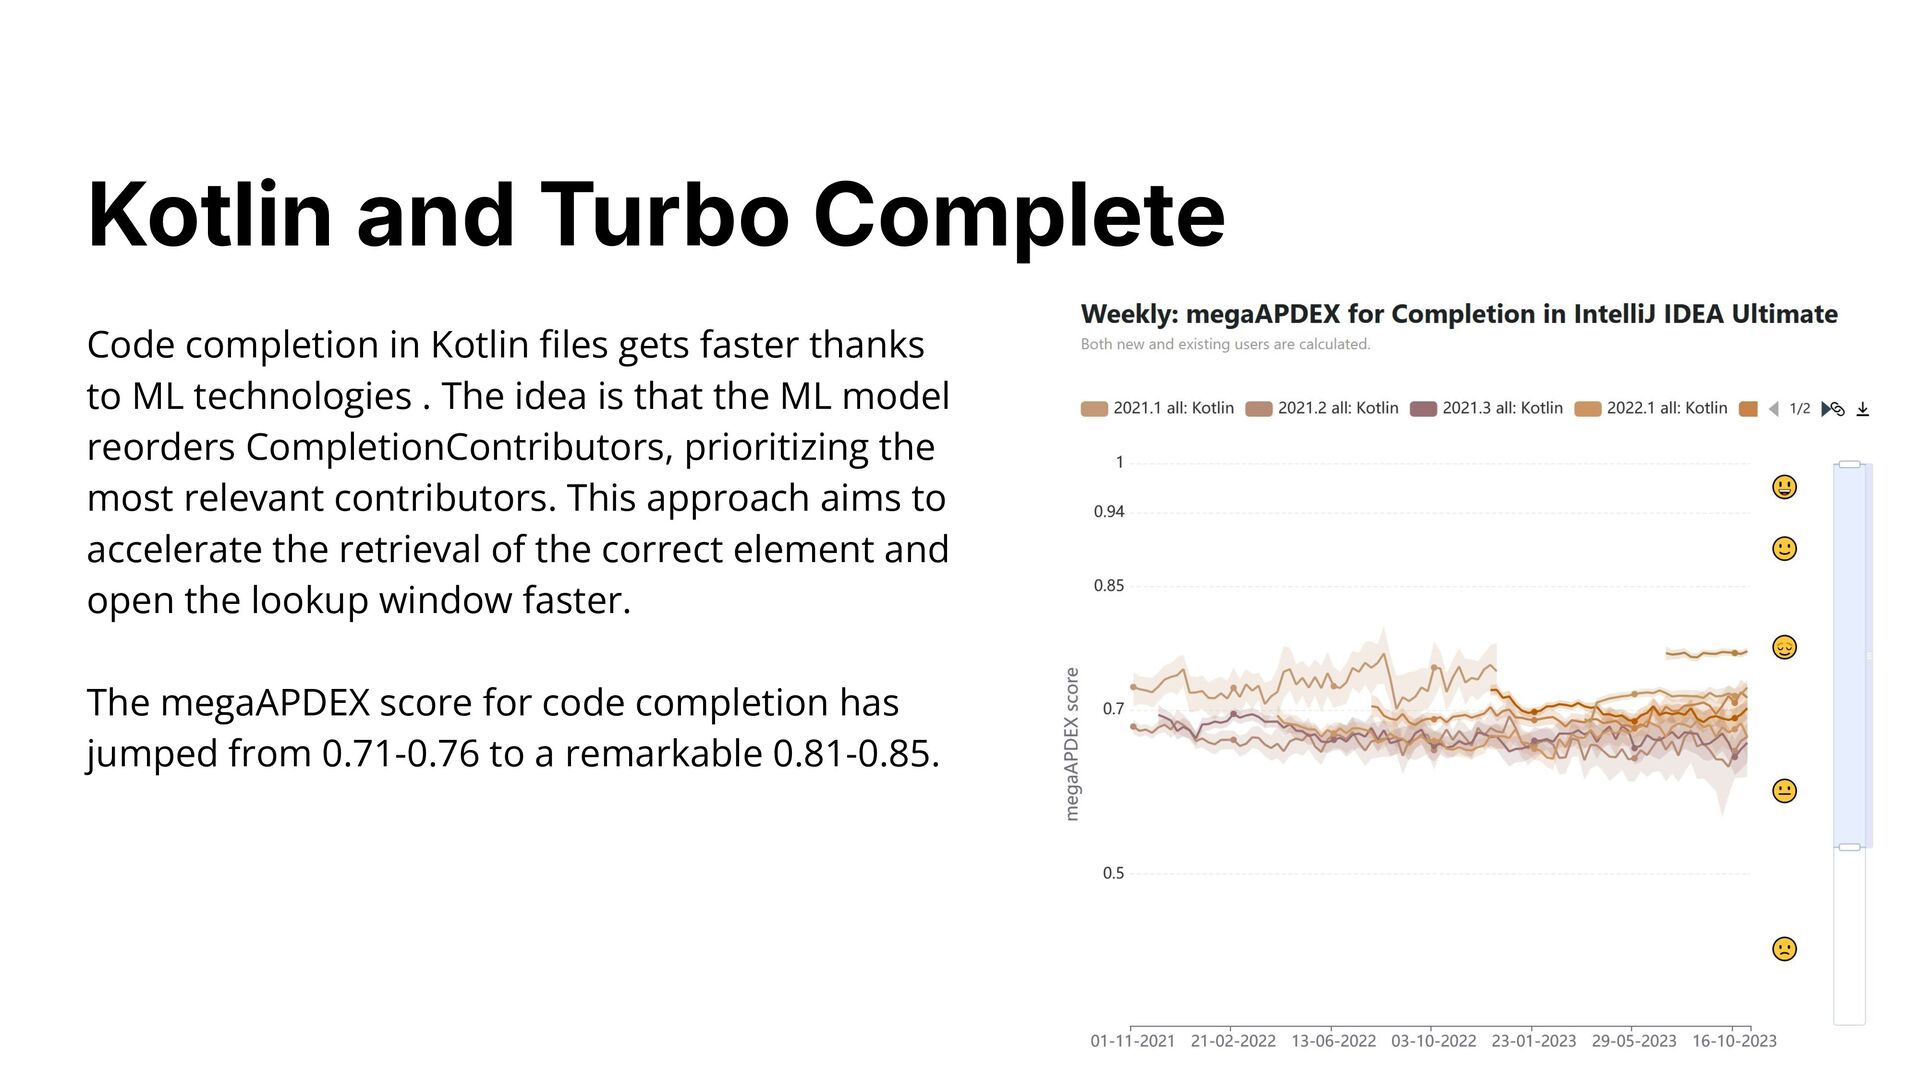
technologies . The idea is that the ML model reorders CompletionContributors, prioritizing the most relevant contributors. This approach aims to accelerate the retrieval of the correct element and open the lookup window faster. The megaAPDEX score for code completion has jumped from 0.71-0.76 to a remarkable 0.81-0.85. Kotlin and Turbo Complete
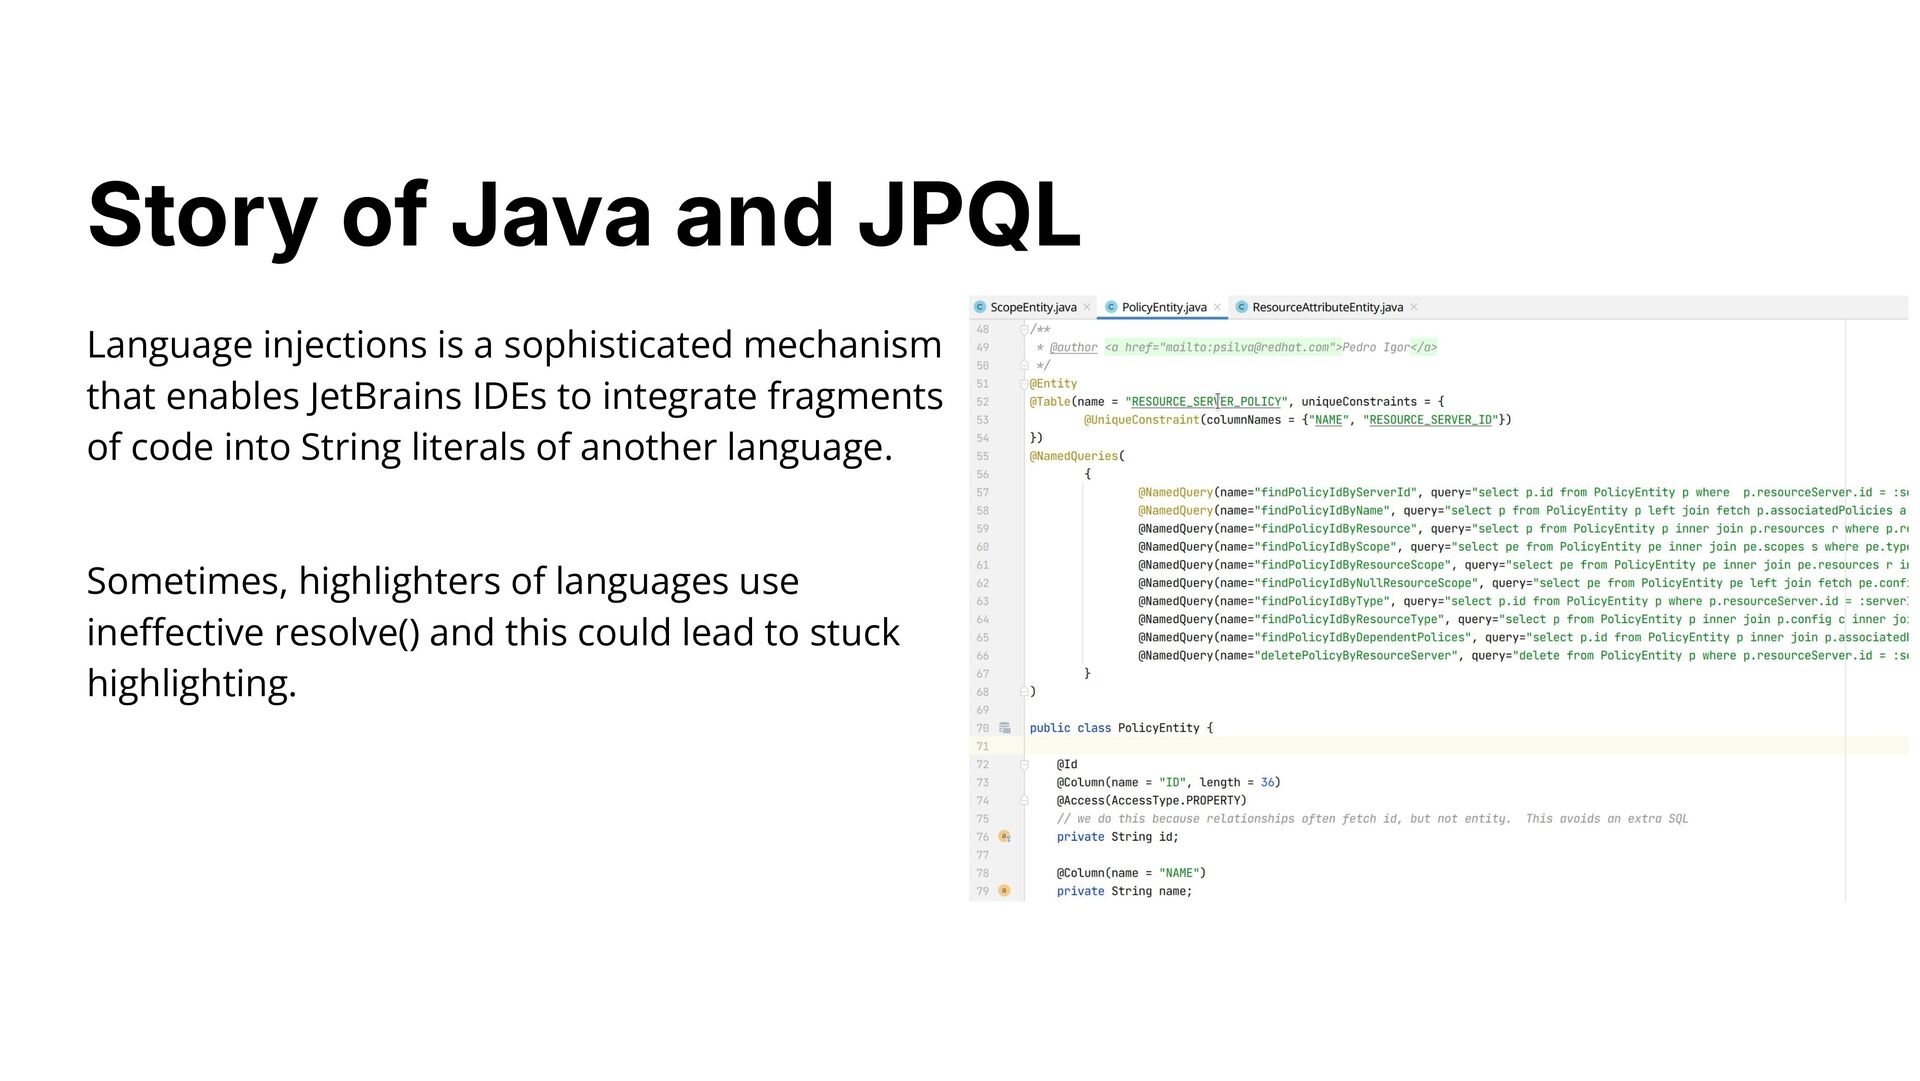
to integrate fragments of code into String literals of another language. Sometimes, highlighters of languages use ineffective resolve() and this could lead to stuck highlighting. Story of Java and JPQL
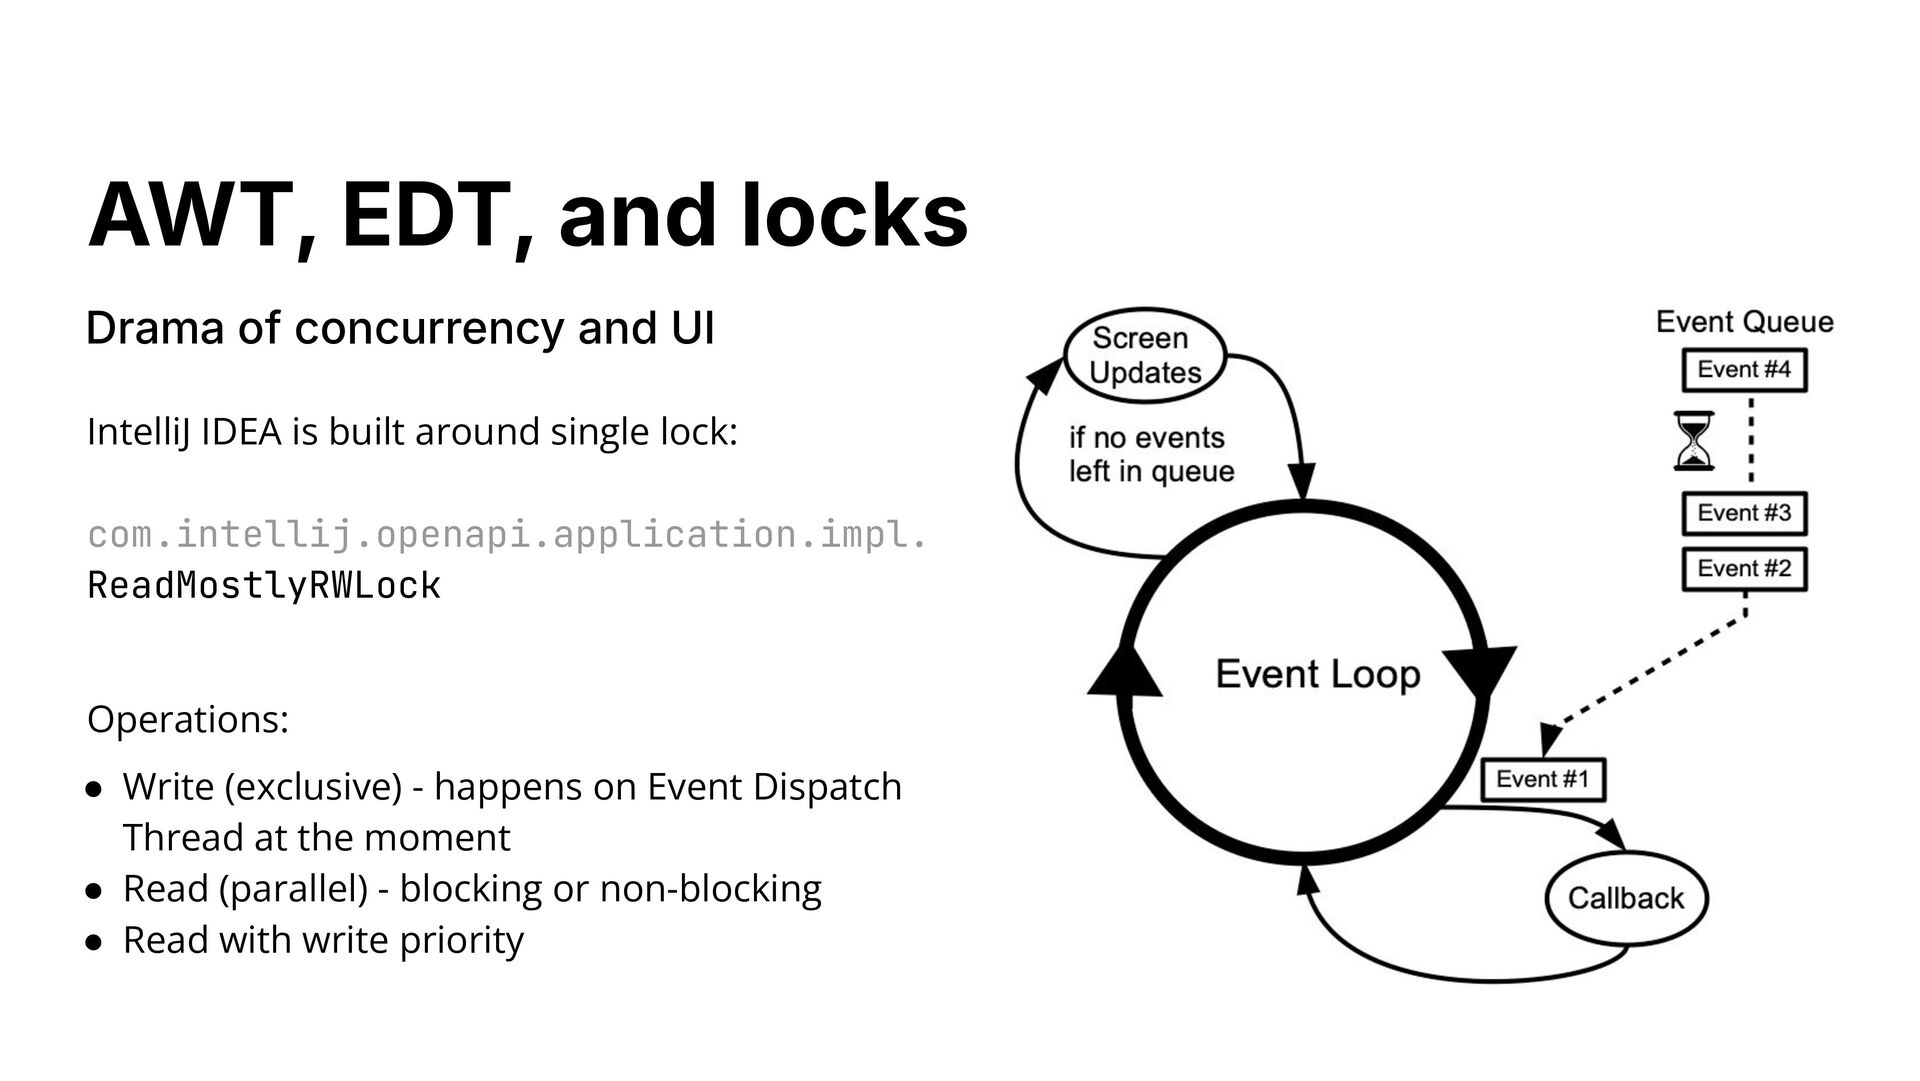
• Write (exclusive) - happens on Event Dispatch Thread at the moment • Read (parallel) - blocking or non-blocking • Read with write priority AWT, EDT, and locks Drama of concurrency and UI
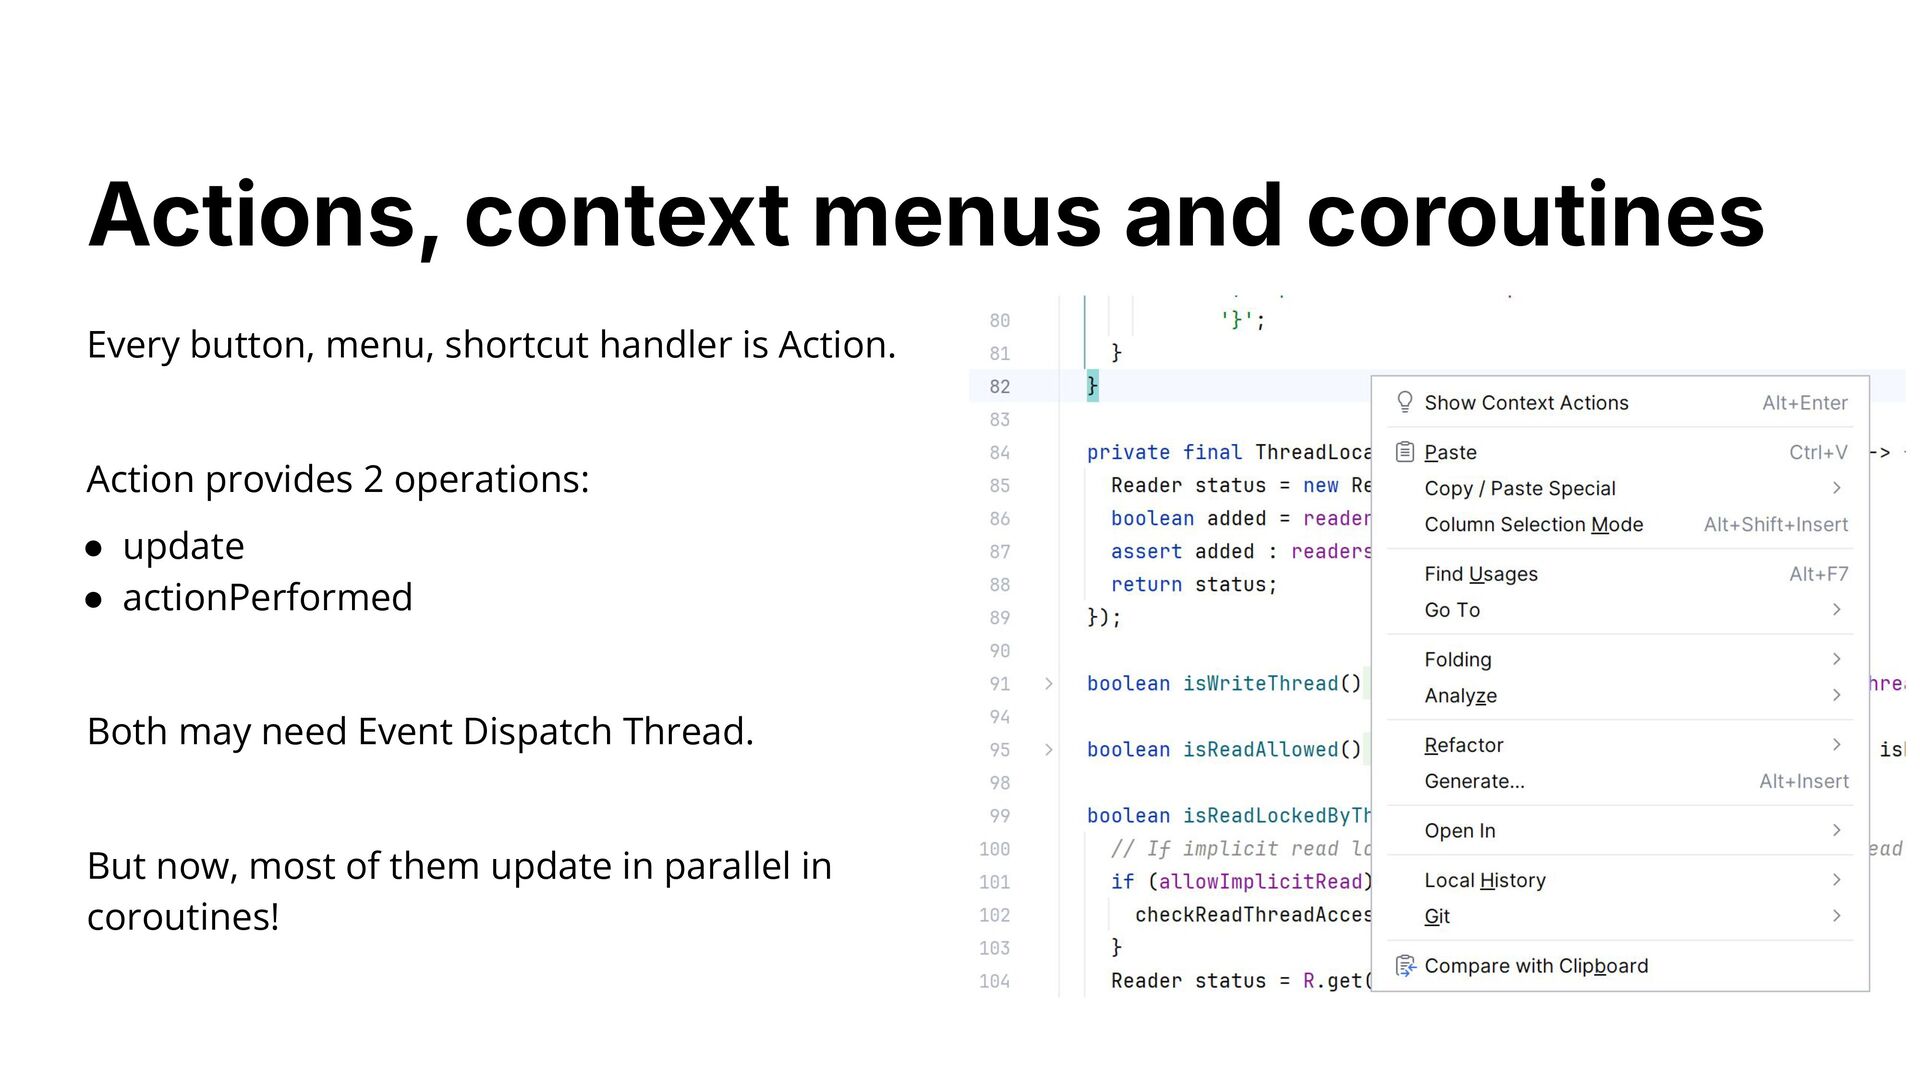
operations: • update • actionPerformed Both may need Event Dispatch Thread. But now, most of them update in parallel in coroutines! Actions, context menus and coroutines
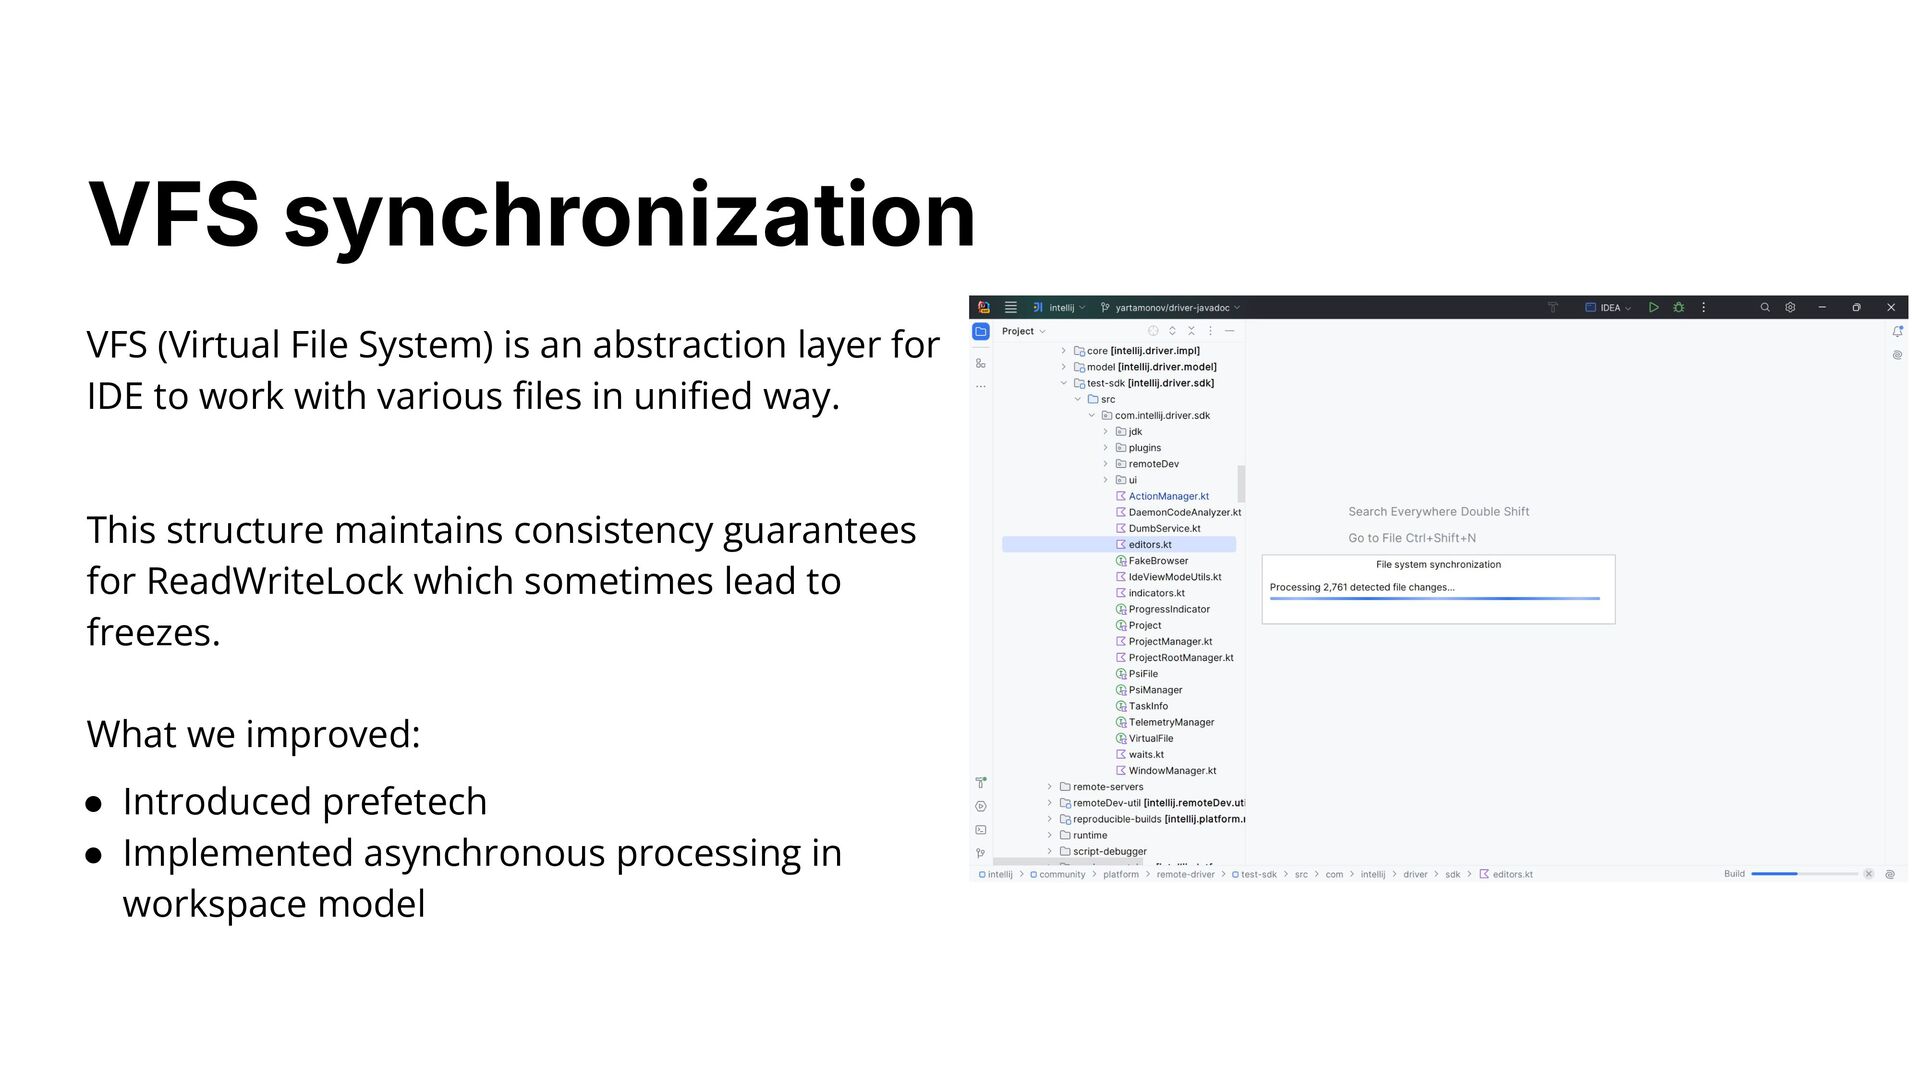
to work with various files in unified way. This structure maintains consistency guarantees for ReadWriteLock which sometimes lead to freezes. What we improved: • Introduced prefetech • Implemented asynchronous processing in workspace model VFS synchronization
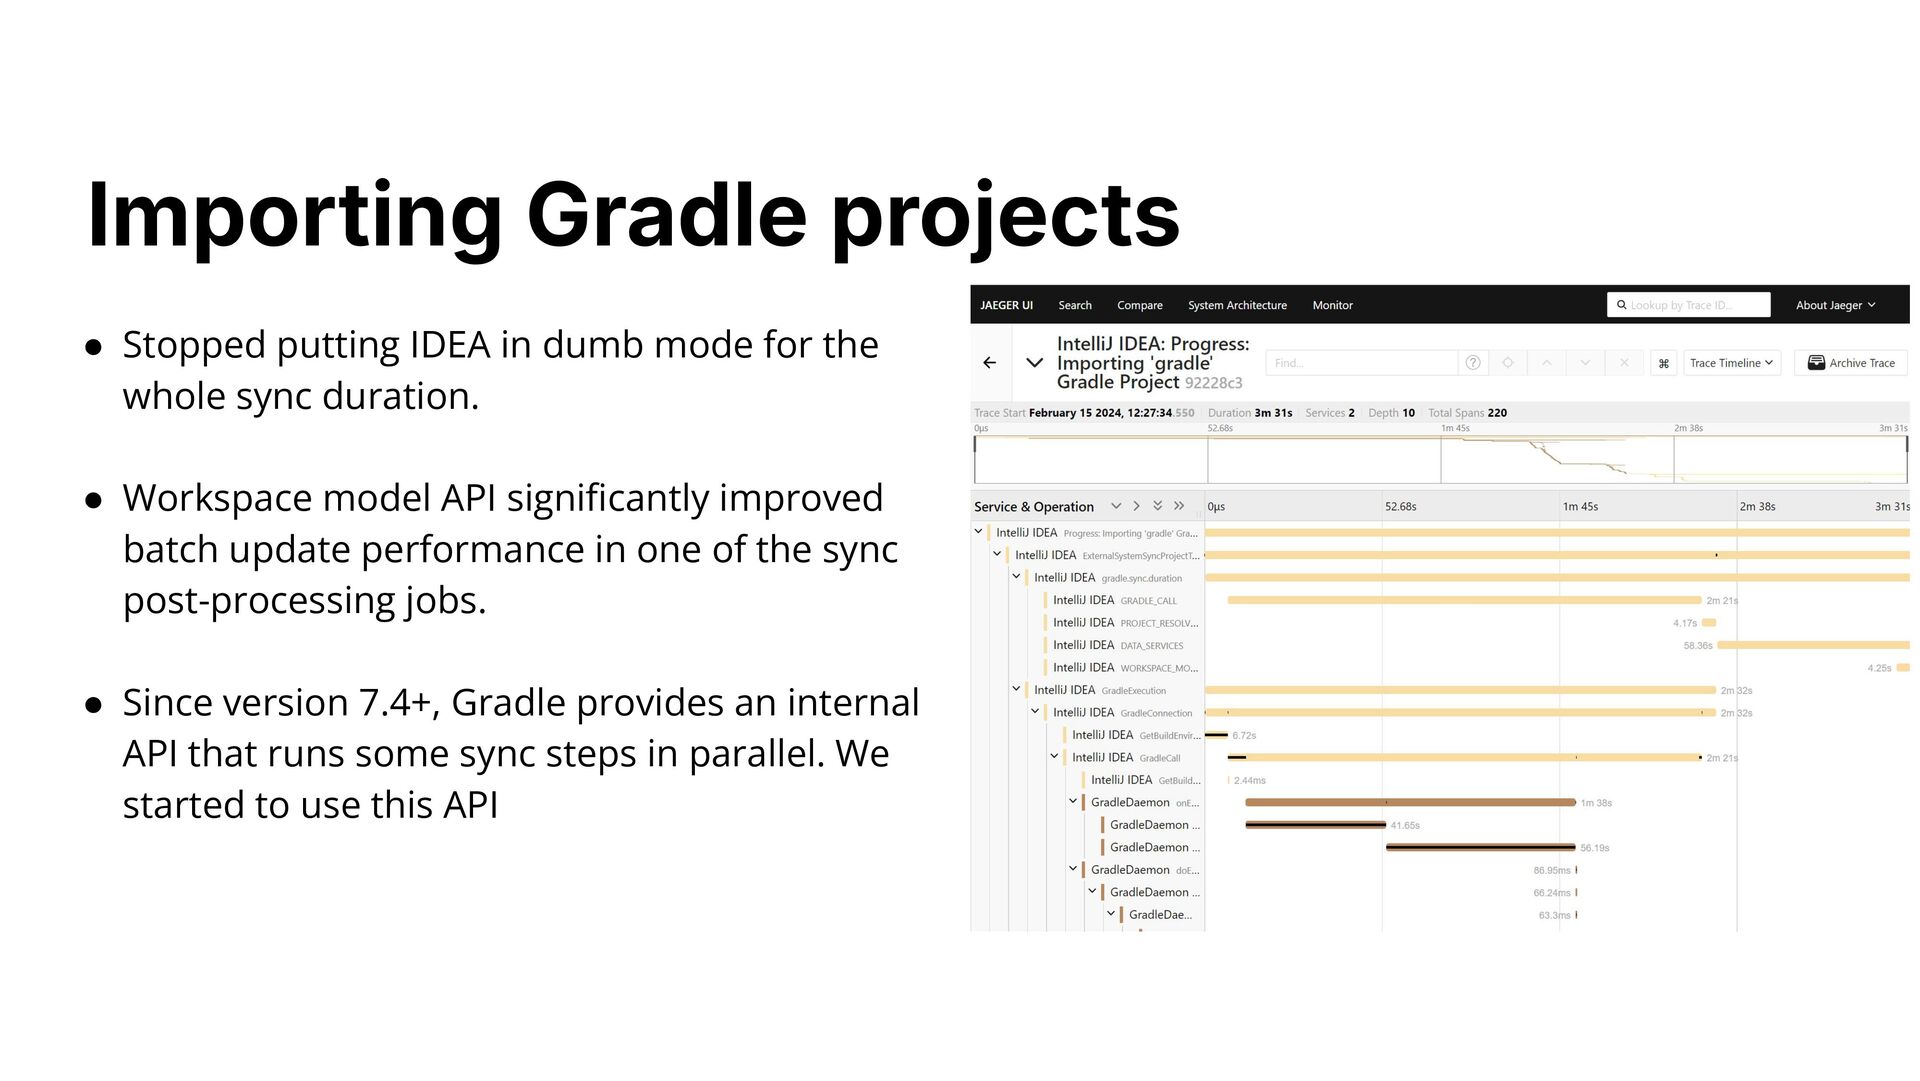
sync duration. • Workspace model API significantly improved batch update performance in one of the sync post-processing jobs. • Since version 7.4+, Gradle provides an internal API that runs some sync steps in parallel. We started to use this API Importing Gradle projects
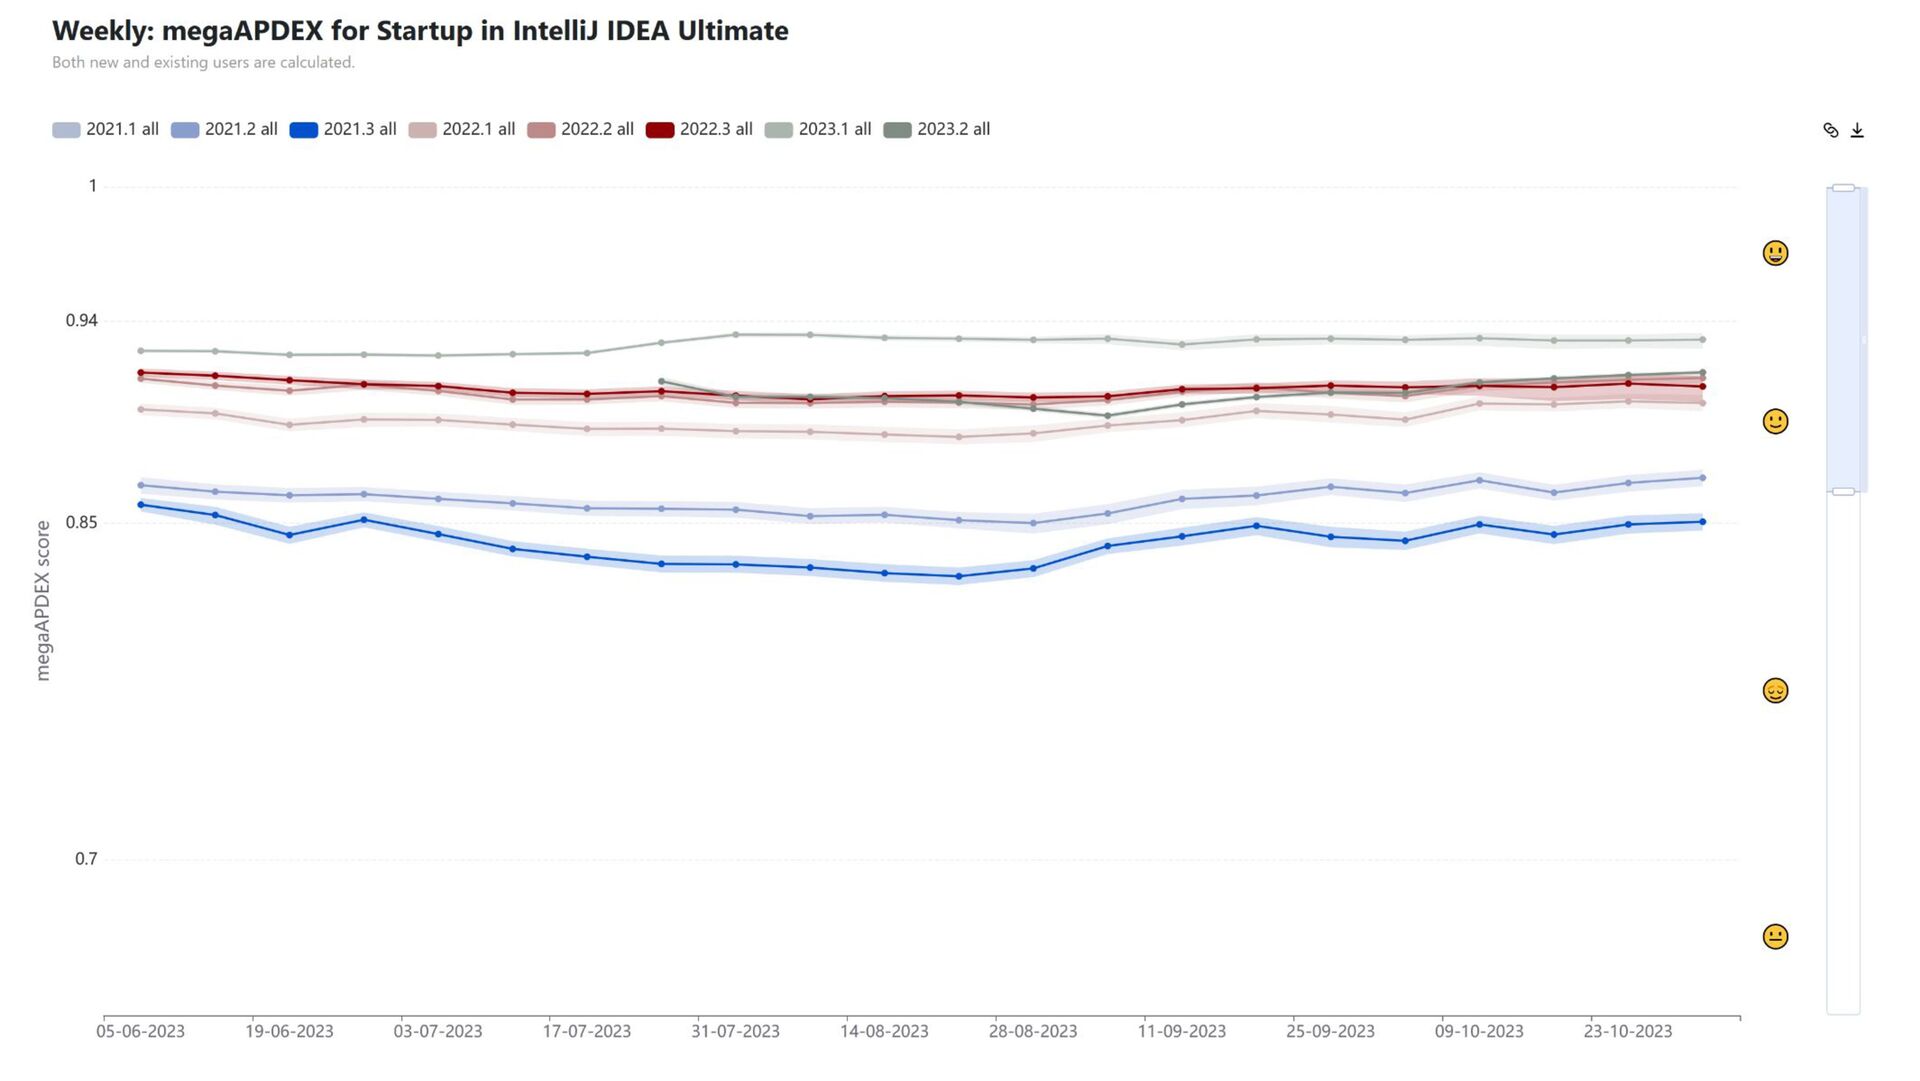
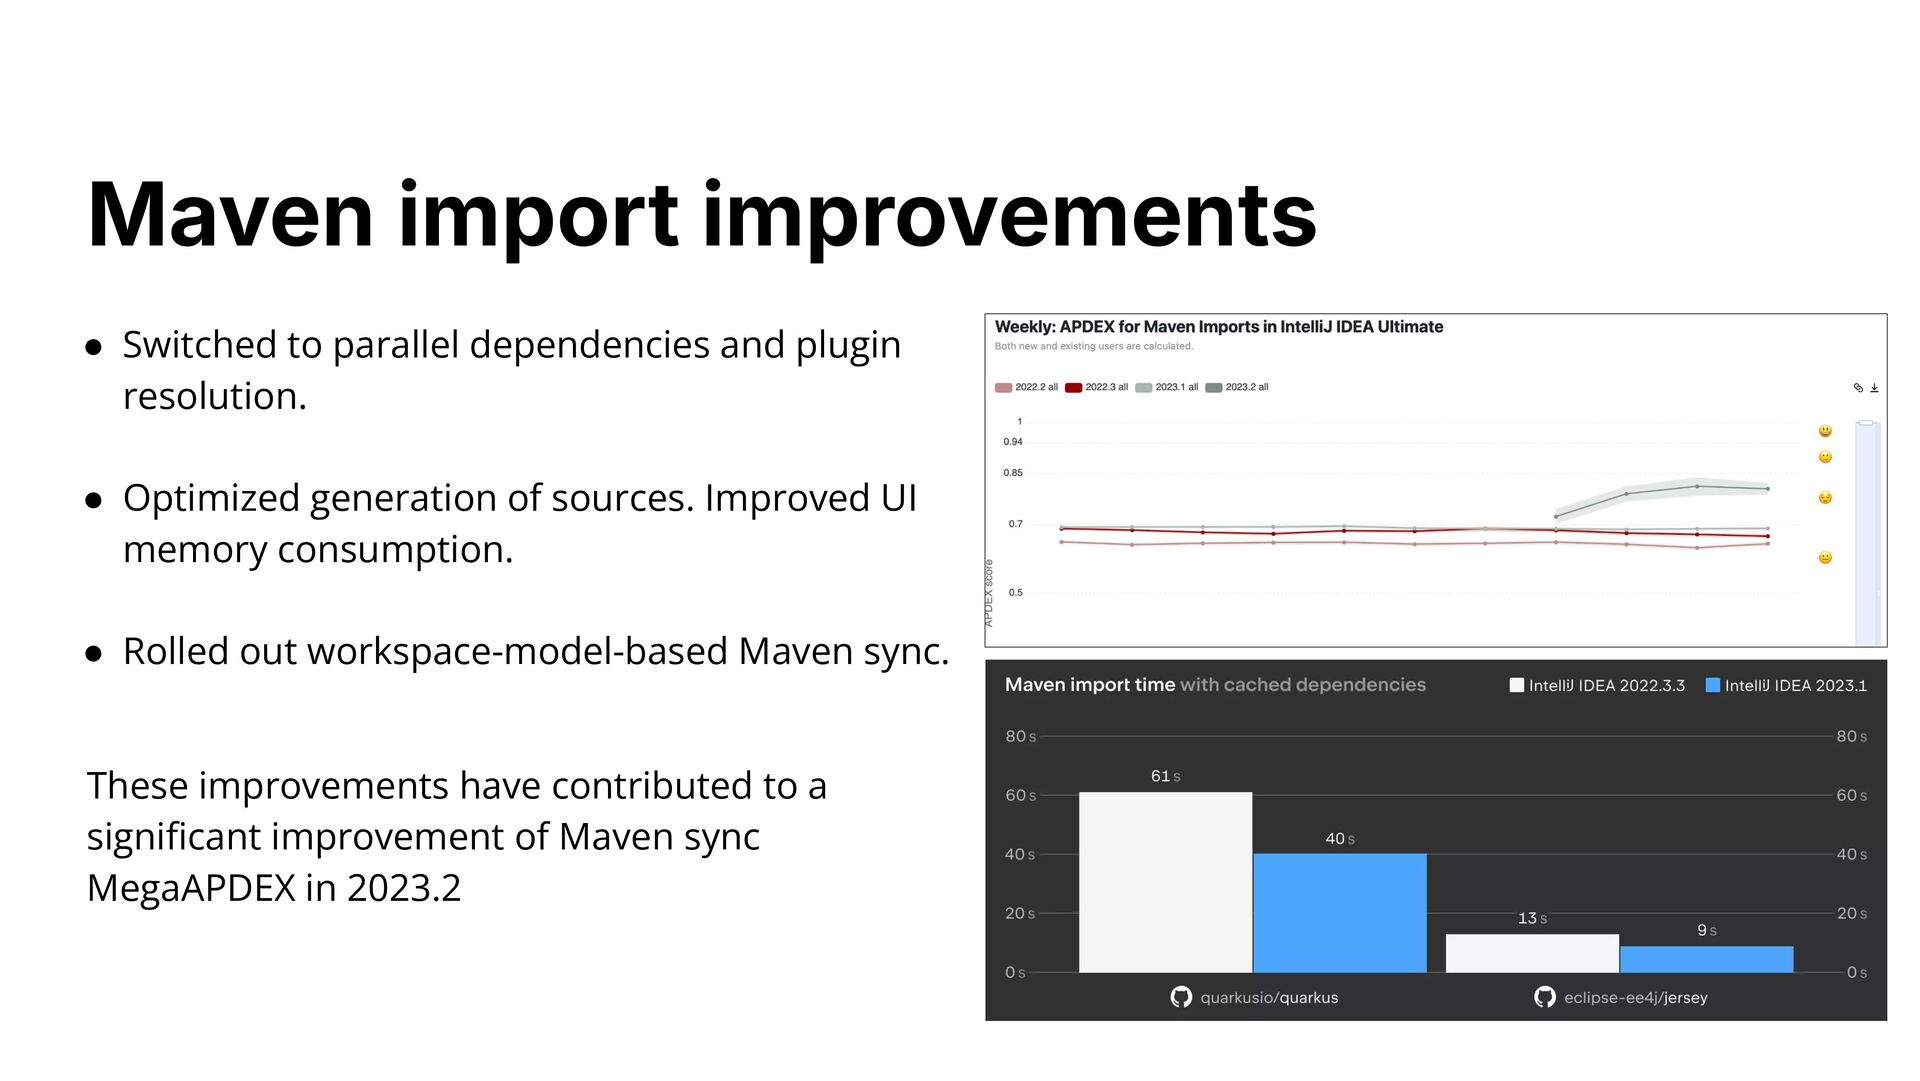
generation of sources. Improved UI memory consumption. • Rolled out workspace-model-based Maven sync. These improvements have contributed to a significant improvement of Maven sync MegaAPDEX in 2023.2 Maven import improvements
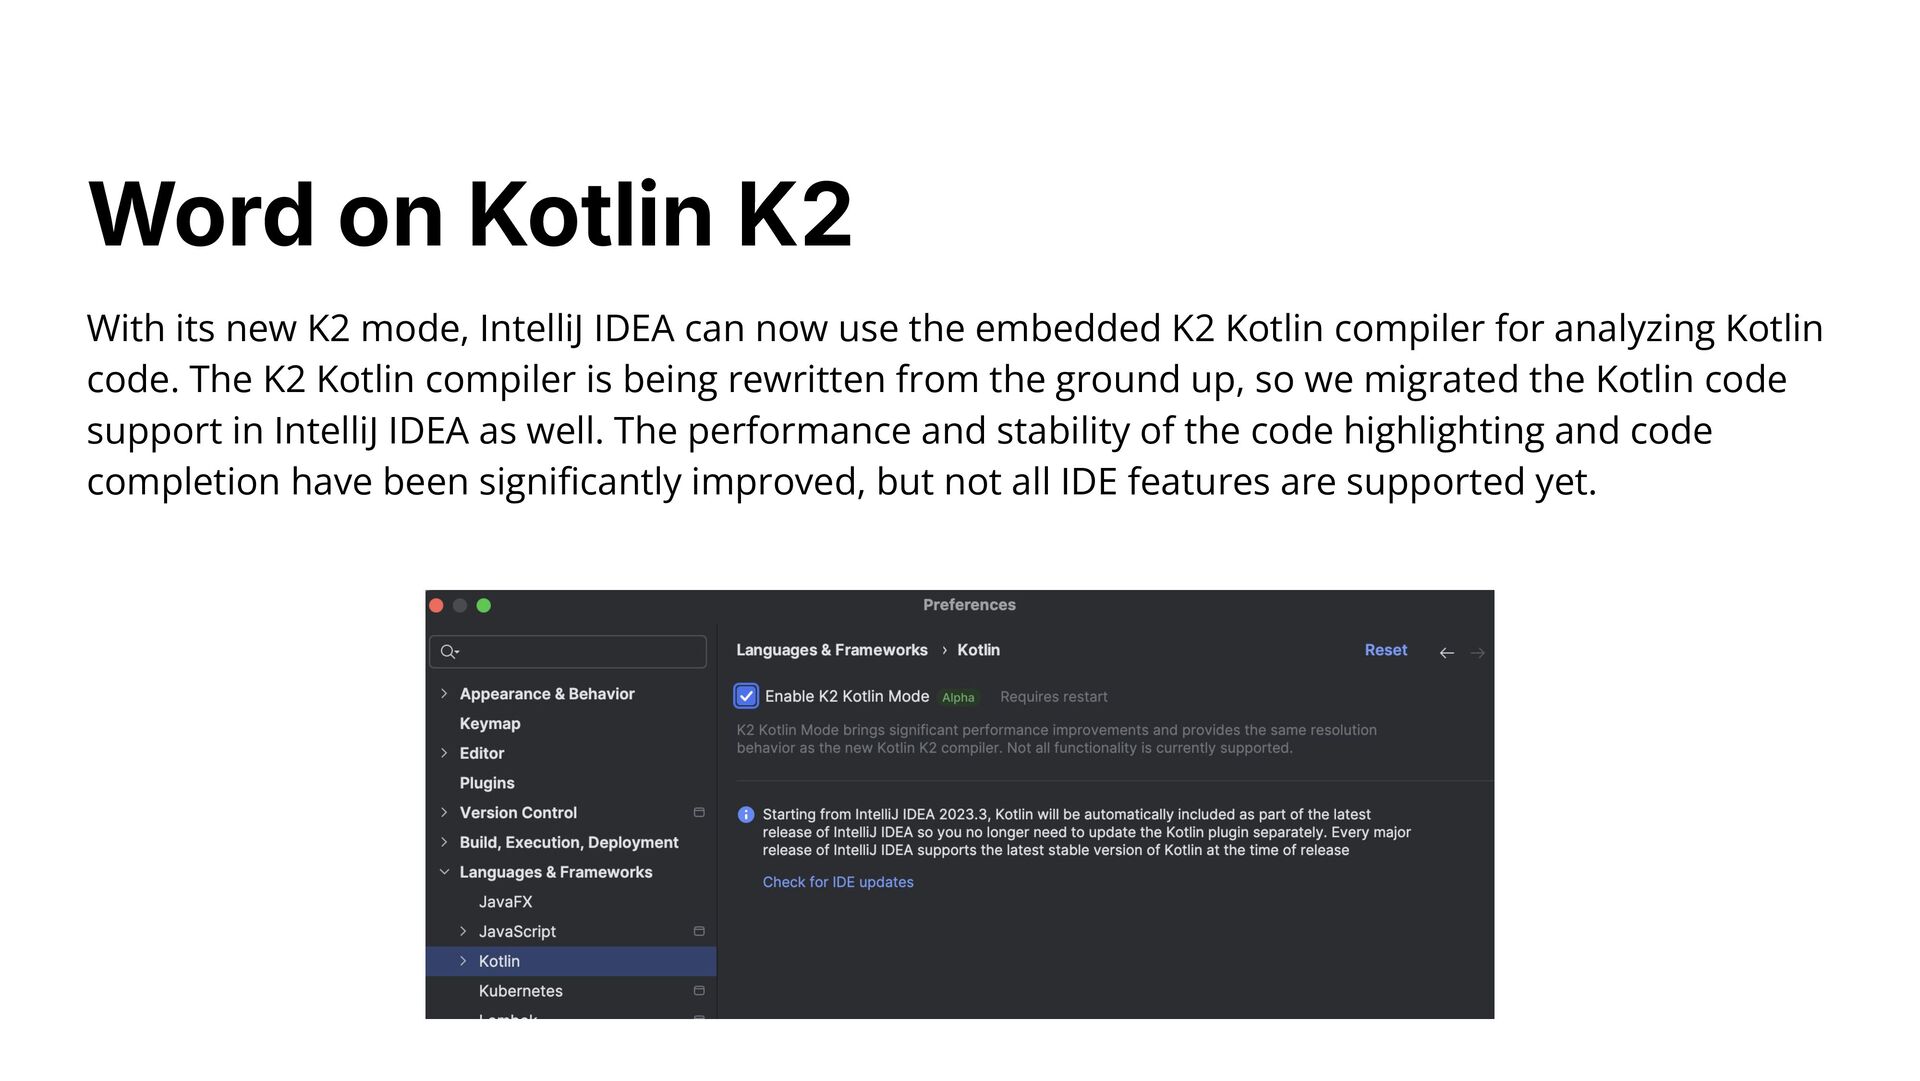
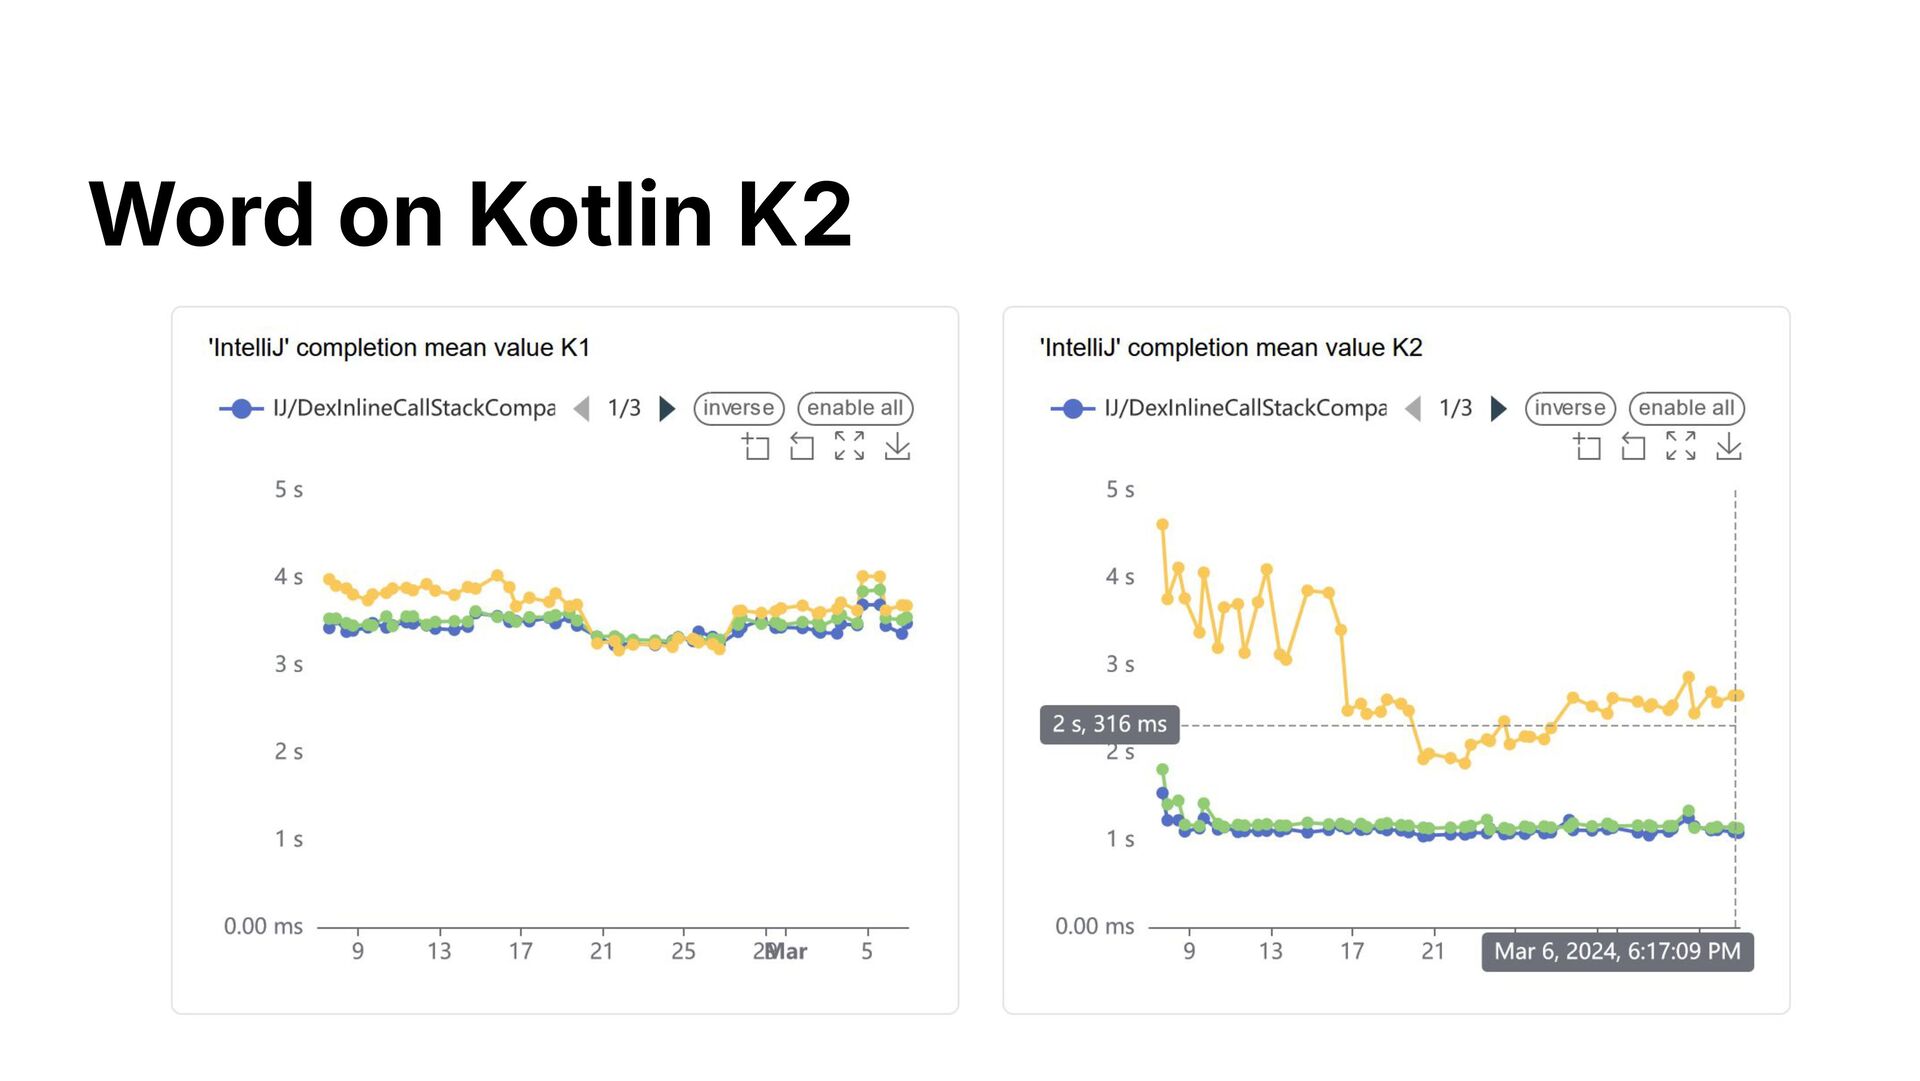
the embedded K2 Kotlin compiler for analyzing Kotlin code. The K2 Kotlin compiler is being rewritten from the ground up, so we migrated the Kotlin code support in IntelliJ IDEA as well. The performance and stability of the code highlighting and code completion have been significantly improved, but not all IDE features are supported yet. Word on Kotlin K2
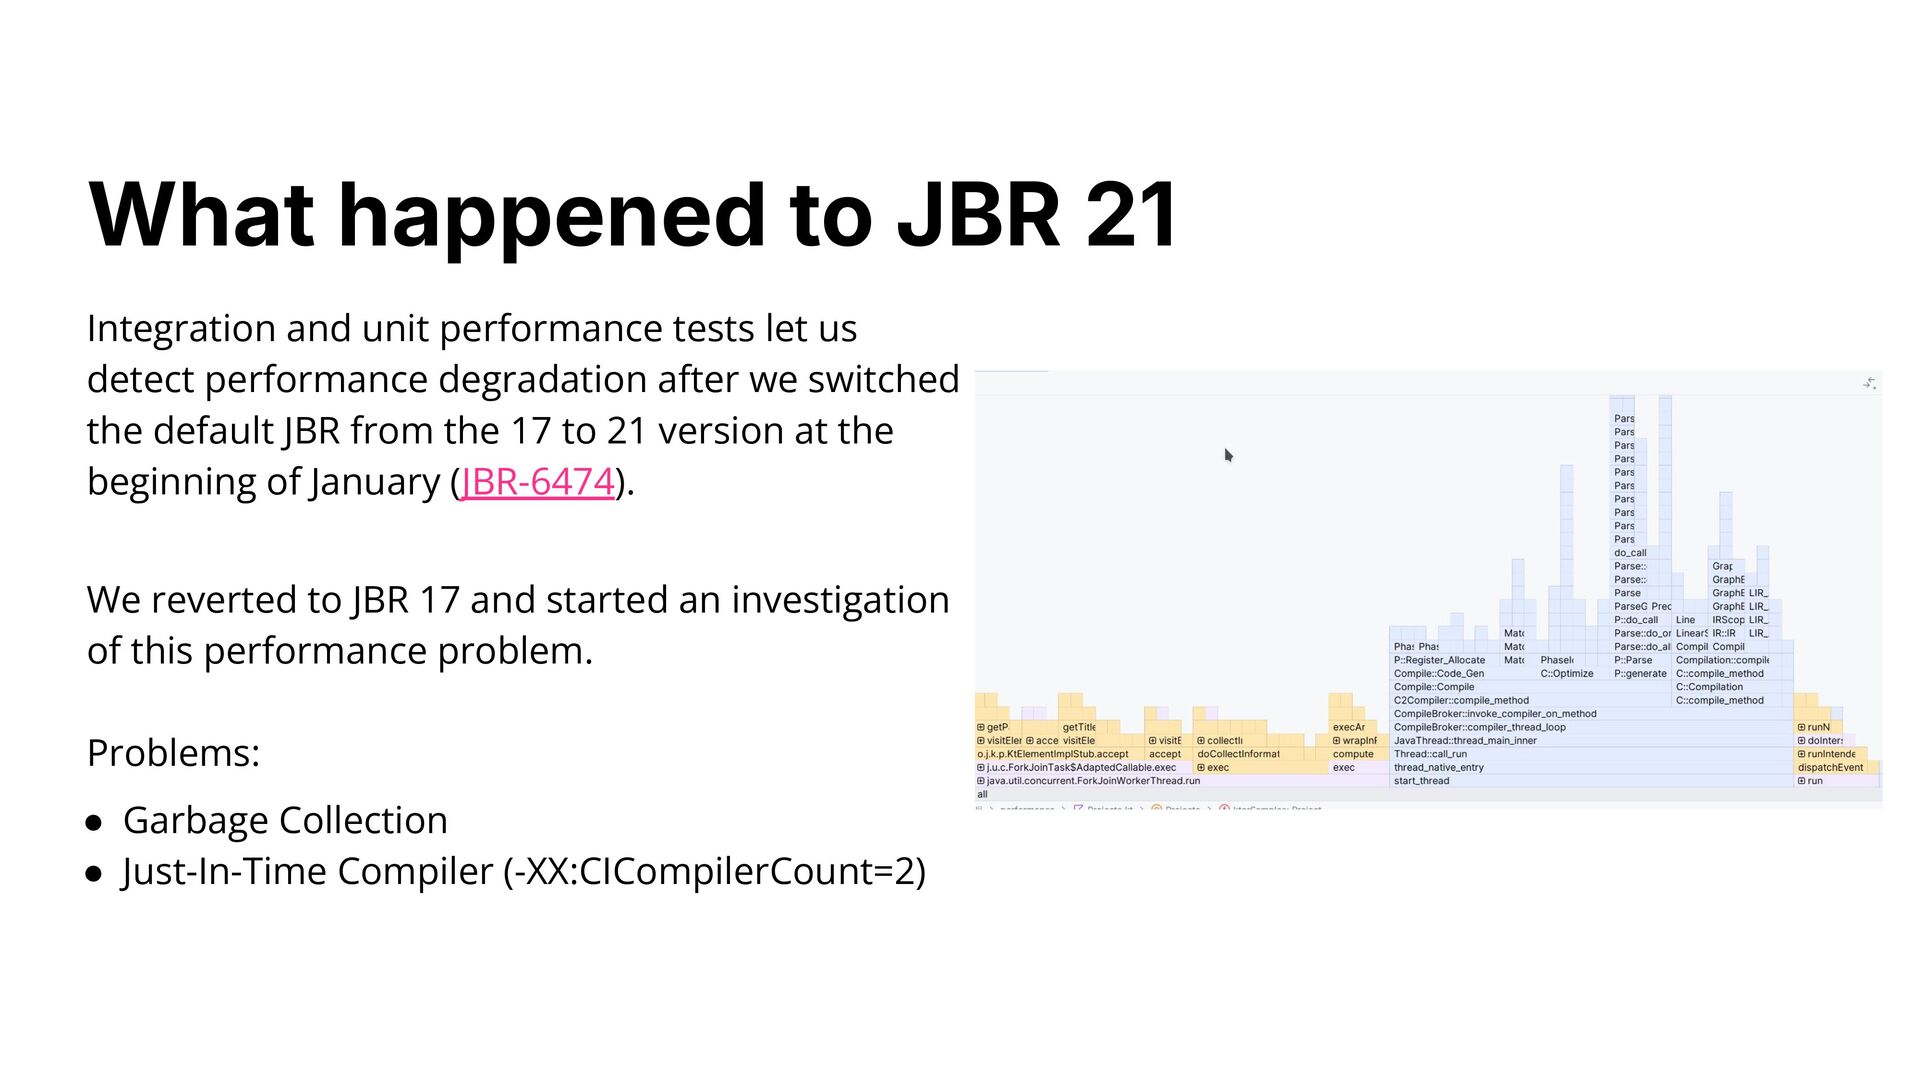
after we switched the default JBR from the 17 to 21 version at the beginning of January (JBR-6474). We reverted to JBR 17 and started an investigation of this performance problem. Problems: • Garbage Collection • Just-In-Time Compiler (-XX:CICompilerCount=2) What happened to JBR 21


 jreznot
 fornewid
 kitano_yuichi
 hasutosasaki
 veronikapj
 ostk0069
 sylph01
 aoshi
 yasunori0418
 rkaga
 sakawe_ee
 drumath2237
 ziobrando
 kimpetersen
 baasie
 akihiro_kokubo
 rasagy
 mlcsv
 tomoyanonymous
 jacobtomlinson
 rakko
 michielstock
 mza
 lara
 stephaniewalter