Upgrade to Pro — share decks privately, control downloads, hide ads and more …

Nonparametric single-cell multiomic characteriz...

Sponsored · Your Podcast. Everywhere. Effortlessly. Share. Educate. Inspire. Entertain. You do you. We'll handle the rest.

Nonparametric single-cell multiomic characterization of trio relationships between transcription factors, target genes, and cis-regulatory regions

LIBD Rstats Club on:
Title: Nonparametric single-cell multiomic characterization of trio relationships between transcription factors, target genes, and cis-regulatory regions
DOI: https://doi.org/10.1016/j.cels.2022.08.004
Presented By : Manisha Barse
Date: April 10, 2026

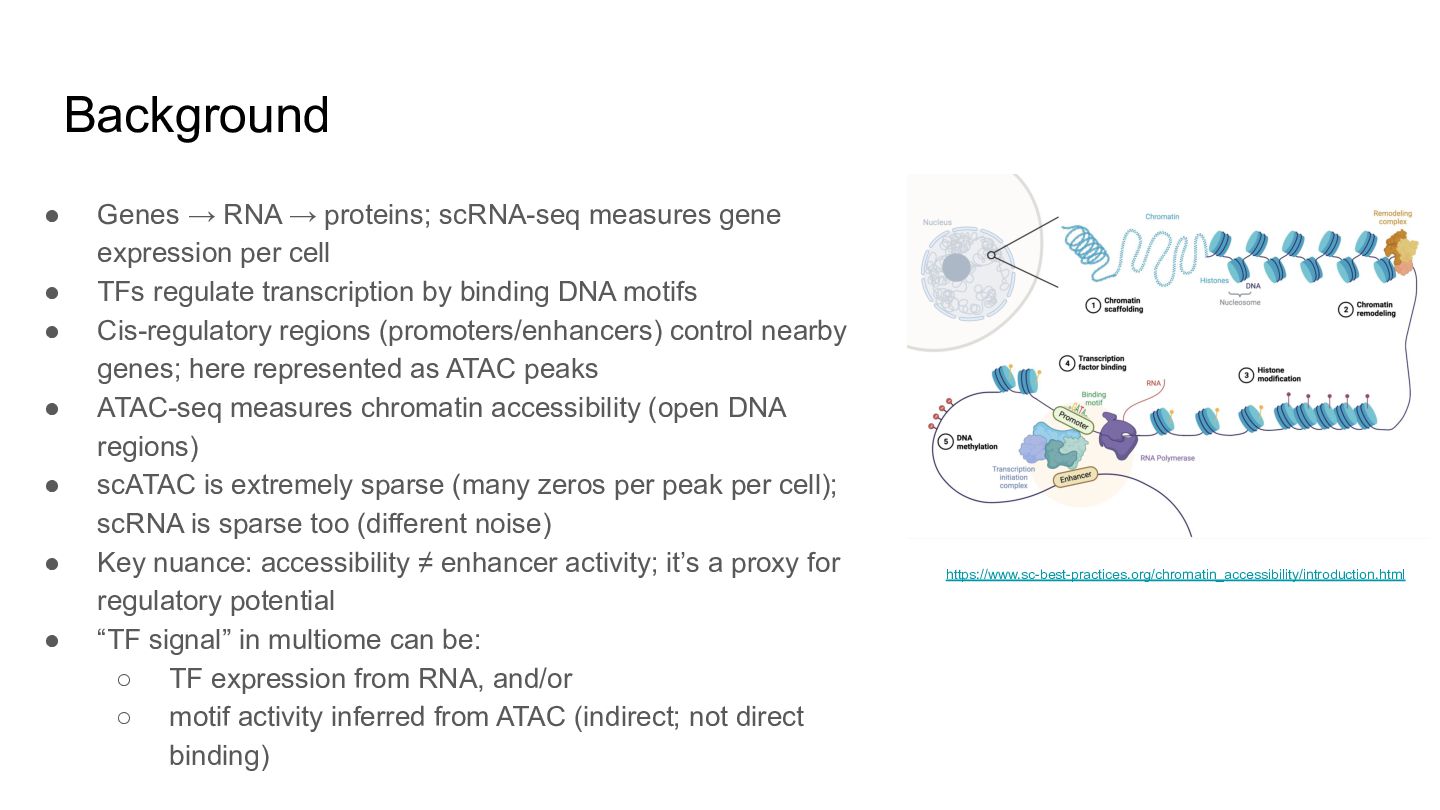
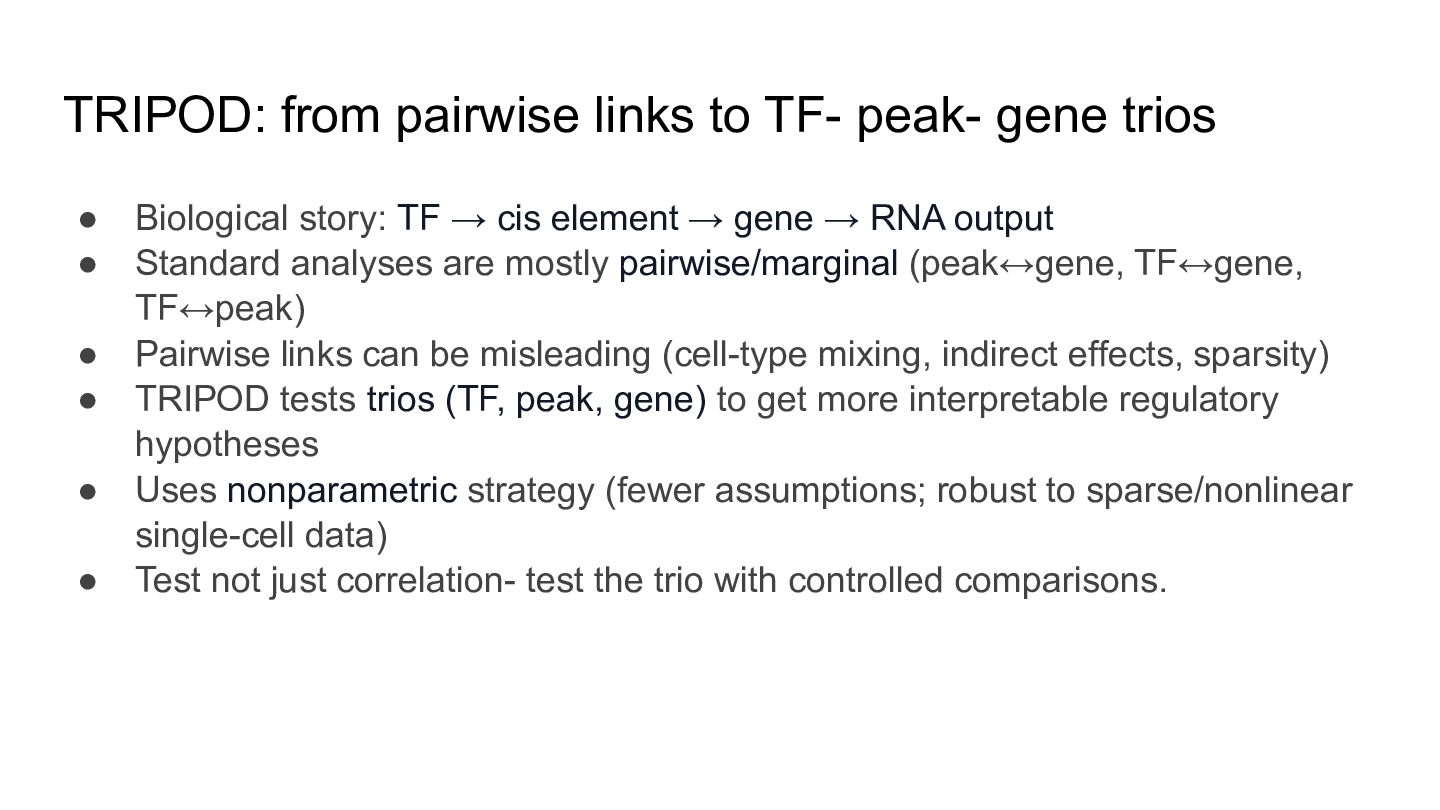
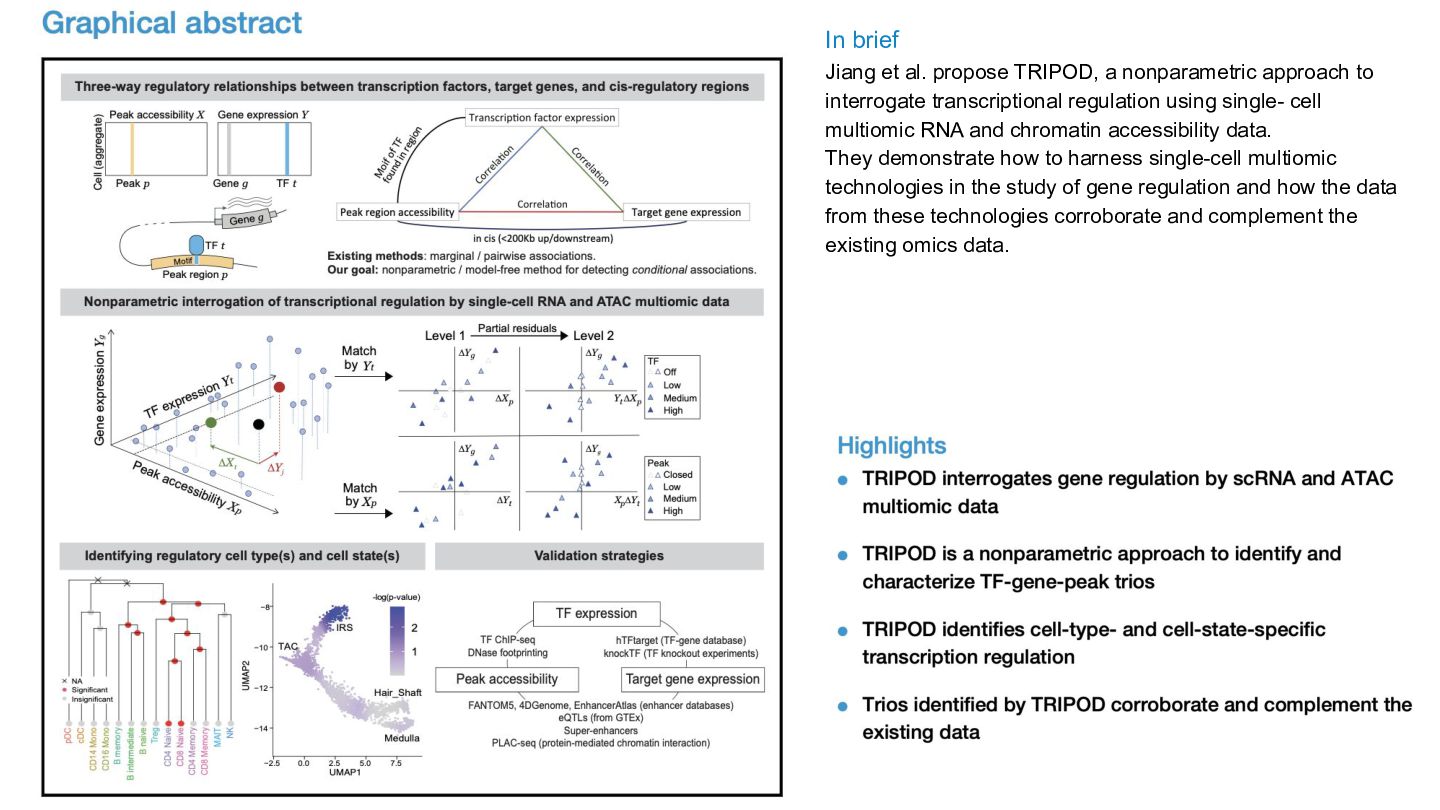
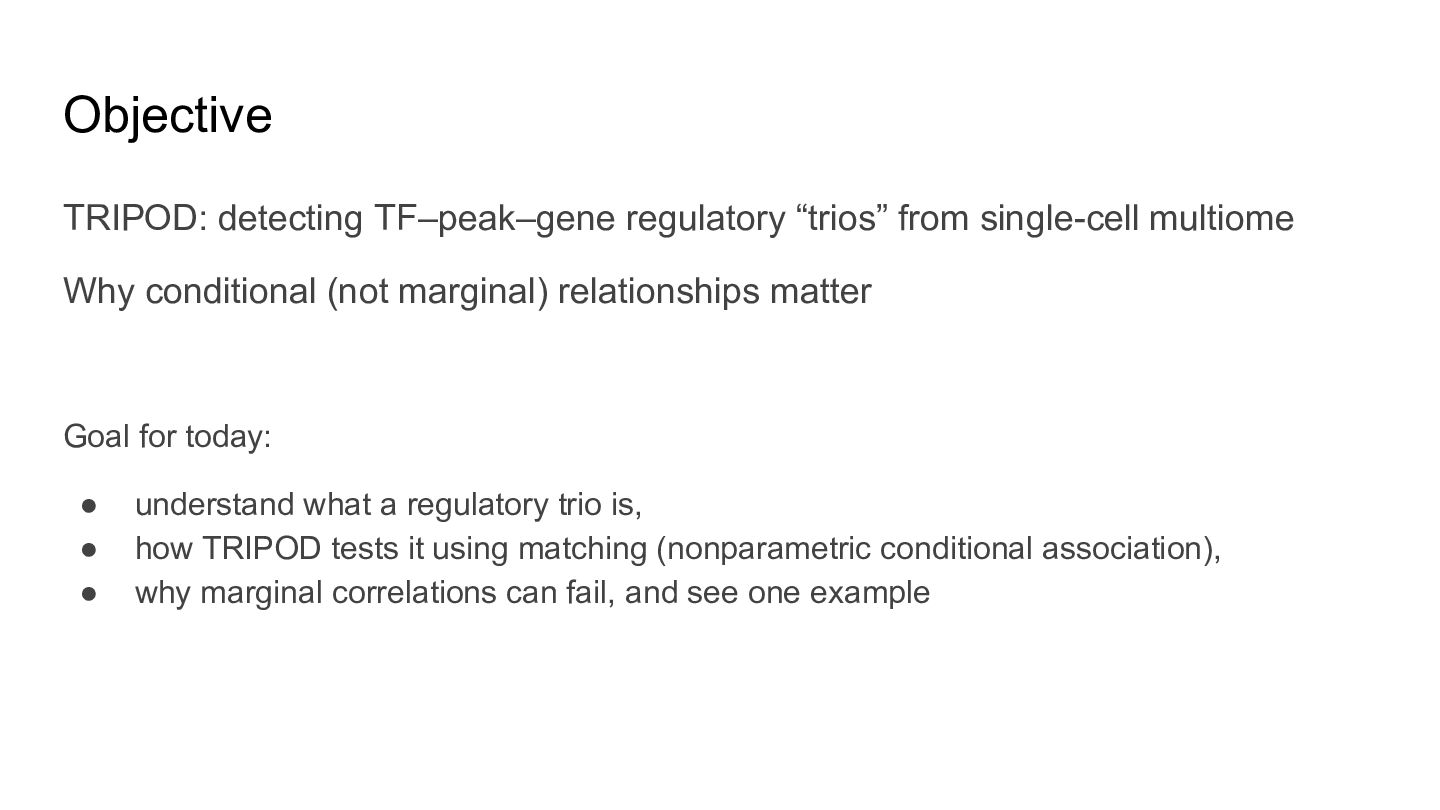
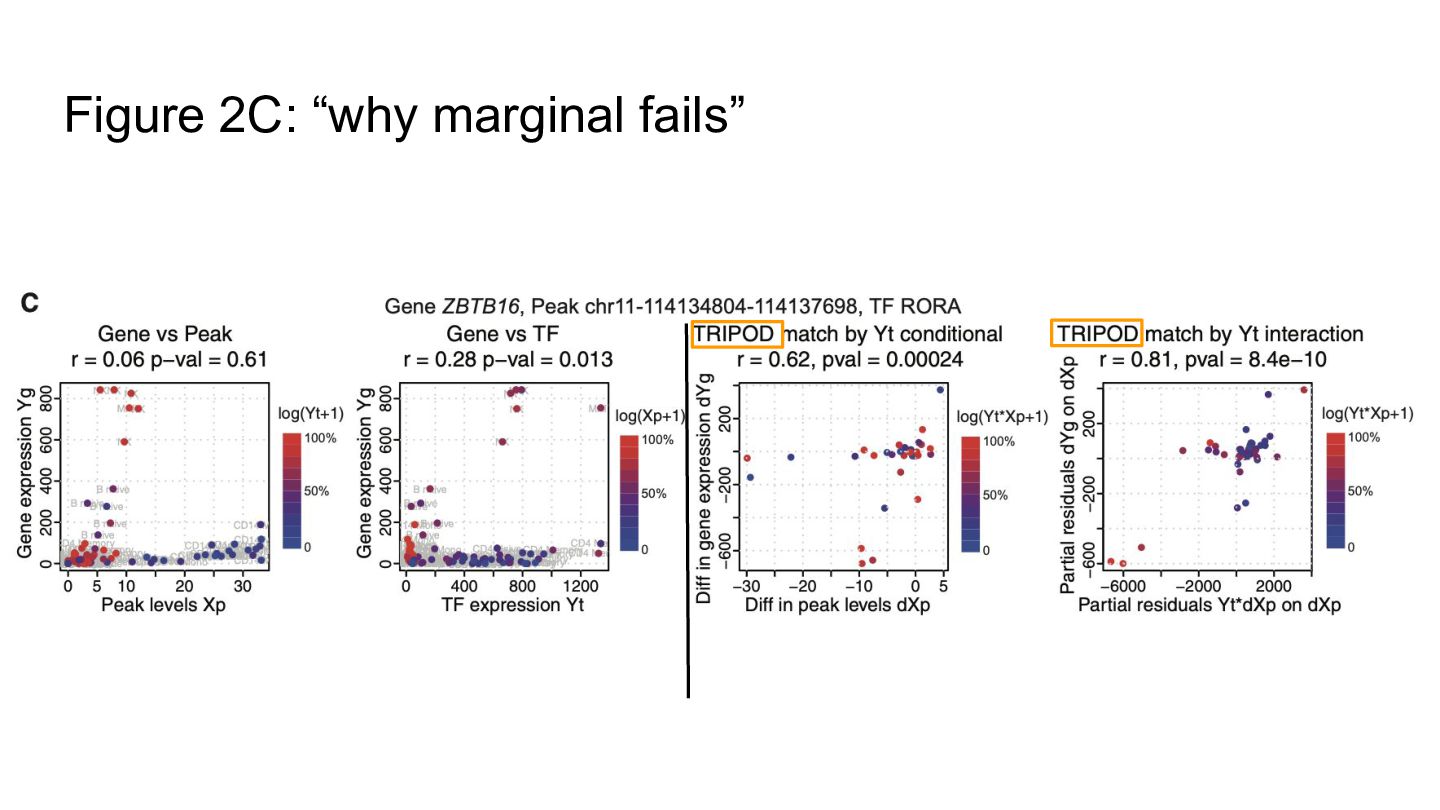
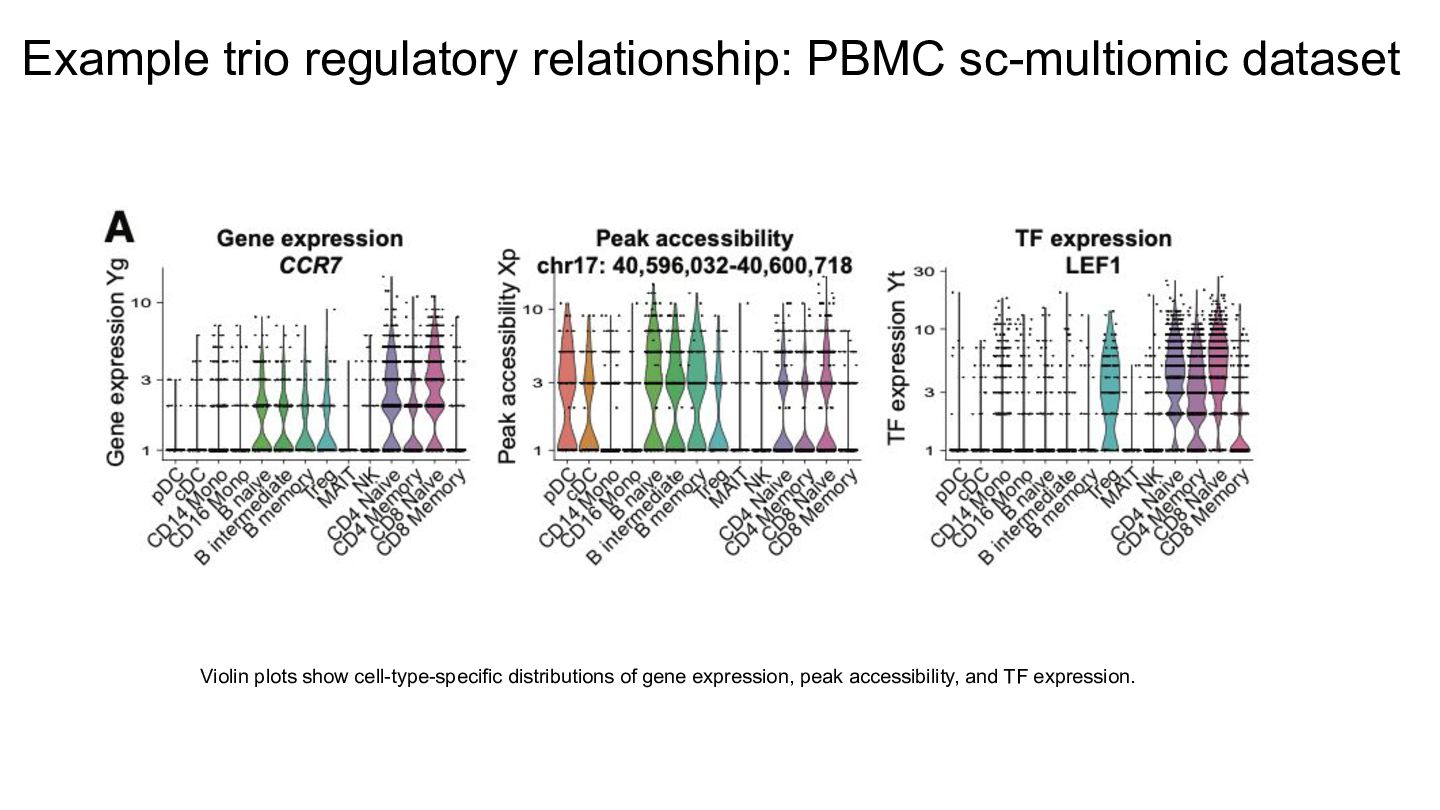
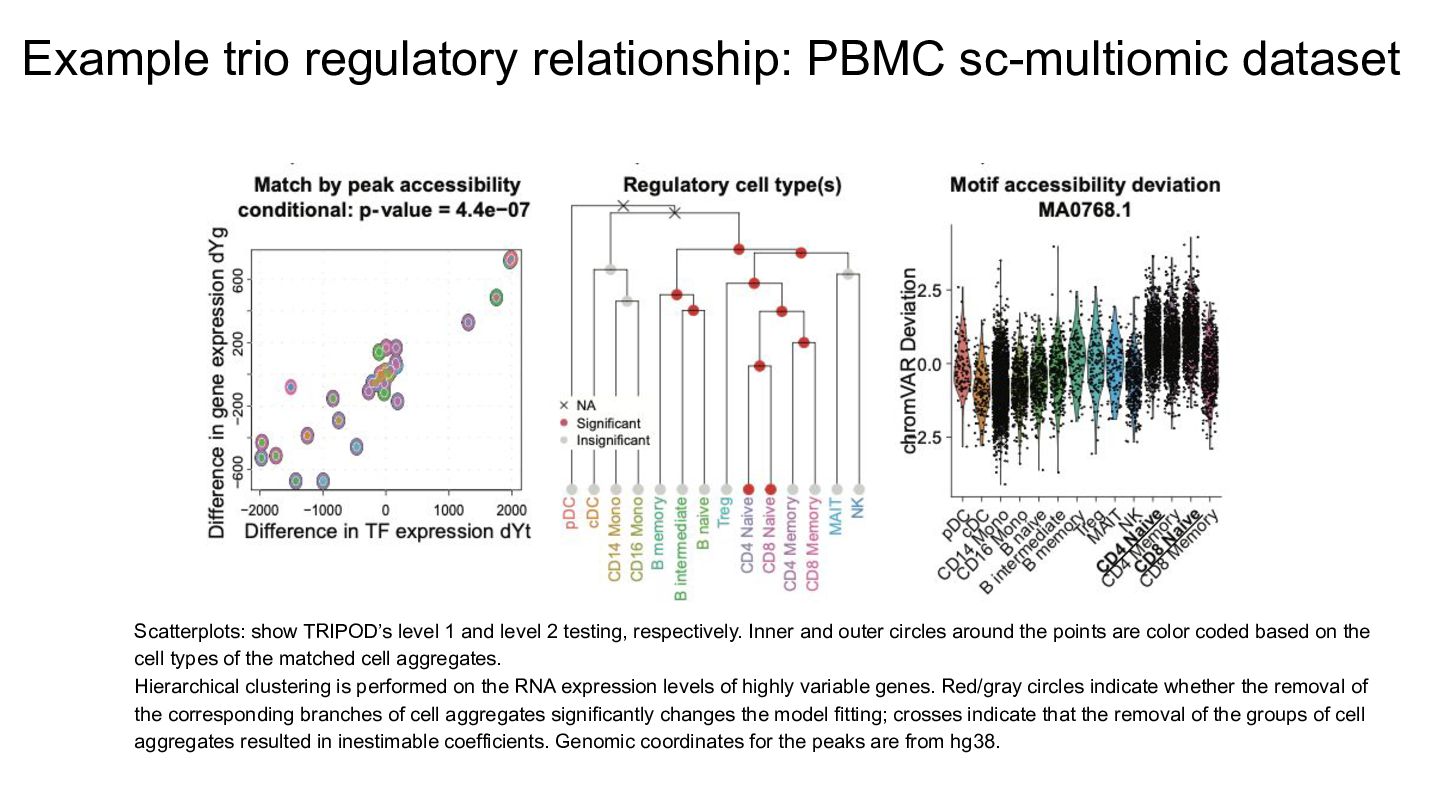
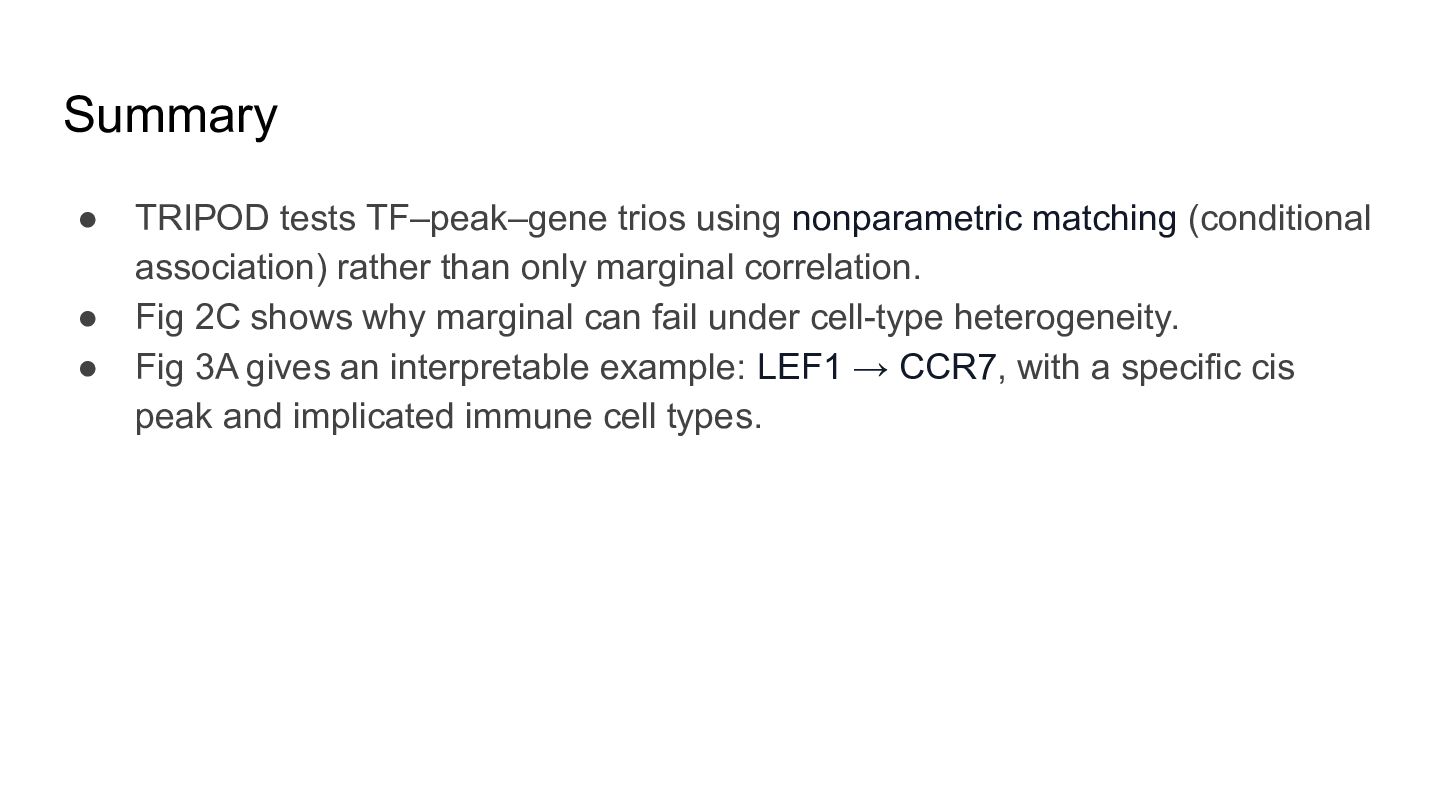
TRIPOD is a computational framework for identifying transcription factor (TF)–peak–gene regulatory trios from single-cell multiomic data. It leverages nonparametric conditional association testing to uncover regulatory relationships that are not captured by simple marginal correlations in heterogeneous single-cell systems. By integrating gene expression and chromatin accessibility at single-cell resolution, TRIPOD enables more precise inference of context-specific regulatory interactions. This presentation introduces the concept of regulatory trios, the intuition behind conditional testing, and illustrates one biological example demonstrating TRIPOD’s application.

Avatar for Manisha Barse

Manisha Barse

April 24, 2026

More Decks by Manisha Barse

Other Decks in Research

Transcript

  1. Nonparametric single-cell multiomic characterization of trio relationships between transcription factors,

    target genes, and cis-regulatory regions Yuchao Jiang et.al (2022) doi: https://doi.org/10.1016/j.cels.2022.08.004 Presented By: Manisha Barse April 10, 2026
  2. Background • Genes → RNA → proteins; scRNA-seq measures gene

    expression per cell • TFs regulate transcription by binding DNA motifs • Cis-regulatory regions (promoters/enhancers) control nearby genes; here represented as ATAC peaks • ATAC-seq measures chromatin accessibility (open DNA regions) • scATAC is extremely sparse (many zeros per peak per cell); scRNA is sparse too (different noise) • Key nuance: accessibility ≠ enhancer activity; it’s a proxy for regulatory potential • “TF signal” in multiome can be: ◦ TF expression from RNA, and/or ◦ motif activity inferred from ATAC (indirect; not direct binding) https://www.sc-best-practices.org/chromatin_accessibility/introduction.html
  3. TRIPOD: from pairwise links to TF- peak- gene trios •

    Biological story: TF → cis element → gene → RNA output • Standard analyses are mostly pairwise/marginal (peak↔gene, TF↔gene, TF↔peak) • Pairwise links can be misleading (cell-type mixing, indirect effects, sparsity) • TRIPOD tests trios (TF, peak, gene) to get more interpretable regulatory hypotheses • Uses nonparametric strategy (fewer assumptions; robust to sparse/nonlinear single-cell data) • Test not just correlation- test the trio with controlled comparisons.
  4. In brief Jiang et al. propose TRIPOD, a nonparametric approach

    to interrogate transcriptional regulation using single- cell multiomic RNA and chromatin accessibility data. They demonstrate how to harness single-cell multiomic technologies in the study of gene regulation and how the data from these technologies corroborate and complement the existing omics data.
  5. Objective TRIPOD: detecting TF–peak–gene regulatory “trios” from single-cell multiome Why

    conditional (not marginal) relationships matter Goal for today: • understand what a regulatory trio is, • how TRIPOD tests it using matching (nonparametric conditional association), • why marginal correlations can fail, and see one example
  6. Data input and schematic on a peak-TF-gene trio. • unit

    TRIPOD tests: (TF t, peak p, gene g) • “A ‘cis-regulatory region’: an ATAC peak near the gene.” • “Candidate trios are built because the peak is in cis and contains the TF motif (biological plausibility filter).” • “Now the question becomes statistical: do these 3 variables behave like a regulatory trio in single-cell data?”
  7. Example trio regulatory relationship: PBMC sc-multiomic dataset Violin plots show

    cell-type-specific distributions of gene expression, peak accessibility, and TF expression.
  8. Example trio regulatory relationship: PBMC sc-multiomic dataset Scatterplots: show TRIPOD’s

    level 1 and level 2 testing, respectively. Inner and outer circles around the points are color coded based on the cell types of the matched cell aggregates. Hierarchical clustering is performed on the RNA expression levels of highly variable genes. Red/gray circles indicate whether the removal of the corresponding branches of cell aggregates significantly changes the model fitting; crosses indicate that the removal of the groups of cell aggregates resulted in inestimable coefficients. Genomic coordinates for the peaks are from hg38.
  9. Summary • TRIPOD tests TF–peak–gene trios using nonparametric matching (conditional

    association) rather than only marginal correlation. • Fig 2C shows why marginal can fail under cell-type heterogeneity. • Fig 3A gives an interpretable example: LEF1 → CCR7, with a specific cis peak and implicated immune cell types.