Upgrade to Pro
— share decks privately, control downloads, hide ads and more …
Speaker Deck
Sign up for free
Menu
Search
Features
All features
Private URLs
Password Protection
Custom URLS
Scheduled publishing
Remove Branding
Restrict embedding
Deck Collections
Notes
Features
All features
Private URLs
Password Protection
Custom URLS
Scheduled publishing
Remove Branding
Restrict embedding
Deck Collections
Notes
Explore
Featured decks
Featured speakers
Programming
Technology
Storyboards
Explore
Featured decks
Featured speakers
Programming
Technology
Storyboards
Pricing
Search
Sign in
Sign up for free
Druid + R
Search
Metamarkets
April 03, 2013
Technology
210
0
Share
Embed
Copy iframe code
Copy JS code
Copy link
Start on current slide
Druid + R
Metamarkets
April 03, 2013
More Decks by Metamarkets
See All by Metamarkets
R Workshop for Beginners
metamx
2
4.7k
Other Decks in Technology
See All in Technology
AWS FinOps Agent 結局何が得意なの?
siromi
0
230
組み立てて楽しむ AWS Blocks 入門
kmiya84377
0
130
[2026 Oracle Technical Deep Dive] AI時代のデータベース基盤をどう選ぶ? Exadata Database Serviceの選択肢と使い分け (2026年9月17日開催)
oracle4engineer
PRO
0
190
AI Made Us Faster at Solving the Wrong Problems
marceloancelmo
0
140
高負荷プロダクション環境におけるAWS Lambdaのリアル 〜スケールとコストを左右する実行ライフサイクルの技術仕様〜
maimyyym
2
850
HolmesGPTで始めるSREエージェント入門!プラットフォームの障害調査はAIにお任せ 〜
sanghyuk
0
250
AI感のないAWS構成図をAIエージェントに描かせたい!
sagochiko
2
500
[2026 Oracle Technical Deep Dive] エンタープライズAIエージェントを支えるOCIソリューション。ラインナップと特徴を理解しよう! (2026年9月17日開催)
oracle4engineer
PRO
0
240
あなたの知らないAmazon VPC Route Server/Amazon VPC Route Server you don't know about
masakiokuda
2
210
AIは爆速なのに、私が詰まっていた話 ― 音声入力と鳴くマスコットでボトルネックを削る
yama3133
0
310
私の推しは「聞いてから進む」AIです -AI-DLCに一人でアプリを作らせた話
yama3133
1
160
20260930_Gemma4_Hands-on
tsho
0
210
Featured
See All Featured
sira's awesome portfolio website redesign presentation
elsirapls
0
430
The Illustrated Children's Guide to Kubernetes
chrisshort
51
53k
HU Berlin: Industrial-Strength Natural Language Processing with spaCy and Prodigy
inesmontani
PRO
0
730
Navigating the moral maze — ethical principles for Al-driven product design
skipperchong
2
590
[Rails World 2023 - Day 1 Closing Keynote] - The Magic of Rails
eileencodes
38
3k
個人開発の失敗を避けるイケてる考え方 / tips for indie hackers
panda_program
123
22k
WENDY [Excerpt]
tessaabrams
14
40k
Leveraging Curiosity to Care for An Aging Population
cassininazir
1
520
Leadership Guide Workshop - DevTernity 2021
reverentgeek
1
380
XXLCSS - How to scale CSS and keep your sanity
sugarenia
250
1.3M
Practical Orchestrator
shlominoach
192
12k
[Rails World 2026] Durable orchestration on Rails: from continuation to workflow
palkan
1
410
Transcript
Druid + R aggregate all your data
agenda An Overview of Druid RDruid Lab Conclusions
motivation visualize big data existing data engines did not meet
our needs
motivation relational databases scans were too slow! NoSQL computationally intractable
pre-computations took too long! nothing existed that could solve our problems (or was cost prohibitive)
enter Druid real-time distributed column-oriented analytical data store scales horizontally
open-source
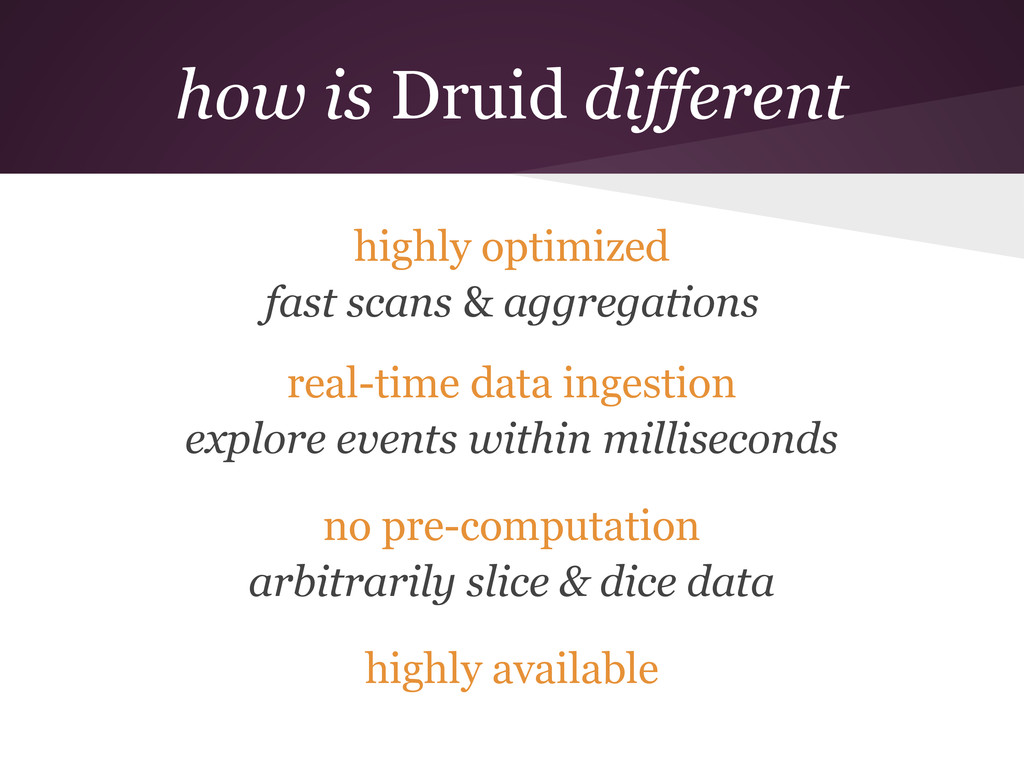
how is Druid different highly optimized fast scans & aggregations
real-time data ingestion explore events within milliseconds no pre-computation arbitrarily slice & dice data highly available
using Druid we will explore Druid architecture in future meetups
let's learn to use Druid!
RDruid slicing & dicing on steroids
what are we addressing? slicing and dicing data in R
is fun… …until you run out of memory
solution fire up a 64G EC2 machine and hope it
works or let Druid do the work for you
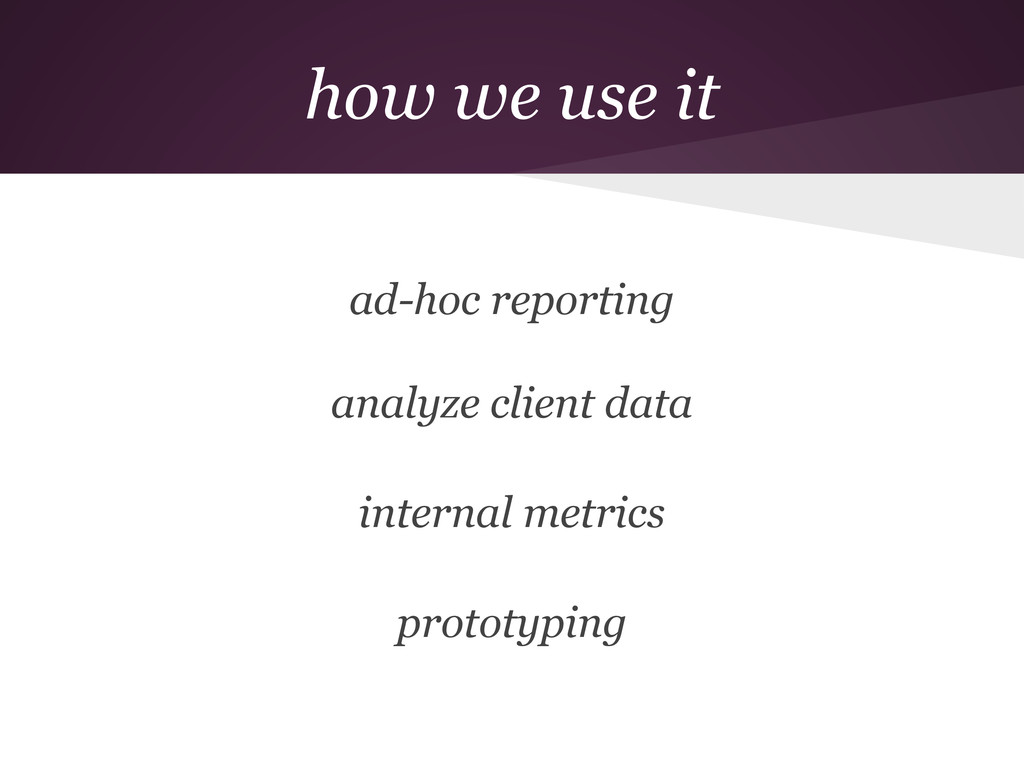
how we use it ad-hoc reporting analyze client data internal
metrics prototyping
metrics
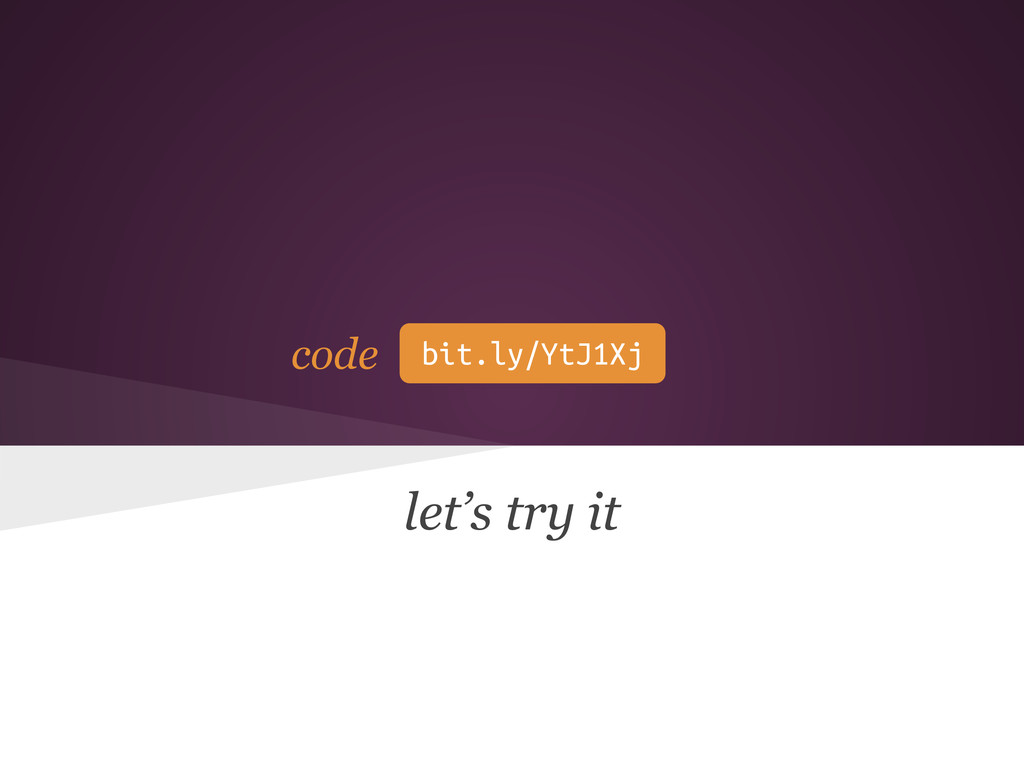
let’s try it code bit.ly/YtJ1Xj
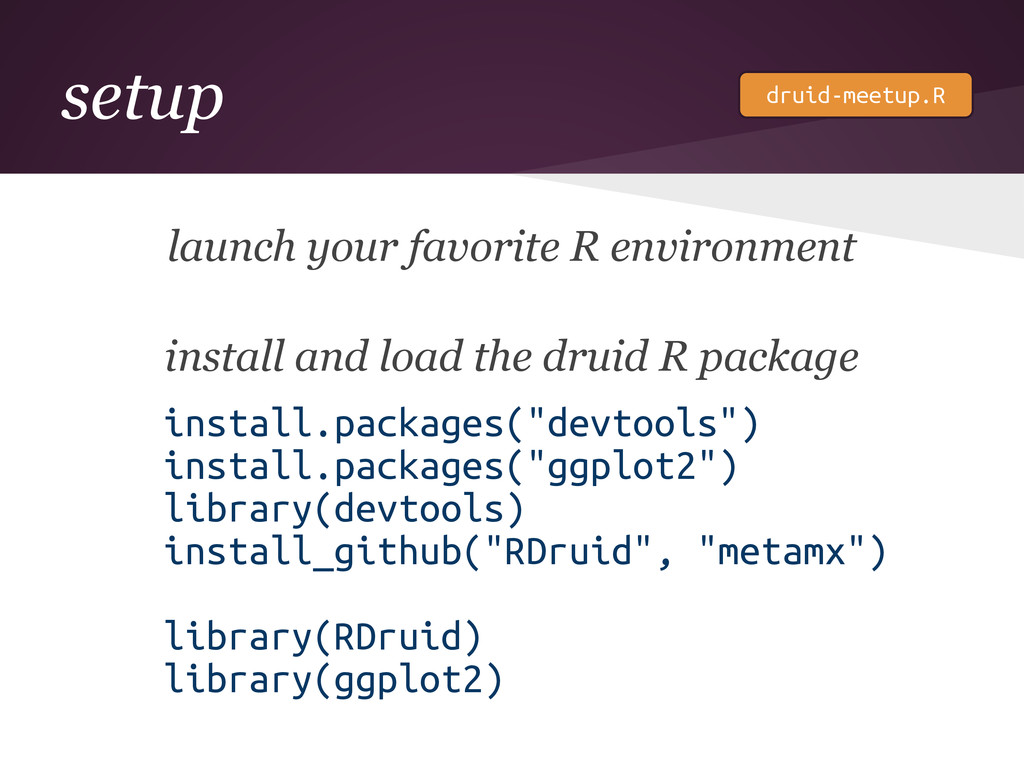
setup launch your favorite R environment install and load the
druid R package install.packages("devtools") install.packages("ggplot2") library(devtools) install_github("RDruid", "metamx") library(RDruid) library(ggplot2) druid-meetup.R
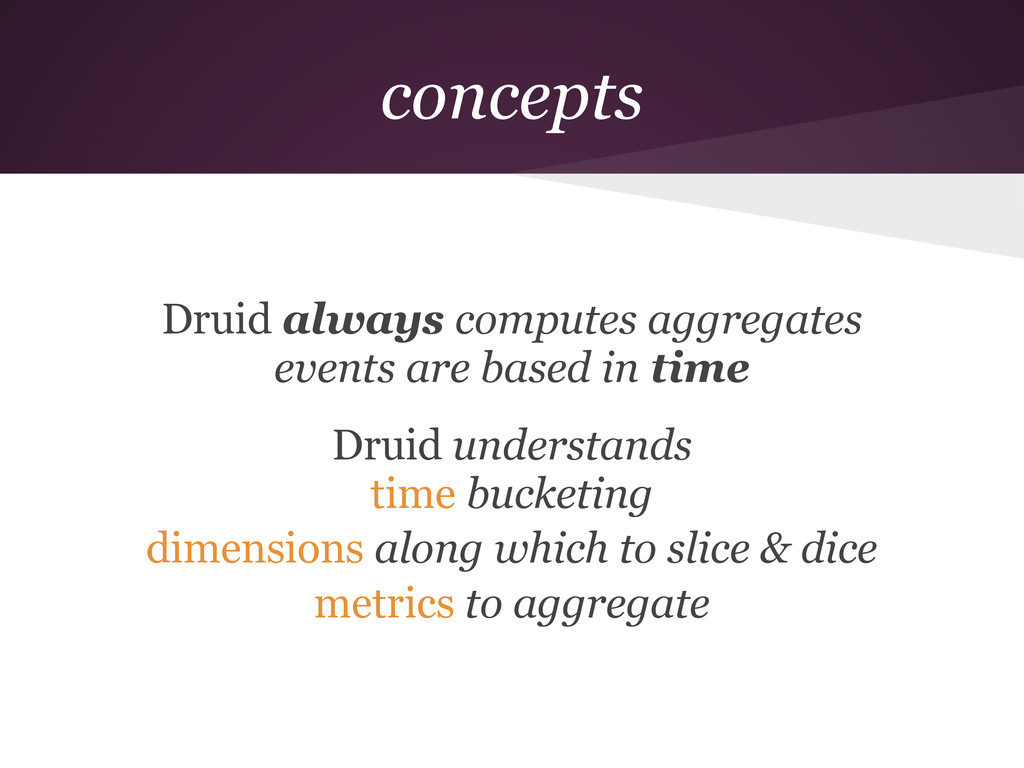
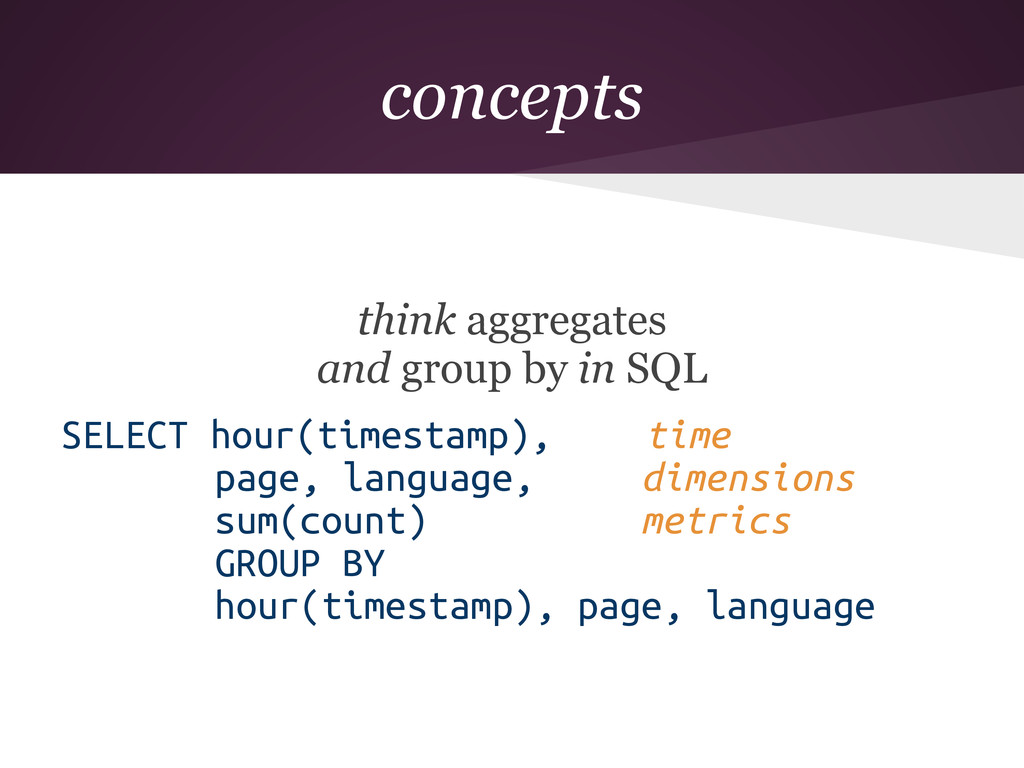
concepts Druid always computes aggregates events are based in time
Druid understands time bucketing dimensions along which to slice & dice metrics to aggregate
concepts think aggregates and group by in SQL SELECT hour(timestamp),
time page, language, dimensions sum(count) metrics GROUP BY hour(timestamp), page, language
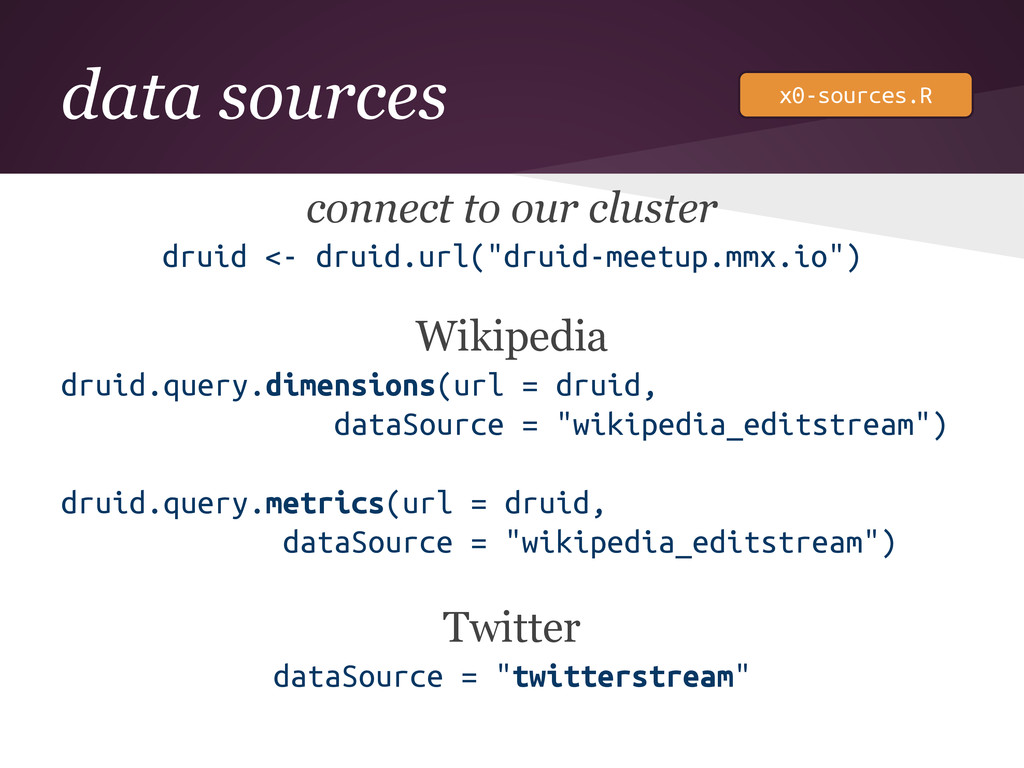
data sources connect to our cluster druid <- druid.url("druid-meetup.mmx.io") Wikipedia
druid.query.dimensions(url = druid, dataSource = "wikipedia_editstream") druid.query.metrics(url = druid, dataSource = "wikipedia_editstream") Twitter dataSource = "twitterstream" x0-sources.R
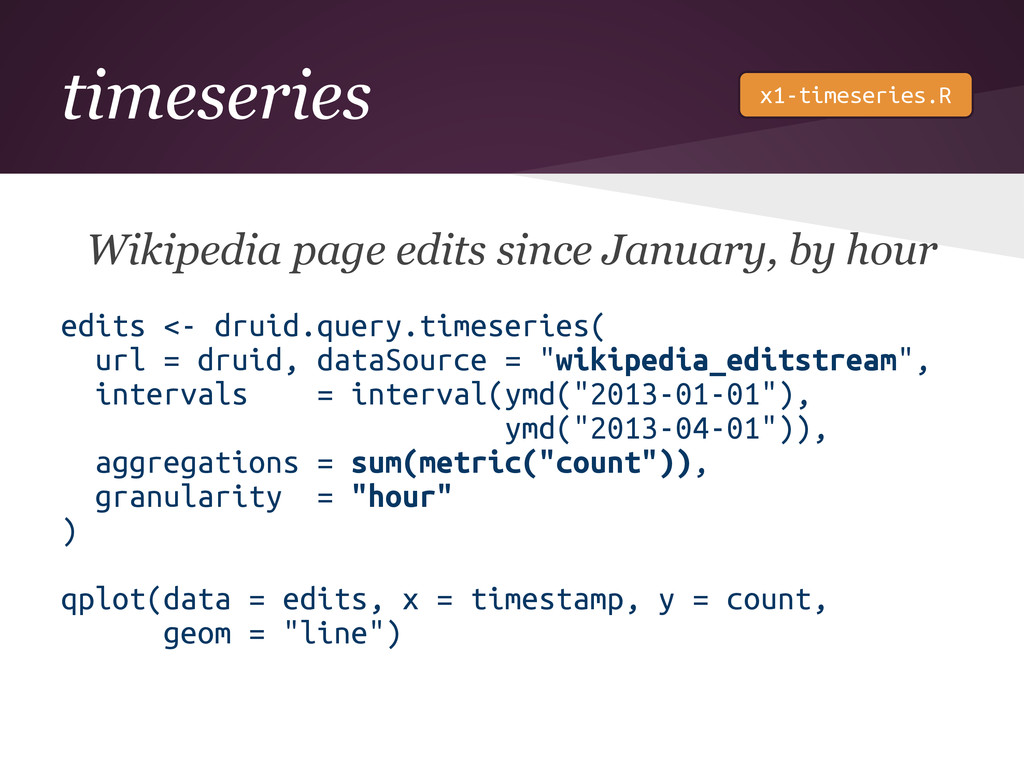
timeseries Wikipedia page edits since January, by hour edits <-
druid.query.timeseries( url = druid, dataSource = "wikipedia_editstream", intervals = interval(ymd("2013-01-01"), ymd("2013-04-01")), aggregations = sum(metric("count")), granularity = "hour" ) qplot(data = edits, x = timestamp, y = count, geom = "line") x1-timeseries.R
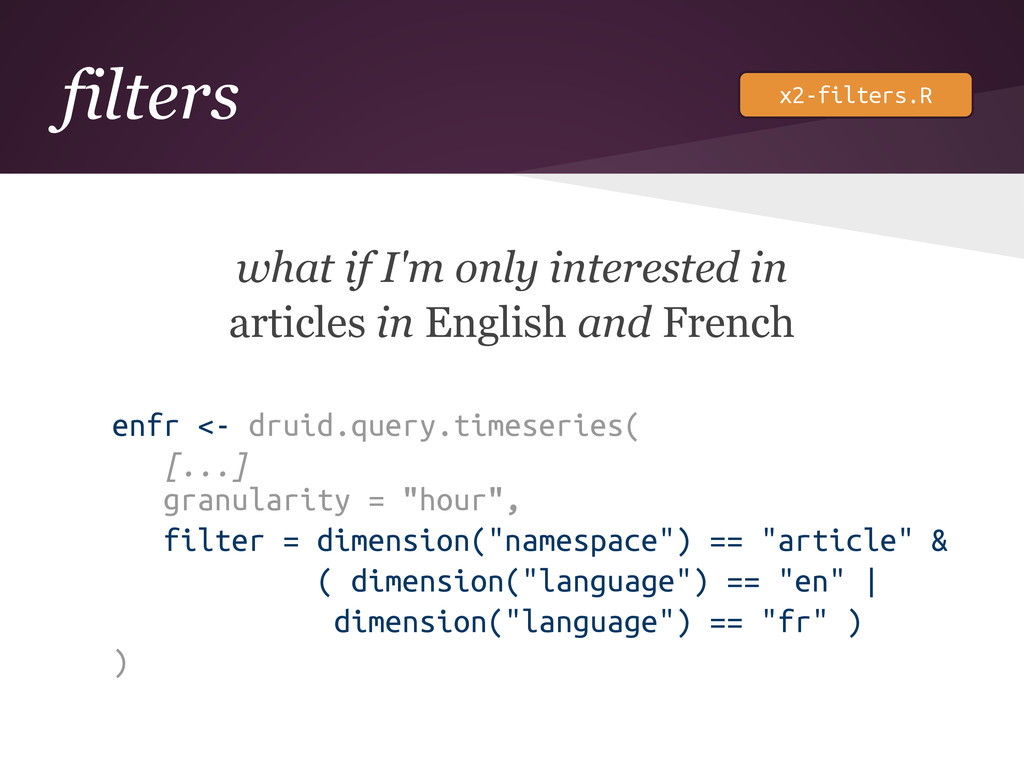
filters what if I'm only interested in articles in English
and French enfr <- druid.query.timeseries( [...] granularity = "hour", filter = dimension("namespace") == "article" & ( dimension("language") == "en" | dimension("language") == "fr" ) ) x2-filters.R
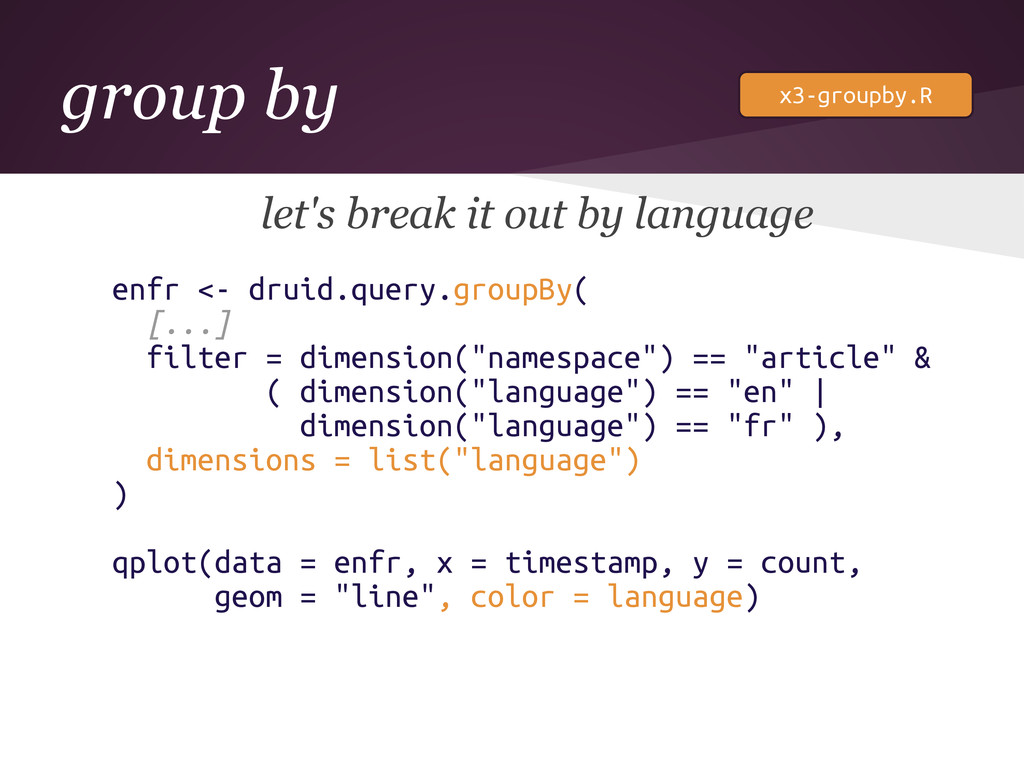
group by let's break it out by language enfr <-
druid.query.groupBy( [...] filter = dimension("namespace") == "article" & ( dimension("language") == "en" | dimension("language") == "fr" ), dimensions = list("language") ) qplot(data = enfr, x = timestamp, y = count, geom = "line", color = language) x3-groupby.R
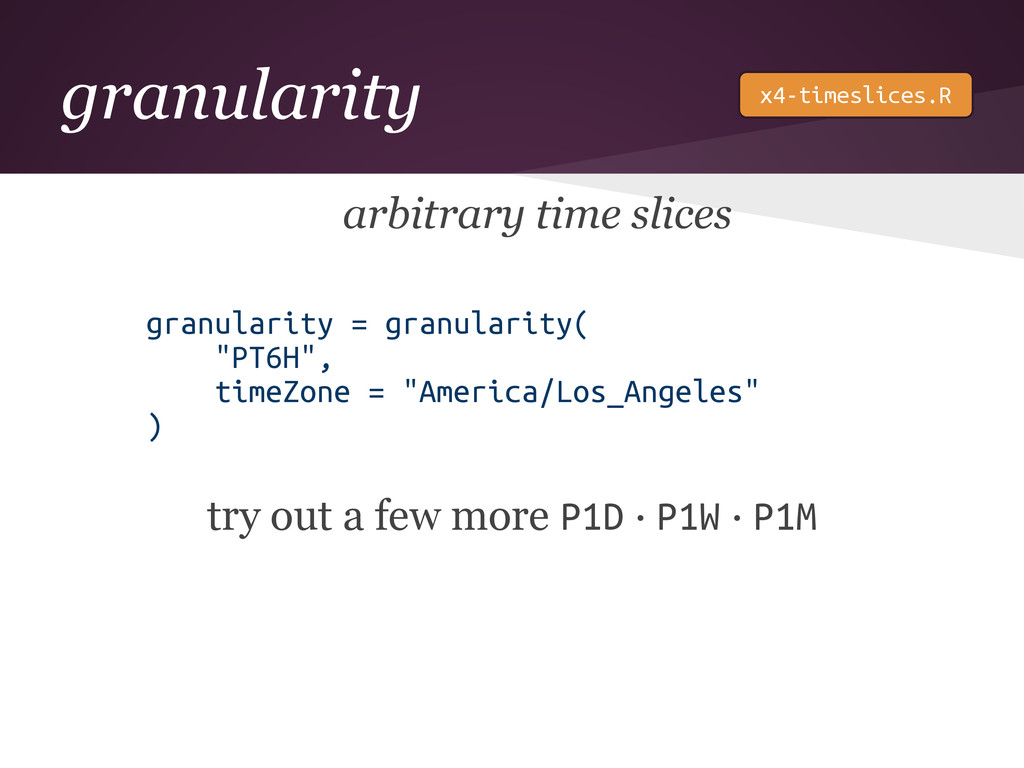
granularity arbitrary time slices granularity = granularity( "PT6H", timeZone =
"America/Los_Angeles" ) try out a few more P1D · P1W · P1M x4-timeslices.R
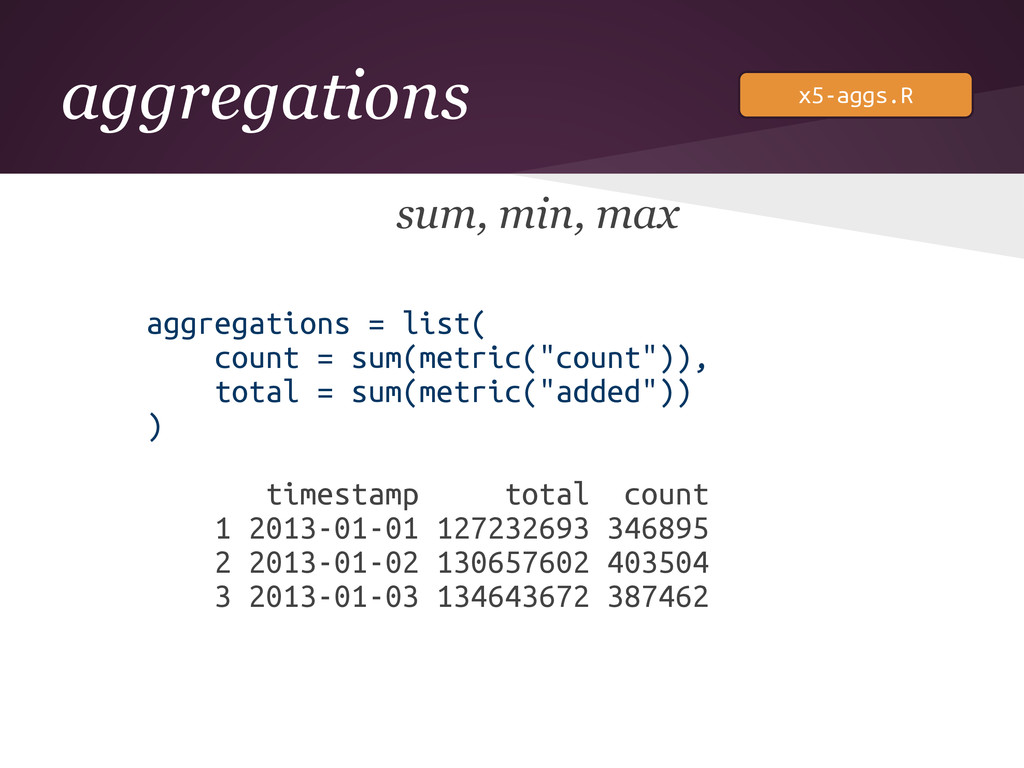
aggregations sum, min, max aggregations = list( count = sum(metric("count")),
total = sum(metric("added")) ) timestamp total count 1 2013-01-01 127232693 346895 2 2013-01-02 130657602 403504 3 2013-01-03 134643672 387462 x5-aggs.R
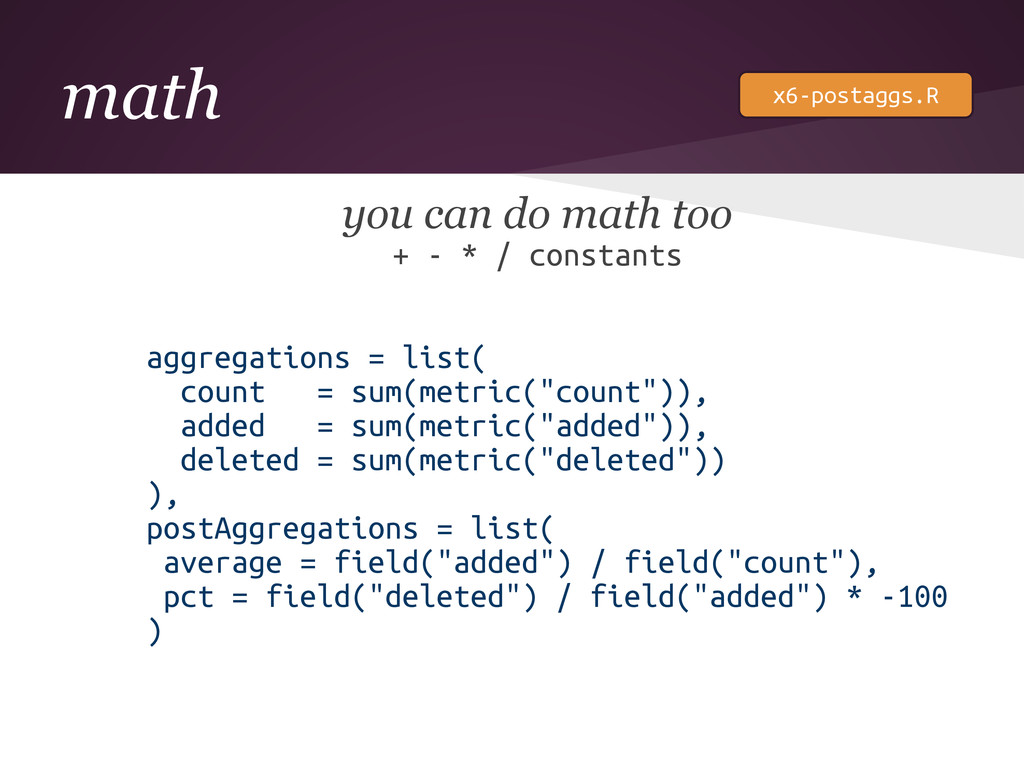
math you can do math too + - * /
constants aggregations = list( count = sum(metric("count")), added = sum(metric("added")), deleted = sum(metric("deleted")) ), postAggregations = list( average = field("added") / field("count"), pct = field("deleted") / field("added") * -100 ) x6-postaggs.R
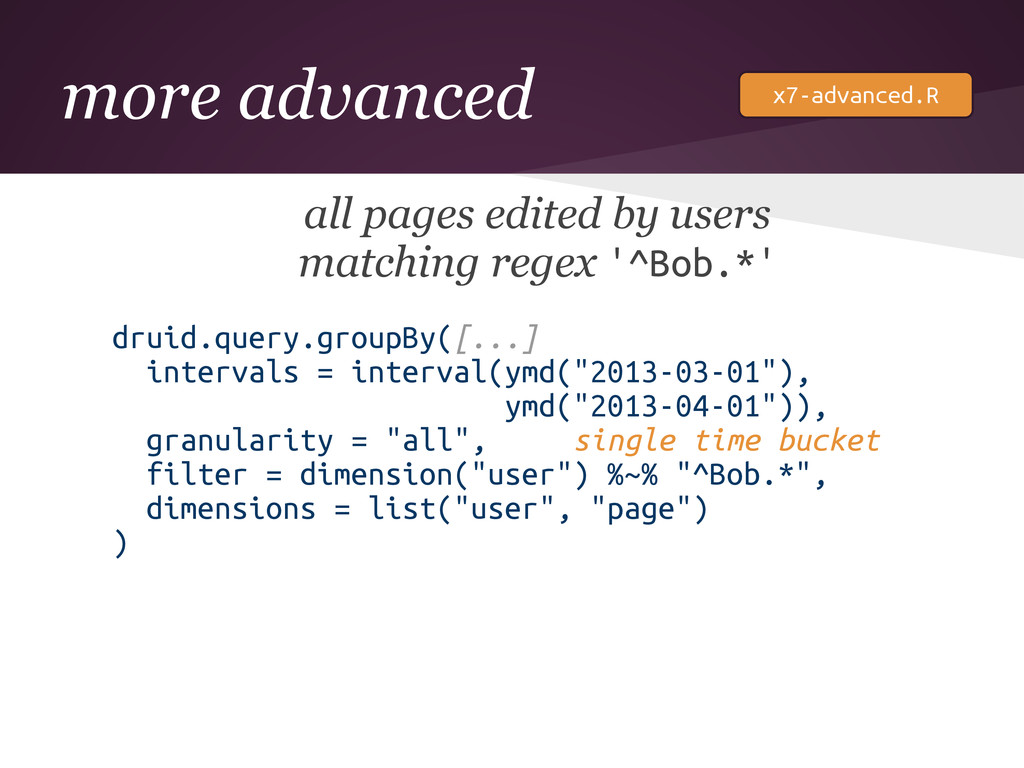
more advanced all pages edited by users matching regex '^Bob.*'
druid.query.groupBy([...] intervals = interval(ymd("2013-03-01"), ymd("2013-04-01")), granularity = "all", single time bucket filter = dimension("user") %~% "^Bob.*", dimensions = list("user", "page") ) x7-advanced.R
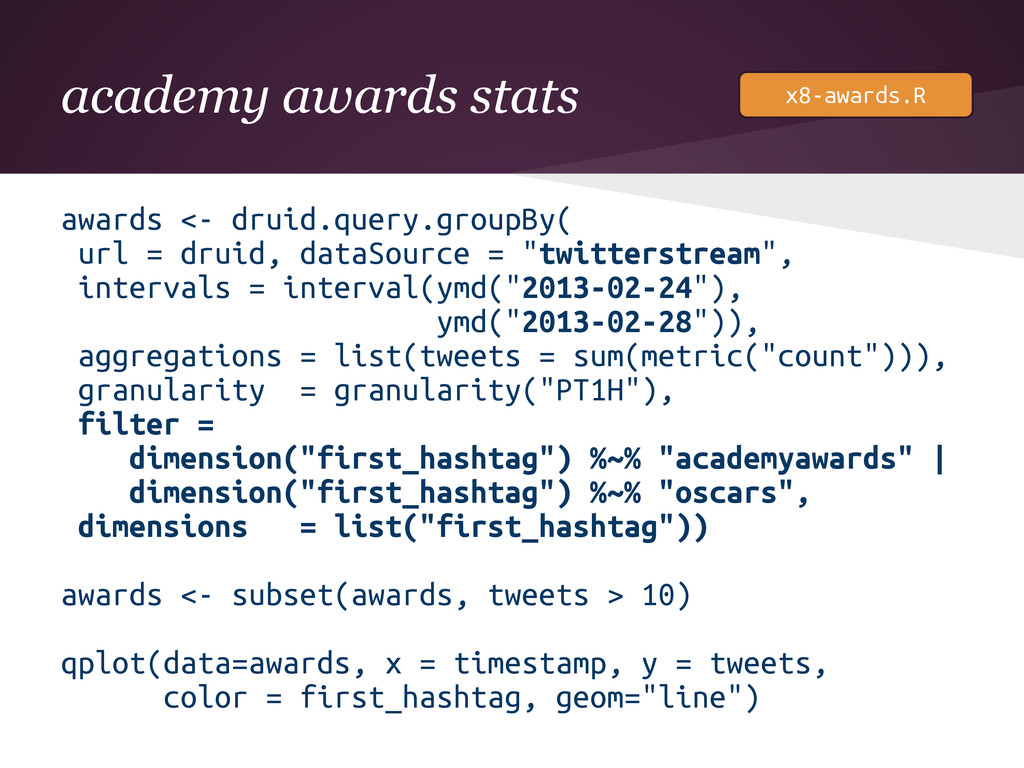
academy awards stats awards <- druid.query.groupBy( url = druid, dataSource
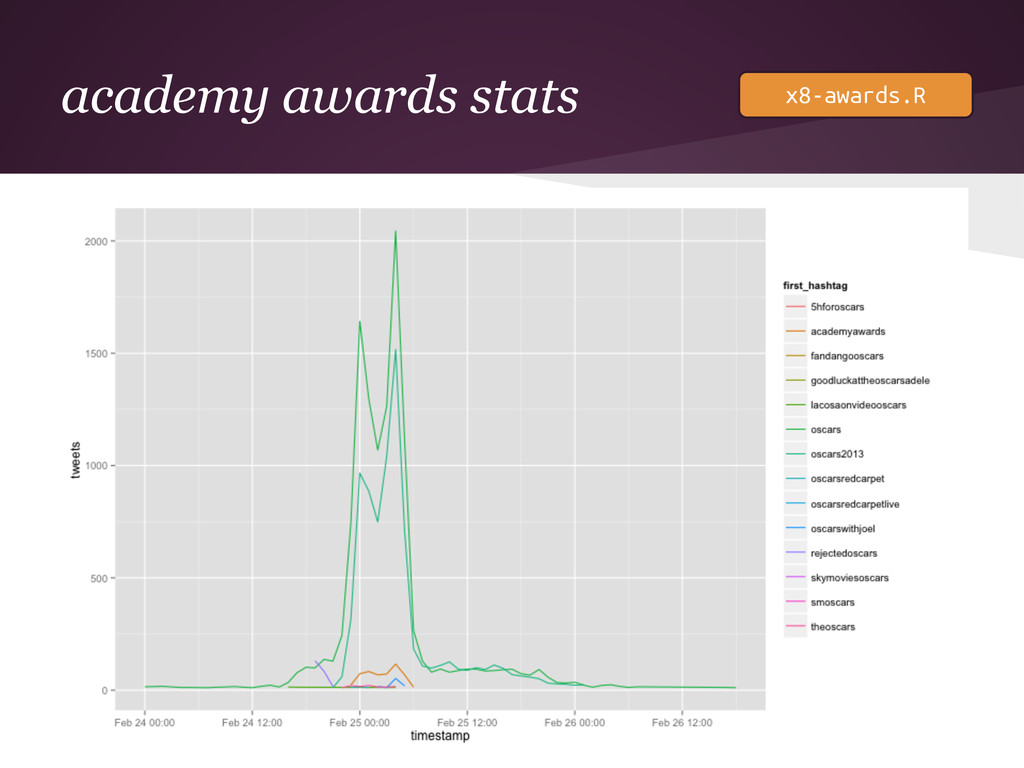
= "twitterstream", intervals = interval(ymd("2013-02-24"), ymd("2013-02-28")), aggregations = list(tweets = sum(metric("count"))), granularity = granularity("PT1H"), filter = dimension("first_hashtag") %~% "academyawards" | dimension("first_hashtag") %~% "oscars", dimensions = list("first_hashtag")) awards <- subset(awards, tweets > 10) qplot(data=awards, x = timestamp, y = tweets, color = first_hashtag, geom="line") x8-awards.R
academy awards stats x8-awards.R
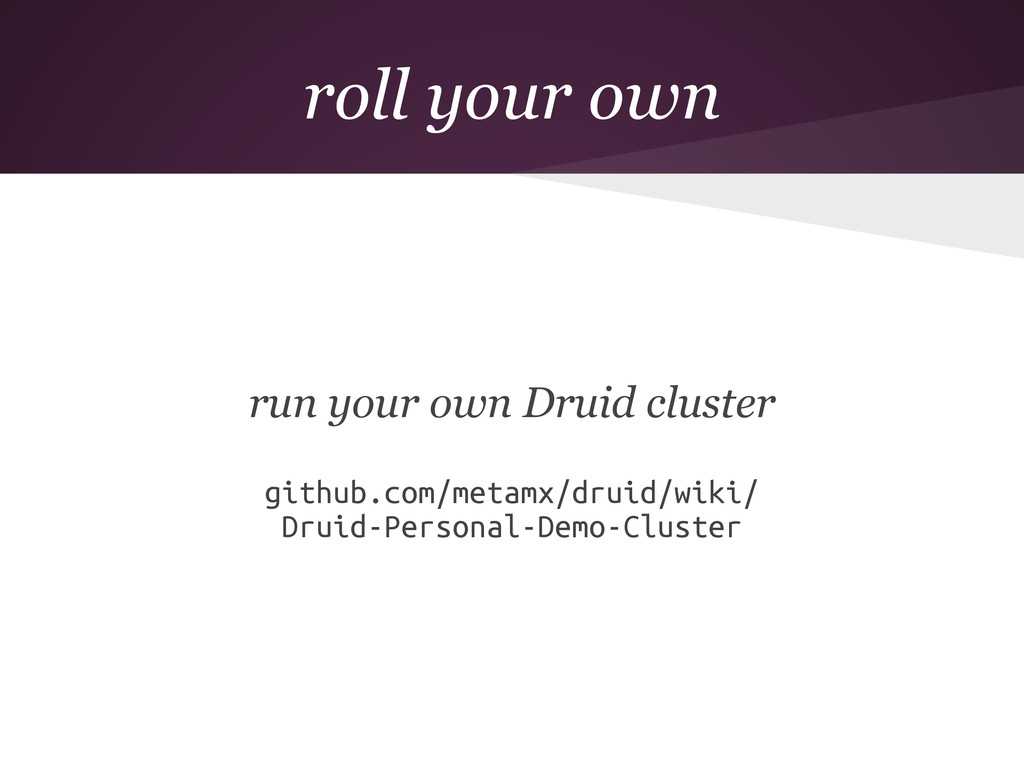
roll your own run your own Druid cluster github.com/metamx/druid/wiki/ Druid-Personal-Demo-Cluster
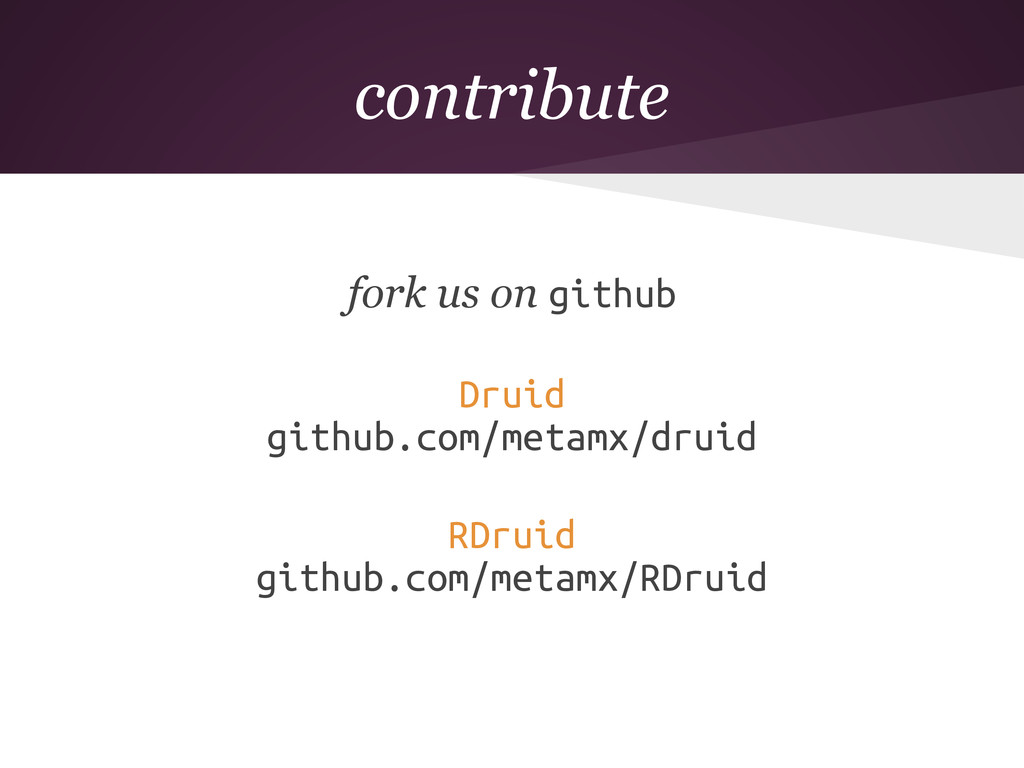
contribute fork us on github Druid github.com/metamx/druid RDruid github.com/metamx/RDruid
thank you


 metamx
 siromi
 kmiya84377
 oracle4engineer
 marceloancelmo
 maimyyym
 sanghyuk
 sagochiko
 masakiokuda
 yama3133
 tsho
tsho
 elsirapls
 chrisshort
 inesmontani
 skipperchong
 eileencodes
 panda_program
 tessaabrams
 cassininazir
 reverentgeek
 sugarenia
 shlominoach
 palkan