Upgrade to Pro — share decks privately, control downloads, hide ads and more …

DBI (Dynamic Binary Instrumentation)

Avatar for srup srup
April 23, 2019

DBI (Dynamic Binary Instrumentation)

コンピュータ部 LT

Avatar for srup

srup

April 23, 2019
Tweet

More Decks by srup

Other Decks in Technology

Transcript

  1. Instrumentation - プログラムの実行に関する情報をを集めるために , プログラムにコードを挿入すること . - source instrumentation(code patching):

    - 解析したいソースコードに instrumentation する. - binary instrumentation: - 実行ファイルに instrumentation する. - 既存の binary-level instrumentaion system: - 静的 - ATOM([2]), EEL, Etch, Morph - 動的: - Pin([1]), Valgrind([3]), Dtrace, DynamoRIO
  2. source instrumentation (1) int dp[N][M]; int main(void) { dp[0][0] =

    0; for (int i = 0; i <N; i++) { for (int j = 0; j < M; j++) { if (i < 1 || j < 1) { dp[i][j] = dp[i][j]; } dp[i][j] = dp[i - 1][j - 1]; }}} int dp[N][M]; int main(void) { dp[0][0] = 0; for (int i = 0; i <N; i++) { for (int j = 0; j < M; j++) { count[0]++; if (i < 1 || j < 1) { count[1]++; dp[i][j] = dp[i][j]; } dp[i][j] = dp[i - 1][j - 1]; }}}
  3. binary instrumentation push rbp mov rbp, rsp mov DWORD PTR[rbp-0x8],

    0x0 mov DWORD PTR[rbp-0x4], 0x0 add DWORD PTR[rbp-0x8], 0x1 cmp DWORD PTR[rbp-0x8], 0x9 push rbp icount++; mov rbp, rsp icount++; mov DWORD PTR[rbp-0x8], 0x0 icount++; mov DWORD PTR[rbp-0x4], 0x0 icount++; add DWORD PTR[rbp-0x8], 0x1 icount++; cmp DWORD PTR[rbp-0x8], 0x9 icount++;
  4. DBIの長所 - ソースコードを再びコンパイルする必要がない . - 実行する命令が実行時にすべてわかる - 静的な状態だと, 実行ファイルのコードとデータを見分ける十分な情報がない .

    - souce implementation や SBI(Static Binary Implementation) では扱えないコードを 扱える - 静的な状態で未知の間接分岐 - 動的にロードされるライブラリ (共有ライブラリ) - 動的に生成されるコード - すでに動いているプロセスにアタッチして解析をすることができる .
  5. Pinの利点 - 使いやすい - ソースコードが必要ない - 再コンパイルが必要ない - プログラム可能な instrumentation

    - C/C++ から触れるAPIが提供 - マルチプラットフォーム - Arch: x86, x86-64, Itanium, etc - OS: Linux, Windows, MacOS - 速い - instrumentation コードをコンパイラで最適化
  6. Pinのサンプル実行 - ダウンロード - https://software.intel.com/en-us/articles/pin-a-dynamic-binary-instrumenta tion-tool - 展開 - $

    tar xvf pin-* - サンプルコードをコンパイル - $ cd pin-*/source/tools/ManualExamples - $ make TARGET=intel64 - サンプル(inscount) を実行 - $ ../../../pin -t obj-intel64/inscount0.so -- /bin/ls - 実行結果を確認 - $ cat inscount.out
  7. Pinの使い方 $ pin [OPTION] [-t <tool> [<toolargs>]] -- <command line>

    - pin : Instrumentation engin - tool : Instrumentation tool - 自分でcodeを書いたものか, 用意されているものを使う . - 一つ前のスライドでは用意されている inscount0 というツールを使用した . - command line: 実際に解析したい application - 一つ前のスライドでは , /bin/ls を解析対象のツールとした .
  8. PinでInstrumentationできる単位 - Instruction Level - 最も低い粒度として, 命令単位で Instrumentation する. -

    Basic Block Level (BBL) - Basic Block (BB) を単位で Instrumerntation する. - BBとは入り口と出口を持ち , 内部に分岐を含まない命令列のこと . - Trace Level - Trace level の Instrumentation をする. - Trace とはPin独自の単位で, 分岐命令を入り口として , 無条件分岐 (jmp, call, ret) などを出口とする命令列 . - Trace は複数のBBを含む場合はある.
  9. inscount0 (Instruction Count) のソース // This function is called before

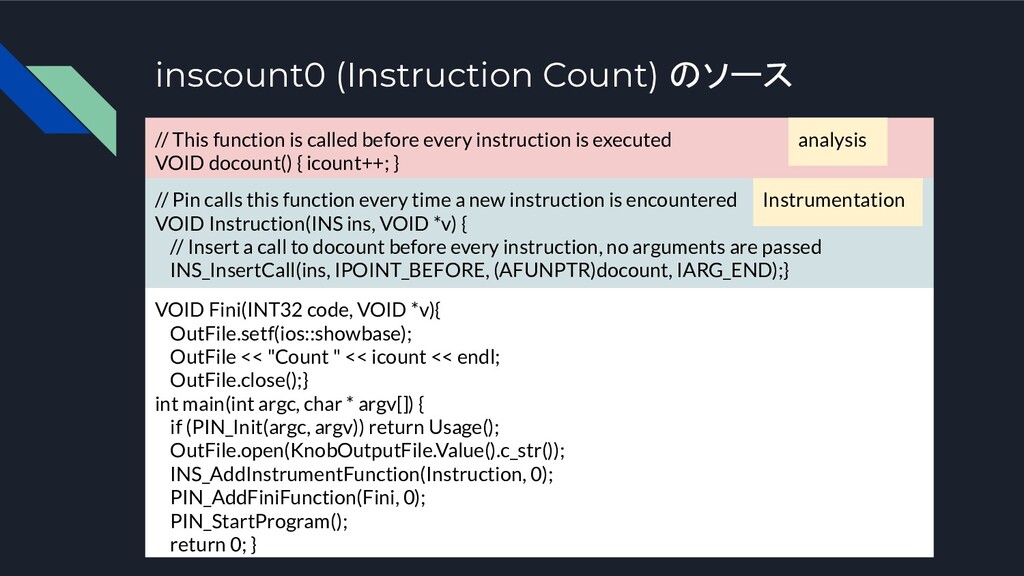
    every instruction is executed VOID docount() { icount++; } // Pin calls this function every time a new instruction is encountered VOID Instruction(INS ins, VOID *v) { // Insert a call to docount before every instruction, no arguments are passed INS_InsertCall(ins, IPOINT_BEFORE, (AFUNPTR)docount, IARG_END);} analysis Instrumentation VOID Fini(INT32 code, VOID *v){ OutFile.setf(ios::showbase); OutFile << "Count " << icount << endl; OutFile.close();} int main(int argc, char * argv[]) { if (PIN_Init(argc, argv)) return Usage(); OutFile.open(KnobOutputFile.Value().c_str()); INS_AddInstrumentFunction(Instruction, 0); PIN_AddFiniFunction(Fini, 0); PIN_StartProgram(); return 0; }
  10. inscount1 (Instruction Count) のソース // This function is called before

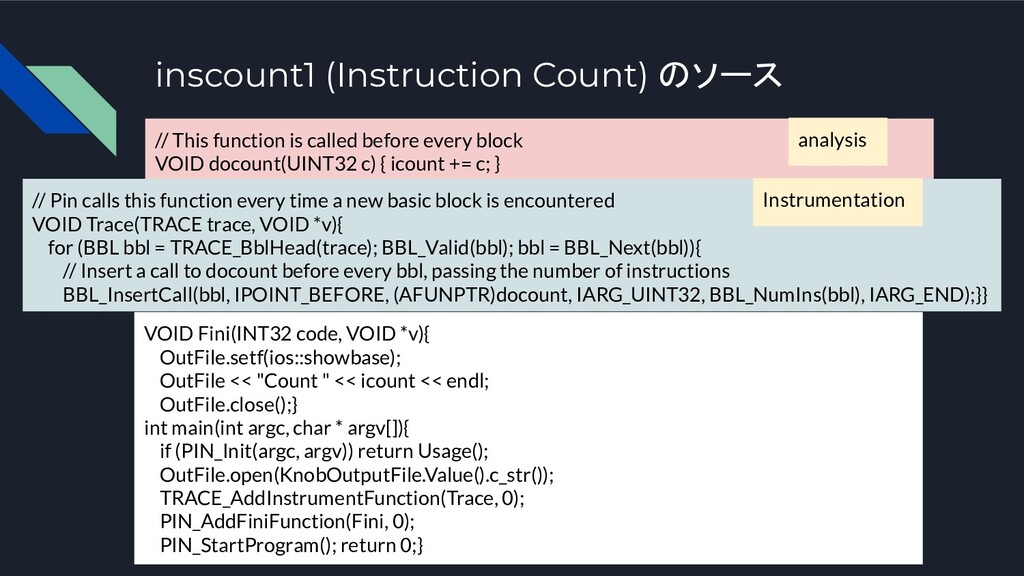
    every block VOID docount(UINT32 c) { icount += c; } // Pin calls this function every time a new basic block is encountered VOID Trace(TRACE trace, VOID *v){ for (BBL bbl = TRACE_BblHead(trace); BBL_Valid(bbl); bbl = BBL_Next(bbl)){ // Insert a call to docount before every bbl, passing the number of instructions BBL_InsertCall(bbl, IPOINT_BEFORE, (AFUNPTR)docount, IARG_UINT32, BBL_NumIns(bbl), IARG_END);}} analysis Instrumentation VOID Fini(INT32 code, VOID *v){ OutFile.setf(ios::showbase); OutFile << "Count " << icount << endl; OutFile.close();} int main(int argc, char * argv[]){ if (PIN_Init(argc, argv)) return Usage(); OutFile.open(KnobOutputFile.Value().c_str()); TRACE_AddInstrumentFunction(Trace, 0); PIN_AddFiniFunction(Fini, 0); PIN_StartProgram(); return 0;}
  11. どのようにimplementationが追加されているかを 確認する 以下のような paddd 命令を無限ループで実行する プログラムを解析対象として pin の上で pintool として,

    inscount0, inscount1 を用いて実行し, そのプロセスをgdbでアタッチし, バイ ナリを確認した. (padddは下のプログラムの実行バイナリ名 ) $ ../../../pin -t obj-intel64/inscount0.so -- ./paddd # pid:=21275 $ gdb -p 21275 int main(void) { while (1) { asm volatile("paddd %%xmm0, %%xmm0":::"memory"); } return 0; }
  12. inscount0 によるバイナリの変化 (Instruction Level) - original: whileの部分が, padddとjmp命令の2つの命令になっている . -

    implementationの後: 各命令の前方などに originalにはなかった命令が追加されてい る. - 0x7f7ec0b734f0 がカウンタ変数のメモリアドレス . - 一命令を実行するごとに , カウンタ変数に1を足している. 0x7f7eae478e08: movabs rsi,0x7f7ec0b734f0 add QWORD PTR [rsi],0x1 paddd xmm0, xmm0 movabs rsi, 0x7f7ec0b734f0 add QWORD PTR [rsi],0x1 jmp 0x7f7eae478e08 # original 0x555b126005fe: paddd xmm0,xmm0 jmp 0x555b126005fe
  13. inscount1 によるバイナリの変化 (Basic Block Level(BBL)) # original 0x555b126005fe: paddd xmm0,xmm0

    jmp 0x555b126005fe 0x7f9d4e040010: movabs rdi, 0x2 mov edi, edi movabs r14, 0x7f9d607544f0 add QWORD PTR[r14], rdi paddd xmm0,xmm0 nop jmp 0x7f9d4e040010 - original: whileの部分が, padddとjmp命令の2つの命令になっている . - implementationの後: 前方などにoriginalにはなかった命令が追加されている . - 0x7f9d607544f0 がカウンタ変数のメモリアドレス . - rdiに2が書き込まれていて , originalの命令が2つであることを表してる . - 2命令が連続して実行されたあと , 一度にカウンタ変数に 2が足されている. - nopはアライメント合わせ ??
  14. アーキテクチャ Hardware OS Pin Code Cache Virtual Machine(VM) JIT Compiler

    Dispacher Emulation unit Pintool (instrumentation routines) Applicatoin
  15. Reference - [1] Pin: building customized program analysis tools with

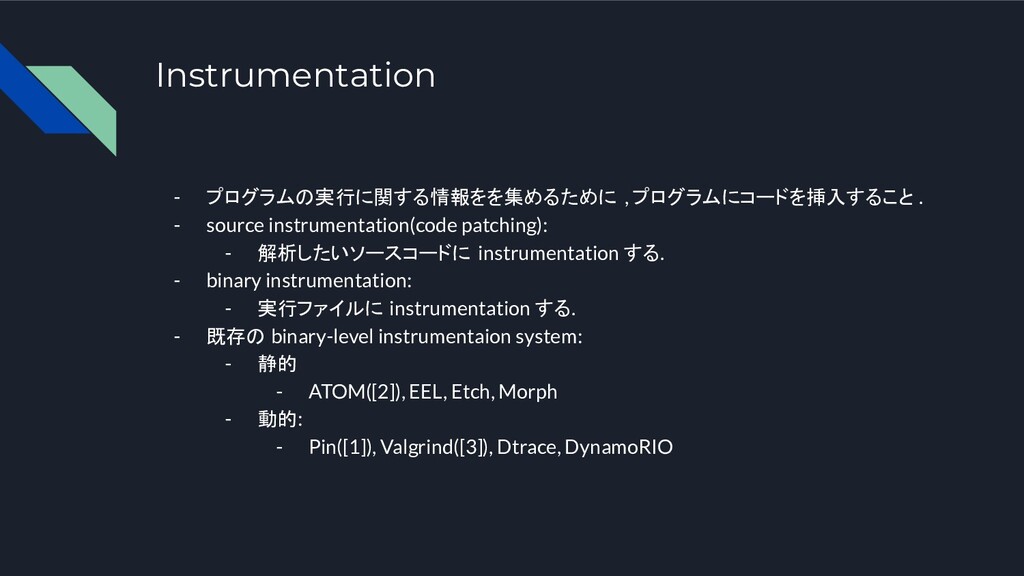
    dynamic instrumentation - CK Luk+ - [2] ATOM A System for Building Customized Program Analysis Tools - A Srivastava+ - [3] Valgrind: a framework for heavyweight dynamic binary instrumentation - N Nethercote+ - [4] Pin Tutorial (http://www.ic.unicamp.br/~rodolfo/Cursos/mo801/2s2015/04-PinTutorial.pdf) - [5] PinからPEMUへ(https://ntddk.github.io/2015/04/03/pin-to-pemu/)