Upgrade to Pro
— share decks privately, control downloads, hide ads and more …
Speaker Deck
Features
Speaker Deck
PRO
Sign in
Sign up for free
Search
Search
Code profiling with Xdebug and Kcachegrind
Search
Sponsored
·
SiteGround - Reliable hosting with speed, security, and support you can count on.
→
robertbasic
January 28, 2017
Programming
210
0
Share
Embed
Copy iframe code
Copy JS code
Copy link
Start on current slide
Code profiling with Xdebug and Kcachegrind
Slides for an uncon talk I gave at phpbnl17
robertbasic
January 28, 2017
More Decks by robertbasic
See All by robertbasic
All aboard the Service Bus!
robertbasic
1
1.8k
Build your career one contribution at a time
robertbasic
1
77
All aboard the Service Bus @ ZGPHP
robertbasic
0
400
All aboard the Service Bus
robertbasic
1
320
Build your career one contribution at a time
robertbasic
0
160
Profilisanje koda sa Xdebug i KCachegrind
robertbasic
1
220
Mockery
robertbasic
3
830
Zend Framework 2
robertbasic
4
350
Introduction to Zend Framework 1
robertbasic
2
280
Other Decks in Programming
See All in Programming
分散システム、なんですぐ死んでしまうん?耐障害性を高めたいあなたのためのレジリエンスパターン入門
mshibuya
7
6k
The Past, Present, and Future of Enterprise Java
ivargrimstad
0
220
どこまでゆるくて許されるのか
tk3fftk
0
490
Foundation Models frameworkで画像分析
ryodeveloper
1
120
Honoでのサプライチェーン侵害対策 〜 3つのライブラリに学ぶ
yusukebe
7
1.9k
ローカルLLMでどこまでコードが書けるか -縮小版 / How much code can be written on a local LLM Shortened
kishida
2
190
任せる範囲はこう広がった / How the Scope of AI Delegation Has Expanded
nrslib
1
250
SREは、MCPとSRE Agentをこう使え!
kazumax55
0
150
1年で人数1.5倍、PR数5.5倍増。 品質とアウトカムはどうなったか、 何が効いたか
ike002jp
0
130
act1-costs.pdf
sumedhbala
0
230
symfony/aiとlaravel/boost
77web
0
130
アルゴリズムは何を圧縮しているのか ─ Haskell から育った「圧縮代数」というメンタルモデル
naoya
16
3.5k
Featured
See All Featured
Product Roadmaps are Hard
iamctodd
55
12k
How to train your dragon (web standard)
notwaldorf
97
6.7k
The Impact of AI in SEO - AI Overviews June 2024 Edition
aleyda
5
1.1k
sira's awesome portfolio website redesign presentation
elsirapls
0
300
Getting science done with accelerated Python computing platforms
jacobtomlinson
2
300
CSS Pre-Processors: Stylus, Less & Sass
bermonpainter
360
30k
Measuring Dark Social's Impact On Conversion and Attribution
stephenakadiri
2
240
SEO for Brand Visibility & Recognition
aleyda
0
4.6k
How to Talk to Developers About Accessibility
jct
2
370
Responsive Adventures: Dirty Tricks From The Dark Corners of Front-End
smashingmag
254
22k
エンジニアに許された特別な時間の終わり
watany
108
250k
[SF Ruby Conf 2025] Rails X
palkan
2
1.2k
Transcript
Robert Basic ~ phpbenelux17 Code profiling with Xdebug and KCachegrind
Robert Basic https://robertbasic.com/ @robertbasic
Robert Basic ~ phpbenelux17 Tools of the trade Xdebug •
Not just for debugging KCachegrind • Visualizing profiling data
Robert Basic ~ phpbenelux17 What’s the fastest code?
Robert Basic ~ phpbenelux17 The code that’s not called!
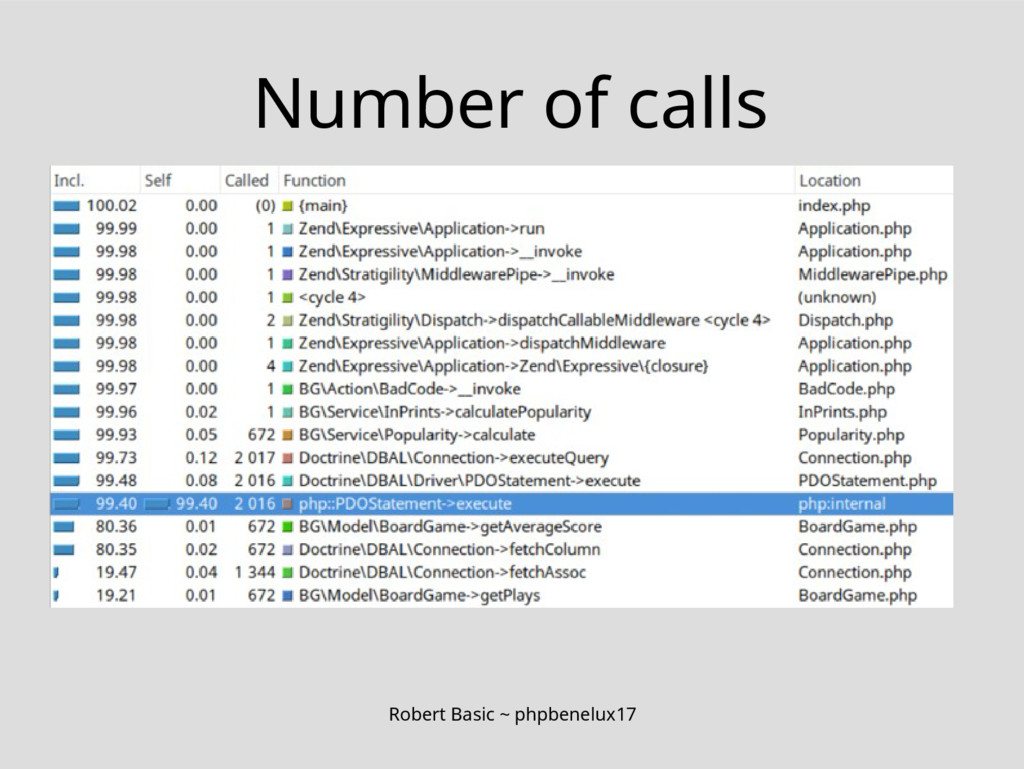
Robert Basic ~ phpbenelux17 Number of calls
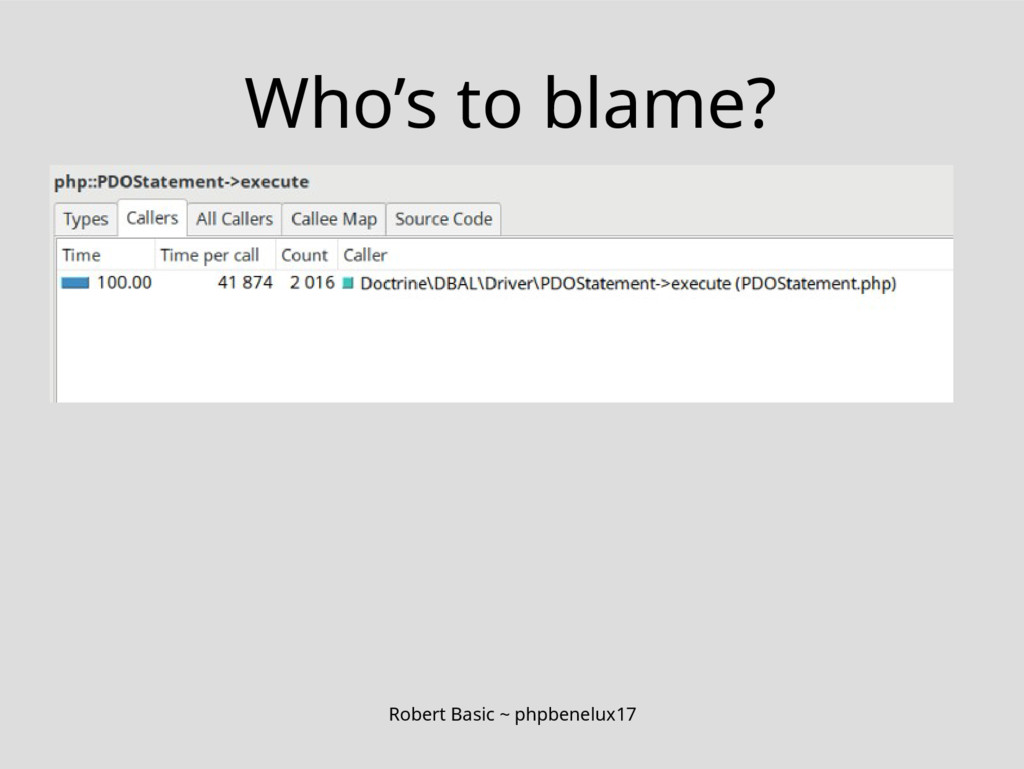
Robert Basic ~ phpbenelux17 Who’s to blame?
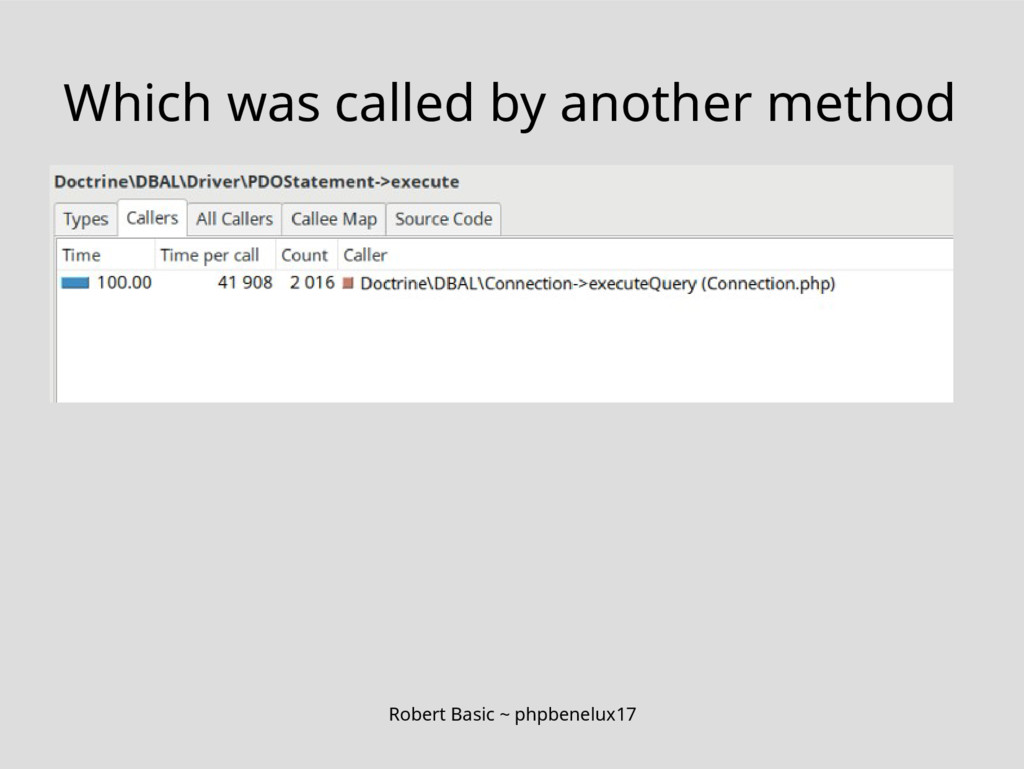
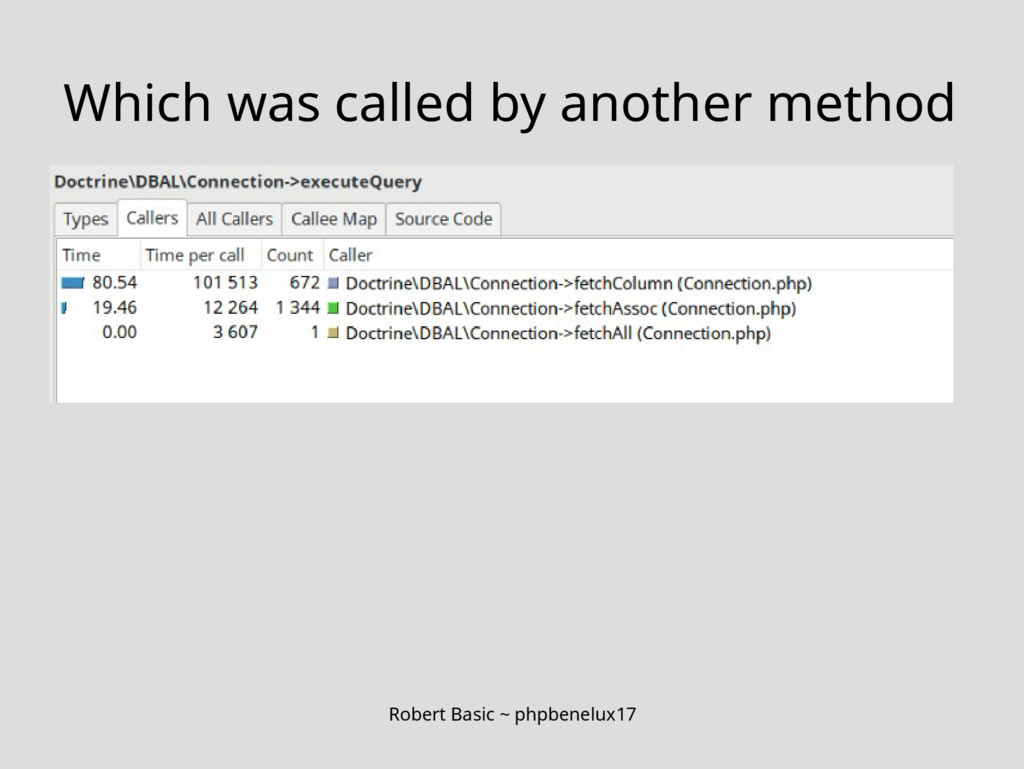
Robert Basic ~ phpbenelux17 Which was called by another method
Robert Basic ~ phpbenelux17 Which was called by another method
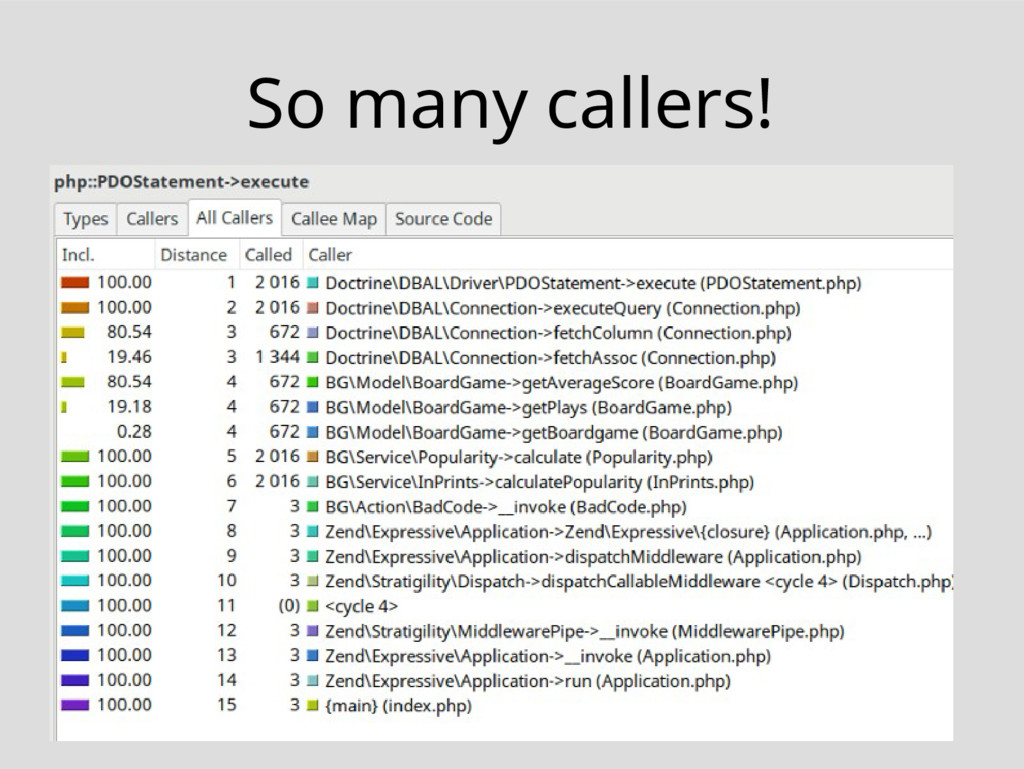
Robert Basic ~ phpbenelux17 So many callers!
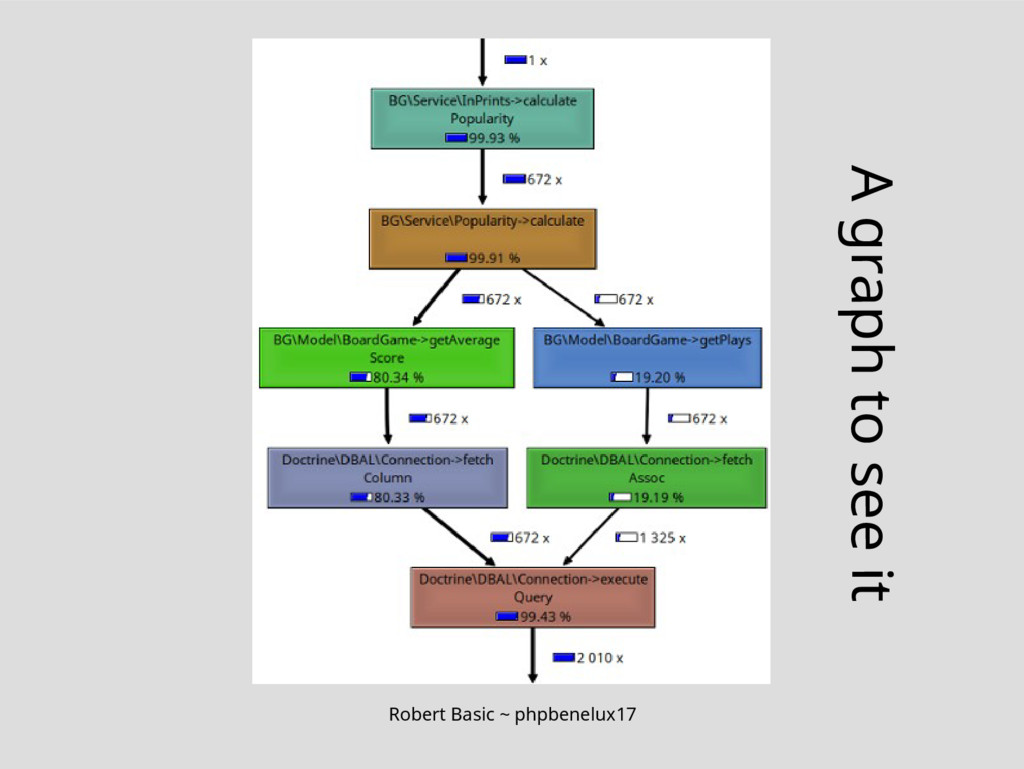
Robert Basic ~ phpbenelux17 A graph to see it
Robert Basic ~ phpbenelux17 Context to understand it
Robert Basic ~ phpbenelux17 Fix it This is really up
to you
Robert Basic ~ phpbenelux17 Tips for fixing performance issues •
Biggest impact, least effort • Profile after every change • Avoid over-optimizing • Learn to EXPLAIN
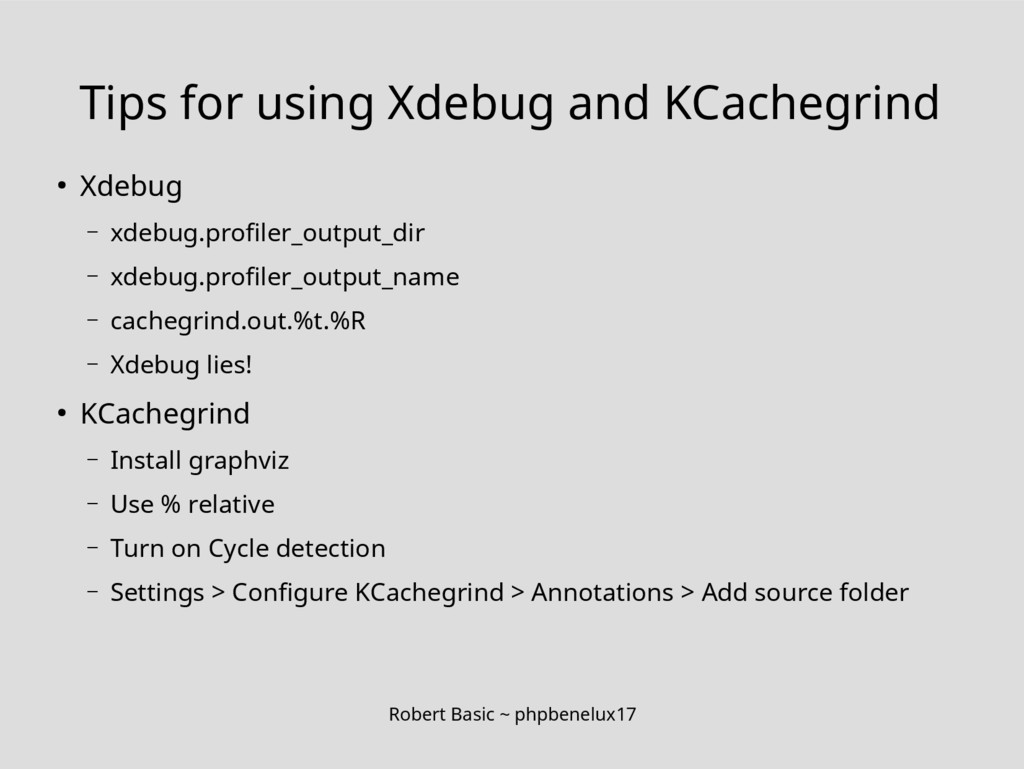
Robert Basic ~ phpbenelux17 Tips for using Xdebug and KCachegrind
• Xdebug – xdebug.profiler_output_dir – xdebug.profiler_output_name – cachegrind.out.%t.%R – Xdebug lies! • KCachegrind – Install graphviz – Use % relative – Turn on Cycle detection – Settings > Configure KCachegrind > Annotations > Add source folder
Robert Basic ~ phpbenelux17 Other tools • WinCacheGrind, Webgrind •
XHProf • Blackfire.io
Robert Basic ~ phpbenelux17 Thanks! Questions?