Upgrade to Pro — share decks privately, control downloads, hide ads and more …

Sofia Vargas Ibarra

Sofia Vargas Ibarra

(Univ. Paris Saclay, CNRS, CentraleSupélec, L2S)

Title — Imagerie du thrombus avec l’IA pour la stratification des patients AVC

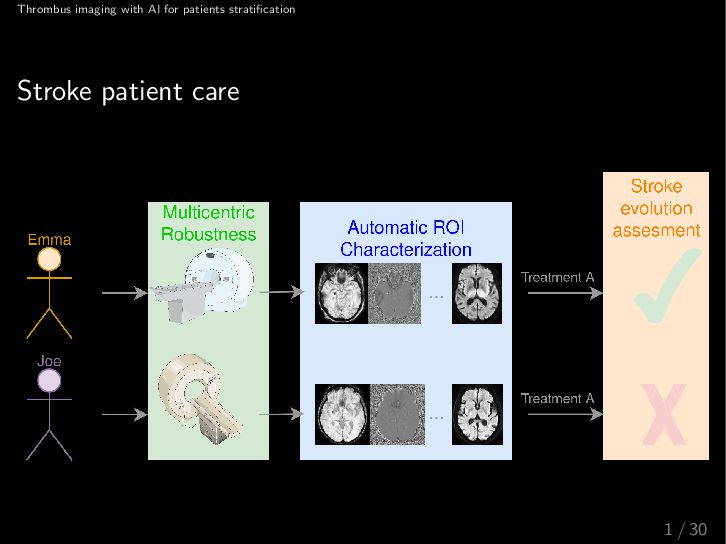
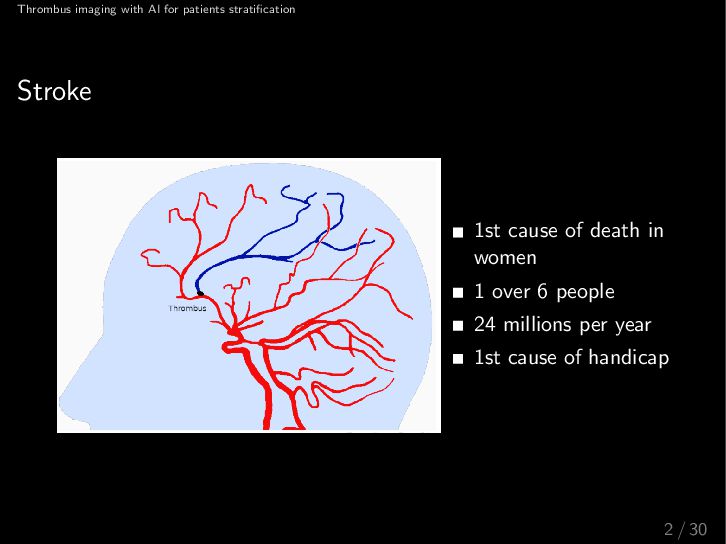
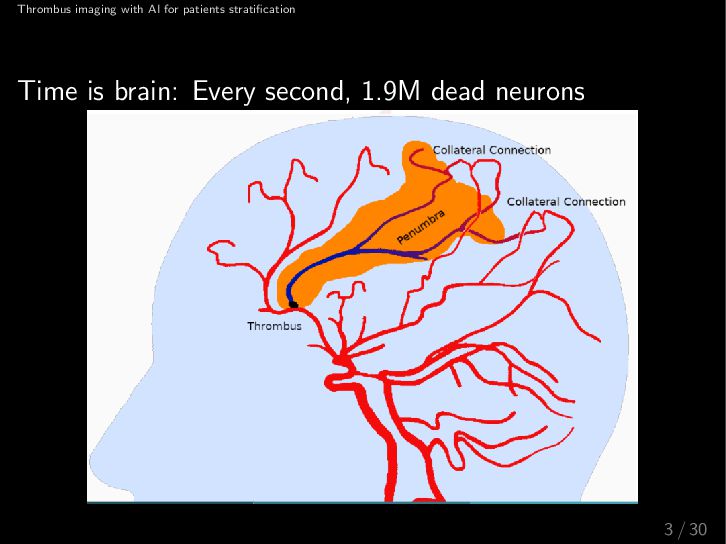
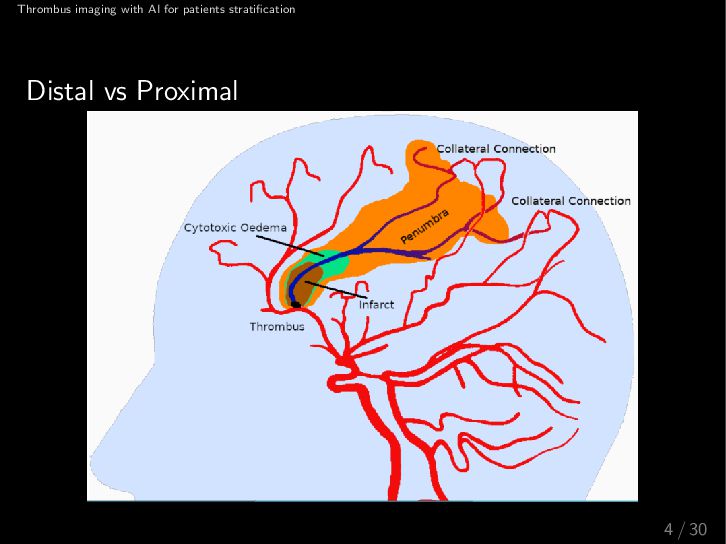
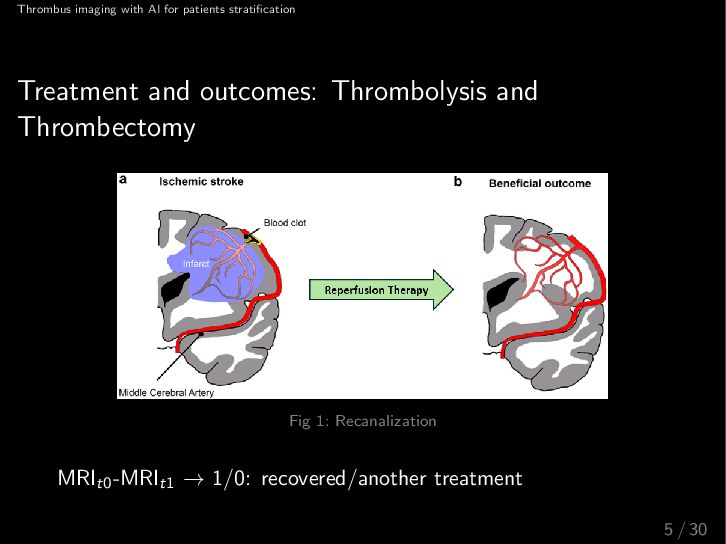
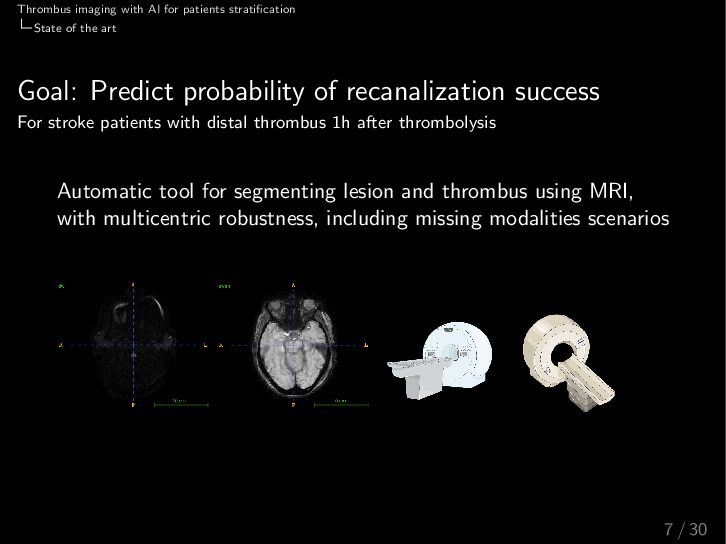
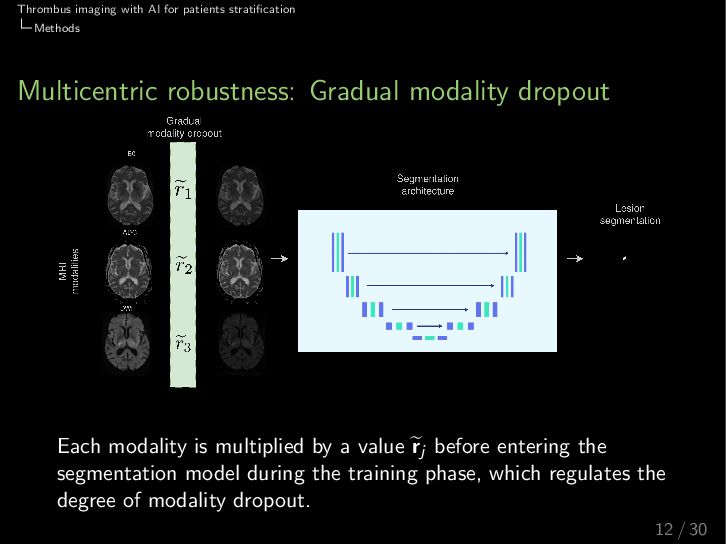
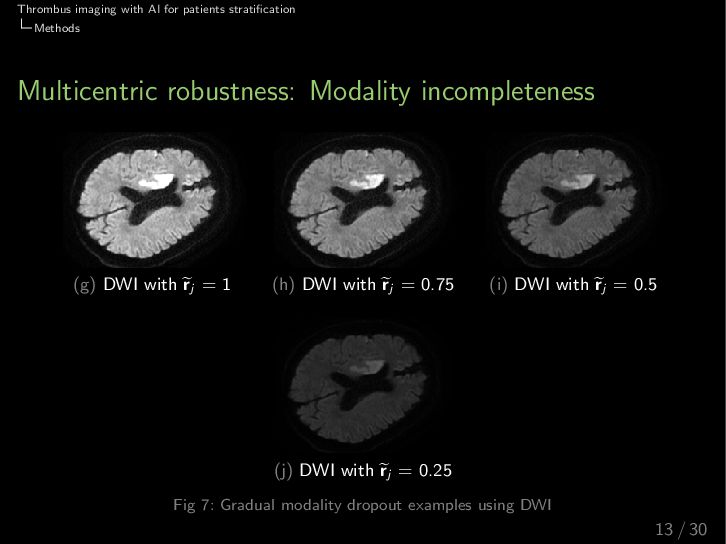
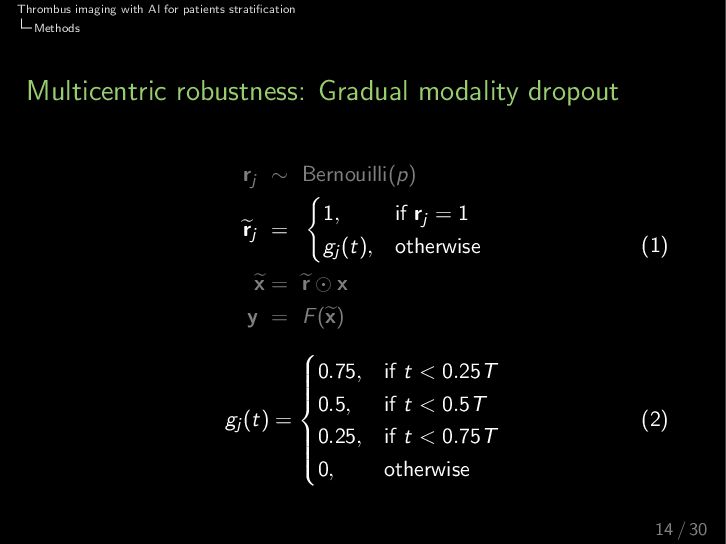
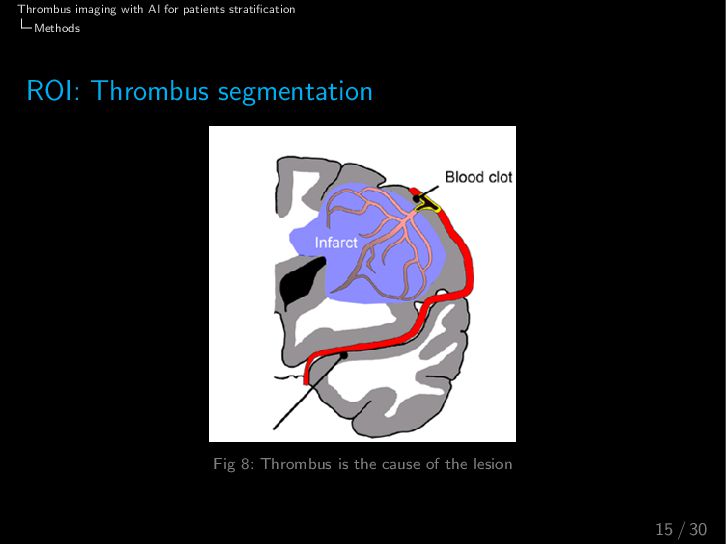
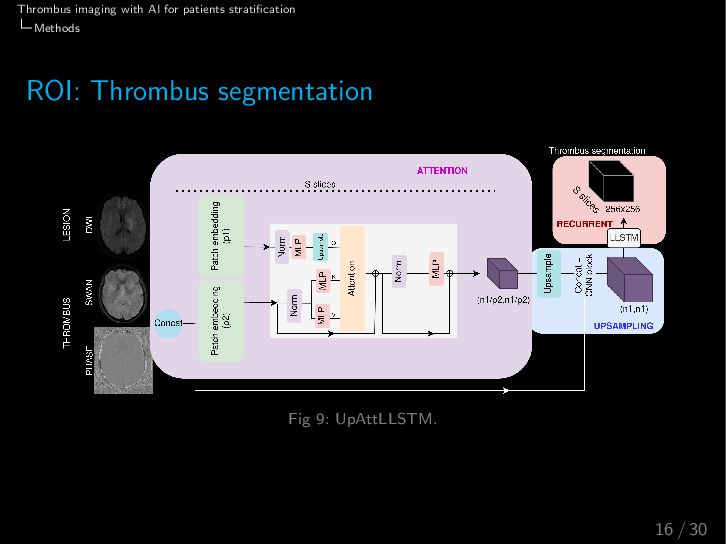
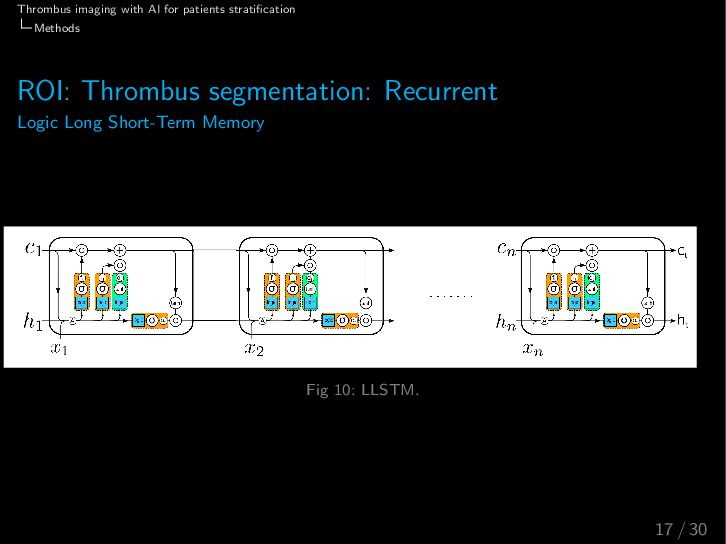
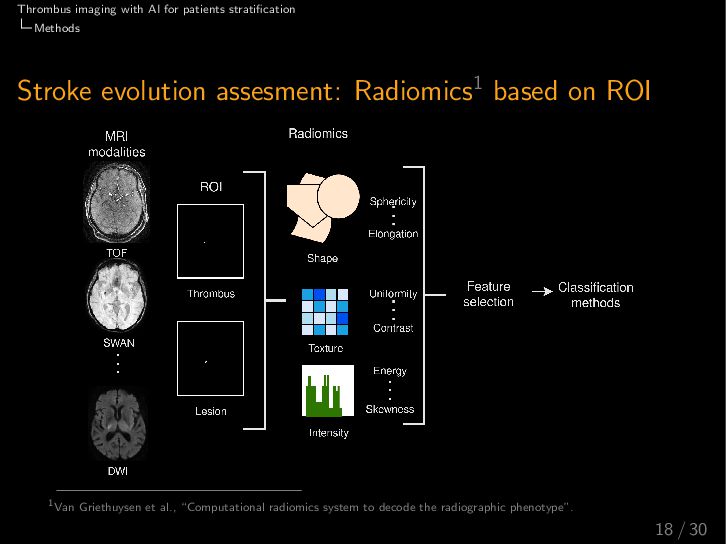
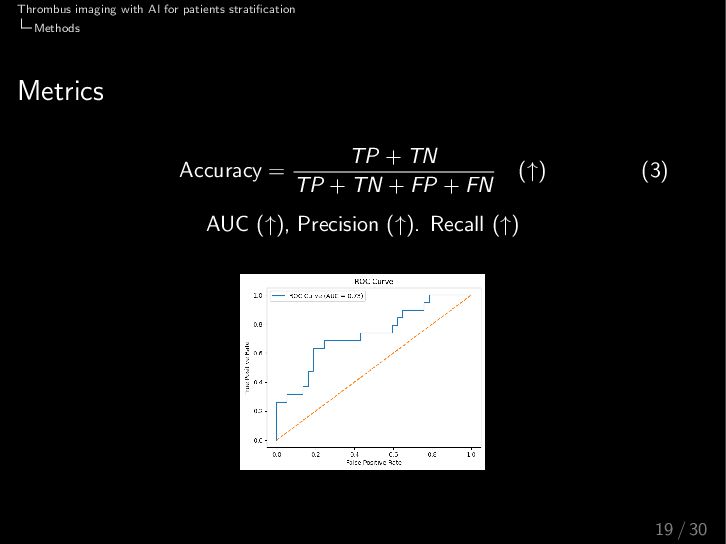
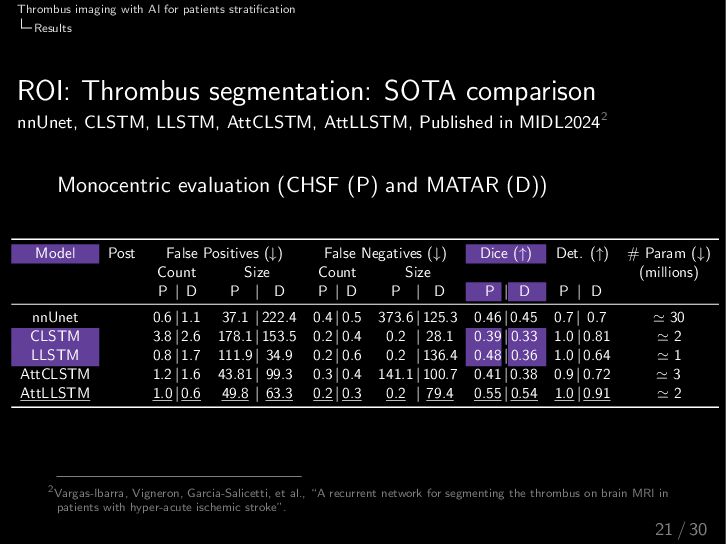
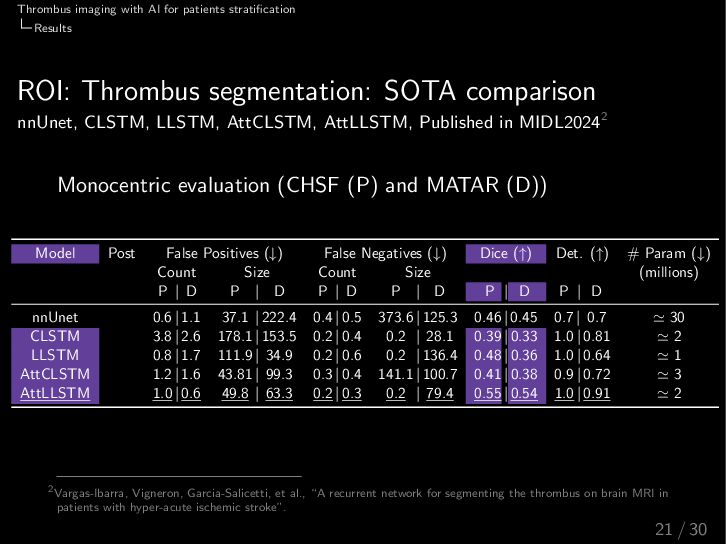
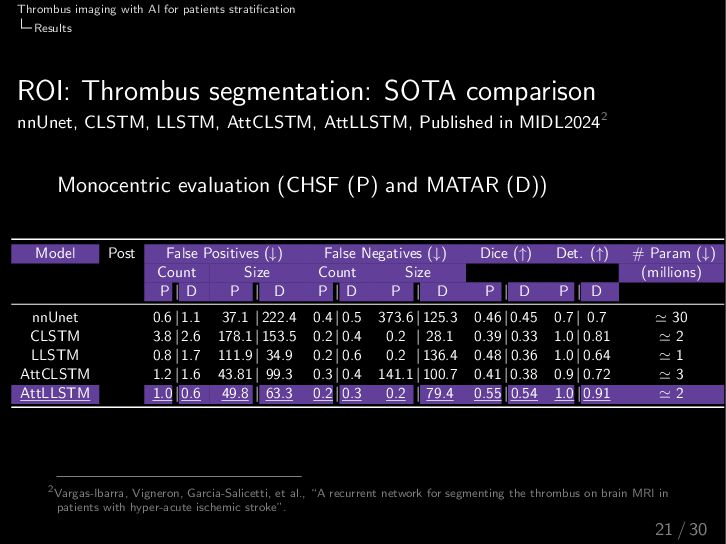
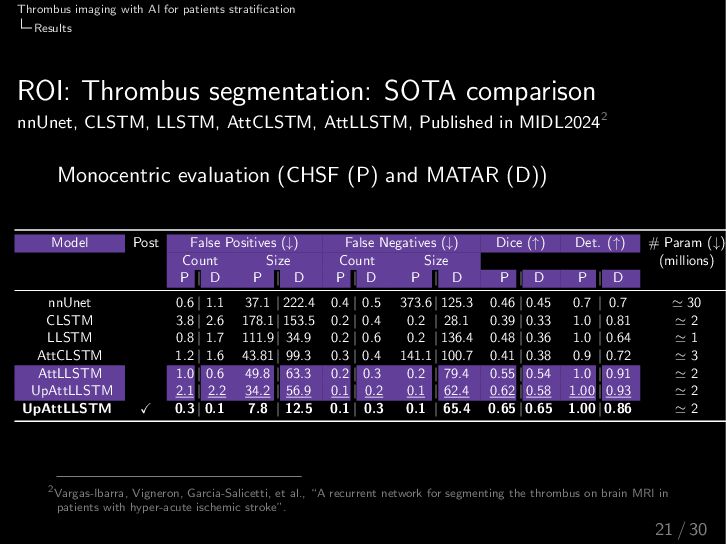
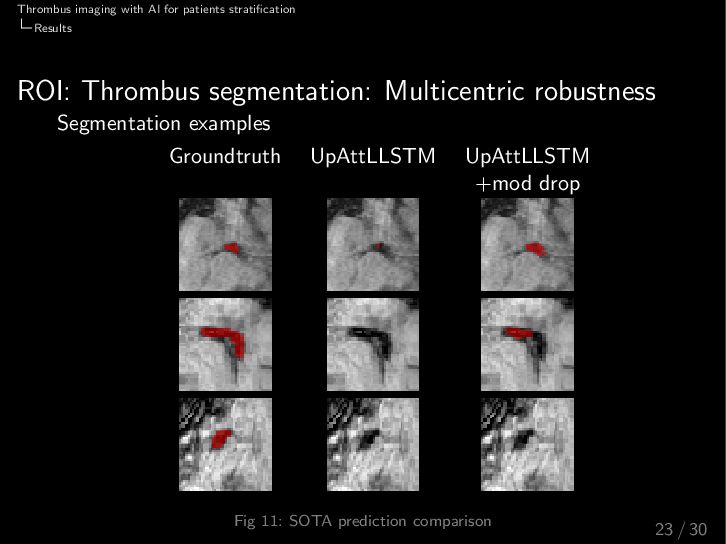
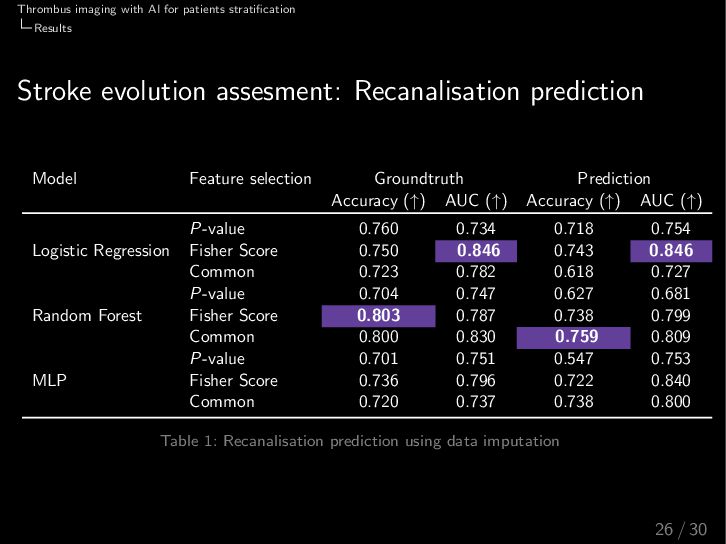
Abstract — L’AVC est responsable d’environ 6 millions de décès chaque année. Sa prise en charge médicale est coûteuse et prend du temps, car elle repose sur l’interprétation des scanners cérébraux par des experts. Le thrombus, étant un caillot sanguin, provoque une interruption du flux sanguin lors des AVC ischémiques, provoquant des lésions cérébrales. Nous proposons un pipeline complet pour la prise en charge des patients victimes d’AVC. Nous segmentons la lésion à l’aide de nnUnet et le thrombus grâce à notre architecture proposée (UpAttLLSTM), qui fusionne les modalités informatives du thrombus et de la lésion. Afin de généraliser cette approche à plusieurs appareils, où certaines modalités pourraient être manquantes, nous proposons une suppression progressive des modalités, permettant une segmentation dans plusieurs scénarios, même en l’absence d’une modalité d’image. Enfin, en utilisant l’architecture de segmentation des lésions, qui aboutit à un score Dice d’environ 0,78, et celle du thrombus, qui obtient un score Dice de 0,65 lorsque toutes les modalités sont présentes, nous extrayons des caractéristiques de texture, d’intensité et de forme afin de prédire le succès du traitement. En utilisant toutes les modalités et les masques de segmentation, le succès de la thrombolyse est prédit avec une précision de 76%. Ce pipeline complet fournit des informations utiles aux neurologues et aux médecins non experts pour la prise en charge des patients victimes d’un AVC ischémique et le choix du traitement.

Avatar for S³ Seminar

S³ Seminar

October 17, 2025
Tweet

More Decks by S³ Seminar

Other Decks in Research

Transcript

  1. Thrombus imaging with AI for patients stratification S3Seminar Sof´ ıa

    Vargas Ibarra Postdoctoral Researcher at L2S Universit´ e d’´ Evry, Centre Hospitalier Sud Francilien October 17, 2025
  2. Thrombus imaging with AI for patients stratification Stroke 1st cause

    of death in women 1 over 6 people 24 millions per year 1st cause of handicap 2 / 30
  3. Thrombus imaging with AI for patients stratification Treatment and outcomes:

    Thrombolysis and Thrombectomy Fig 1: Recanalization MRIt0-MRIt1 → 1/0: recovered/another treatment 5 / 30
  4. Thrombus imaging with AI for patients stratification State of the

    art State of the art Multicentric Robustness for missing modalities: syntatic modality generation, training strategies or specific architectures. Automatic ROI Characterization: classical image processing methods and deep learning segmentation architectures. Stroke evolution assesment: automatic software and biomarkers Limitations ◦ Focused on CT scans (no distal thrombi visible) ◦ No relationship between lesion and thrombus ◦ High training and optimization complexity 6 / 30
  5. Thrombus imaging with AI for patients stratification State of the

    art Goal: Predict probability of recanalization success For stroke patients with distal thrombus 1h after thrombolysis Automatic tool for segmenting lesion and thrombus using MRI, with multicentric robustness, including missing modalities scenarios 7 / 30
  6. Thrombus imaging with AI for patients stratification Materials Datasets CHSF

    MATAR MATAR2 FOCH Num. of annotated pat. 65 125 156 43 Multicentric ✓ Multiequipement ✓ Recanalization ✓ Only proximal ✓ Only distal ✓ ✓ Lesion volume (mL) 31.77 5.01 5.97 - Thrombi volume (mL) 0.23 0.08 0.09 0.31 Proximal vs distal: Factor of 6 8 / 30
  7. Thrombus imaging with AI for patients stratification Materials Datasets: MRI

    modalities for stroke detection Fig 2: B0 Fig 3: ADC Fig 4: DWI Fig 5: SWAN Fig 6: PHASE 9 / 30
  8. Thrombus imaging with AI for patients stratification Methods Methodology: Proposed

    solutions Multicentric Robustness for missing modalities → Gradual modality dropout ROI Characterization → UpAttLLSTM for thrombus segmentation Stroke evolution assesment → Classification methods using MRI radiomics 10 / 30
  9. Thrombus imaging with AI for patients stratification Methods Multicentric robustness:

    Modality incompleteness (a) SWAN (b) PHASE (c) DWI (d) SWI (e) No PHASE (f) DWI 11 / 30
  10. Thrombus imaging with AI for patients stratification Methods Multicentric robustness:

    Gradual modality dropout Each modality is multiplied by a value rj before entering the segmentation model during the training phase, which regulates the degree of modality dropout. 12 / 30
  11. Thrombus imaging with AI for patients stratification Methods Multicentric robustness:

    Modality incompleteness (g) DWI with rj = 1 (h) DWI with rj = 0.75 (i) DWI with rj = 0.5 (j) DWI with rj = 0.25 Fig 7: Gradual modality dropout examples using DWI 13 / 30
  12. Thrombus imaging with AI for patients stratification Methods Multicentric robustness:

    Gradual modality dropout rj ∼ Bernouilli(p) rj = 1, if rj = 1 gj (t), otherwise x = r ⊙ x y = F(x) (1) gj (t) =            0.75, if t < 0.25T 0.5, if t < 0.5T 0.25, if t < 0.75T 0, otherwise (2) 14 / 30
  13. Thrombus imaging with AI for patients stratification Methods ROI: Thrombus

    segmentation Fig 8: Thrombus is the cause of the lesion 15 / 30
  14. Thrombus imaging with AI for patients stratification Methods ROI: Thrombus

    segmentation: Recurrent Logic Long Short-Term Memory Fig 10: LLSTM. 17 / 30
  15. Thrombus imaging with AI for patients stratification Methods Stroke evolution

    assesment: Radiomics1 based on ROI 1Van Griethuysen et al., “Computational radiomics system to decode the radiographic phenotype”. 18 / 30
  16. Thrombus imaging with AI for patients stratification Methods Metrics Accuracy

    = TP + TN TP + TN + FP + FN (↑) (3) AUC (↑), Precision (↑). Recall (↑) 19 / 30
  17. Thrombus imaging with AI for patients stratification Methods Metrics Accuracy

    = TP + TN TP + TN + FP + FN (↑) (3) AUC (↑), Precision (↑). Recall (↑) Dice(ˆ y, y) = 2ˆ yn ∩ yn ˆ yn ∪ yn (↑) (4) FP (↓), FN (↓) and Detection rate (↑) 19 / 30
  18. Thrombus imaging with AI for patients stratification Results ROI: Thrombus

    segmentation using UpAttLLSTM Input modalities: DWI, SWAN, PHASE, SWI Datasets: CHSF, MATAR/MATAR2, FOCH 1 SOTA comparison: nnUnet, CLSTM, LLSTM, Attention, Upasampling, Post-processing 2 Multicentric evaluation: SWI ↔ SWAN under unseen center (FOCH) using gradual modality dropout 20 / 30
  19. Thrombus imaging with AI for patients stratification Results ROI: Thrombus

    segmentation: SOTA comparison nnUnet, CLSTM, LLSTM, AttCLSTM, AttLLSTM, Published in MIDL20242 Monocentric evaluation (CHSF (P) and MATAR (D)) Model Post False Positives (↓) False Negatives (↓) Dice (↑) Det. (↑) # Param (↓) Count Size Count Size (millions) P | D P | D P | D P | D P | D P | D nnUnet 0.6 | 1.1 37.1 | 222.4 0.4 | 0.5 373.6 | 125.3 0.46 | 0.45 0.7 | 0.7 ≃ 30 CLSTM 3.8 | 2.6 178.1 | 153.5 0.2 | 0.4 0.2 | 28.1 0.39 | 0.33 1.0 | 0.81 ≃ 2 LLSTM 0.8 | 1.7 111.9 | 34.9 0.2 | 0.6 0.2 | 136.4 0.48 | 0.36 1.0 | 0.64 ≃ 1 AttCLSTM 1.2 | 1.6 43.81 | 99.3 0.3 | 0.4 141.1 | 100.7 0.41 | 0.38 0.9 | 0.72 ≃ 3 AttLLSTM 1.0 | 0.6 49.8 | 63.3 0.2 | 0.3 0.2 | 79.4 0.55 | 0.54 1.0 | 0.91 ≃ 2 2Vargas-Ibarra, Vigneron, Garcia-Salicetti, et al., “A recurrent network for segmenting the thrombus on brain MRI in patients with hyper-acute ischemic stroke”. 21 / 30
  20. Thrombus imaging with AI for patients stratification Results ROI: Thrombus

    segmentation: SOTA comparison nnUnet, CLSTM, LLSTM, AttCLSTM, AttLLSTM, Published in MIDL20242 Monocentric evaluation (CHSF (P) and MATAR (D)) Model Post False Positives (↓) False Negatives (↓) Dice (↑) Det. (↑) # Param (↓) Count Size Count Size (millions) P | D P | D P | D P | D P | D P | D nnUnet 0.6 | 1.1 37.1 | 222.4 0.4 | 0.5 373.6 | 125.3 0.46 | 0.45 0.7 | 0.7 ≃ 30 CLSTM 3.8 | 2.6 178.1 | 153.5 0.2 | 0.4 0.2 | 28.1 0.39 | 0.33 1.0 | 0.81 ≃ 2 LLSTM 0.8 | 1.7 111.9 | 34.9 0.2 | 0.6 0.2 | 136.4 0.48 | 0.36 1.0 | 0.64 ≃ 1 AttCLSTM 1.2 | 1.6 43.81 | 99.3 0.3 | 0.4 141.1 | 100.7 0.41 | 0.38 0.9 | 0.72 ≃ 3 AttLLSTM 1.0 | 0.6 49.8 | 63.3 0.2 | 0.3 0.2 | 79.4 0.55 | 0.54 1.0 | 0.91 ≃ 2 2Vargas-Ibarra, Vigneron, Garcia-Salicetti, et al., “A recurrent network for segmenting the thrombus on brain MRI in patients with hyper-acute ischemic stroke”. 21 / 30
  21. Thrombus imaging with AI for patients stratification Results ROI: Thrombus

    segmentation: SOTA comparison nnUnet, CLSTM, LLSTM, AttCLSTM, AttLLSTM, Published in MIDL20242 Monocentric evaluation (CHSF (P) and MATAR (D)) Model Post False Positives (↓) False Negatives (↓) Dice (↑) Det. (↑) # Param (↓) Count Size Count Size (millions) P | D P | D P | D P | D P | D P | D nnUnet 0.6 | 1.1 37.1 | 222.4 0.4 | 0.5 373.6 | 125.3 0.46 | 0.45 0.7 | 0.7 ≃ 30 CLSTM 3.8 | 2.6 178.1 | 153.5 0.2 | 0.4 0.2 | 28.1 0.39 | 0.33 1.0 | 0.81 ≃ 2 LLSTM 0.8 | 1.7 111.9 | 34.9 0.2 | 0.6 0.2 | 136.4 0.48 | 0.36 1.0 | 0.64 ≃ 1 AttCLSTM 1.2 | 1.6 43.81 | 99.3 0.3 | 0.4 141.1 | 100.7 0.41 | 0.38 0.9 | 0.72 ≃ 3 AttLLSTM 1.0 | 0.6 49.8 | 63.3 0.2 | 0.3 0.2 | 79.4 0.55 | 0.54 1.0 | 0.91 ≃ 2 2Vargas-Ibarra, Vigneron, Garcia-Salicetti, et al., “A recurrent network for segmenting the thrombus on brain MRI in patients with hyper-acute ischemic stroke”. 21 / 30
  22. Thrombus imaging with AI for patients stratification Results ROI: Thrombus

    segmentation: SOTA comparison nnUnet, CLSTM, LLSTM, AttCLSTM, AttLLSTM, Published in MIDL20242 Monocentric evaluation (CHSF (P) and MATAR (D)) Model Post False Positives (↓) False Negatives (↓) Dice (↑) Det. (↑) # Param (↓) Count Size Count Size (millions) P | D P | D P | D P | D P | D P | D nnUnet 0.6 | 1.1 37.1 | 222.4 0.4 | 0.5 373.6 | 125.3 0.46 | 0.45 0.7 | 0.7 ≃ 30 CLSTM 3.8 | 2.6 178.1 | 153.5 0.2 | 0.4 0.2 | 28.1 0.39 | 0.33 1.0 | 0.81 ≃ 2 LLSTM 0.8 | 1.7 111.9 | 34.9 0.2 | 0.6 0.2 | 136.4 0.48 | 0.36 1.0 | 0.64 ≃ 1 AttCLSTM 1.2 | 1.6 43.81 | 99.3 0.3 | 0.4 141.1 | 100.7 0.41 | 0.38 0.9 | 0.72 ≃ 3 AttLLSTM 1.0 | 0.6 49.8 | 63.3 0.2 | 0.3 0.2 | 79.4 0.55 | 0.54 1.0 | 0.91 ≃ 2 2Vargas-Ibarra, Vigneron, Garcia-Salicetti, et al., “A recurrent network for segmenting the thrombus on brain MRI in patients with hyper-acute ischemic stroke”. 21 / 30
  23. Thrombus imaging with AI for patients stratification Results ROI: Thrombus

    segmentation: SOTA comparison nnUnet, CLSTM, LLSTM, AttCLSTM, AttLLSTM, Published in MIDL20242 Monocentric evaluation (CHSF (P) and MATAR (D)) Model Post False Positives (↓) False Negatives (↓) Dice (↑) Det. (↑) # Param (↓) Count Size Count Size (millions) P | D P | D P | D P | D P | D P | D nnUnet 0.6 | 1.1 37.1 | 222.4 0.4 | 0.5 373.6 | 125.3 0.46 | 0.45 0.7 | 0.7 ≃ 30 CLSTM 3.8 | 2.6 178.1 | 153.5 0.2 | 0.4 0.2 | 28.1 0.39 | 0.33 1.0 | 0.81 ≃ 2 LLSTM 0.8 | 1.7 111.9 | 34.9 0.2 | 0.6 0.2 | 136.4 0.48 | 0.36 1.0 | 0.64 ≃ 1 AttCLSTM 1.2 | 1.6 43.81 | 99.3 0.3 | 0.4 141.1 | 100.7 0.41 | 0.38 0.9 | 0.72 ≃ 3 AttLLSTM 1.0 | 0.6 49.8 | 63.3 0.2 | 0.3 0.2 | 79.4 0.55 | 0.54 1.0 | 0.91 ≃ 2 2Vargas-Ibarra, Vigneron, Garcia-Salicetti, et al., “A recurrent network for segmenting the thrombus on brain MRI in patients with hyper-acute ischemic stroke”. 21 / 30
  24. Thrombus imaging with AI for patients stratification Results ROI: Thrombus

    segmentation: SOTA comparison nnUnet, CLSTM, LLSTM, AttCLSTM, AttLLSTM, Published in MIDL20242 Monocentric evaluation (CHSF (P) and MATAR (D)) Model Post False Positives (↓) False Negatives (↓) Dice (↑) Det. (↑) # Param (↓) Count Size Count Size (millions) P | D P | D P | D P | D P | D P | D nnUnet 0.6 | 1.1 37.1 | 222.4 0.4 | 0.5 373.6 | 125.3 0.46 | 0.45 0.7 | 0.7 ≃ 30 CLSTM 3.8 | 2.6 178.1 | 153.5 0.2 | 0.4 0.2 | 28.1 0.39 | 0.33 1.0 | 0.81 ≃ 2 LLSTM 0.8 | 1.7 111.9 | 34.9 0.2 | 0.6 0.2 | 136.4 0.48 | 0.36 1.0 | 0.64 ≃ 1 AttCLSTM 1.2 | 1.6 43.81 | 99.3 0.3 | 0.4 141.1 | 100.7 0.41 | 0.38 0.9 | 0.72 ≃ 3 AttLLSTM 1.0 | 0.6 49.8 | 63.3 0.2 | 0.3 0.2 | 79.4 0.55 | 0.54 1.0 | 0.91 ≃ 2 UpAttLLSTM 2.1 | 2.2 34.2 | 56.9 0.1 | 0.2 0.1 | 62.4 0.62 | 0.58 1.00 | 0.93 ≃ 2 UpAttLLSTM ✓ 0.3 | 0.1 7.8 | 12.5 0.1 | 0.3 0.1 | 65.4 0.65 | 0.65 1.00 | 0.86 ≃ 2 2Vargas-Ibarra, Vigneron, Garcia-Salicetti, et al., “A recurrent network for segmenting the thrombus on brain MRI in patients with hyper-acute ischemic stroke”. 21 / 30
  25. Thrombus imaging with AI for patients stratification Results ROI: Thrombus

    segmentation: SOTA comparison nnUnet, CLSTM, LLSTM, AttCLSTM, AttLLSTM, Published in MIDL20242 Monocentric evaluation (CHSF (P) and MATAR (D)) Model Post False Positives (↓) False Negatives (↓) Dice (↑) Det. (↑) # Param (↓) Count Size Count Size (millions) P | D P | D P | D P | D P | D P | D nnUnet 0.6 | 1.1 37.1 | 222.4 0.4 | 0.5 373.6 | 125.3 0.46 | 0.45 0.7 | 0.7 ≃ 30 CLSTM 3.8 | 2.6 178.1 | 153.5 0.2 | 0.4 0.2 | 28.1 0.39 | 0.33 1.0 | 0.81 ≃ 2 LLSTM 0.8 | 1.7 111.9 | 34.9 0.2 | 0.6 0.2 | 136.4 0.48 | 0.36 1.0 | 0.64 ≃ 1 AttCLSTM 1.2 | 1.6 43.81 | 99.3 0.3 | 0.4 141.1 | 100.7 0.41 | 0.38 0.9 | 0.72 ≃ 3 AttLLSTM 1.0 | 0.6 49.8 | 63.3 0.2 | 0.3 0.2 | 79.4 0.55 | 0.54 1.0 | 0.91 ≃ 2 UpAttLLSTM 2.1 | 2.2 34.2 | 56.9 0.1 | 0.2 0.1 | 62.4 0.62 | 0.58 1.00 | 0.93 ≃ 2 UpAttLLSTM ✓ 0.3 | 0.1 7.8 | 12.5 0.1 | 0.3 0.1 | 65.4 0.65 | 0.65 1.00 | 0.86 ≃ 2 UpAttLLSTM outperforms nnUnet and CLSTM, each of the modules improve the performances 2Vargas-Ibarra, Vigneron, Garcia-Salicetti, et al., “A recurrent network for segmenting the thrombus on brain MRI in patients with hyper-acute ischemic stroke”. 21 / 30
  26. Thrombus imaging with AI for patients stratification Results ROI: Thrombus

    segmentation: Multicentric robustness means that the modality is used in the test and means that it is replaced by a black image. Grad. Test dataset PHASE False Positives (↓) False Negatives (↓) Dice (↑) Det. (↑) mod. Count Size Count Size drop. P | D P | D P | D P | D P | D P | D FOCH (SWAN) 0.8| 23.6 | 1.0 | 334.5 | 0.14 | 0.45 | FOCH (SWI) 1.1| 33.0 | 1.1 | 1007.1 | 0.04 | 0.32 | 22 / 30
  27. Thrombus imaging with AI for patients stratification Results ROI: Thrombus

    segmentation: Multicentric robustness means that the modality is used in the test and means that it is replaced by a black image. Grad. Test dataset PHASE False Positives (↓) False Negatives (↓) Dice(↑) Det. (↑) mod. Count Size Count Size drop. P | D P | D P | D P | D P | D P | D FOCH (SWAN) 0.8 | 23.6 | 1.0 | 334.5 | 0.14 | 0.45 | FOCH (SWI) 1.1 | 33.0 | 1.1 | 1007.1 | 0.04 | 0.32 | ✓ FOCH (SWAN) 4.2 | 101.6 | 0.55 | 81.5 | 0.37 | 0.90 | ✓ FOCH (SWI) 3.9 | 71.5 | 0.55 | 284.1 | 0.28 | 0.80 | Gradual modality dropout improves the performances when a new modality is present 22 / 30
  28. Thrombus imaging with AI for patients stratification Results ROI: Thrombus

    segmentation: Multicentric robustness Segmentation examples Groundtruth UpAttLLSTM UpAttLLSTM +mod drop 23 / 30
  29. Thrombus imaging with AI for patients stratification Results ROI: Thrombus

    segmentation: Multicentric robustness Segmentation examples Groundtruth UpAttLLSTM UpAttLLSTM +mod drop Fig 11: SOTA prediction comparison 23 / 30
  30. Thrombus imaging with AI for patients stratification Results ROI: Thrombus

    segmentation -Conclusions UpAttLLSTM outperforms SOTA proposals Dice of 0.65 detecting more than 90% of thrombi Dice of 0.33 detecting 85% of thrombi in SWI↔ SWAN 24 / 30
  31. Thrombus imaging with AI for patients stratification Results Stroke evolution

    assesment Classification models: Random Forest, MLP and Logistic regression Input modalities: DWI, B0, ADC SWAN, PHASE, TOF and FLAIR Datasets: MATAR2 1 Recanalization prediction 25 / 30
  32. Thrombus imaging with AI for patients stratification Results Stroke evolution

    assesment: Recanalisation prediction Model Feature selection Groundtruth Prediction Accuracy (↑) AUC (↑) Accuracy (↑) AUC (↑) Logistic Regression P-value 0.760 0.734 0.718 0.754 Fisher Score 0.750 0.846 0.743 0.846 Common 0.723 0.782 0.618 0.727 Random Forest P-value 0.704 0.747 0.627 0.681 Fisher Score 0.803 0.787 0.738 0.799 Common 0.800 0.830 0.759 0.809 MLP P-value 0.701 0.751 0.547 0.753 Fisher Score 0.736 0.796 0.722 0.840 Common 0.720 0.737 0.738 0.800 Table 1: Recanalisation prediction using data imputation 26 / 30
  33. Thrombus imaging with AI for patients stratification Results Stroke evolution

    assesment: Conclusions Thrombus shape and MRI modalities information are key Robustness when groundtruth is replaced by predicted mask 76% of accuracy 27 / 30
  34. Thrombus imaging with AI for patients stratification Conclusions and future

    works Conclusions Full automatic pipeline that predicts the probability of recanalization after 1h with 76% of accuracy 90% of thrombi detected with 0.65 of Dice 0.32 of Dice in multicentric scenarios with missing modalities detecting 85% of cases thanks to gradual modality dropout 28 / 30
  35. Thrombus imaging with AI for patients stratification Conclusions and future

    works Future works 1 Under a missing scenario, which model is the best? 2 More modalities 3 Thrombectomy and thrombolysis 29 / 30
  36. Thrombus imaging with AI for patients stratification Conclusions and future

    works List of publications Sofia Vargas-Ibarra, Vincent Martin Vigneron, Sonia Garcia-Salicetti, et al. “A recurrent network for segmenting the thrombus on brain MRI in patients with hyper-acute ischemic stroke”. In: Proceedings of The 7nd International Conference on Medical Imaging with Deep Learning. Vol. 250. Proceedings of Machine Learning Research. PMLR, Mar. 2024, pp. 657–671 Sofia Vargas-Ibarra, Vincent Martin Vigneron, Hichem Maaref, et al. “Gradual modality dropout for segmenting ischemic stroke lesions in an unseen center with missing modalities”. In: Medical Imaging with Deep Learning. 2025 Sofia Vargas Ibarra et al. “Abstract No : 569 : Automatic Proximal and Distal thrombi segmentation”. In: European Stroke Journal 9 (2024), pp. 3–647 Sofia Vargas Ibarra et al. “Abstract No : 201 : Neurological signs identified by AI related to stroke patient recanalization”. In: European Stroke Journal (2025) Nicolas Chausson et al. “Abstract No : 050 : Early successful recanalization after intravenous thrombolysis with tenecteplase versus alteplase in distal vessel occlusion strokes”. In: European Stroke Journal (2025) Under process: ISBI 2026 Conference, Medical Image Analysis Journal, American Journal of Neuroradiology 30 / 30
  37. Thrombus imaging with AI for patients stratification Nyul normalisation Having

    the minimum (s1) and maximum (s2) value for the standard histogram x′ = s1 + x − p1,j p2,j − p1,j (s2 − s1) (5) With all the training images, the rounded mean (µs) is obtained inside the landmarks. With them, the images are normalised as follows: x′ = µs + (x − µi ) s1−µs p1,i −µi , if m1,i ≤ x ≤ µi µs + (x − µi ) s2−µs p2,i −µi , if µi ≤ x ≤ m2,i where µi is the mean inside the landmarks (p1,i , p2,i ) of the image i, where m1,i and m2,i are the extensions of the lower and upper ends of the standard scale. 2 / 5
  38. Thrombus imaging with AI for patients stratification LLSTM Fig 12:

    LLSTM. The convolution operation is replaced by the Logic one. This operation reduces the trainable parameters as it is a concatenation of two parts (a1, a2) where smaller convolutions are applied and a pooling layer is included. C2, C4 are 1× 1 convolutional layers 3 / 5
  39. Thrombus imaging with AI for patients stratification Fisher Score Fisher’s

    Score is calculated as the ratio of between-class and within-class variance. A higher Fisher’s Score implies the characteristic is more discriminative and valuable for classification. The score is calculated as follows: Si = (µi,1 − µi,2)2 σ2 i,1 + σ2 i,2 (6) where: µi,1 and µi,2 are the mean values of feature xi for class 1 and 0 respectively, σ2 i,1 and σ2 i,2 are the corresponding variances. 5 / 5