Upgrade to Pro
— share decks privately, control downloads, hide ads and more …
Speaker Deck
Features
Speaker Deck
PRO
Sign in
Sign up for free
Search
Search
Monitoring is dead
Search
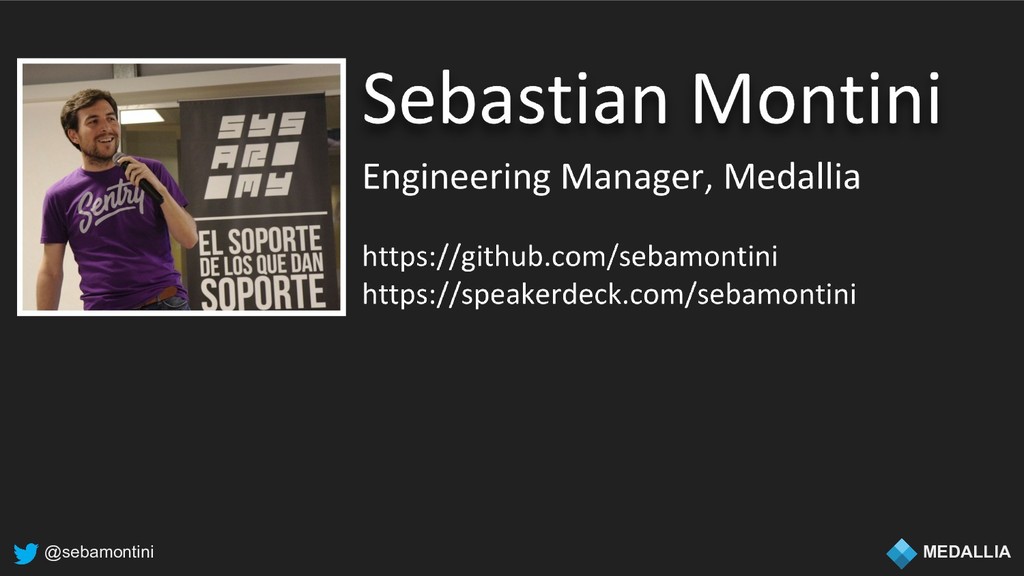
Sebastian Montini
September 21, 2018
Technology
250
0
Share
Embed
Copy iframe code
Copy JS code
Copy link
Start on current slide
Monitoring is dead
Sebastian Montini
September 21, 2018
More Decks by Sebastian Montini
See All by Sebastian Montini
AWS Community Day BA 2019
sebamontini
0
90
Giraffe: our journey to support 1 million metrics per second
sebamontini
0
190
Nomad-PyCon2017
sebamontini
0
100
Atlas, a PaaS with batteries included
sebamontini
0
85
Nomad: The sequel
sebamontini
1
180
Nomad, a love story
sebamontini
0
170
Aurora: 5 Tb later ...
sebamontini
0
92
Ansible 202 - Sysarmy Meetup
sebamontini
0
110
Cloud Computing: All that glitters is not AWS - Nerdear.la 2016
sebamontini
0
73
Other Decks in Technology
See All in Technology
Oracle Exadata Database Service on Cloud@Customer X11M (ExaDB-C@C) サービス概要
oracle4engineer
PRO
2
8.4k
AI Coding Agent時代のcdk-nagガードレール 〜組織ルールを強制CIで守り抜く設計の挑戦〜
mhrtech
3
440
第67回コンピュータビジョン勉強会CVPR2026読会前編
tsukamotokenji
0
160
Genie Ontologyは銀の弾丸かを考える / Is Genie Ontology a Silver Bullet?
nttcom
0
420
公式ドキュメントの歩き方etc
coco_se
1
120
AIと共生する開発者プラットフォーム:バクラクのモノレポ×マイクロサービス基盤
sakajunquality
2
4k
OpenTelemetryにおけるGoのゼロコード・コンパイル時計装について #fukuokago
quiver
0
130
Alphaモジュール使っていいのかい!?いけないのかい!?どっちなんだいっ!?
watany
1
290
個人開発で育てる「大規模設計の苗床」 - AI時代の1人開発から始める業務への知識接続 / The Seedbed for Large-Scale Design - From AI-Era Solo Projects to Professional Knowledge
bitkey
PRO
1
280
kaonavi Tech Night#1
kaonavi
0
120
OPENLOGI Company Profile for engineer
hr01
1
74k
複数プロダクト組織のAIネイティブ化における戦略 / AICon2026_kude
rakus_dev
0
160
Featured
See All Featured
Why Mistakes Are the Best Teachers: Turning Failure into a Pathway for Growth
auna
0
180
Building Flexible Design Systems
yeseniaperezcruz
330
40k
The Organizational Zoo: Understanding Human Behavior Agility Through Metaphoric Constructive Conversations (based on the works of Arthur Shelley, Ph.D)
kimpetersen
PRO
0
390
Bash Introduction
62gerente
615
220k
The Hidden Cost of Media on the Web [PixelPalooza 2025]
tammyeverts
2
360
技術選定の審美眼(2025年版) / Understanding the Spiral of Technologies 2025 edition
twada
PRO
118
120k
The Cult of Friendly URLs
andyhume
79
6.9k
Crafting Experiences
bethany
1
220
GitHub's CSS Performance
jonrohan
1033
470k
The Director’s Chair: Orchestrating AI for Truly Effective Learning
tmiket
1
220
First, design no harm
axbom
PRO
2
1.2k
Agile that works and the tools we love
rasmusluckow
331
22k
Transcript
@sebamontini MEDALLIA Monitoring is Dead And why you’re (probably) doing
it wrong
@sebamontini MEDALLIA
@sebamontini MEDALLIA Why?
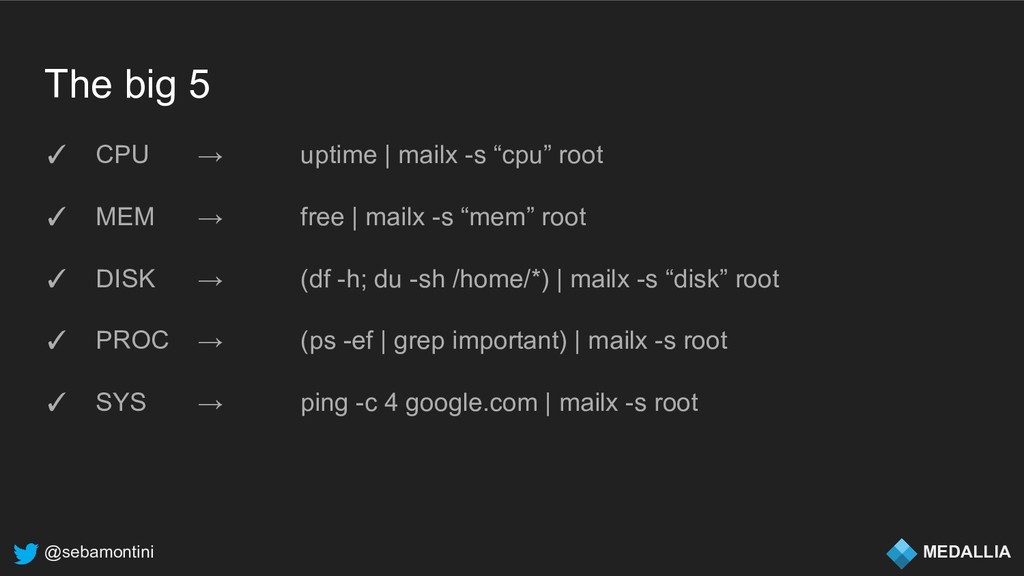
@sebamontini MEDALLIA The big 5
@sebamontini MEDALLIA The big 5 ✓ CPU → uptime |
mailx -s “cpu” root ✓ MEM → free | mailx -s “mem” root ✓ DISK → (df -h; du -sh /home/*) | mailx -s “disk” root ✓ PROC → (ps -ef | grep important) | mailx -s root ✓ SYS → ping -c 4 google.com | mailx -s root
@sebamontini MEDALLIA OK: x < something
@sebamontini MEDALLIA WARN: something < x < something
@sebamontini MEDALLIA CRITICAL: x > something
@sebamontini MEDALLIA
@sebamontini MEDALLIA Observability
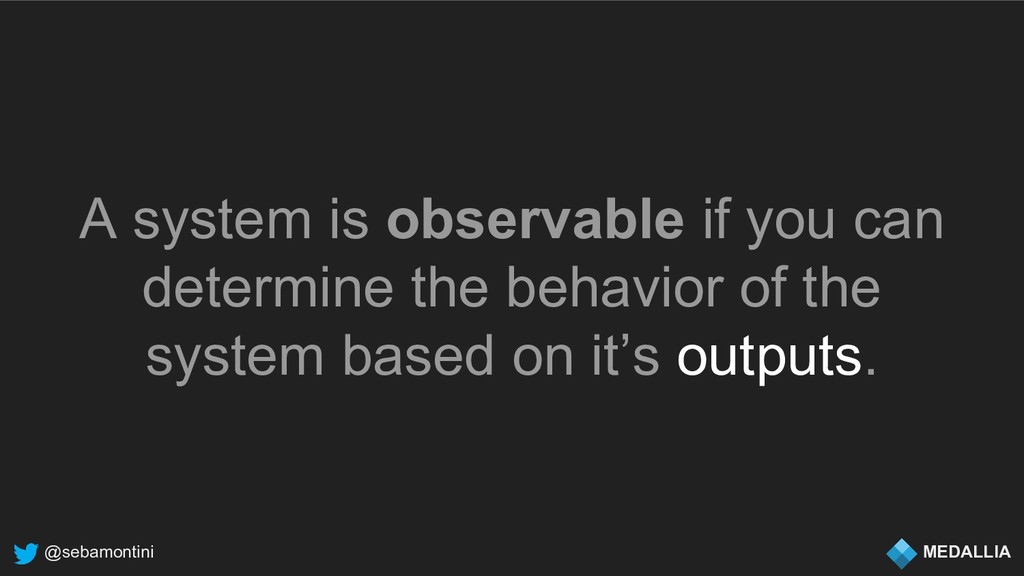
@sebamontini MEDALLIA A system is observable if you can determine
the behavior of the system based on it’s outputs.
@sebamontini MEDALLIA A system is observable if you can determine
the behavior of the system based on it’s outputs.
@sebamontini MEDALLIA A system is a set of connected components.
@sebamontini MEDALLIA A system is observable if you can determine
the behavior of the system based on it’s outputs.
@sebamontini MEDALLIA The manner in which a system acts is
it’s behavior.
@sebamontini MEDALLIA A system is observable if you can determine
the behavior of the system based on it’s outputs.
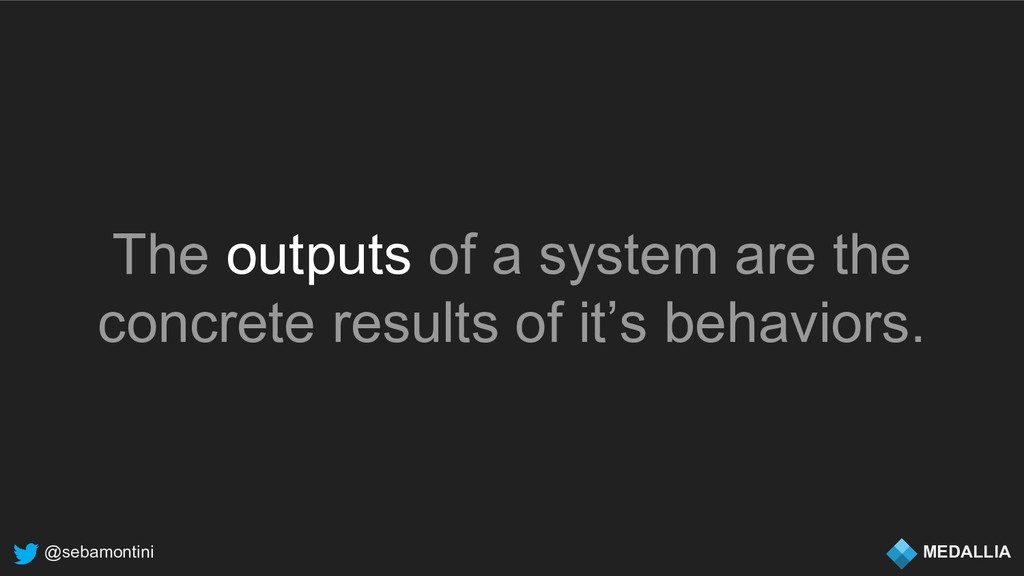
@sebamontini MEDALLIA The outputs of a system are the concrete
results of it’s behaviors.
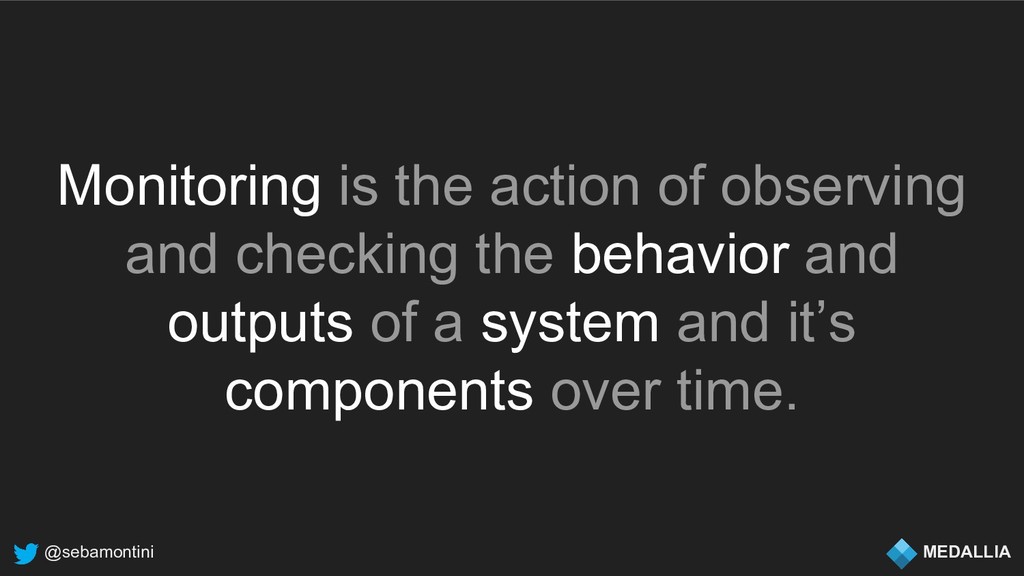
@sebamontini MEDALLIA Monitoring is the action of observing and checking
the behavior and outputs of a system and it’s components over time.
@sebamontini MEDALLIA The (real) big 5
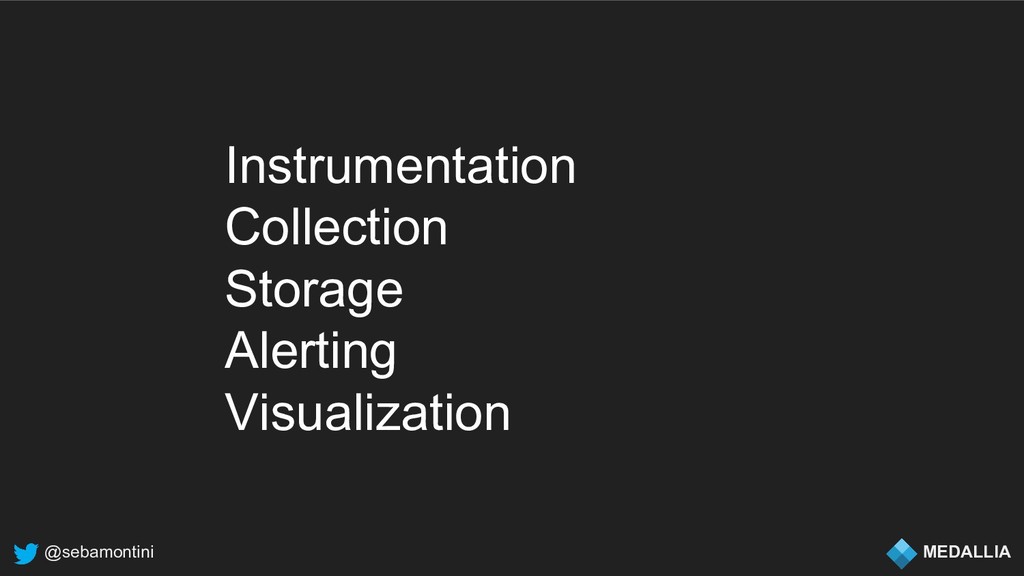
@sebamontini MEDALLIA Instrumentation Collection Storage Alerting Visualization
@sebamontini MEDALLIA Instrumentation
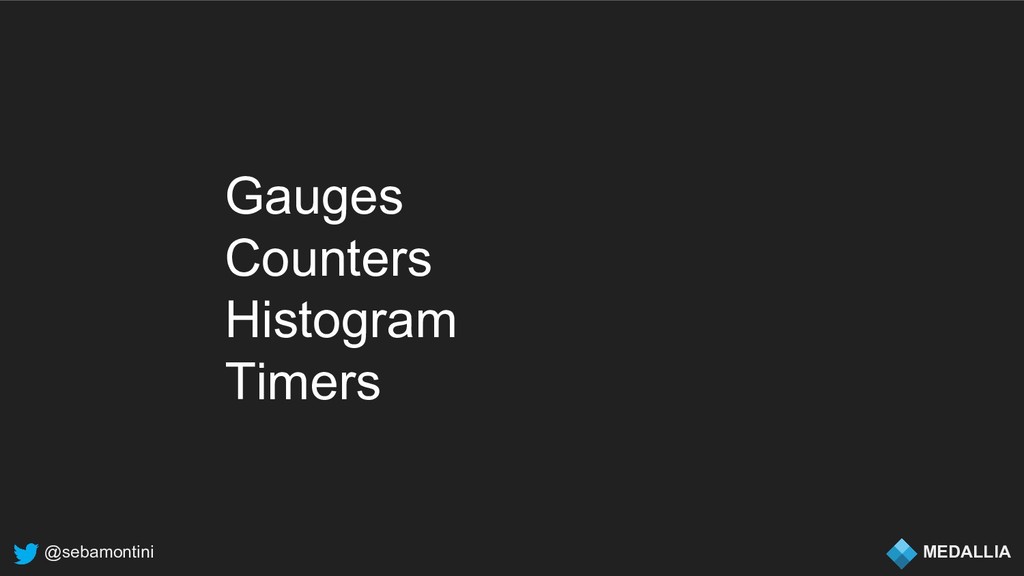
@sebamontini MEDALLIA Gauges Counters Histogram Timers
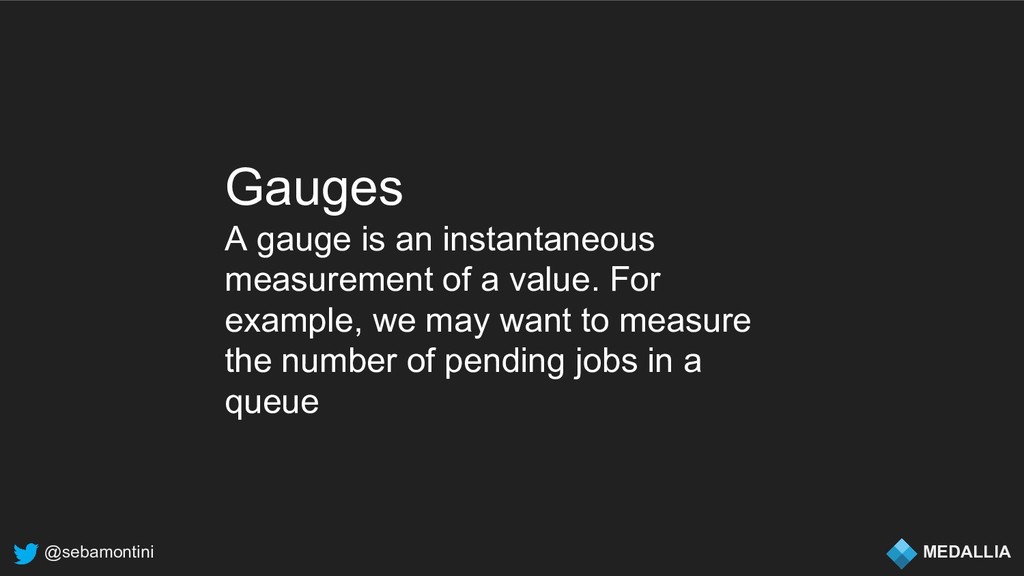
@sebamontini MEDALLIA Gauges A gauge is an instantaneous measurement of
a value. For example, we may want to measure the number of pending jobs in a queue
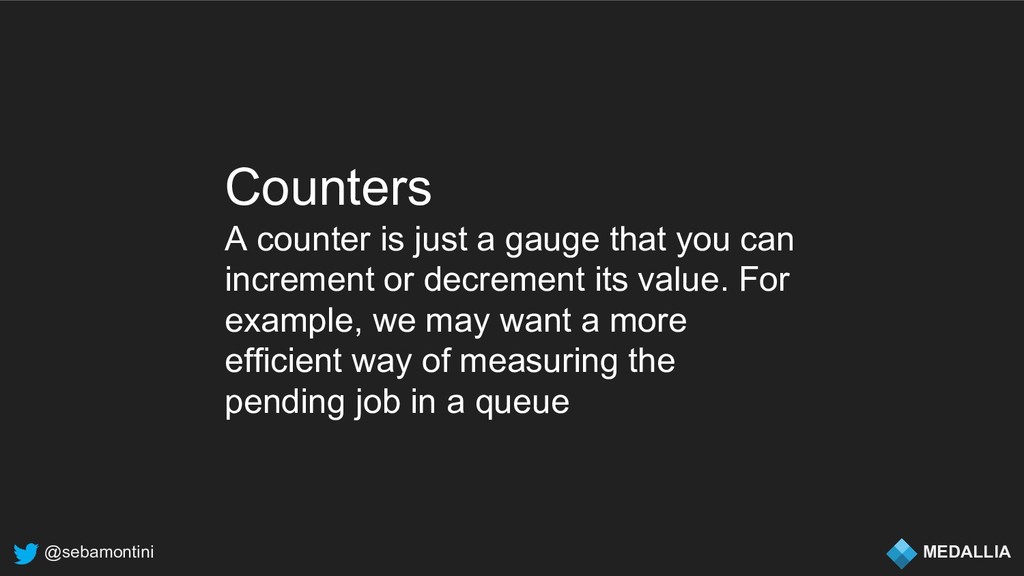
@sebamontini MEDALLIA Counters A counter is just a gauge that
you can increment or decrement its value. For example, we may want a more efficient way of measuring the pending job in a queue
@sebamontini MEDALLIA Histogram A histogram measures the statistical distribution of
values in a stream of data like median or percentiles
@sebamontini MEDALLIA Timers A timer measures both the rate that
a particular piece of code is called and the distribution of its duration.
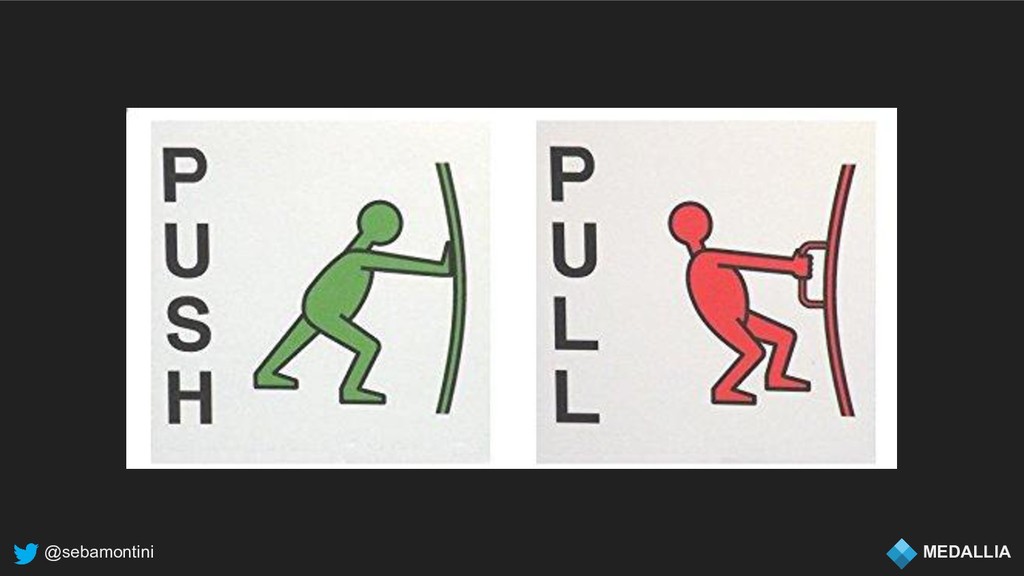
@sebamontini MEDALLIA Collection
@sebamontini MEDALLIA
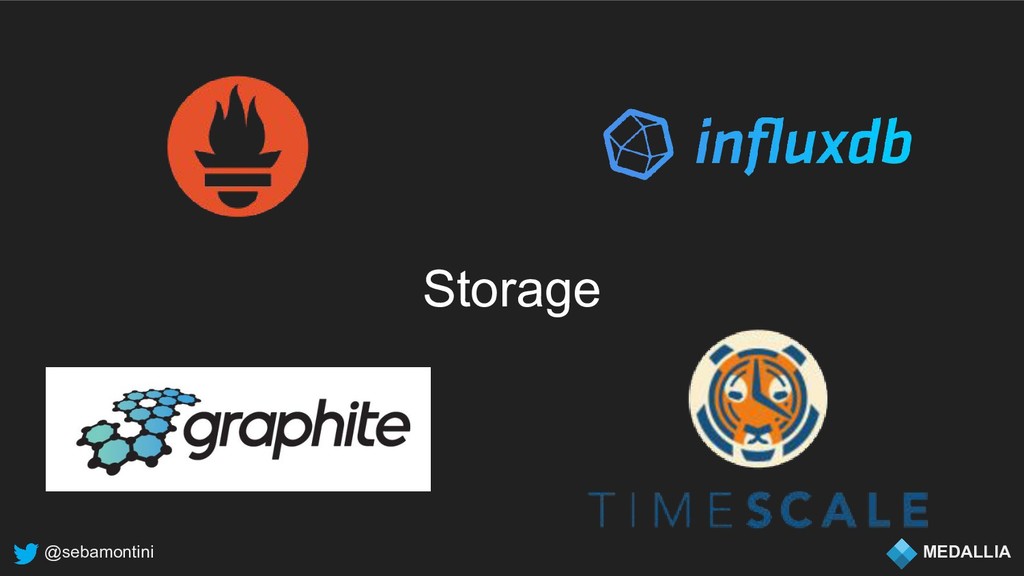
@sebamontini MEDALLIA Storage
@sebamontini MEDALLIA Storage
@sebamontini MEDALLIA Alerting
@sebamontini MEDALLIA Thresholds Dead man Delta Anomaly detection
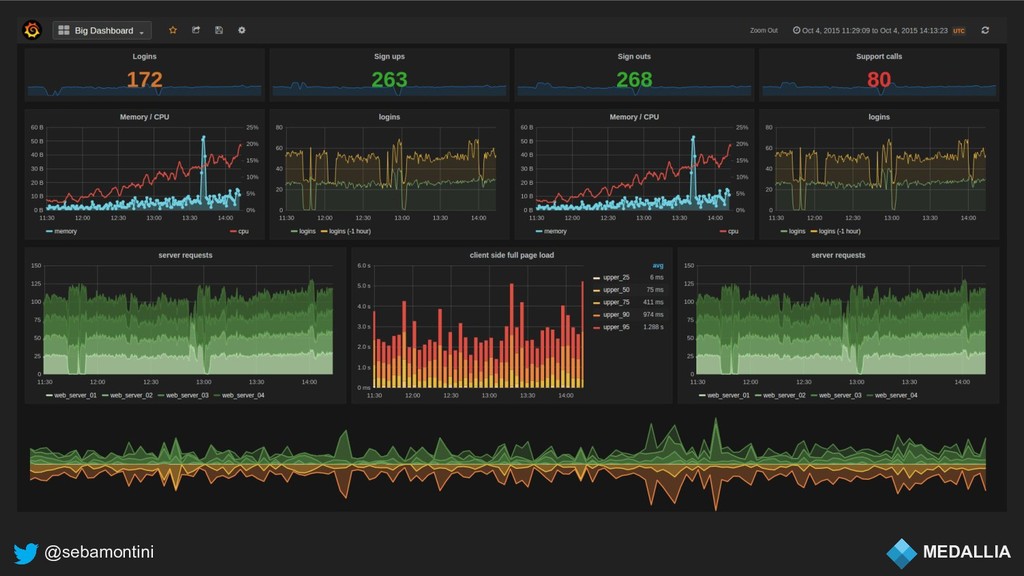
@sebamontini MEDALLIA Visualization
@sebamontini MEDALLIA
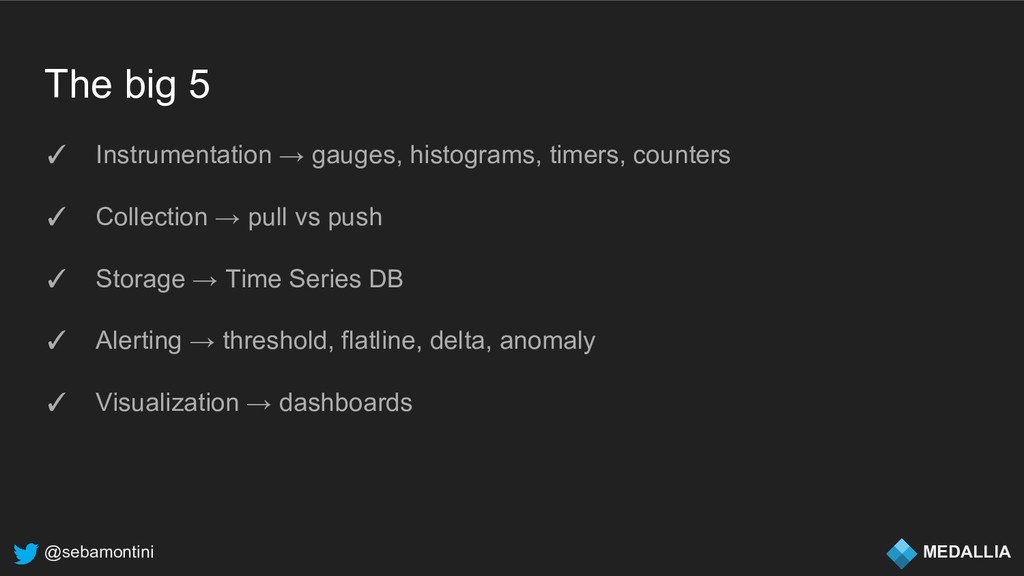
@sebamontini MEDALLIA The big 5 ✓ Instrumentation → gauges, histograms,
timers, counters ✓ Collection → pull vs push ✓ Storage → Time Series DB ✓ Alerting → threshold, flatline, delta, anomaly ✓ Visualization → dashboards
@sebamontini MEDALLIA
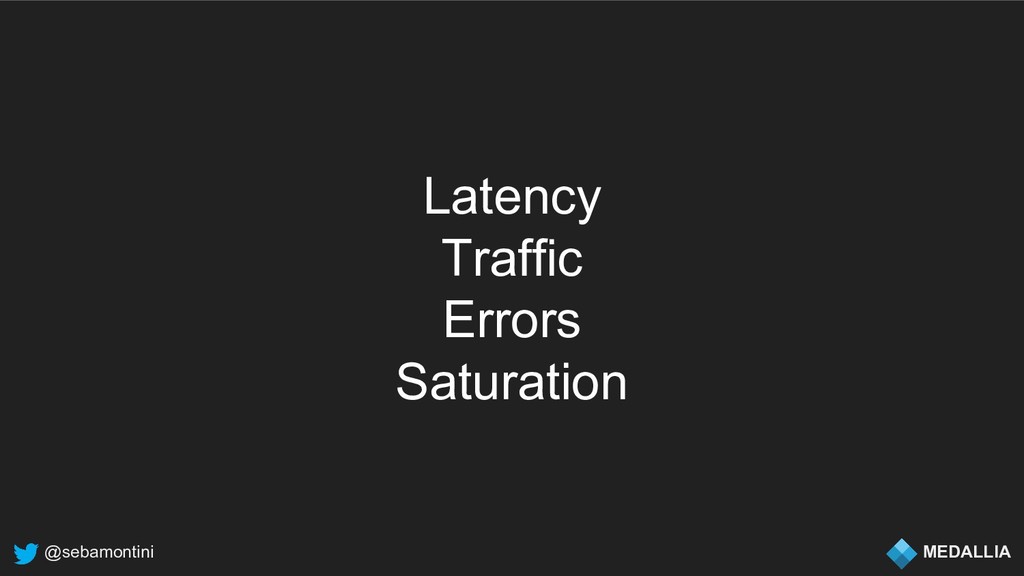
@sebamontini MEDALLIA The Four Golden Signals
@sebamontini MEDALLIA Latency Traffic Errors Saturation
@sebamontini MEDALLIA Thanks