Upgrade to Pro
— share decks privately, control downloads, hide ads and more …
Speaker Deck
Features
Speaker Deck
PRO
Sign in
Sign up for free
Search
Search
Infographics Made Easy
Search
Sponsored
·
Ship Features Fearlessly
Turn features on and off without deploys. Used by thousands of Ruby developers.
→
chrislema
September 12, 2012
Design
18k
239
Share
Embed
Copy iframe code
Copy JS code
Copy link
Start on current slide
Infographics Made Easy
chrislema
September 12, 2012
More Decks by chrislema
See All by chrislema
El diseño de la página del producto perfecto
chrislema
0
460
Getting what you want without becoming who you're not
chrislema
1
330
Coupons, Order Bumps & One-time Offers
chrislema
1
410
ECommerce Segmentation
chrislema
0
670
Designing the Perfect Product Page (for eCommerce Stores)
chrislema
1
490
eCommerce Decision Making - How Customers Decide What To Buy
chrislema
1
770
Bringing a new WordPress product into the market
chrislema
1
290
Leading Smarter People
chrislema
0
350
Online Learning
chrislema
0
560
Other Decks in Design
See All in Design
CULTURE DECK/Marketing Director
mhand01
0
1.4k
速く作れるかではなく、速く学べるか ― 学習ループを回すパイロットの途中報告
nagata03
0
530
保育現場にAIを 〜人と技術に橋を架けるデザインで考えてきたこと〜 uiuxcamp2026-hoiku-ai-design
hiro93n
1
330
Design dependencies
teba_eleven
0
140
Basket_of_love.pdf
terencebasart
0
120
Signull 団体説明資料
signull
0
700
生成AIの不確実性を価値に変える、「ビズリーチ」の体験設計 / KNOTS2026
visional_engineering_and_design
6
1.3k
もう迷わない!“なんとなく”を卒業するフォントの選び方【村田俊英】
toshihidemurata
0
710
デザイナーとエンジニアで 同じ山に登ろう
moco1013
0
280
社長の宿題への回答 「新卒×AI」が生み出す価値
saki822
2
170
AIでデザインをつくる:基礎編
kenichiota0711
4
3.2k
空間アプリ開発のフィードバックをCodexにするための抽象的なデザインツールの模索
karad
0
150
Featured
See All Featured
Why Our Code Smells
bkeepers
PRO
340
58k
A brief & incomplete history of UX Design for the World Wide Web: 1989–2019
jct
2
410
Exploring anti-patterns in Rails
aemeredith
3
440
RailsConf & Balkan Ruby 2019: The Past, Present, and Future of Rails at GitHub
eileencodes
141
35k
Self-Hosted WebAssembly Runtime for Runtime-Neutral Checkpoint/Restore in Edge–Cloud Continuum
chikuwait
0
640
The Cost Of JavaScript in 2023
addyosmani
55
10k
The Pragmatic Product Professional
lauravandoore
37
7.4k
Claude Code どこまでも/ Claude Code Everywhere
nwiizo
65
56k
Beyond borders and beyond the search box: How to win the global "messy middle" with AI-driven SEO
davidcarrasco
3
180
How to Ace a Technical Interview
jacobian
281
24k
Why Mistakes Are the Best Teachers: Turning Failure into a Pathway for Growth
auna
0
180
Context Engineering - Making Every Token Count
addyosmani
9
1k
Transcript
MADE EASY Infographics Chris Lema
The Power of STORY
Since we were kids! We’ve been telling stories
None
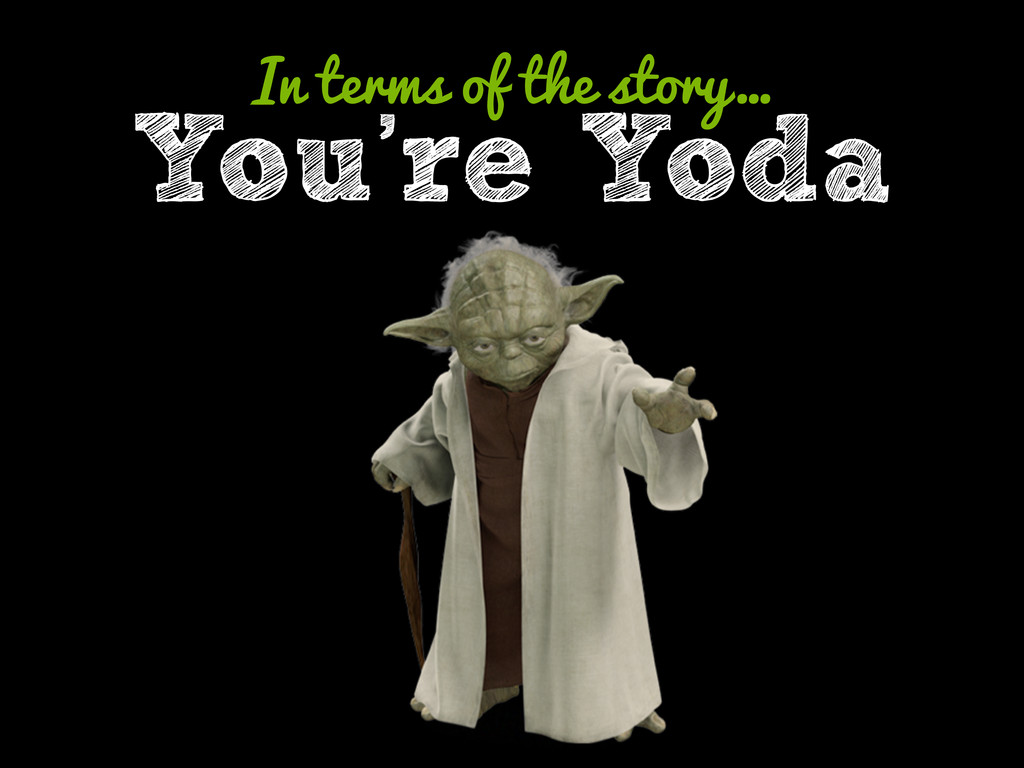
You’re Yoda In terms of the story…
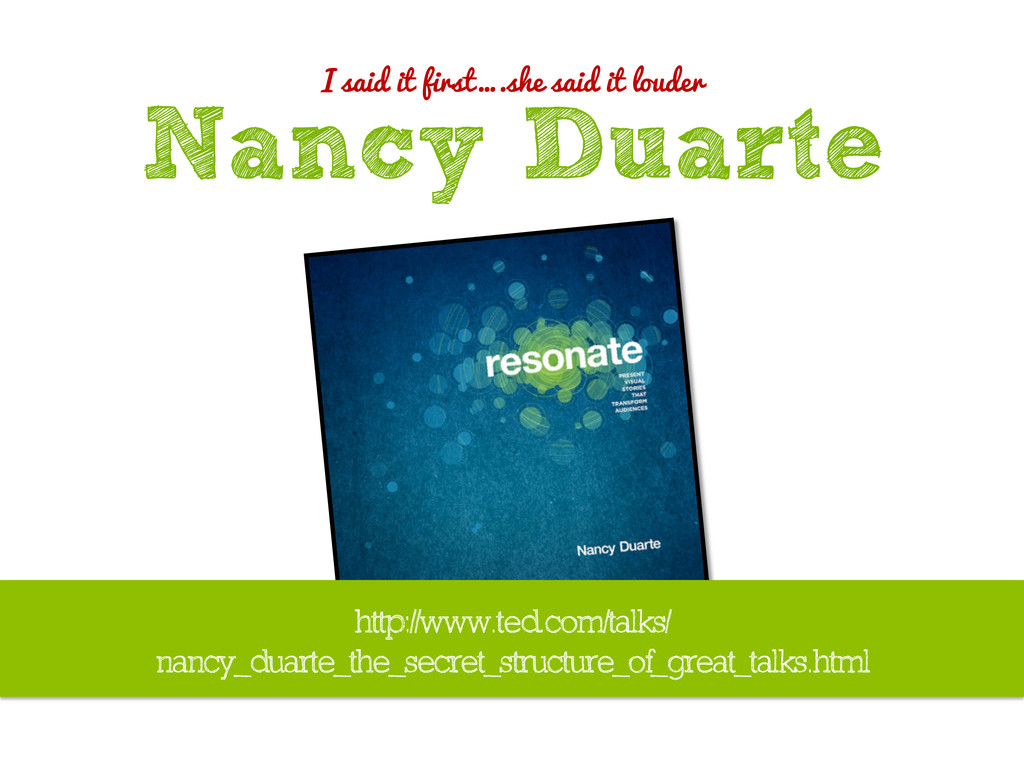
I said it first….she said it louder Nancy Duarte http://www.ted.com/talks/
nancy_duarte_the_secret_structure_of_great_talks.html
The Power of Infographics
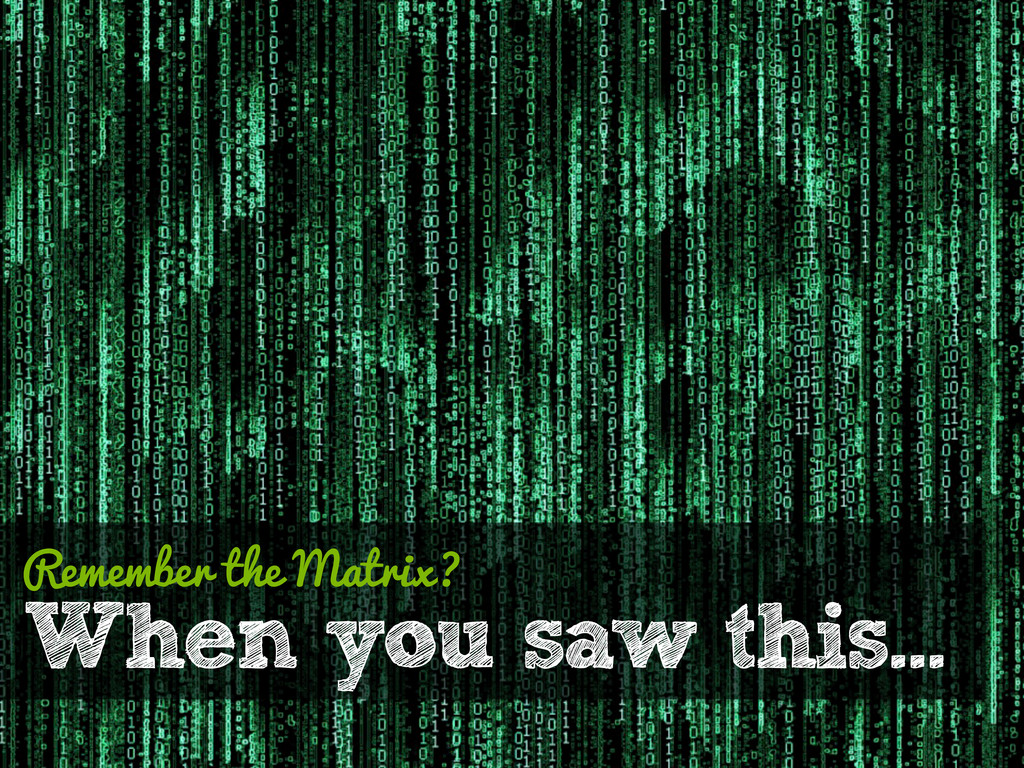
When you saw this… Remember the Matrix?
saw her? How many of you
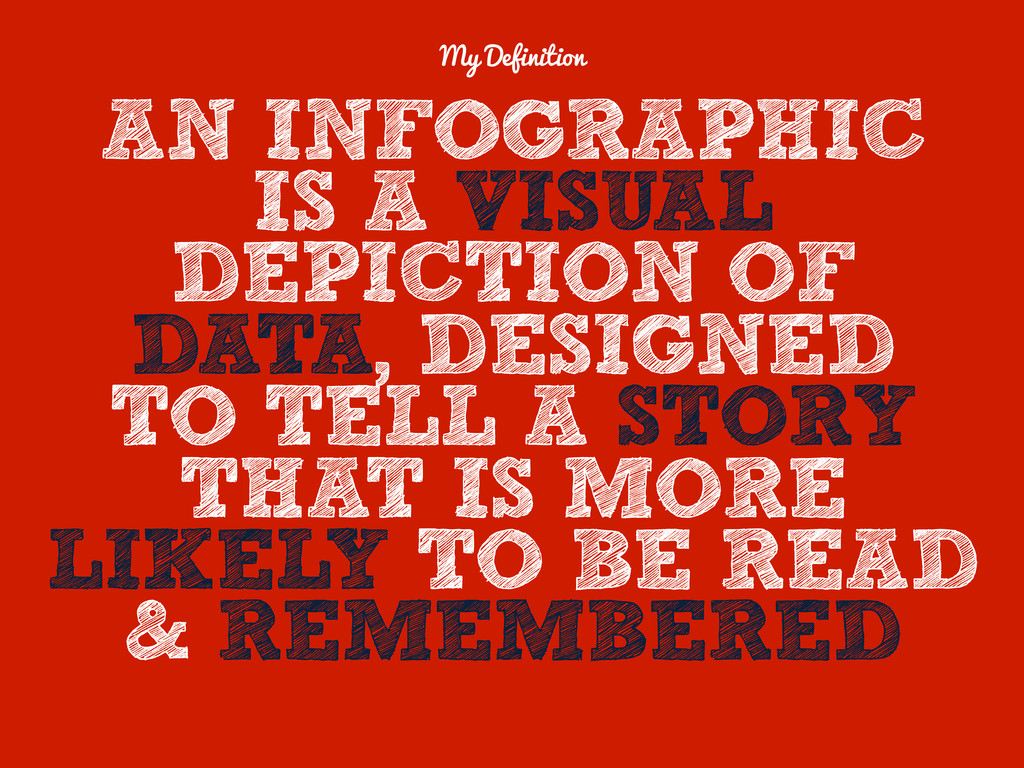
AN INFOGRAPHIC IS A VISUAL DEPICTION OF DATA, DESIGNED TO
TELL A STORY THAT IS MORE LIKELY TO BE READ & REMEMBERED My Definition
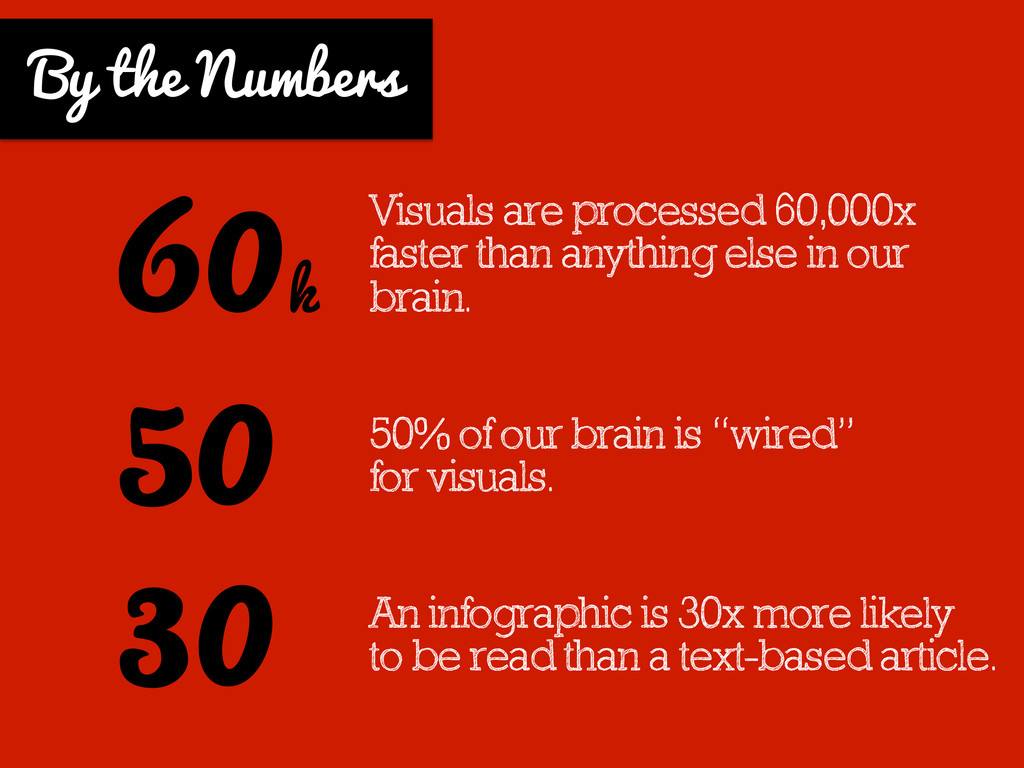
Visuals are processed 60,000x faster than anything else in our
brain. 50% of our brain is “wired” for visuals. An infographic is 30x more likely to be read than a text-based article. By the Numbers 60 k 50 30
How to Assemble A Visual Story
What point are you trying to make?
Find the research to back you up!
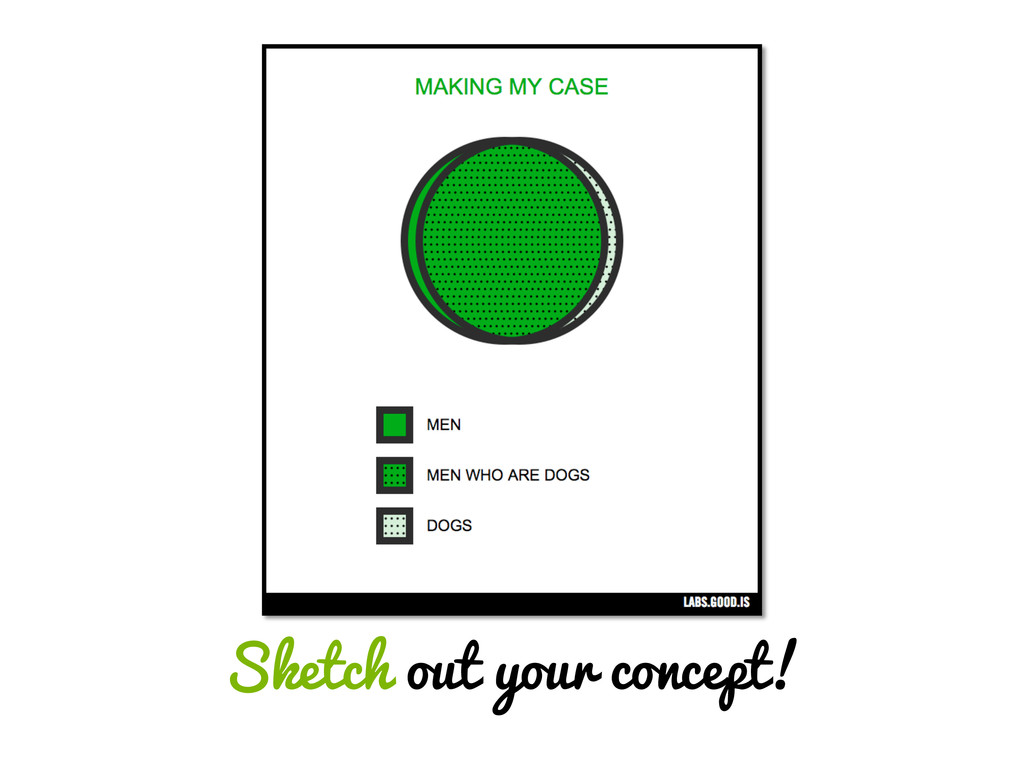
Sketch out your concept!
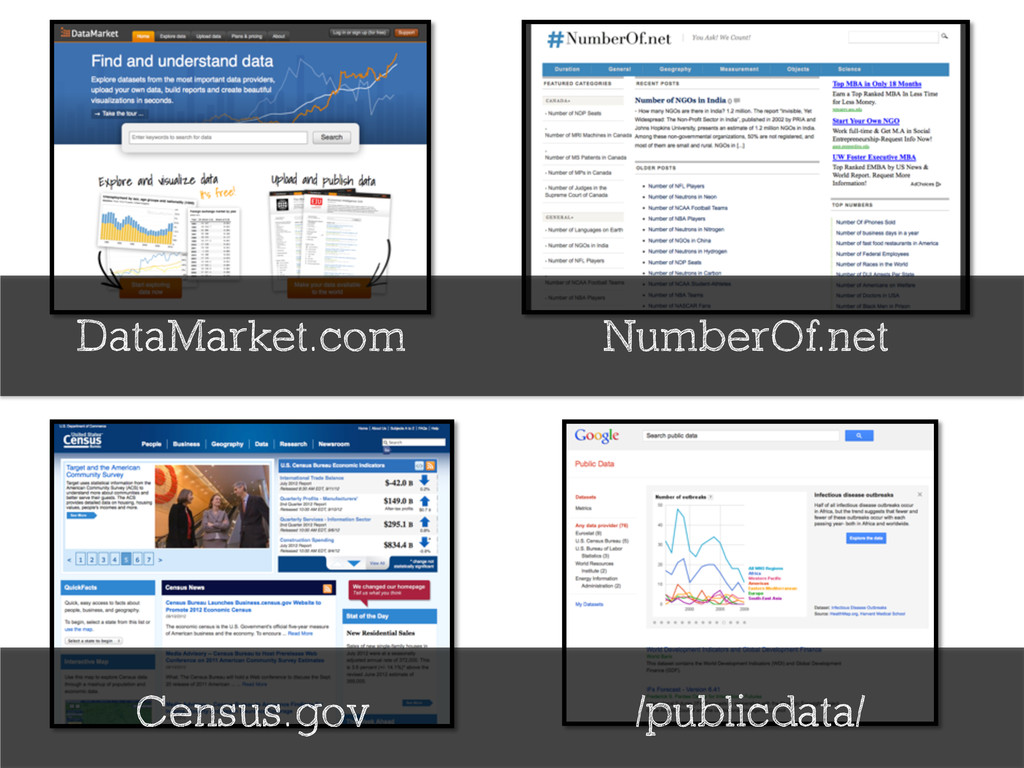
Where to find The Data
DataMarket.com NumberOf.net Census.gov /publicdata/
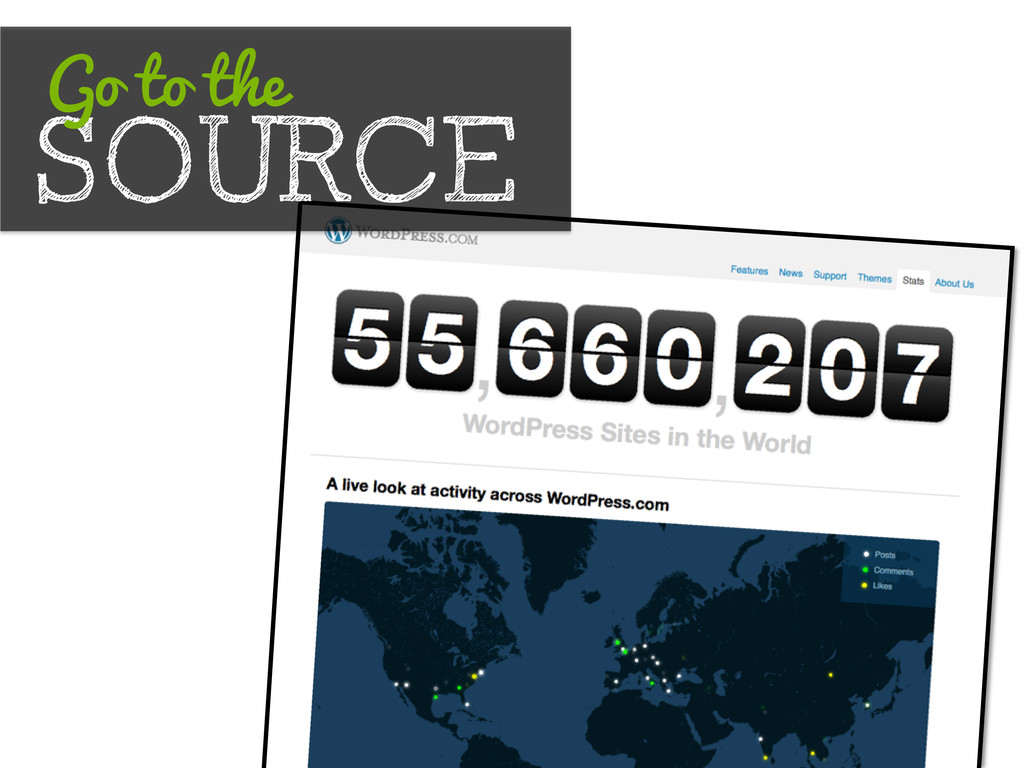
SOURCE Go to the
An Example Making the Case for WordPress
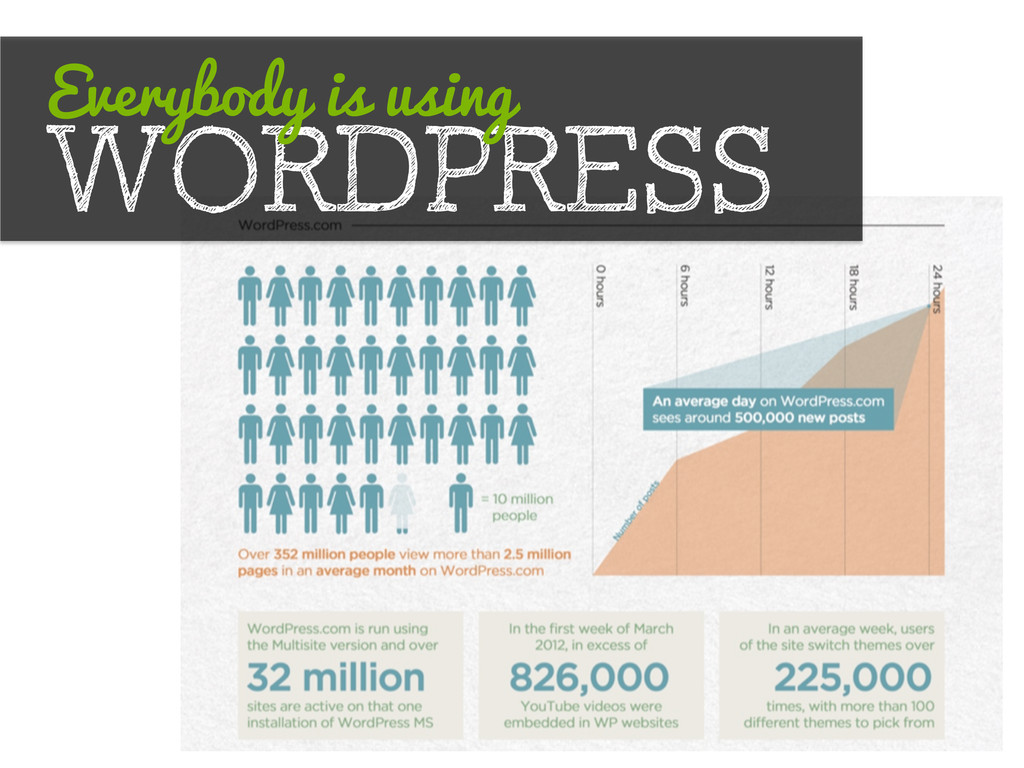
WORDPRESS Everybody is using
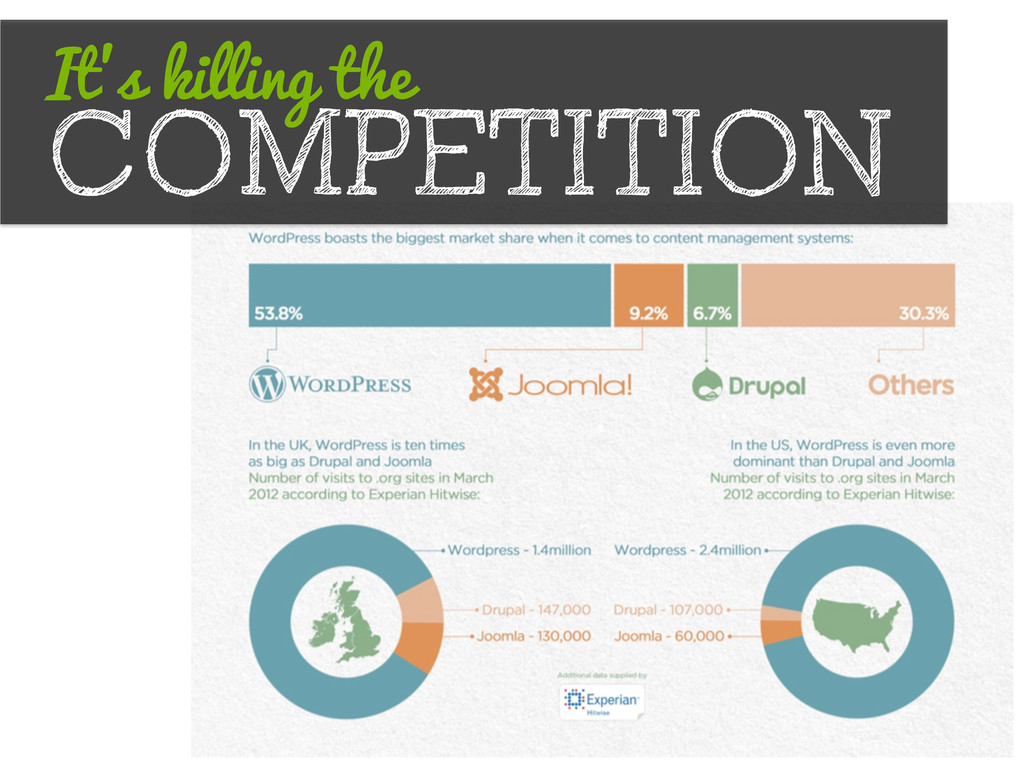
COMPETITION It’s killing the
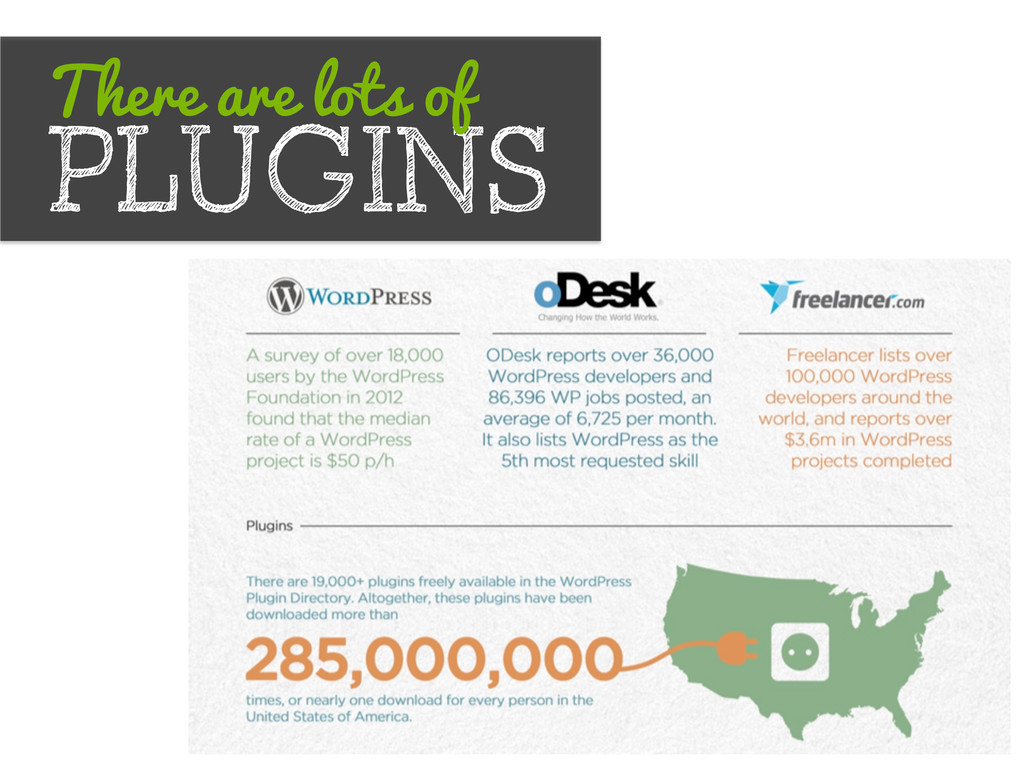
PLUGINS There are lots of
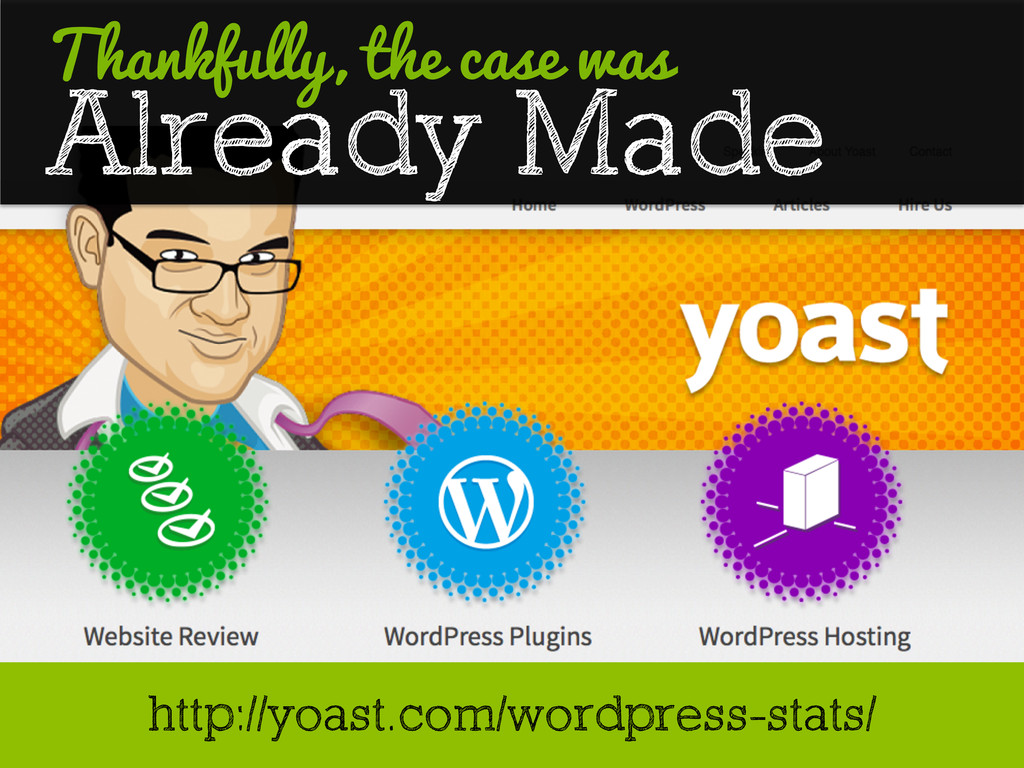
Already Made Thankfully, the case was http://yoast.com/wordpress-stats/
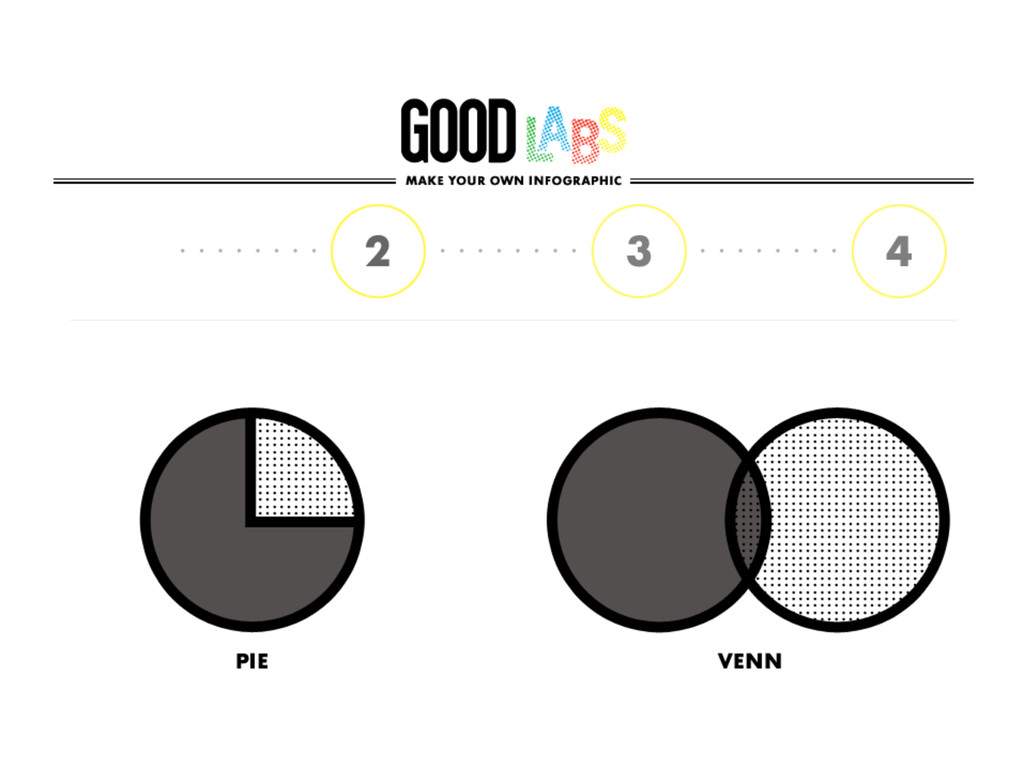
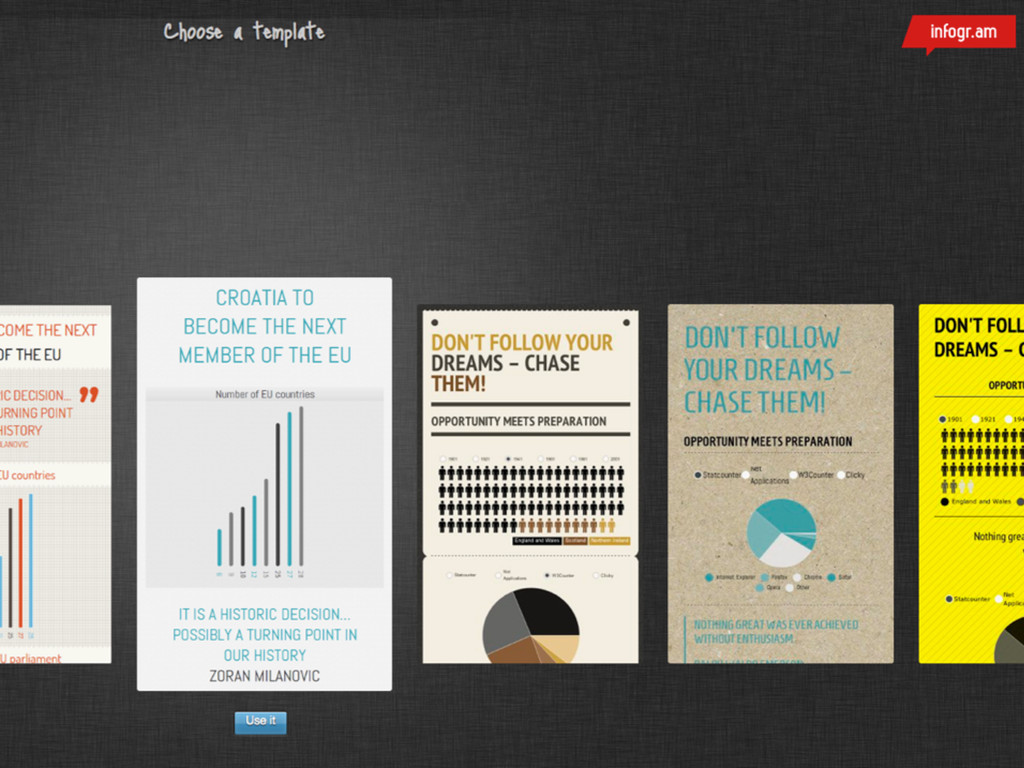
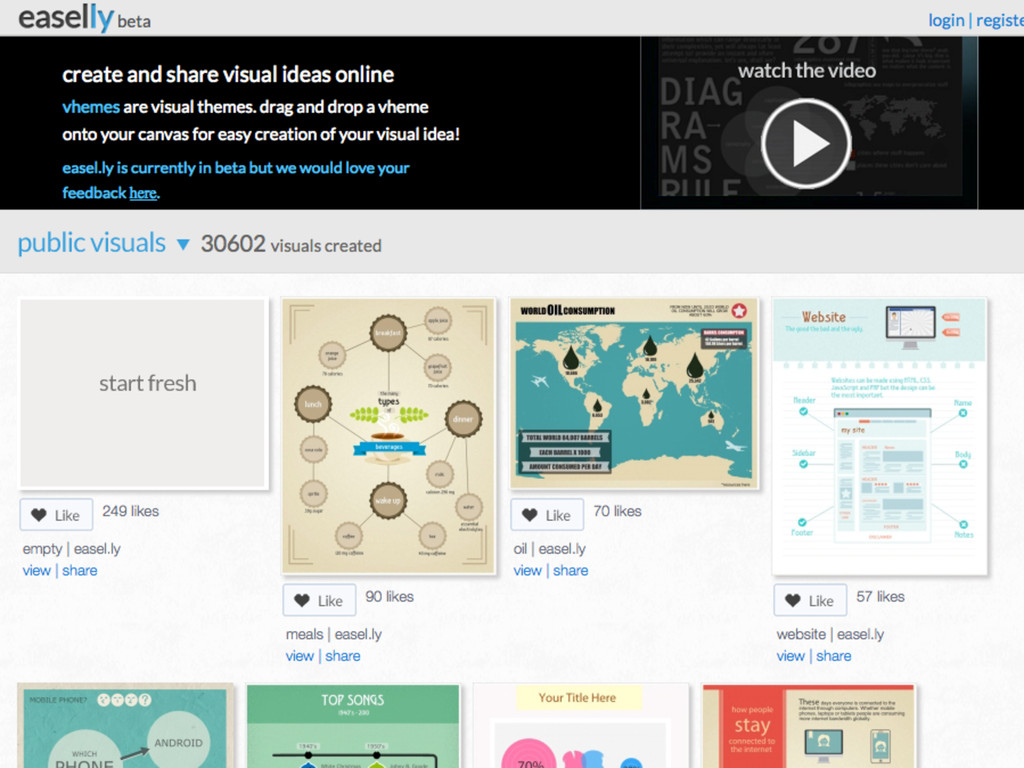
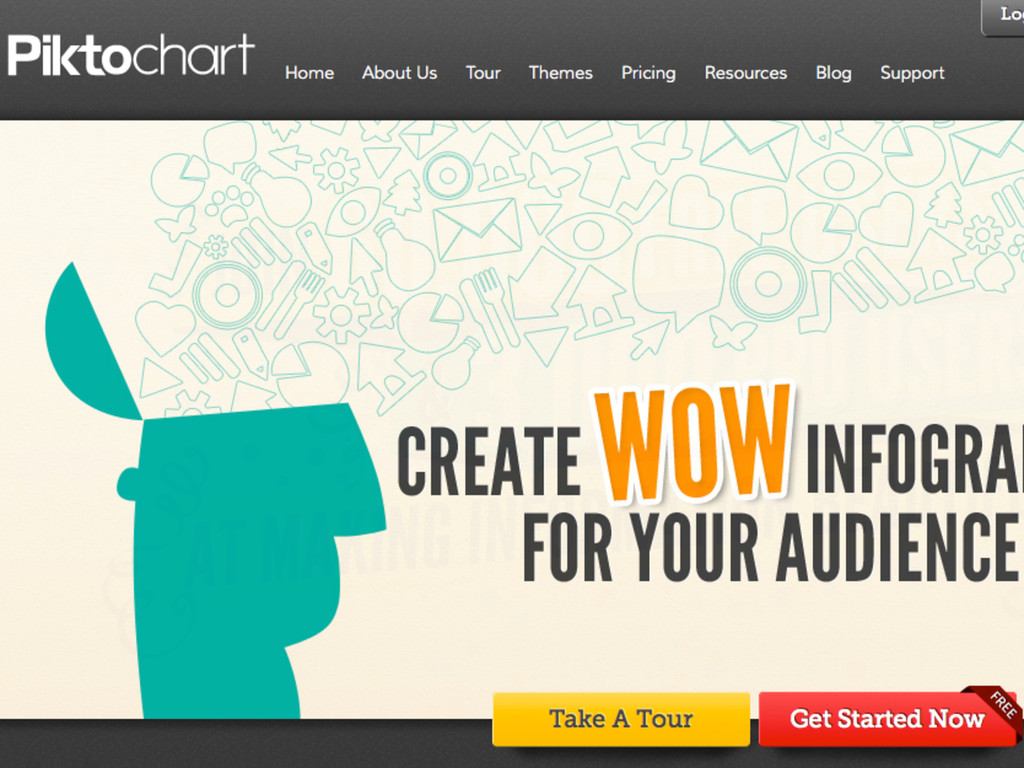
You don’t need to be a designer Infographic Tools
None
None
None
None
Now it’s time for a DEMO
How to Find Me http://chrislema.com Twitter: @chrislema Facebook: /chrislema LinkedIn:
/in/mrchrislema CHRIS LEMA