Upgrade to Pro — share decks privately, control downloads, hide ads and more …

Well, that’s weird…

Well, that’s weird…

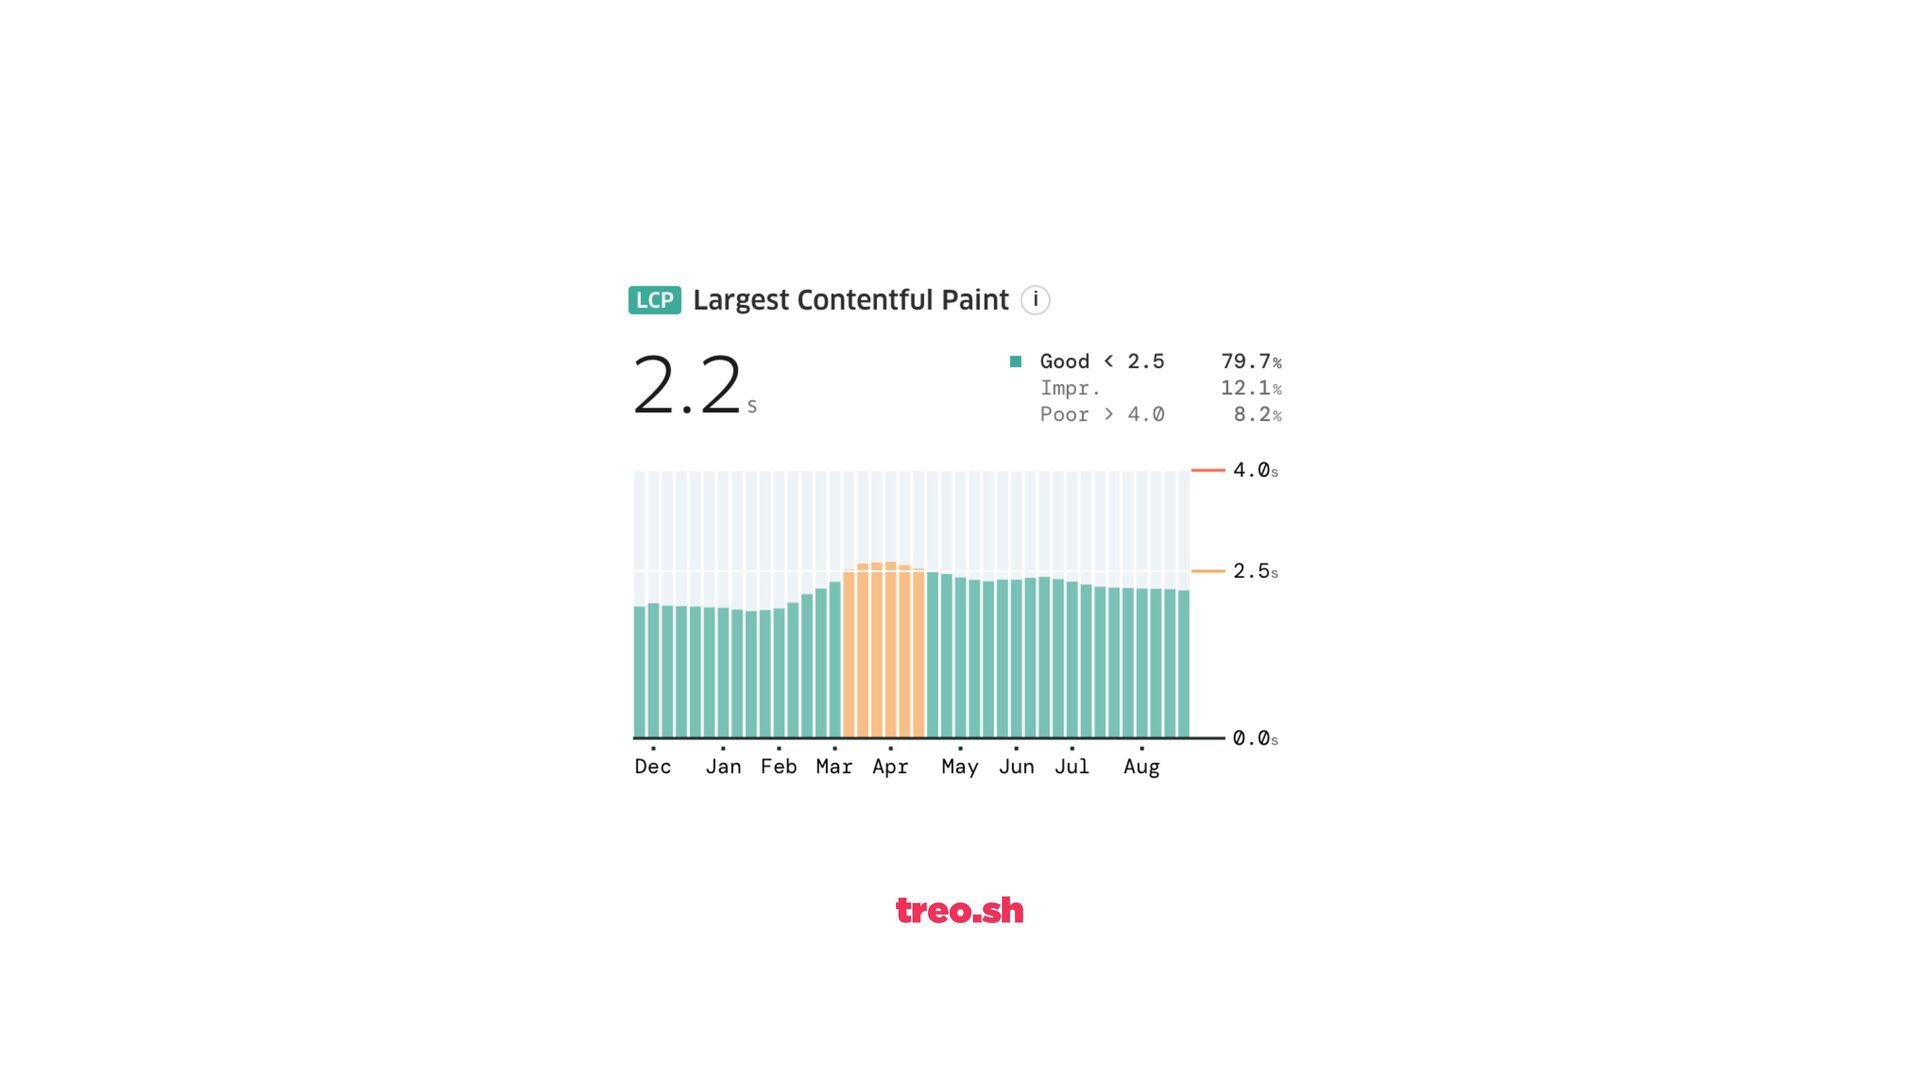
Spend long enough investigating web performance and you collect some pretty odd stories. I’ve investigated improvements that no one made and regressions that sent developers hunting through perfectly innocent deployments. Sometimes the issue was in the measurement itself; sometimes it was in another team’s idea of who should be visiting the site.

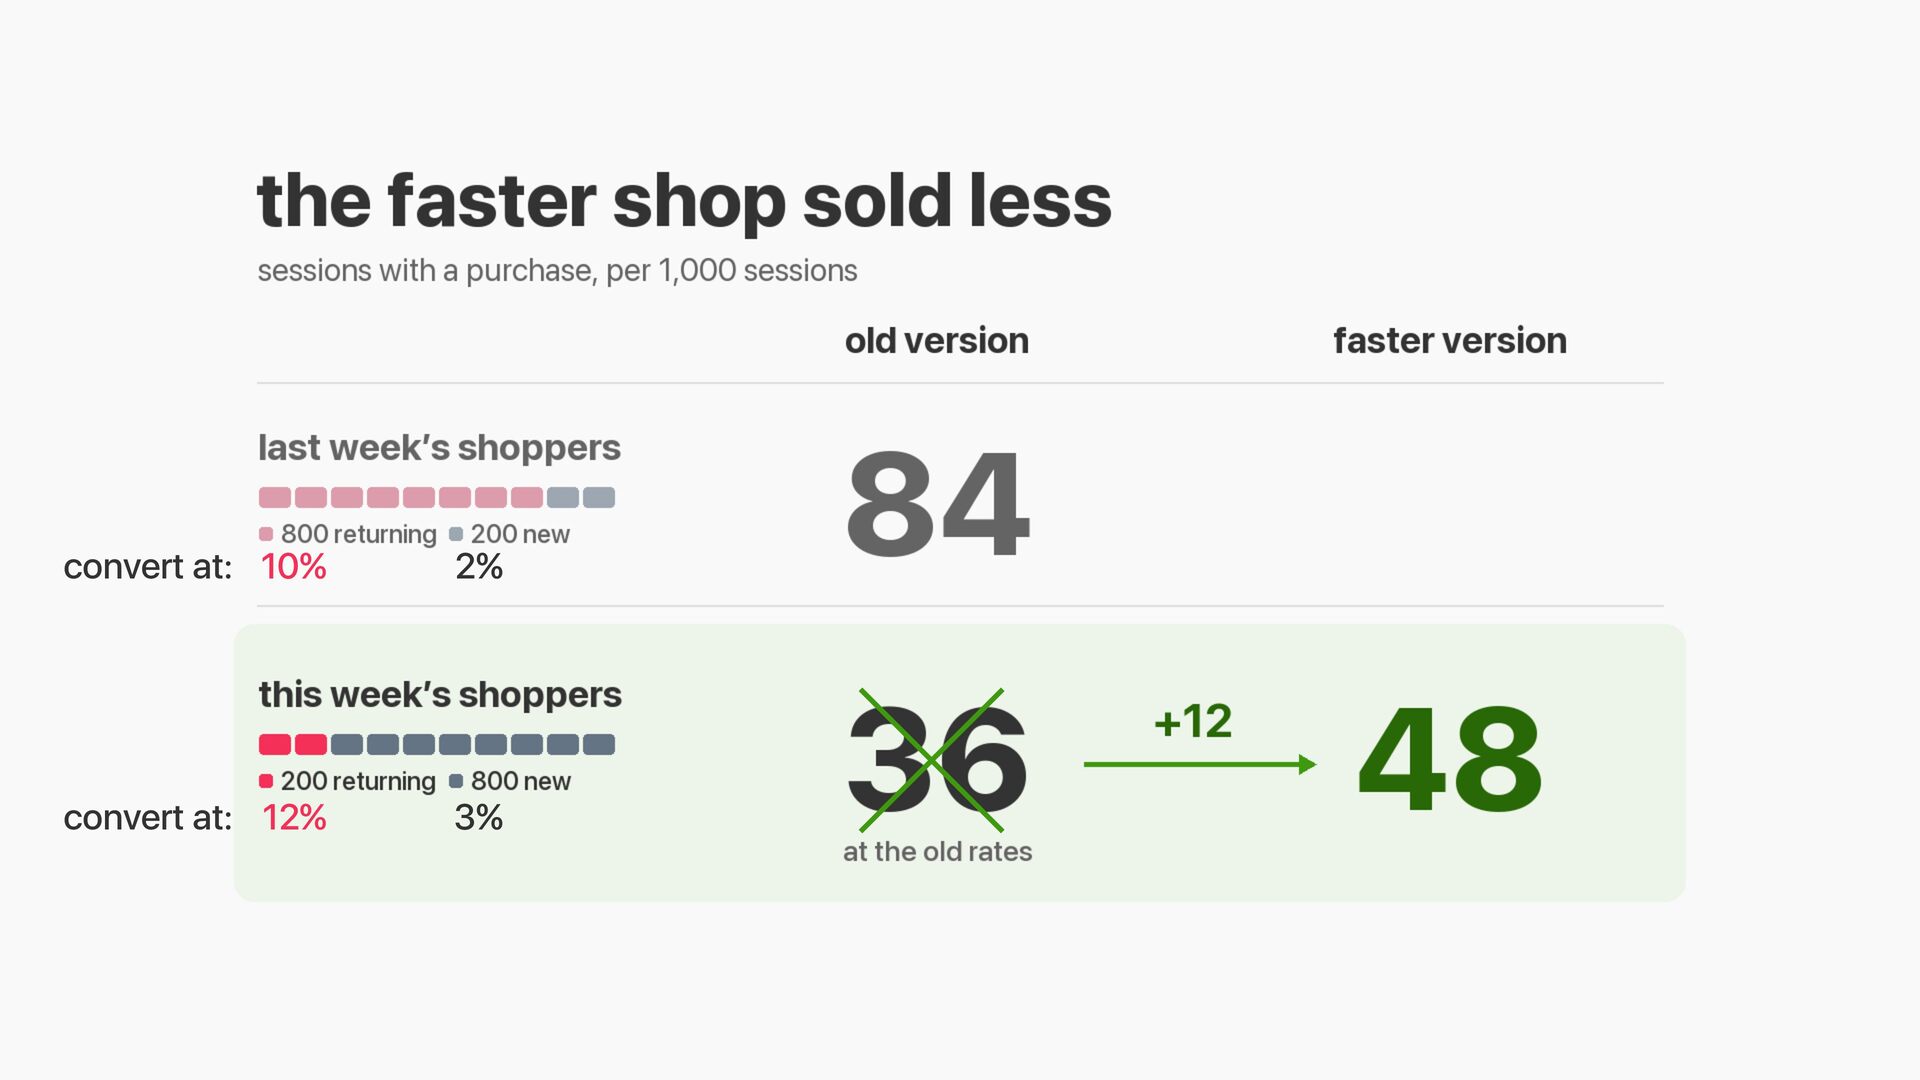
This talk is a collection of stories from real projects, with practical advice taken from the things that caught me out. We’ll look beyond headline percentiles, investigate bugs in performance tooling, and see how a change in visitors hid successful optimisation work. Along the way, I’ll share some simple ways to make comparisons more useful and experiments more trustworthy. Expect a few surprises, some pedantry, and lots of war stories.

Harry Roberts

November 19, 2026

Transcript

166 slides
  1. fun little things i’ve seen, heard, and learned about web

    performance that i think you might like, too
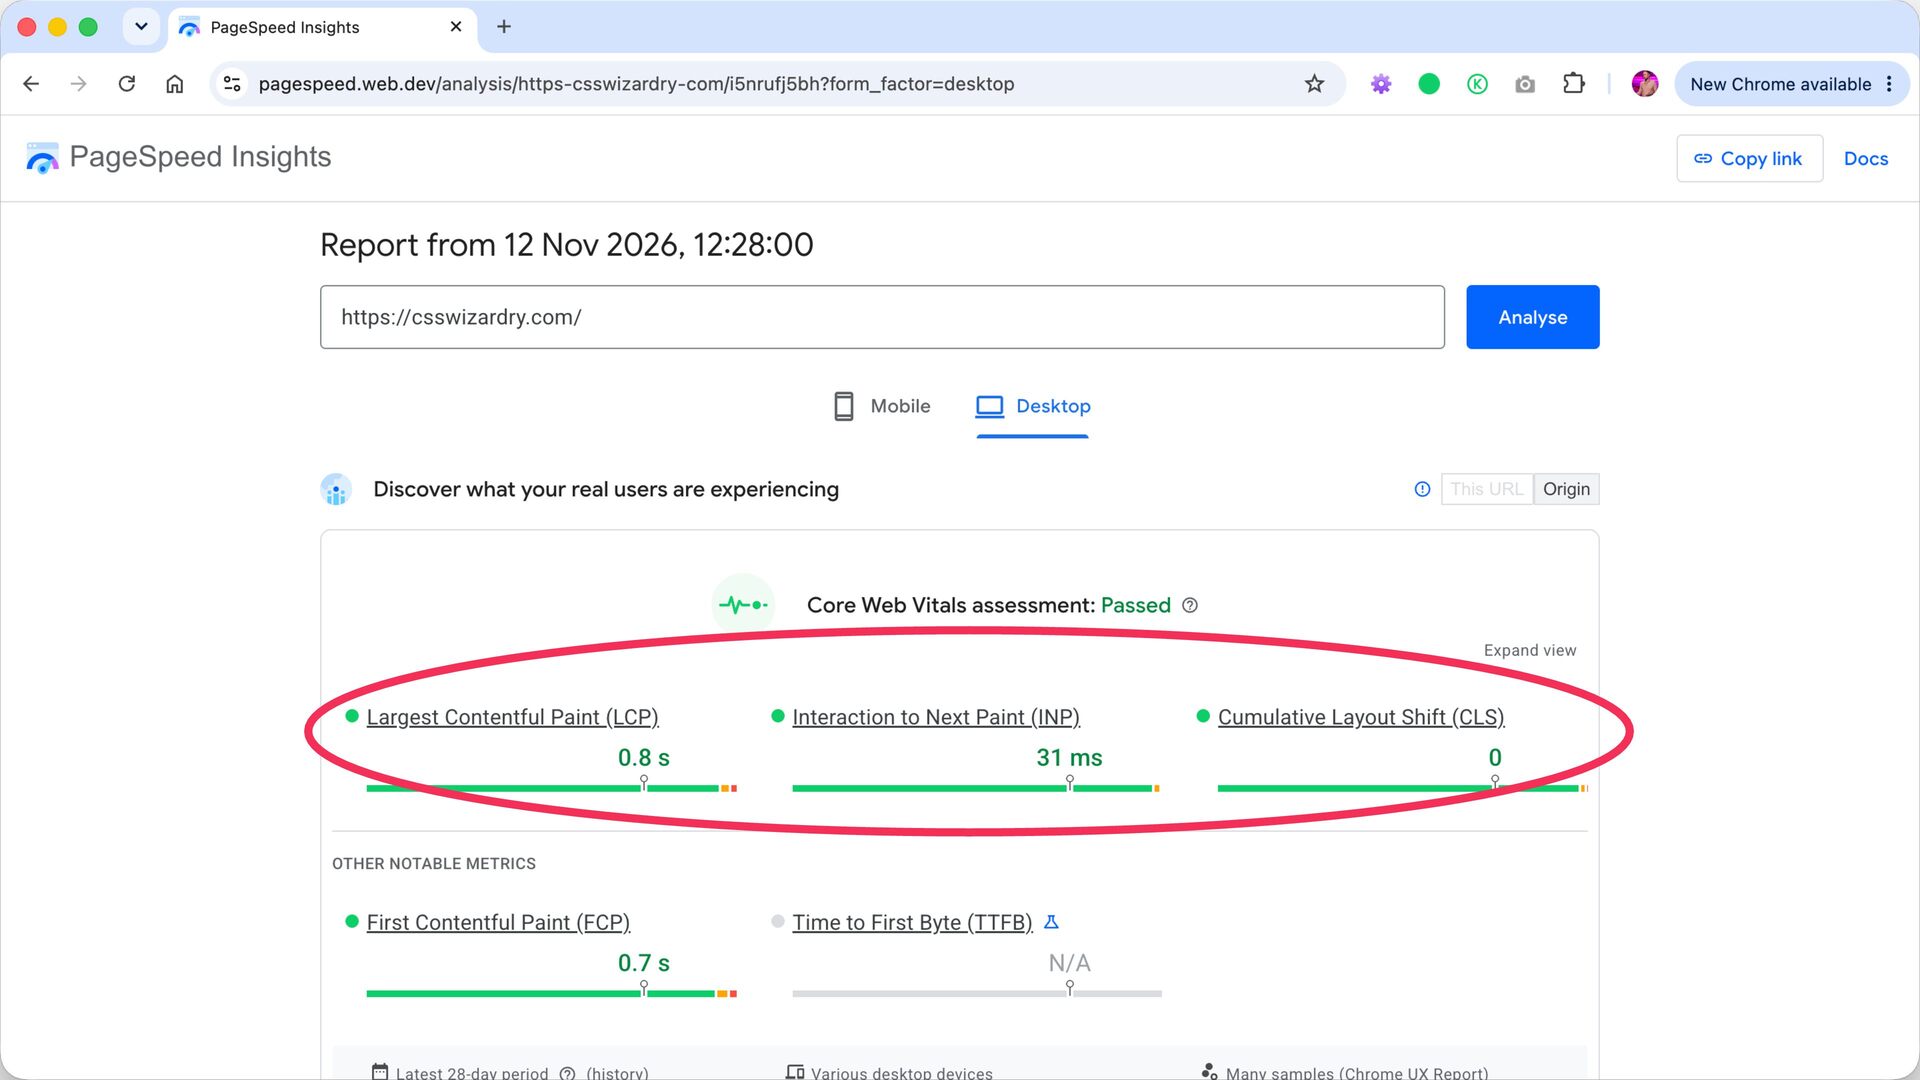
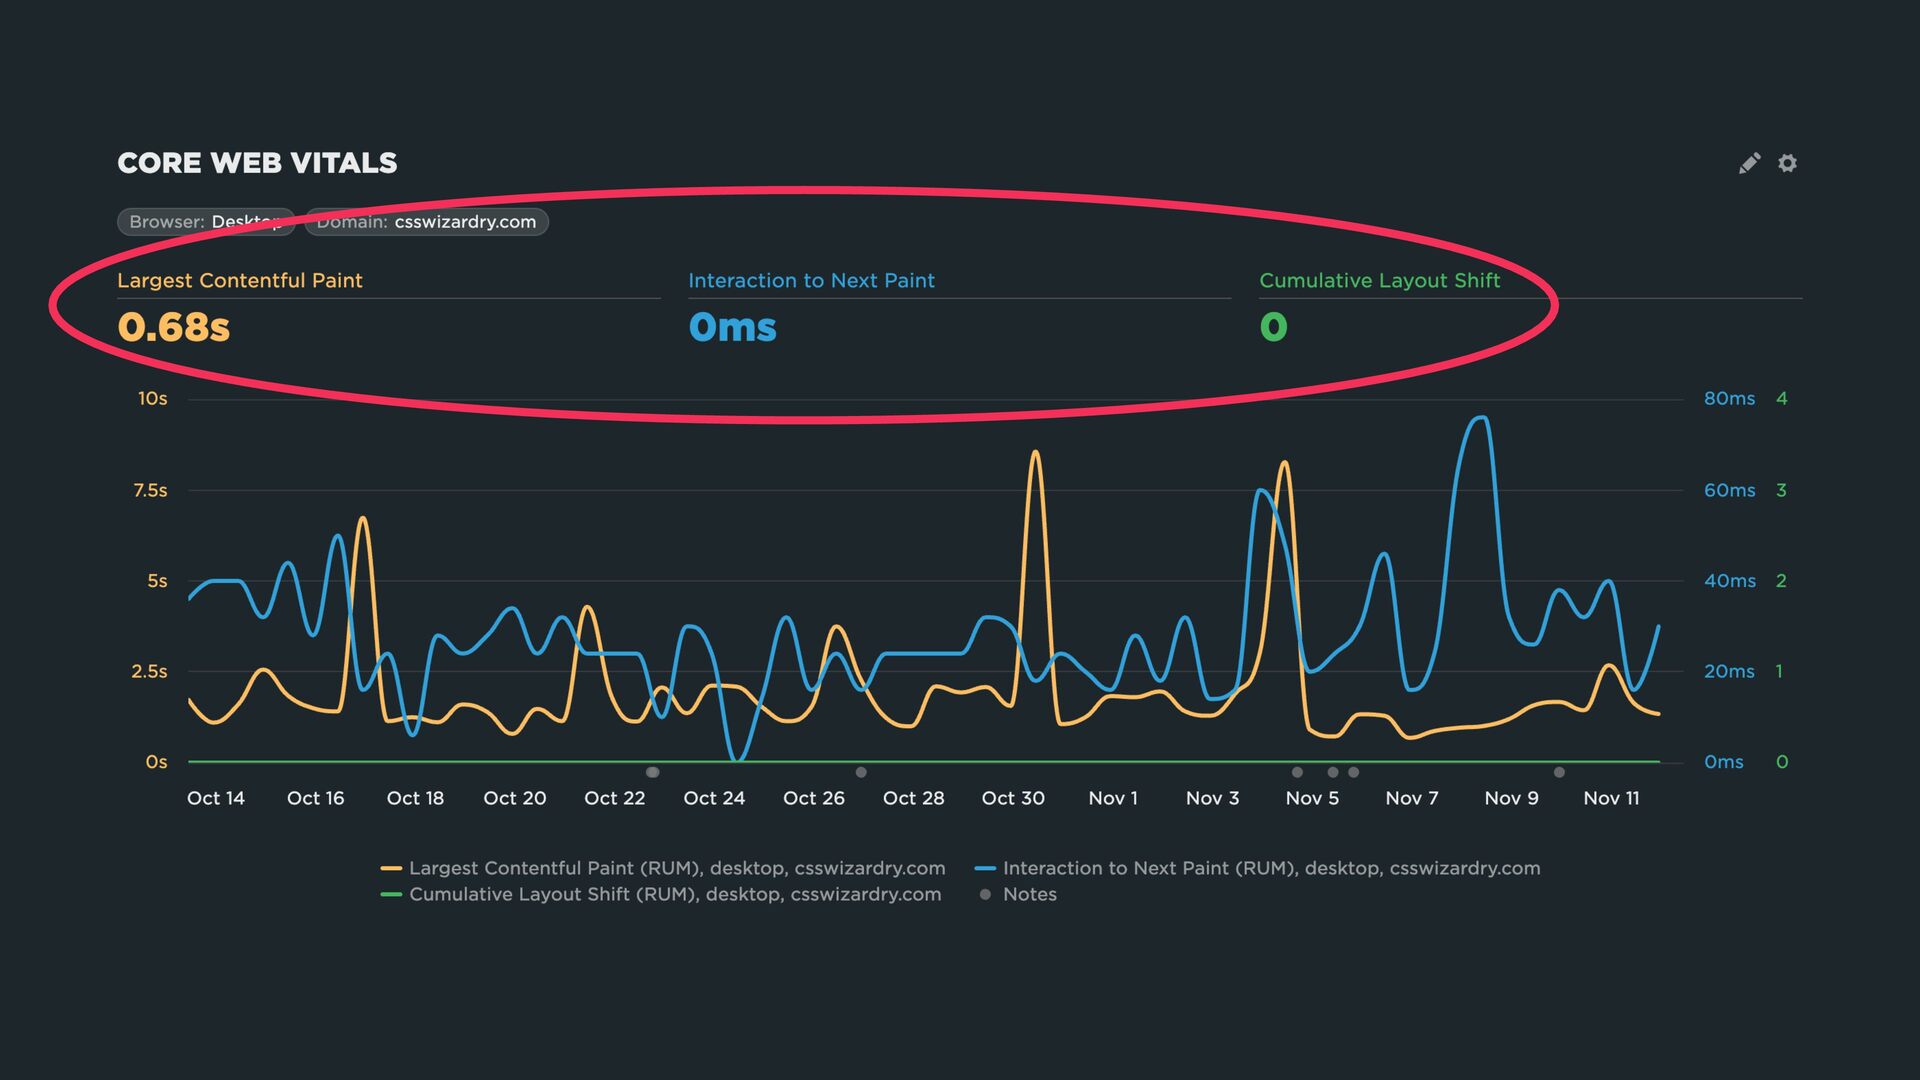
  2. WARNING none of these shows how fast your site is;

    they show how fast your site is experienced
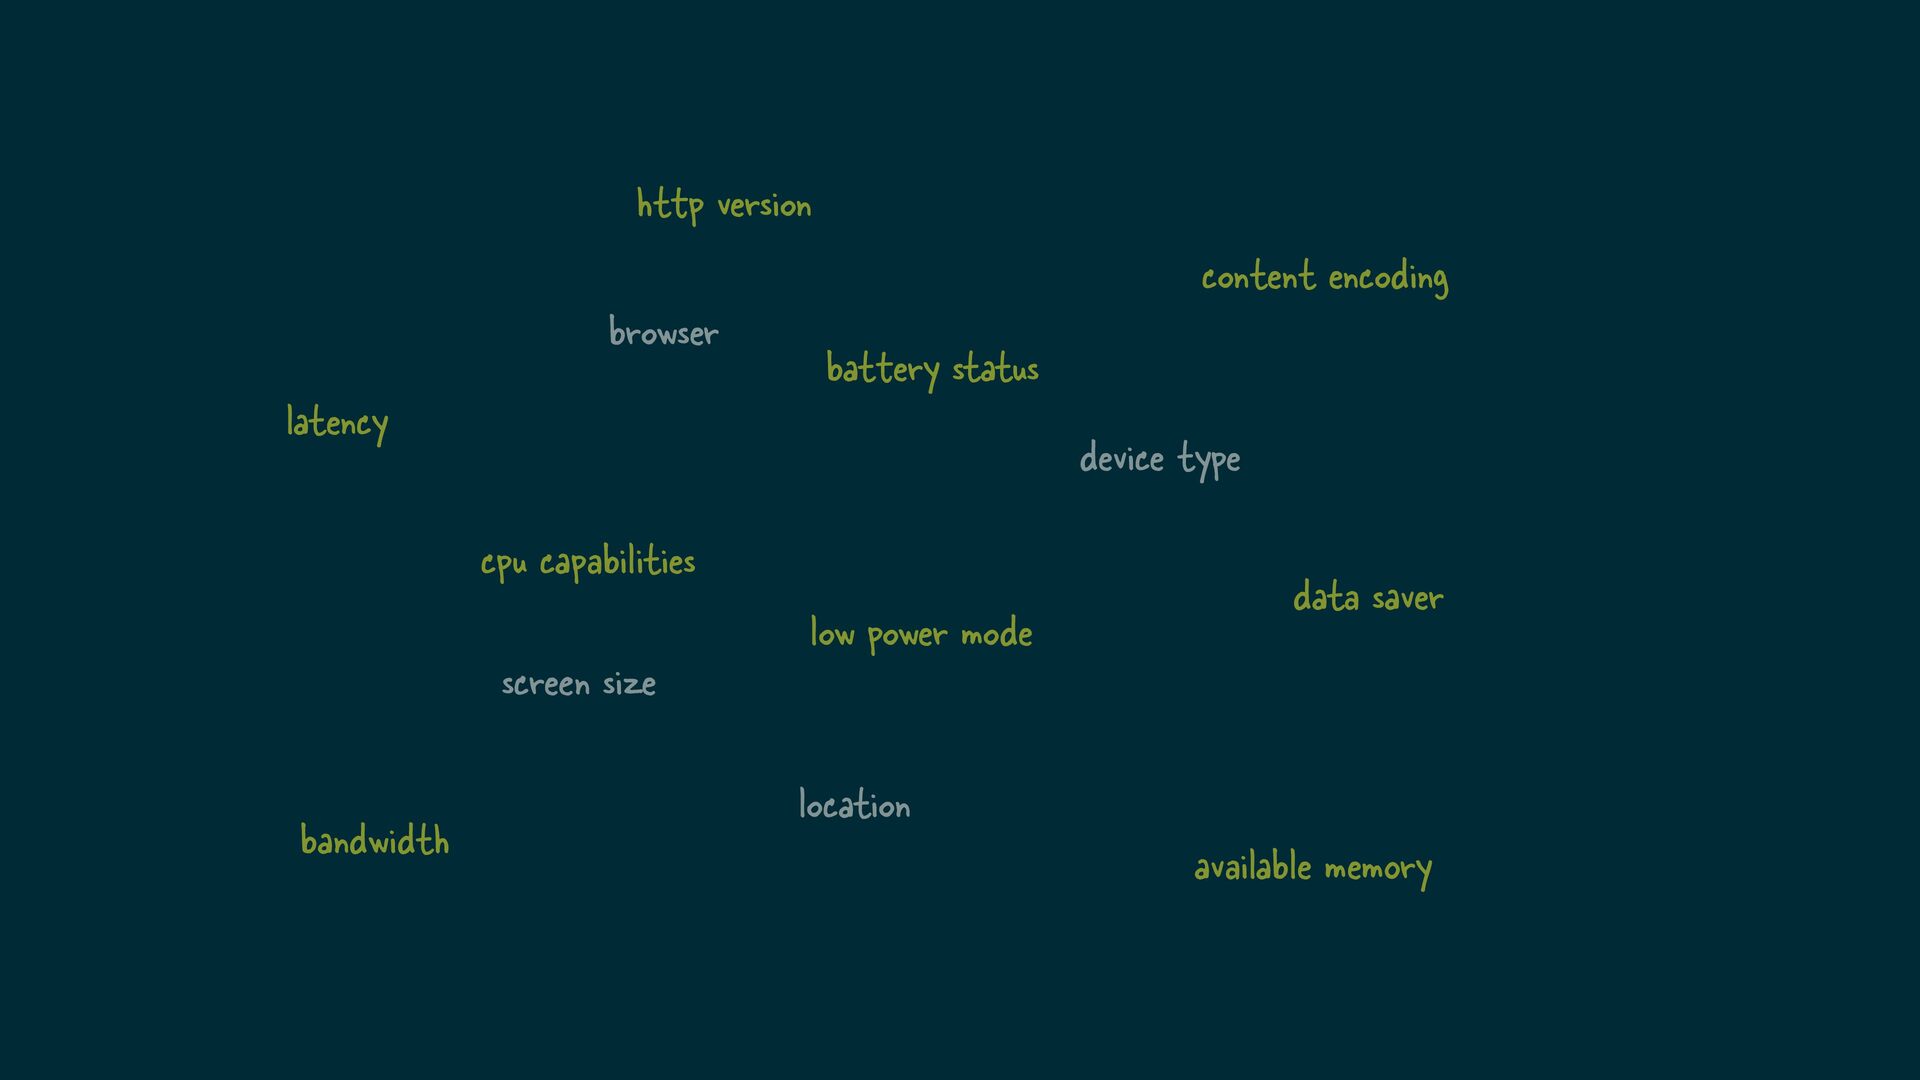
  3. ht p version browser latency content encoding bat ery status

    device type cpu cap bilities scre n size o a e a t t a bandwidth low power mode location dat saver av ilable mem ry
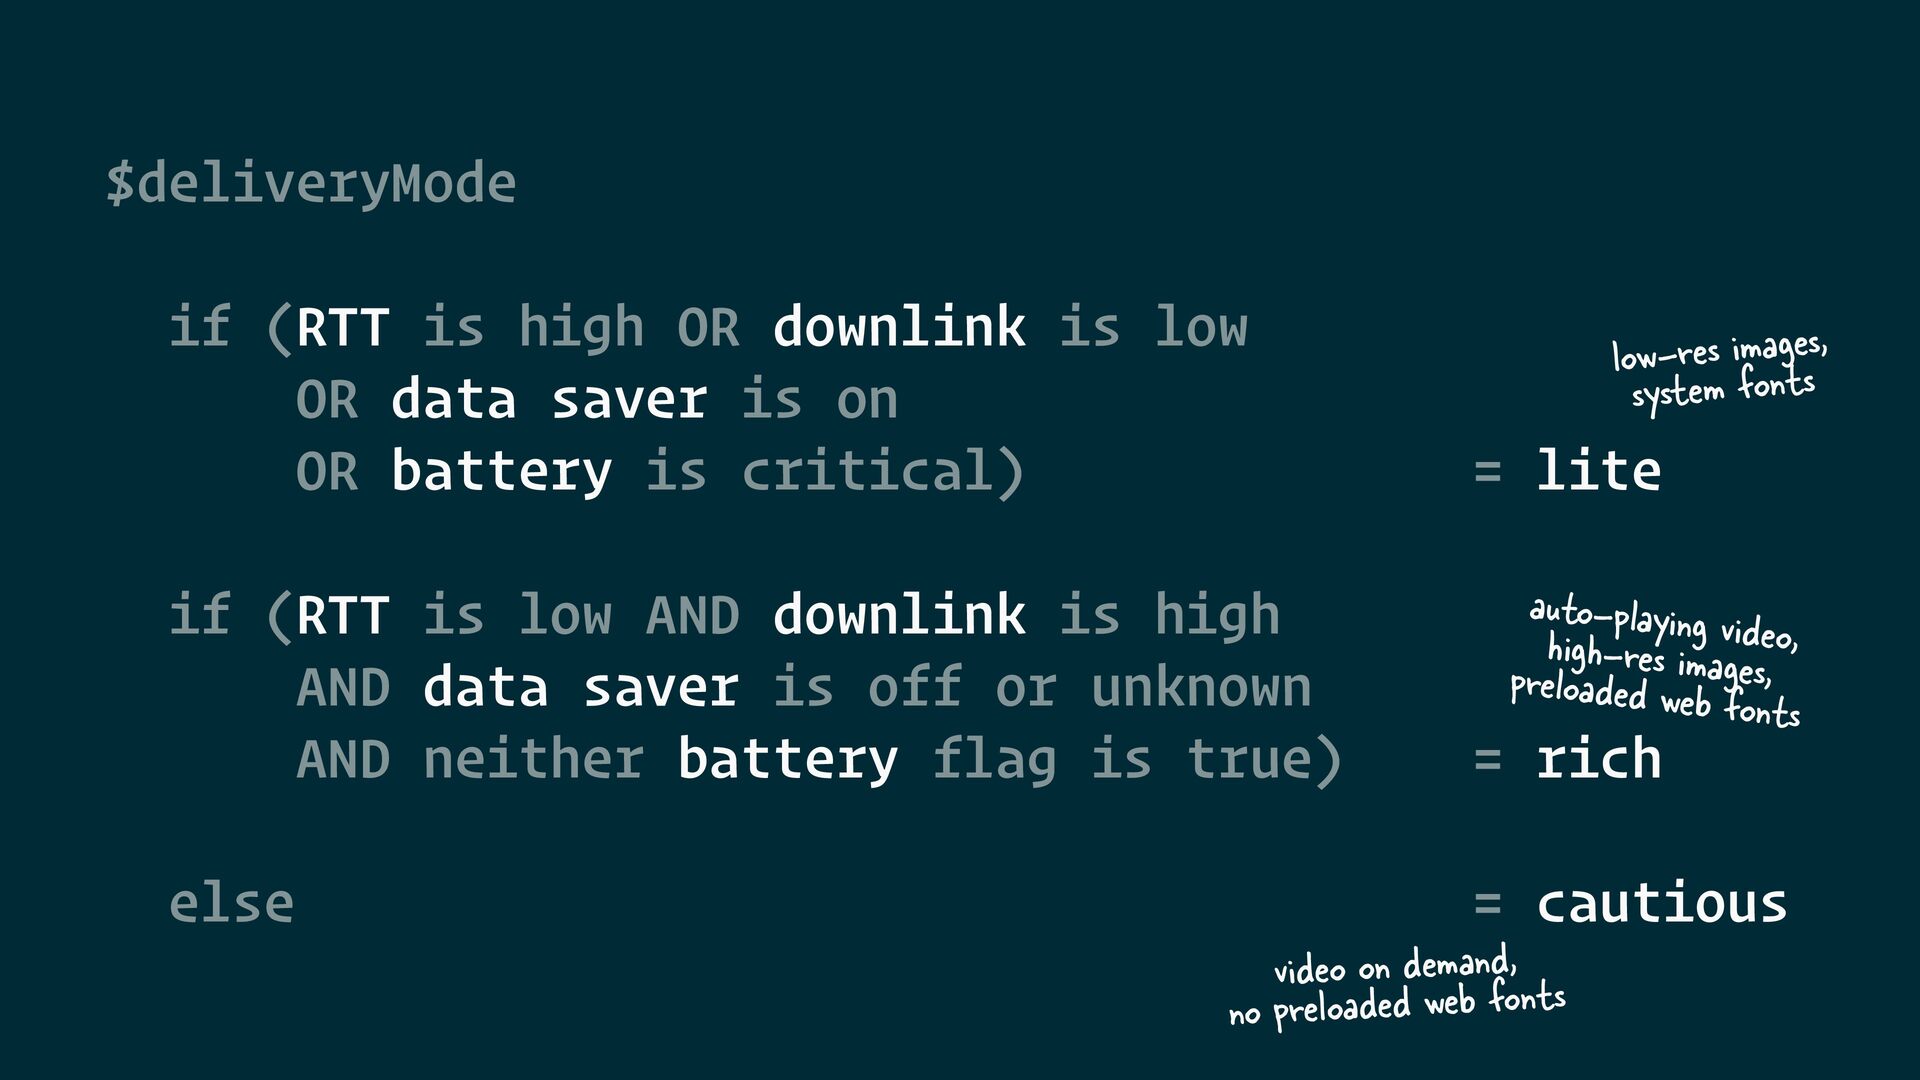
  4. $deliveryMode if (RTT is high OR downlink is low OR

    data saver is on OR battery is critical) , s e g a m i s e r low s t n o f m e t s y s = lite auto-playing v i high-res imagedeo, preloaded web s, fonts if (RTT is low AND downlink is high AND data saver is off or unknown AND neither battery flag is true) = rich else = cautious video on demand, s t n o f b e w d e d a lo e r p no
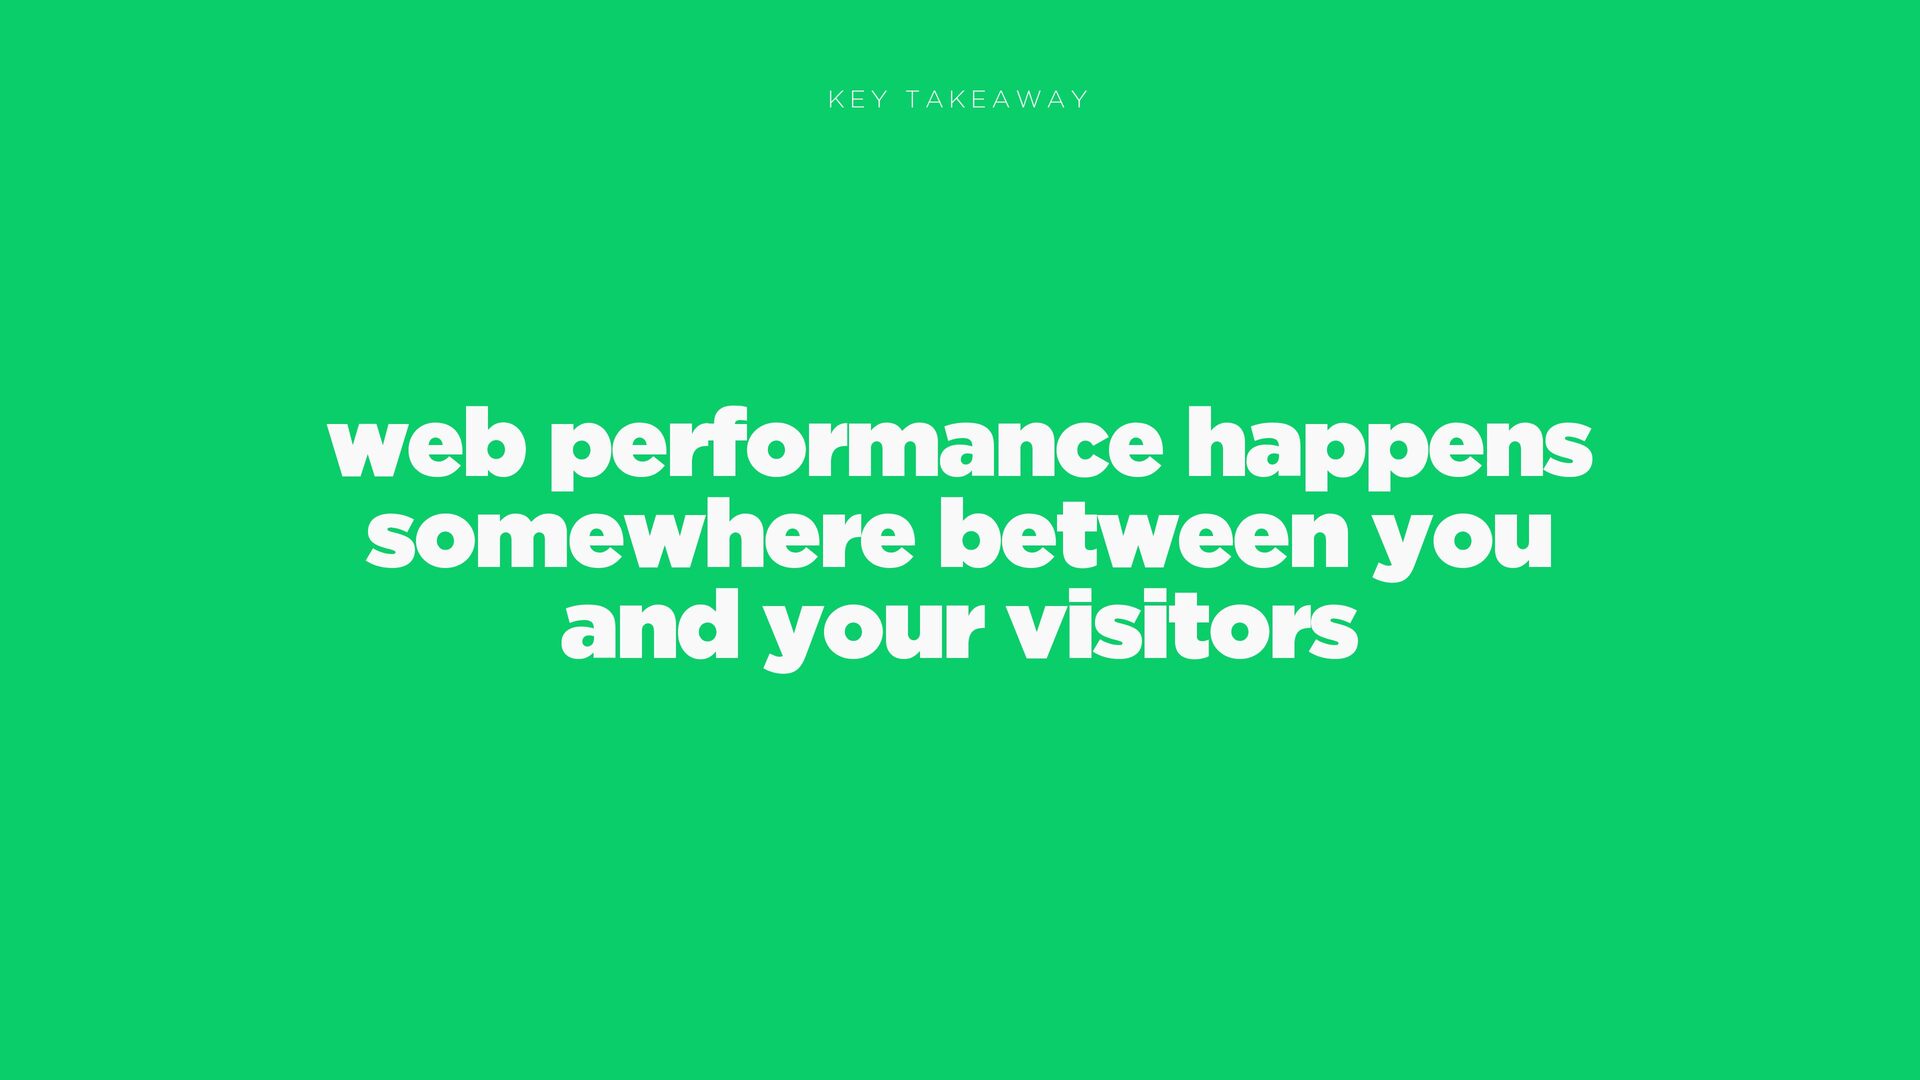
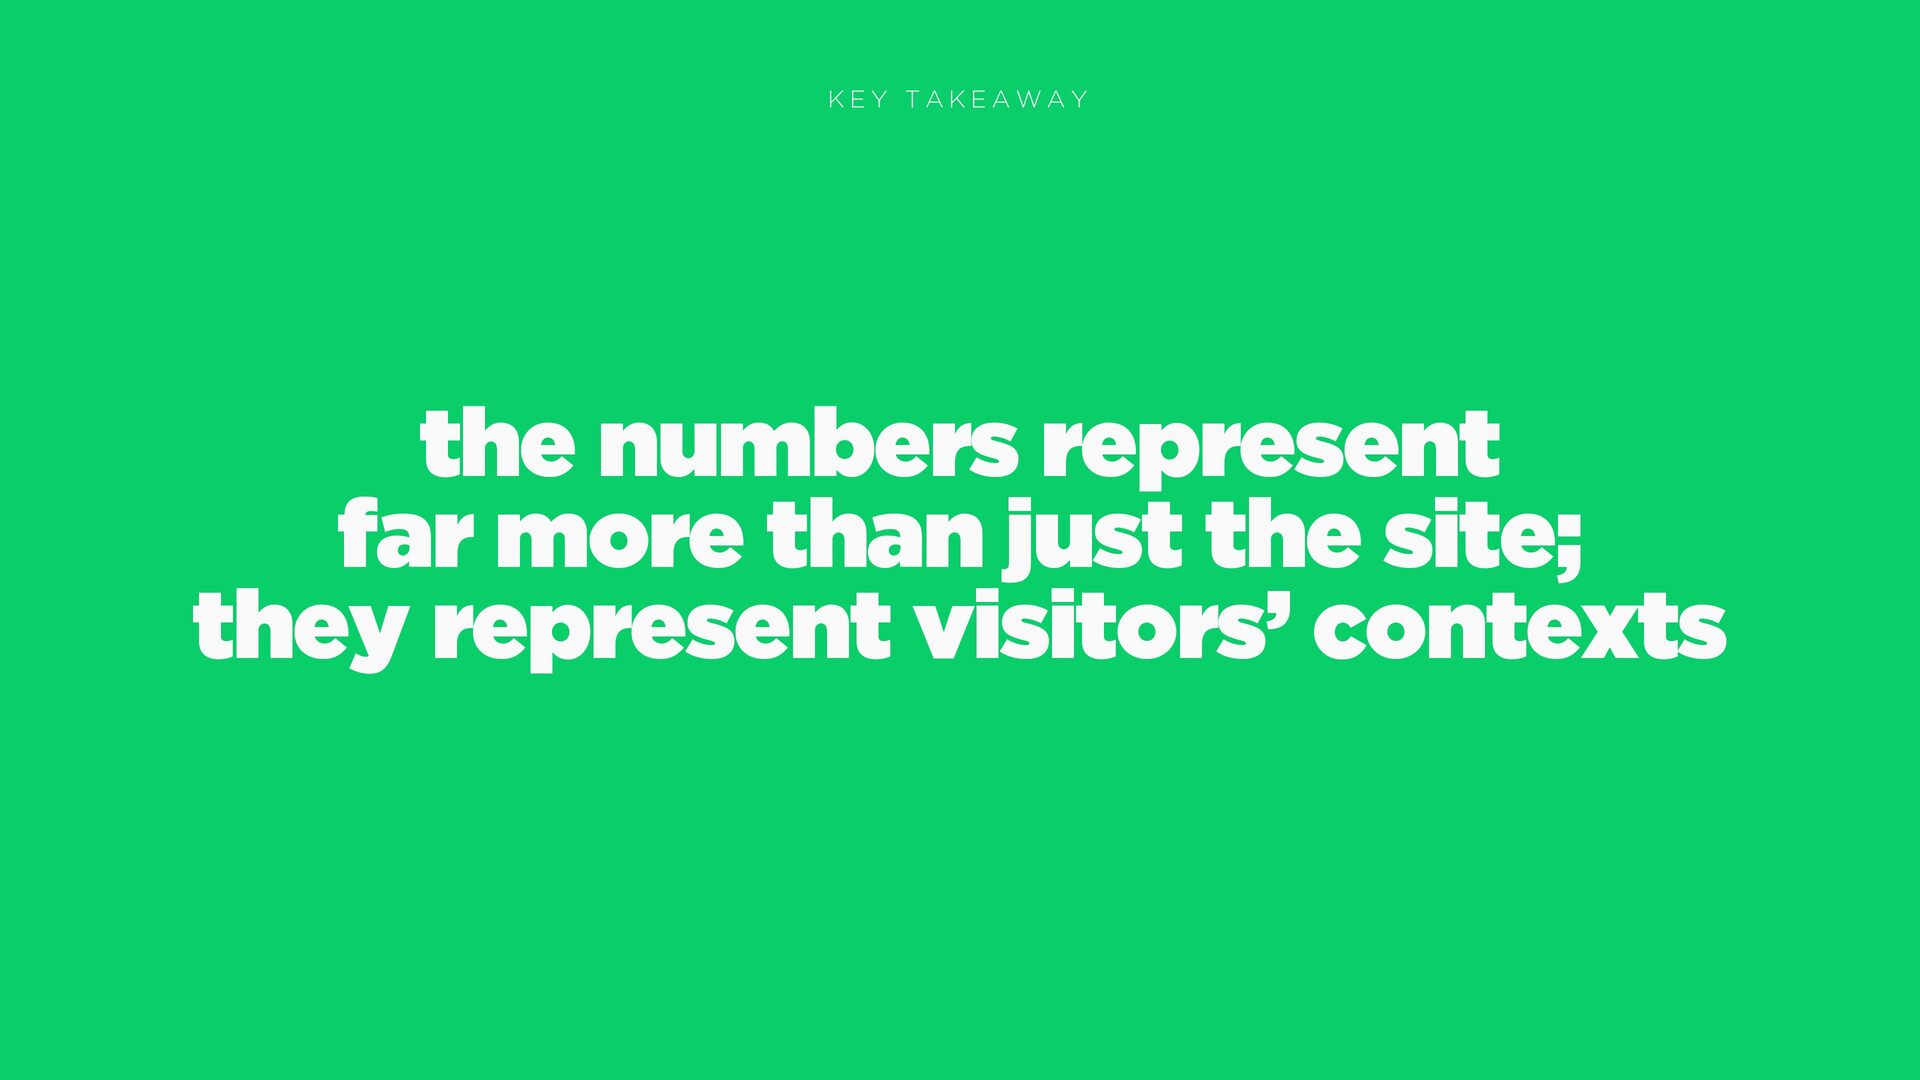
  5. KEY TAKEAWAY the numbers represent far more than just the

    site; they represent visitors’ contexts
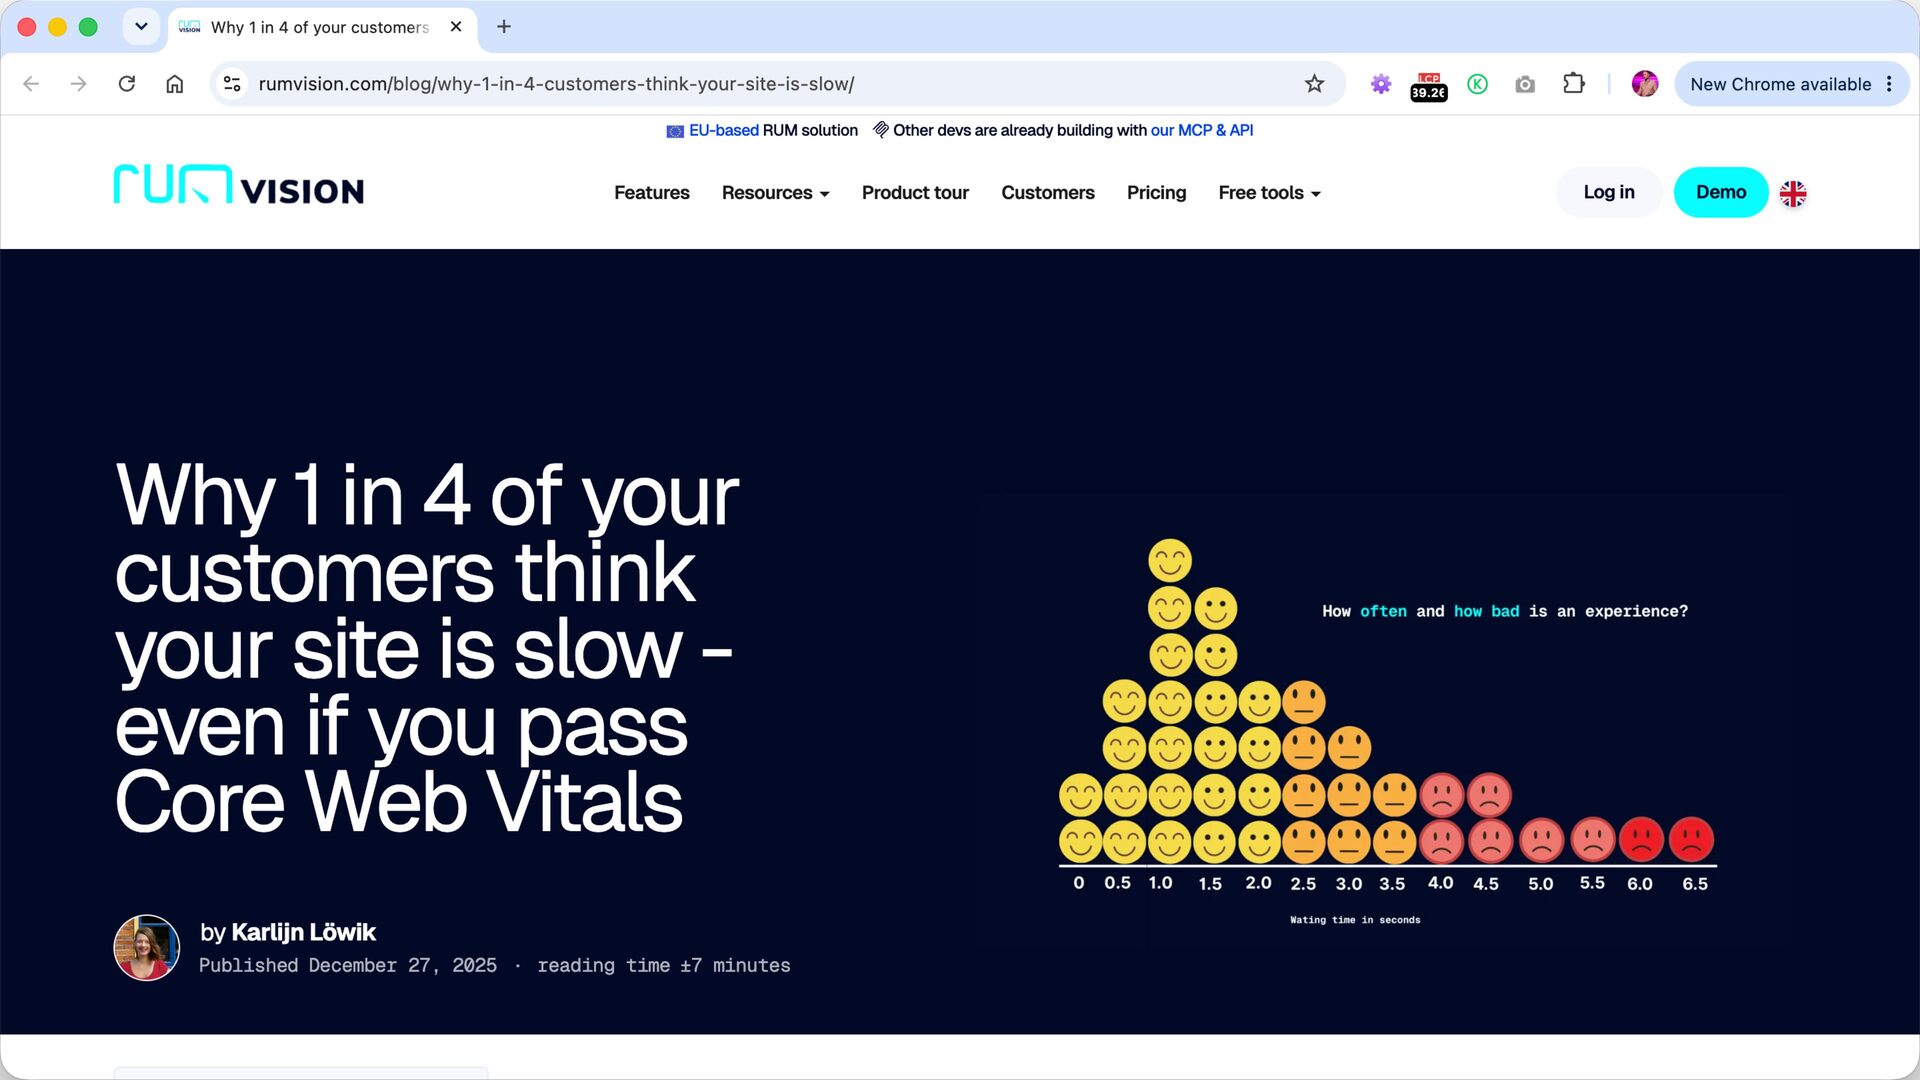
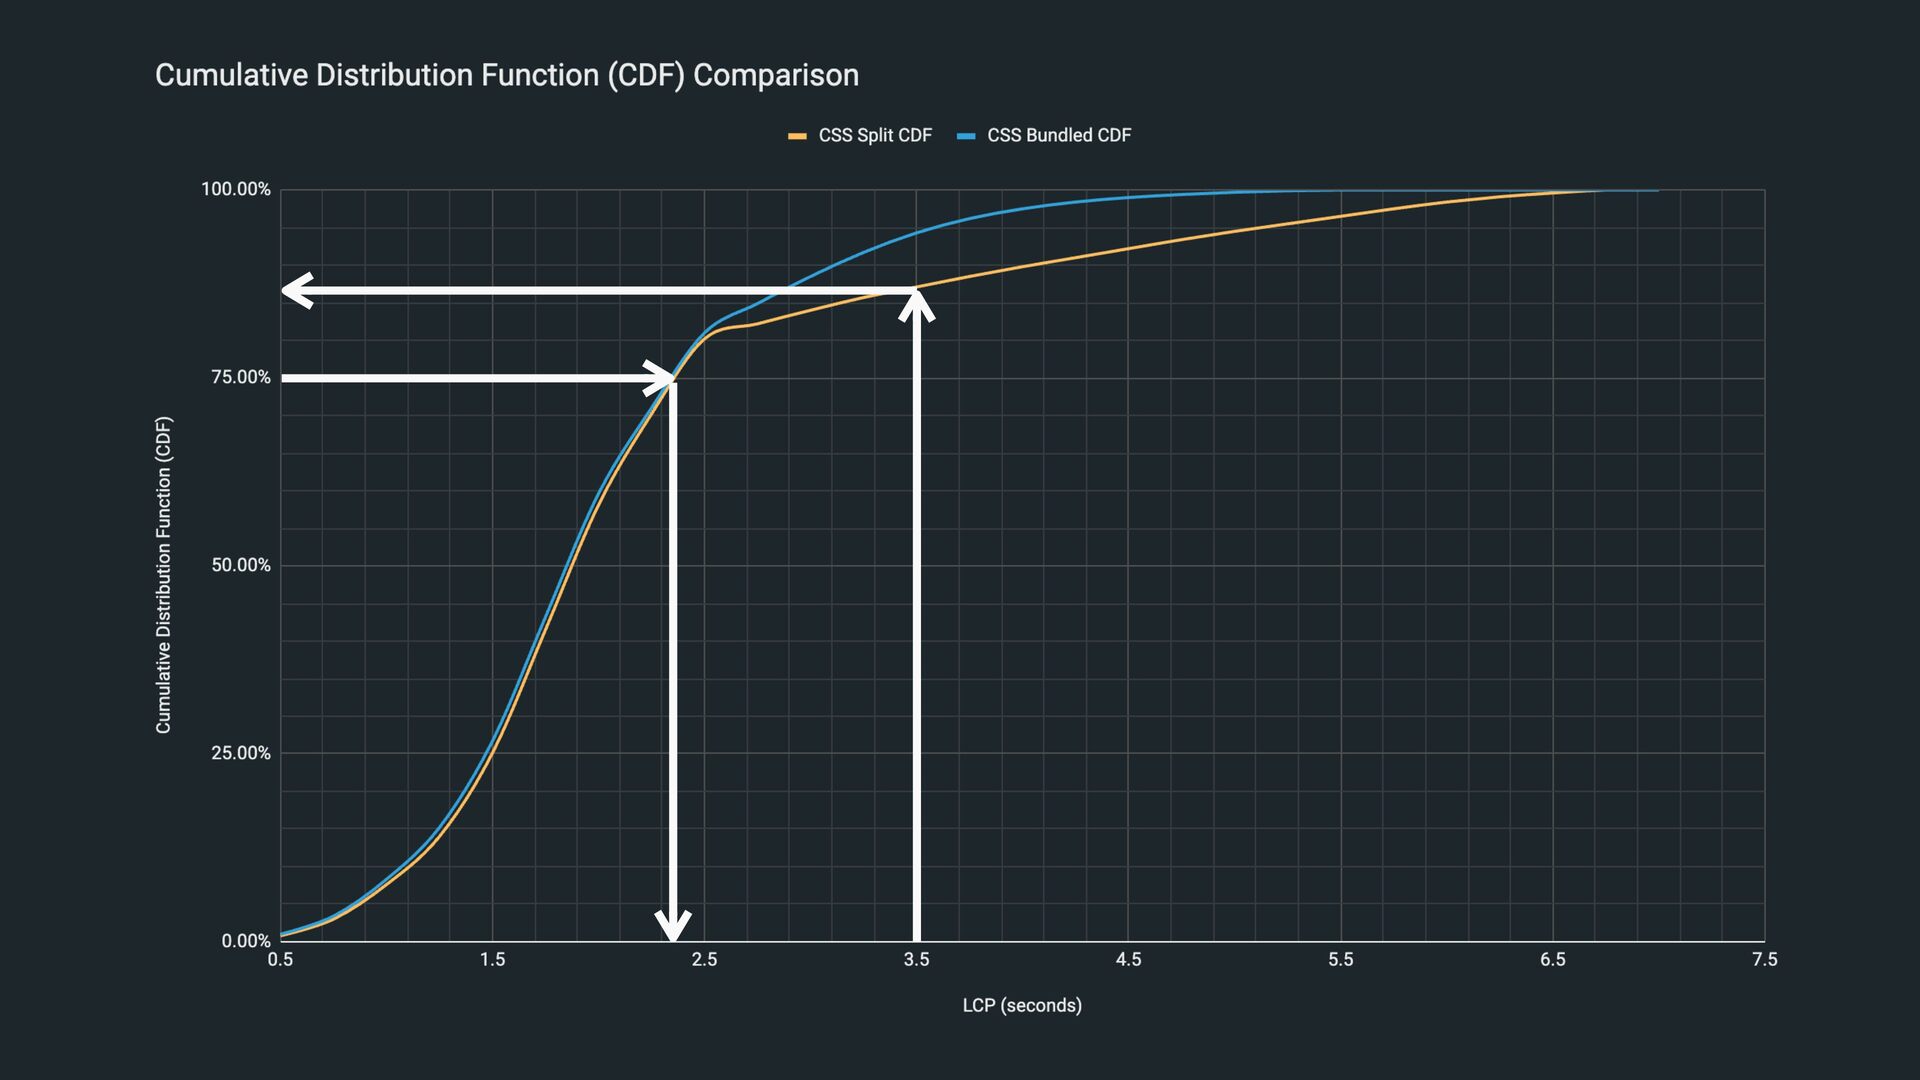
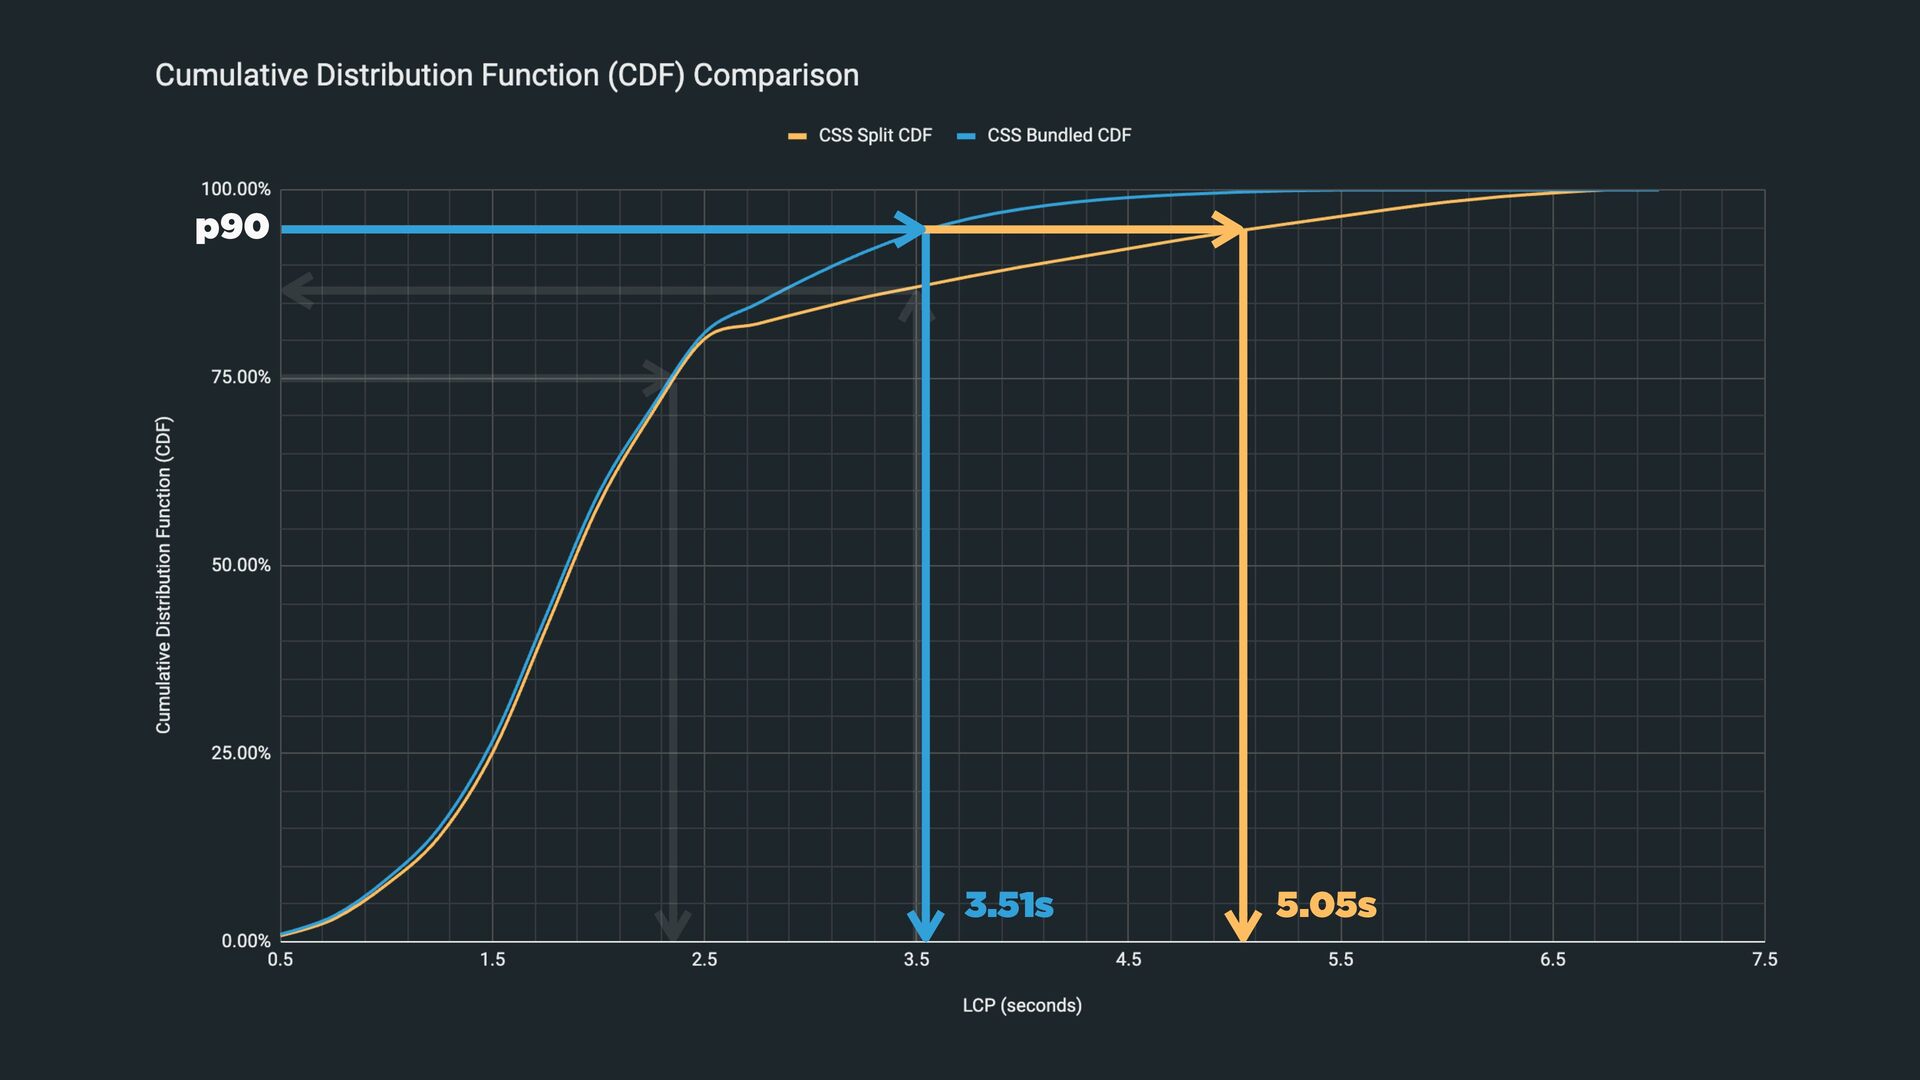
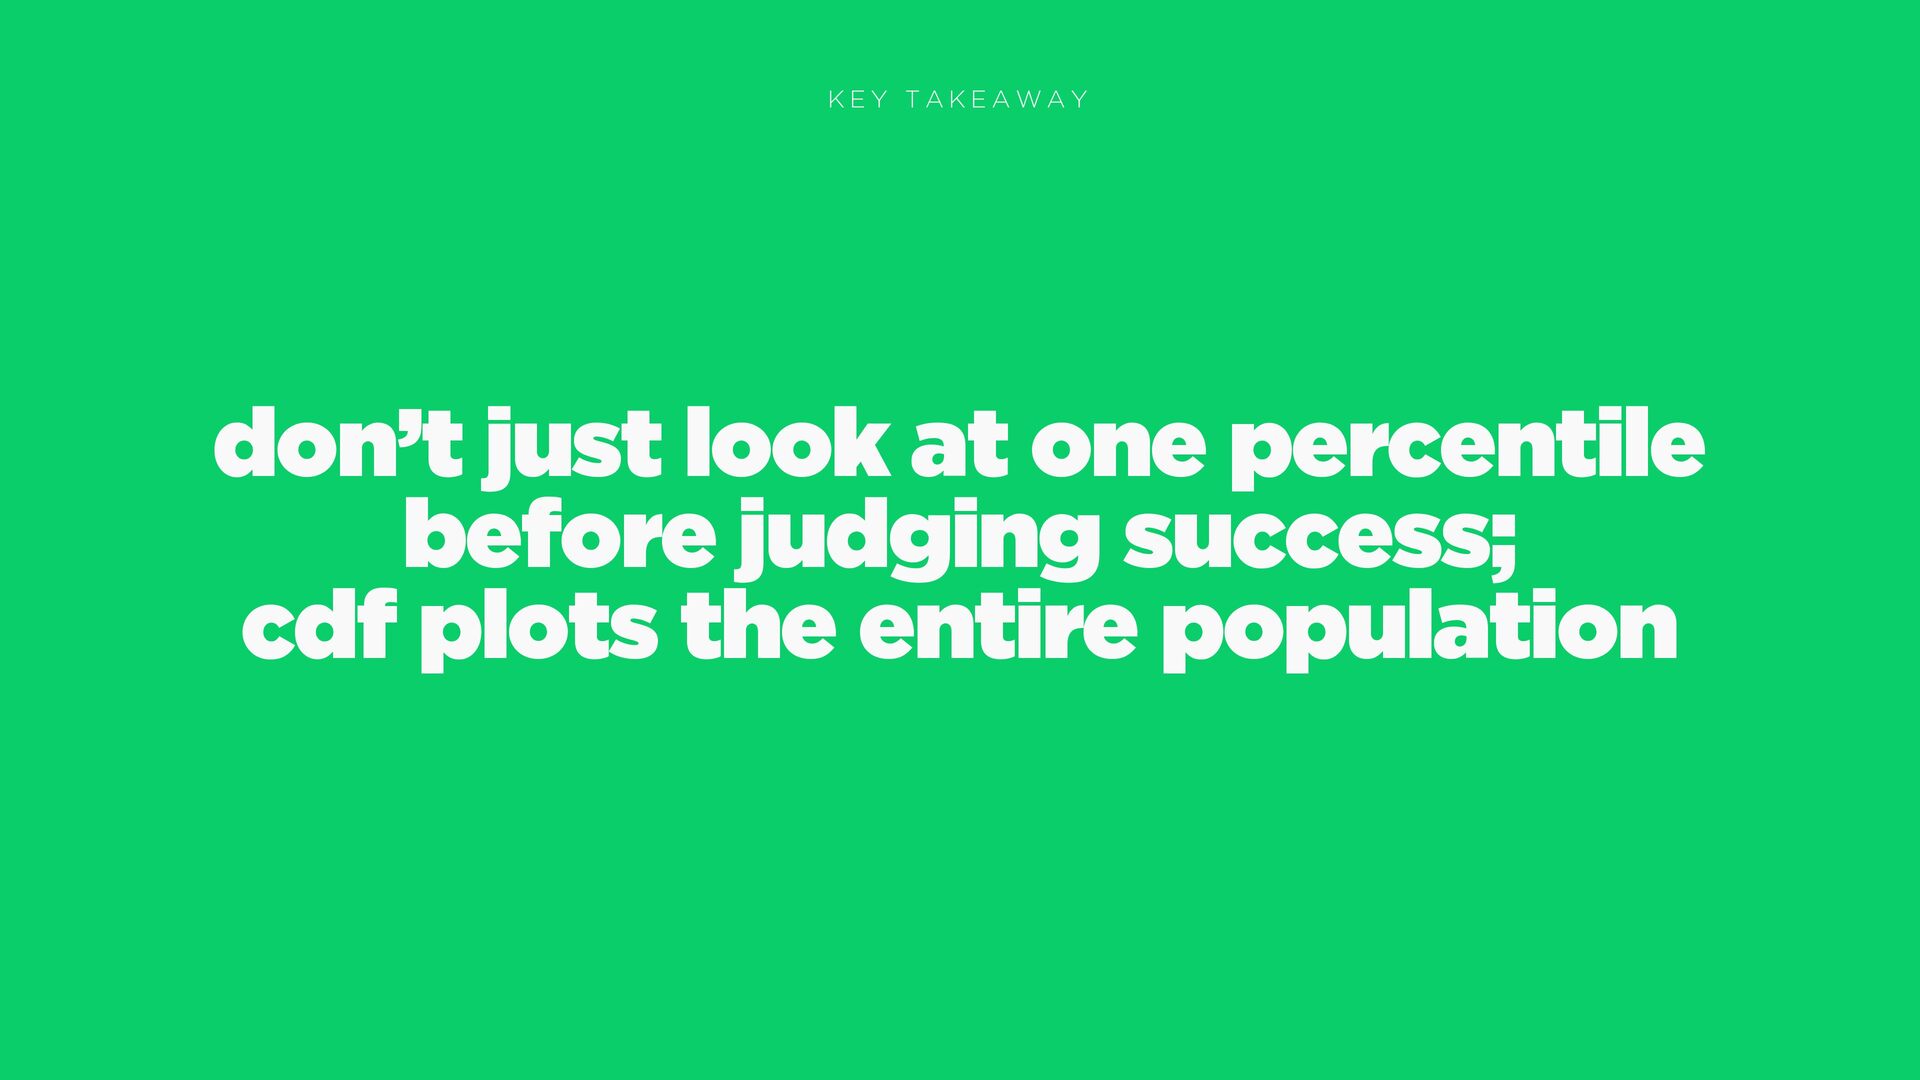
  6. KEY TAKEAWAY don’t just look at one percentile before judging

    success; cdf plots the entire population
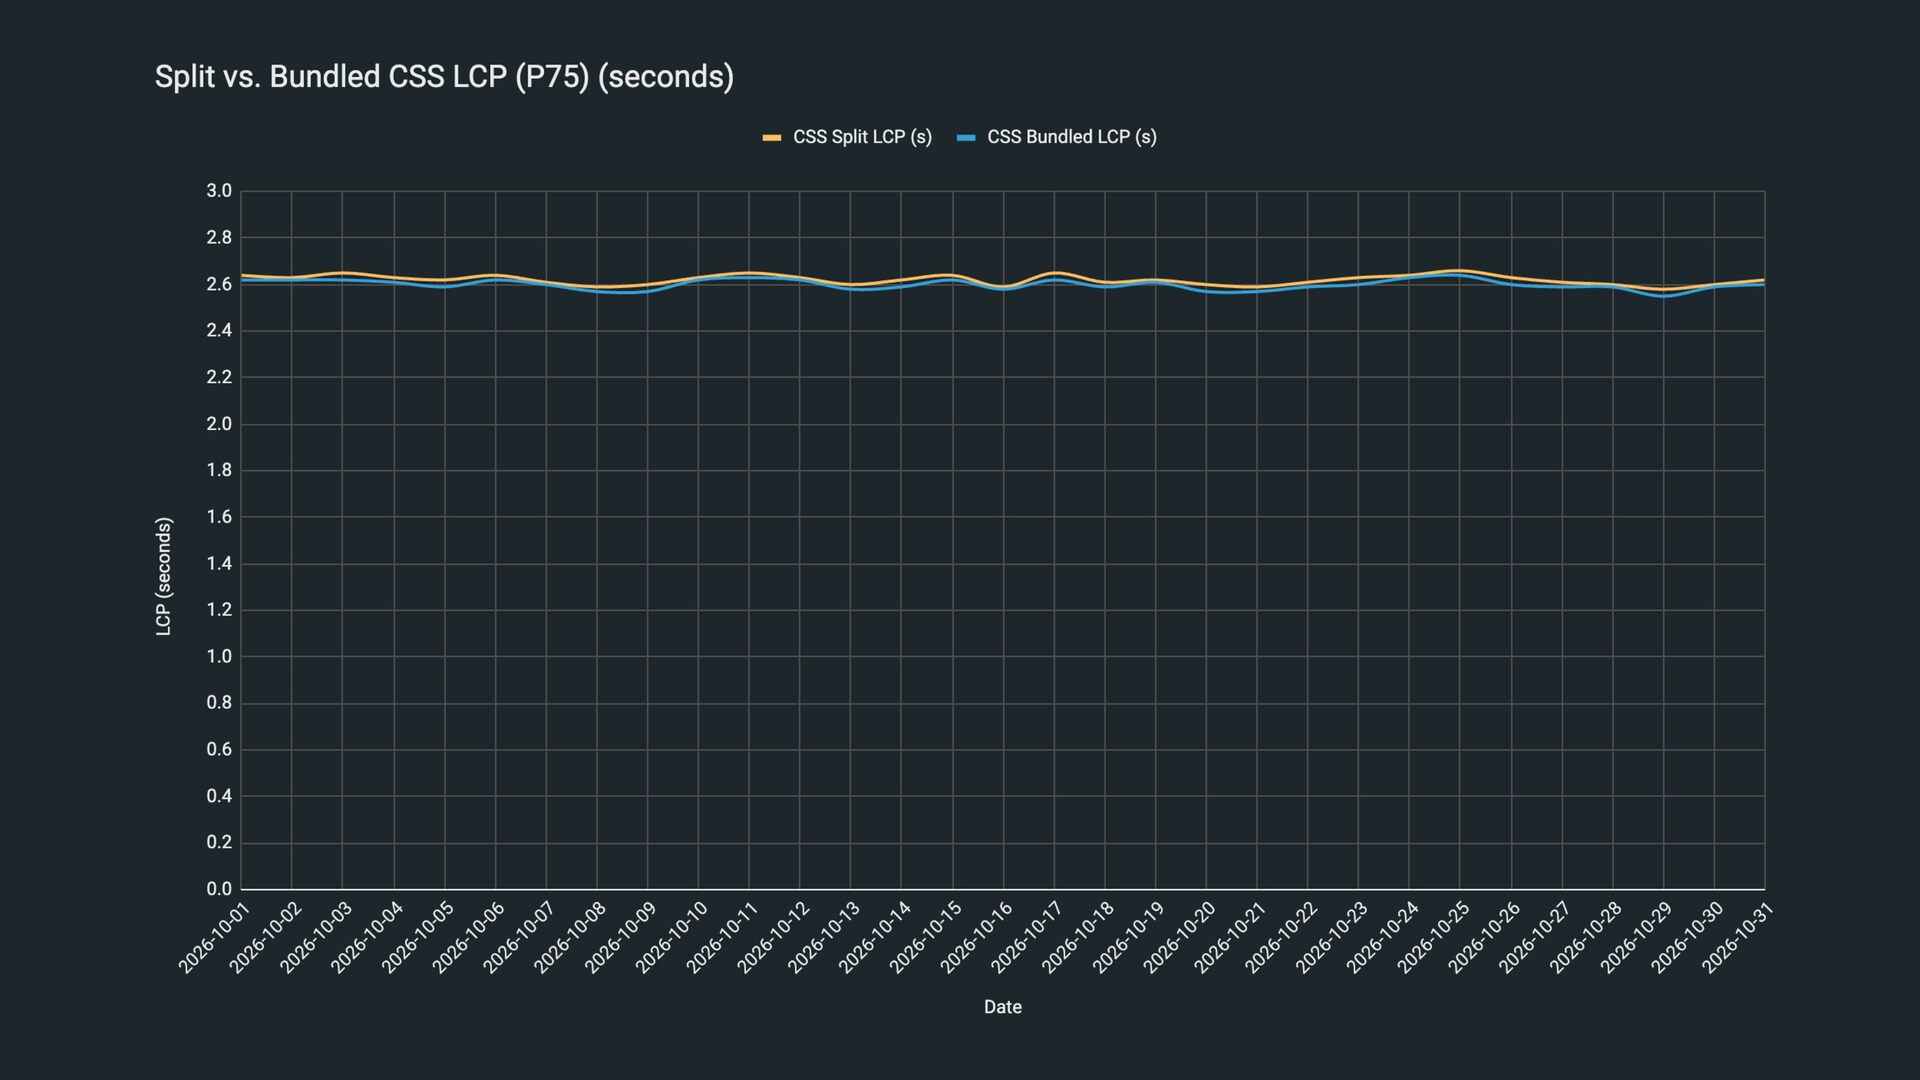
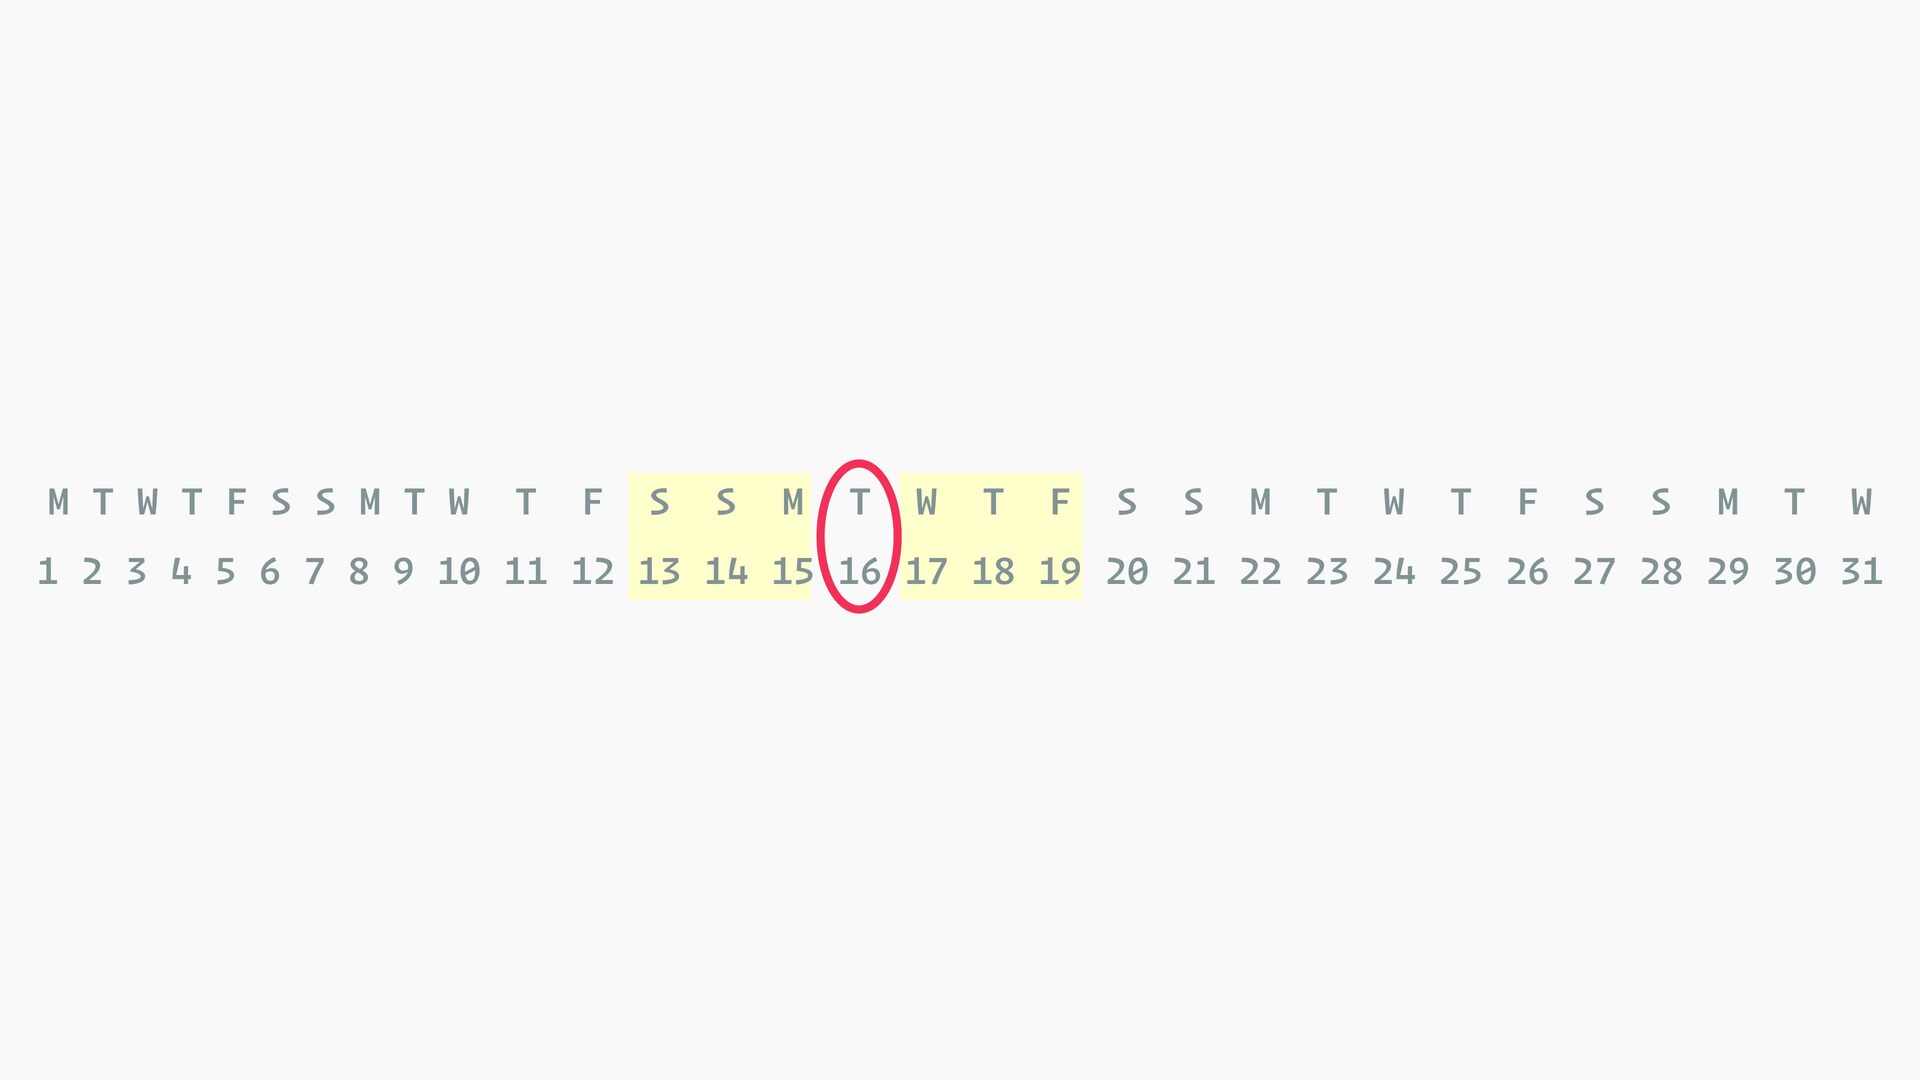
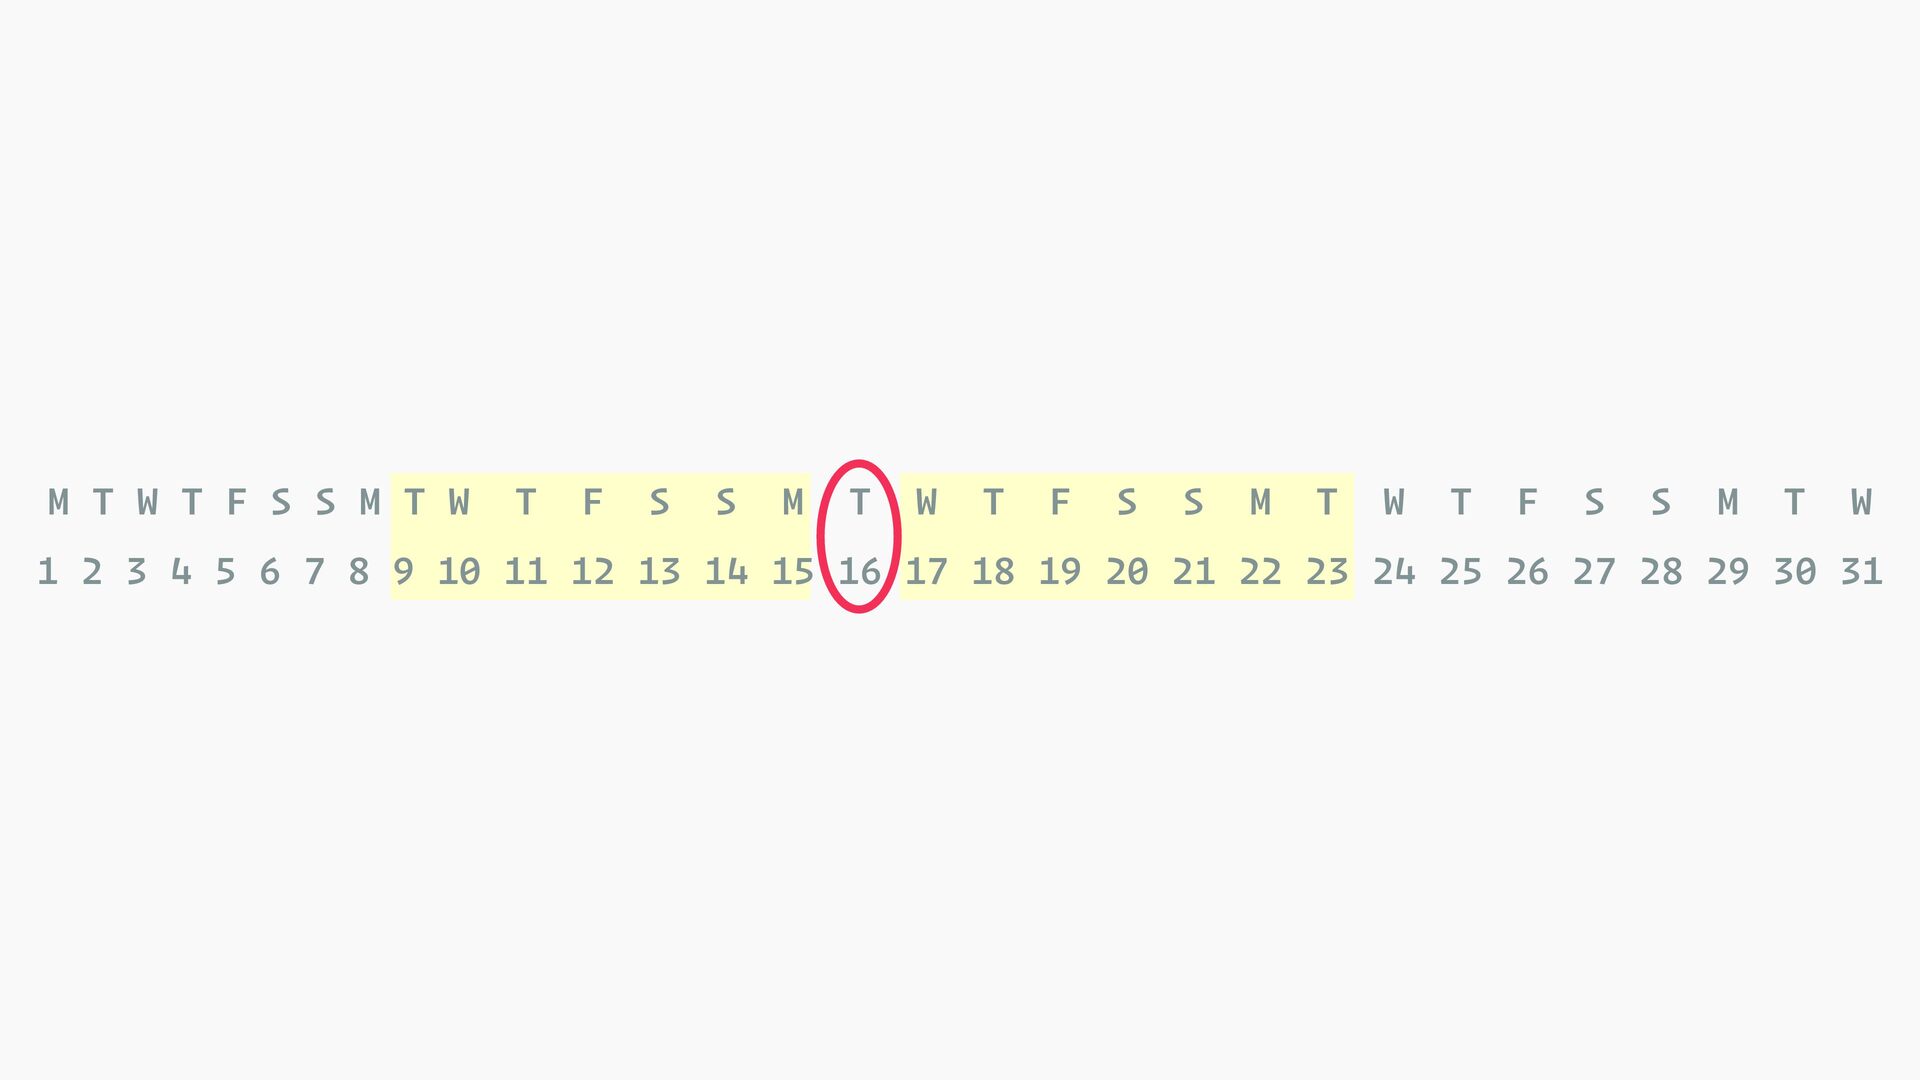
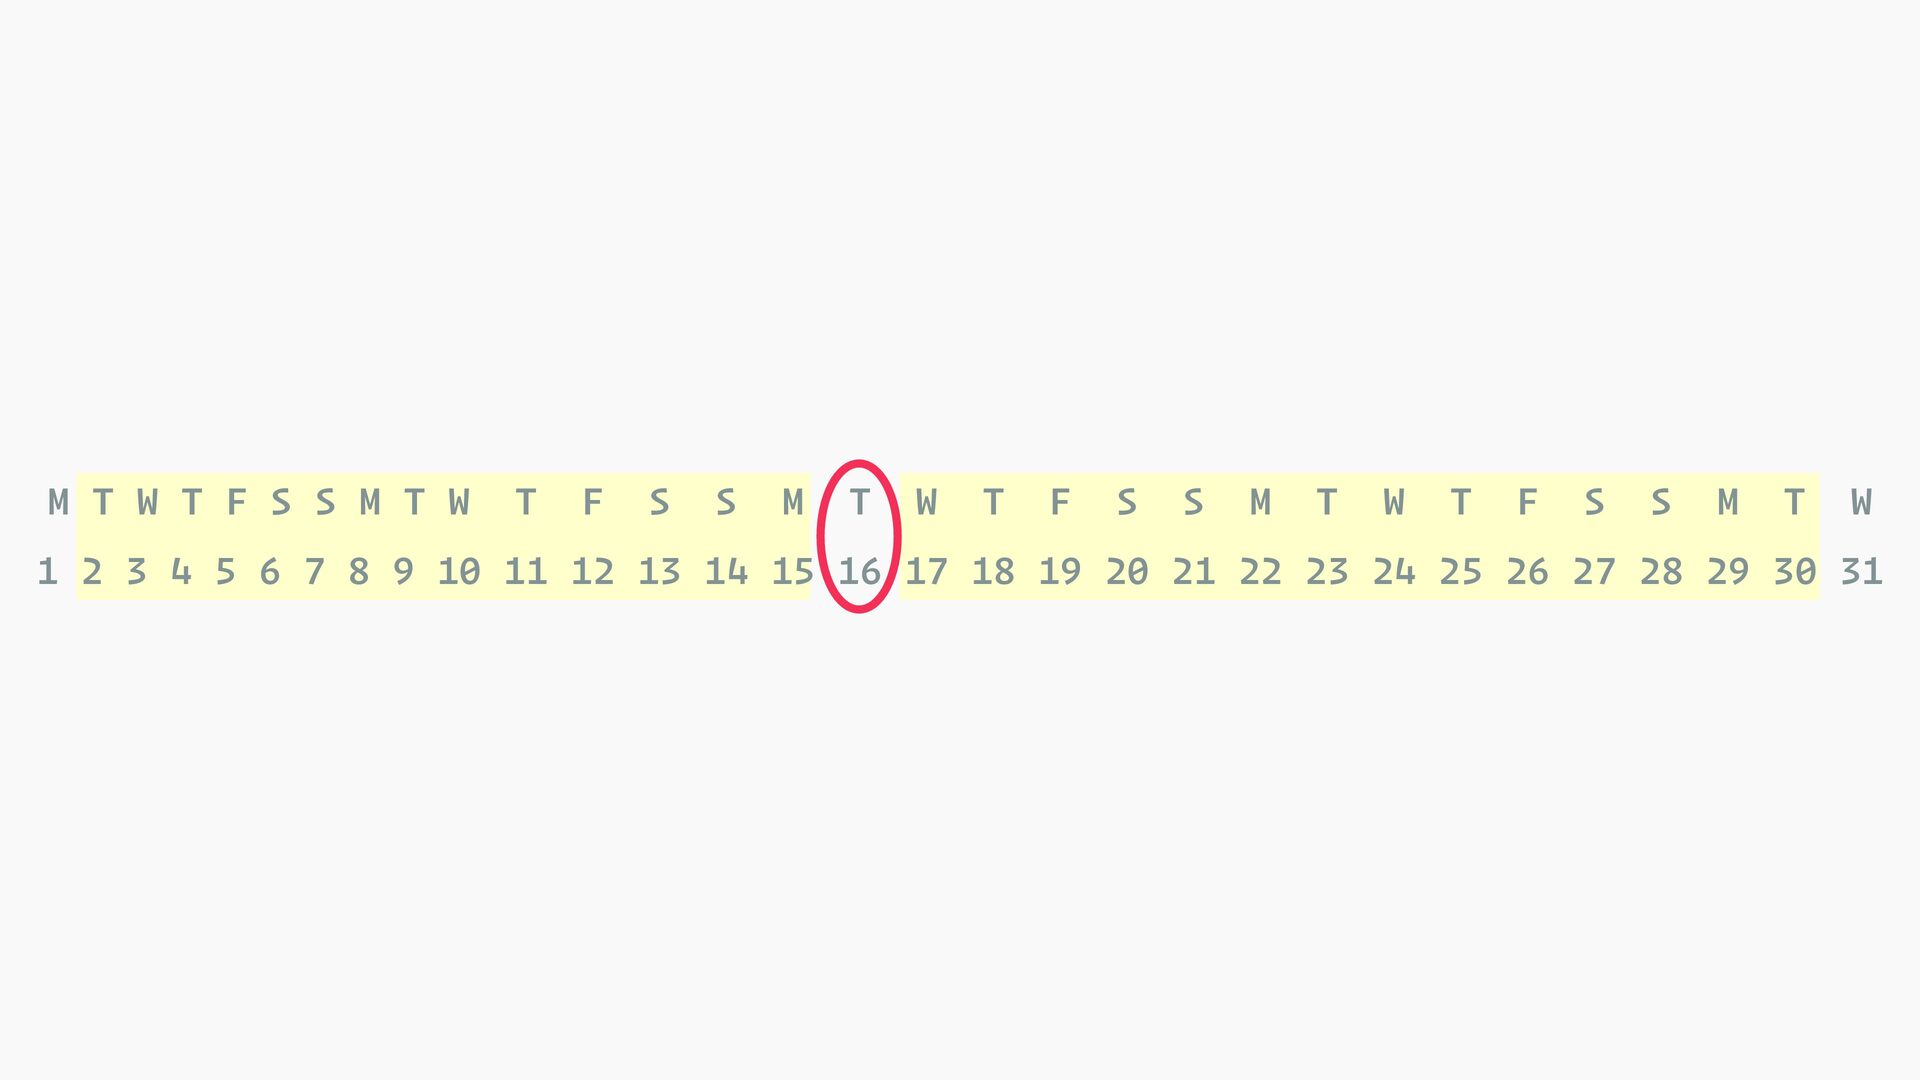
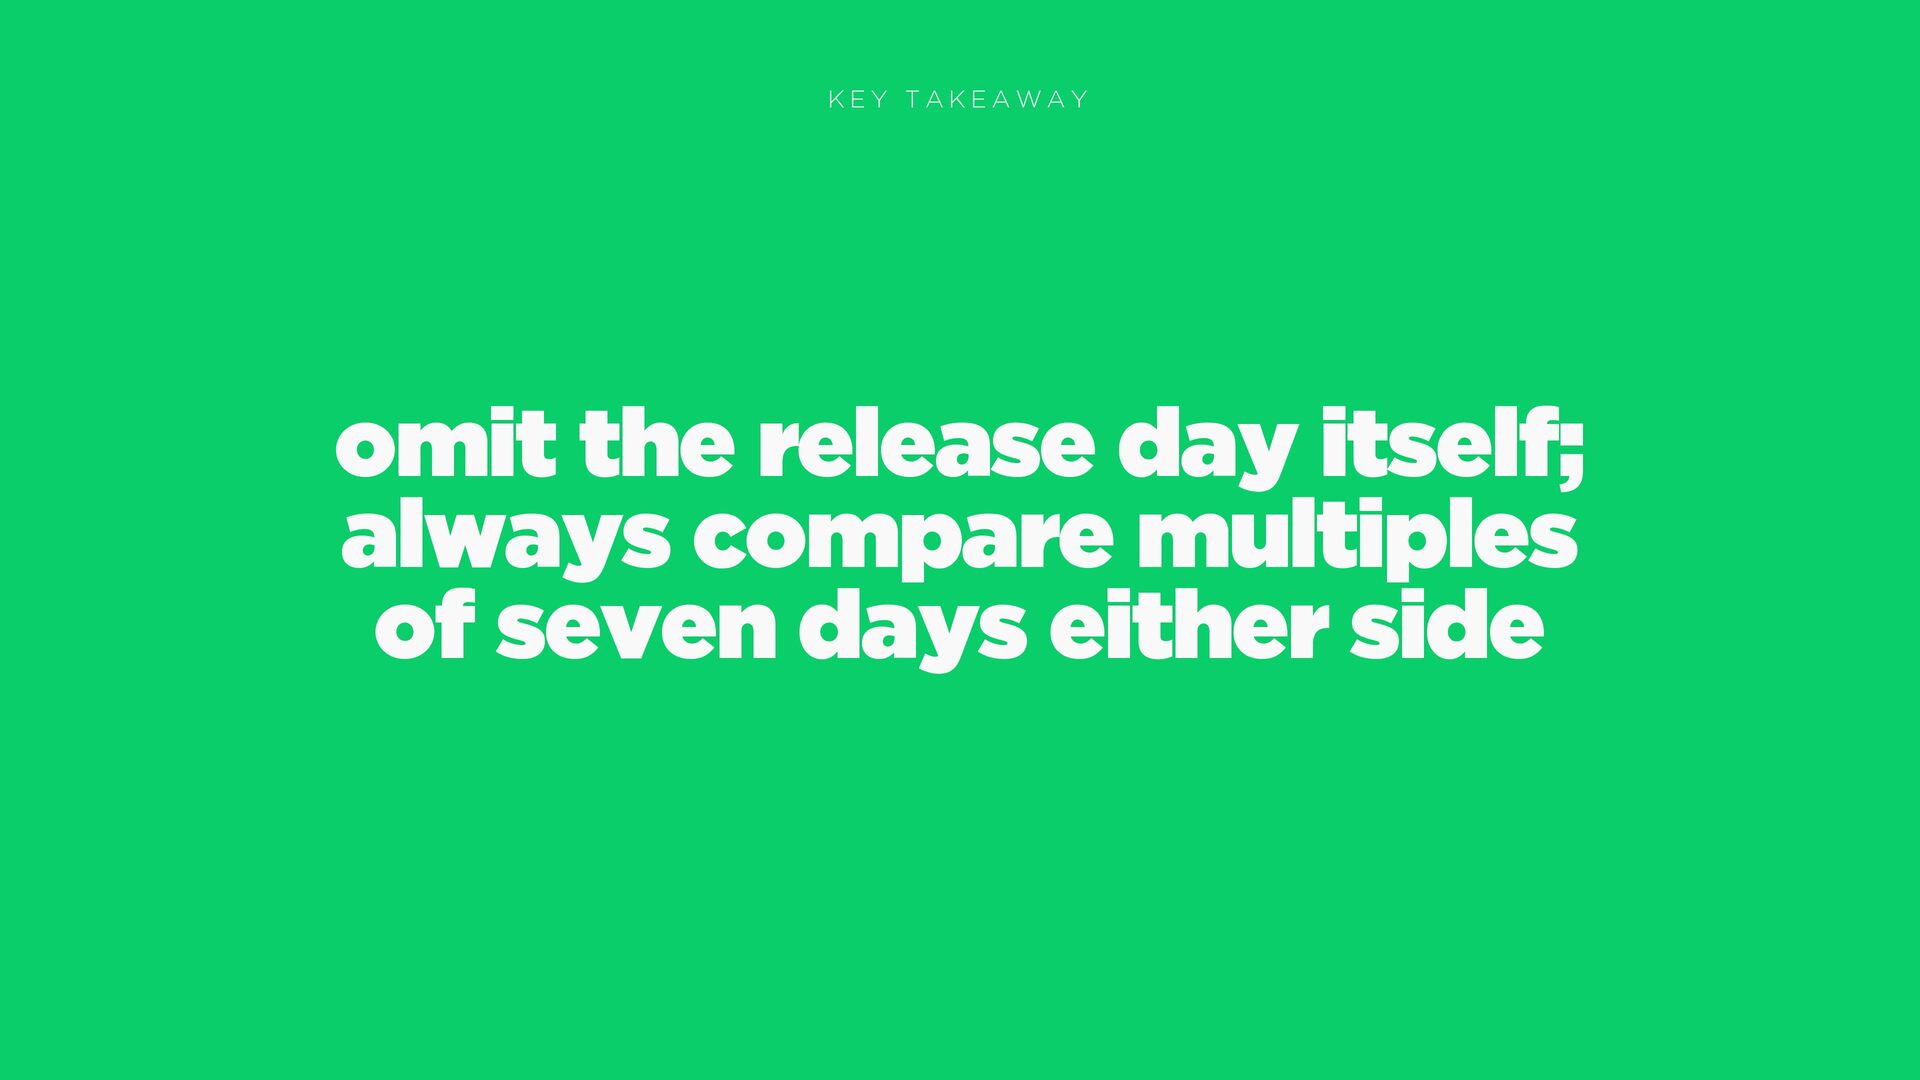
  7. when comparing a before and after, always compare a multiple

    of seven days and omit the day of the change itself
  8. M T W T F S S M T W

    T F S S M T W T F S S M T W T F S S M T W 1 2 3 4 5 6 7 8 9 10 11 12 13 14 15 16 17 18 19 20 21 22 23 24 25 26 27 28 29 30 31
  9. M T W T F S S M T W

    T F S S M T W T F S S M T W T F S S M T W 1 2 3 4 5 6 7 8 9 10 11 12 13 14 15 16 17 18 19 20 21 22 23 24 25 26 27 28 29 30 31
  10. M T W T F S S M T W

    T F S S M T W T F S S M T W T F S S M T W 1 2 3 4 5 6 7 8 9 10 11 12 13 14 15 16 17 18 19 20 21 22 23 24 25 26 27 28 29 30 31
  11. ?

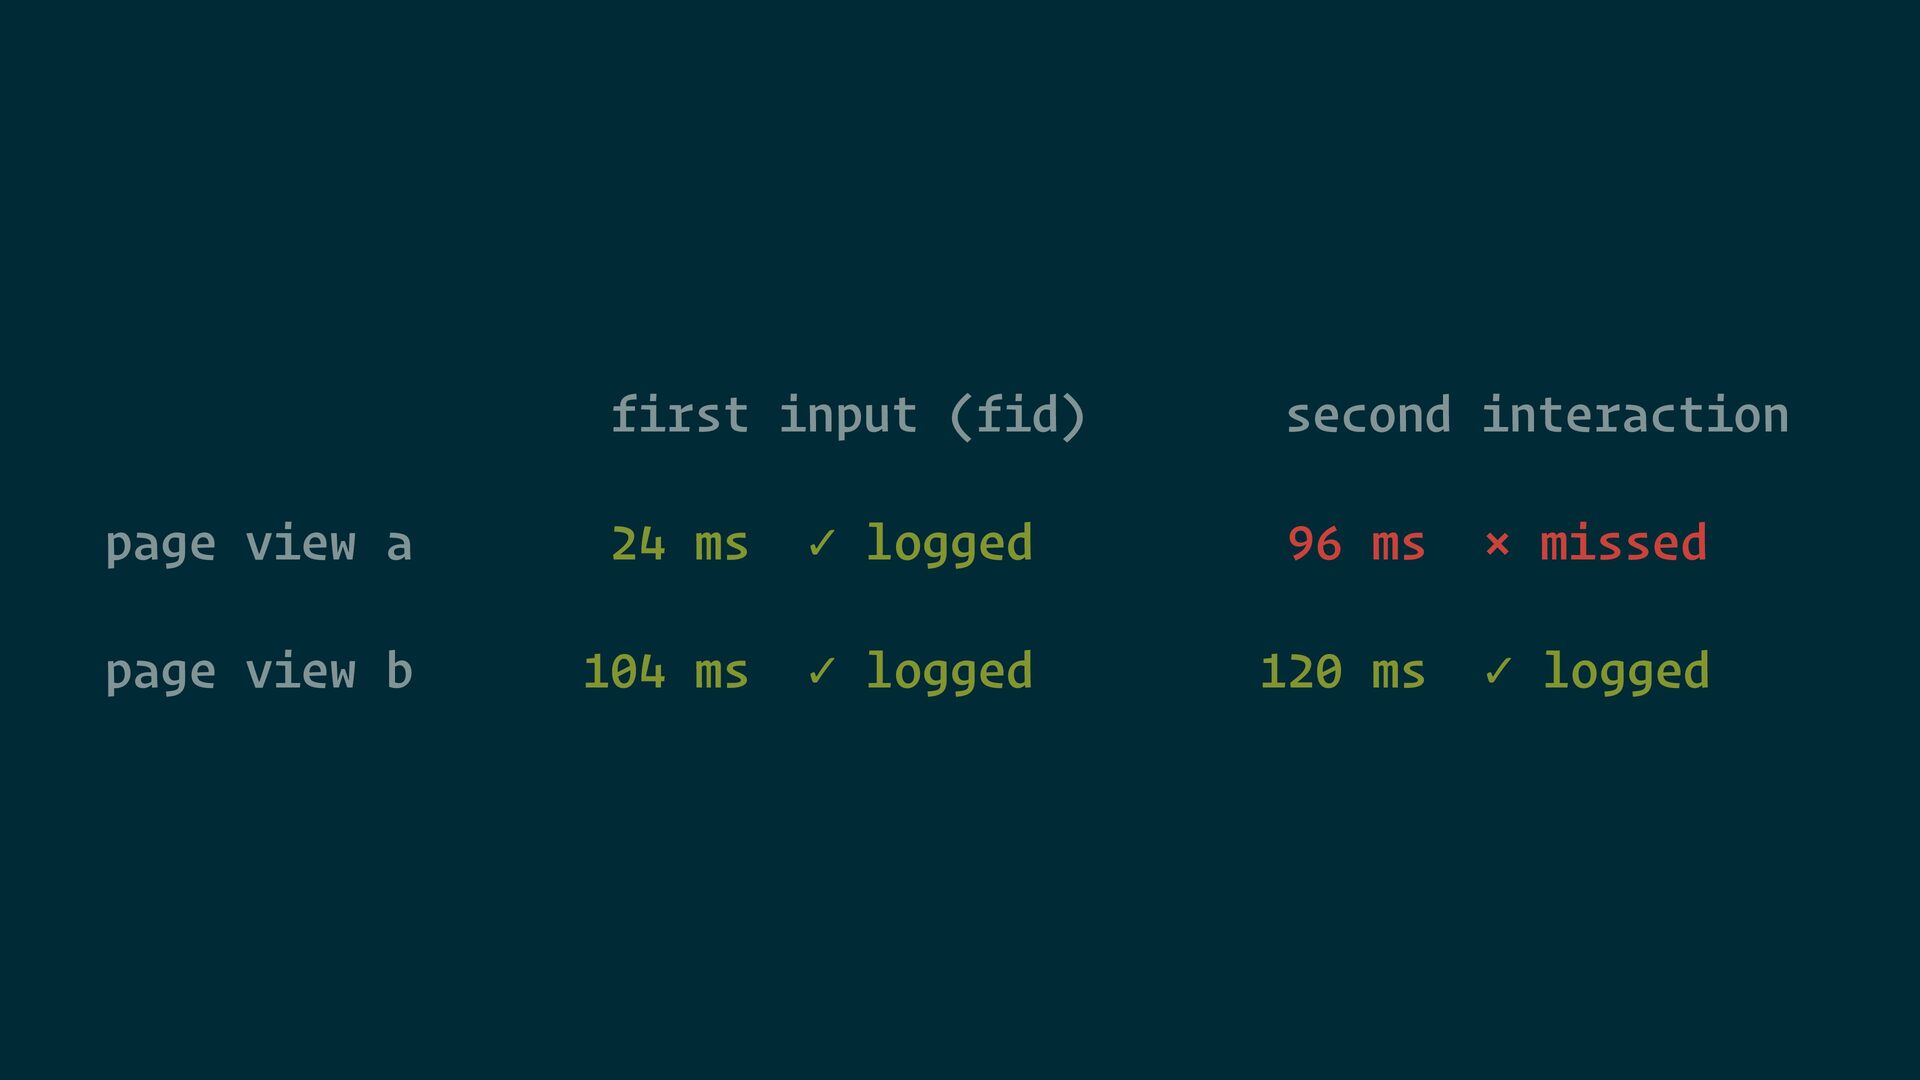
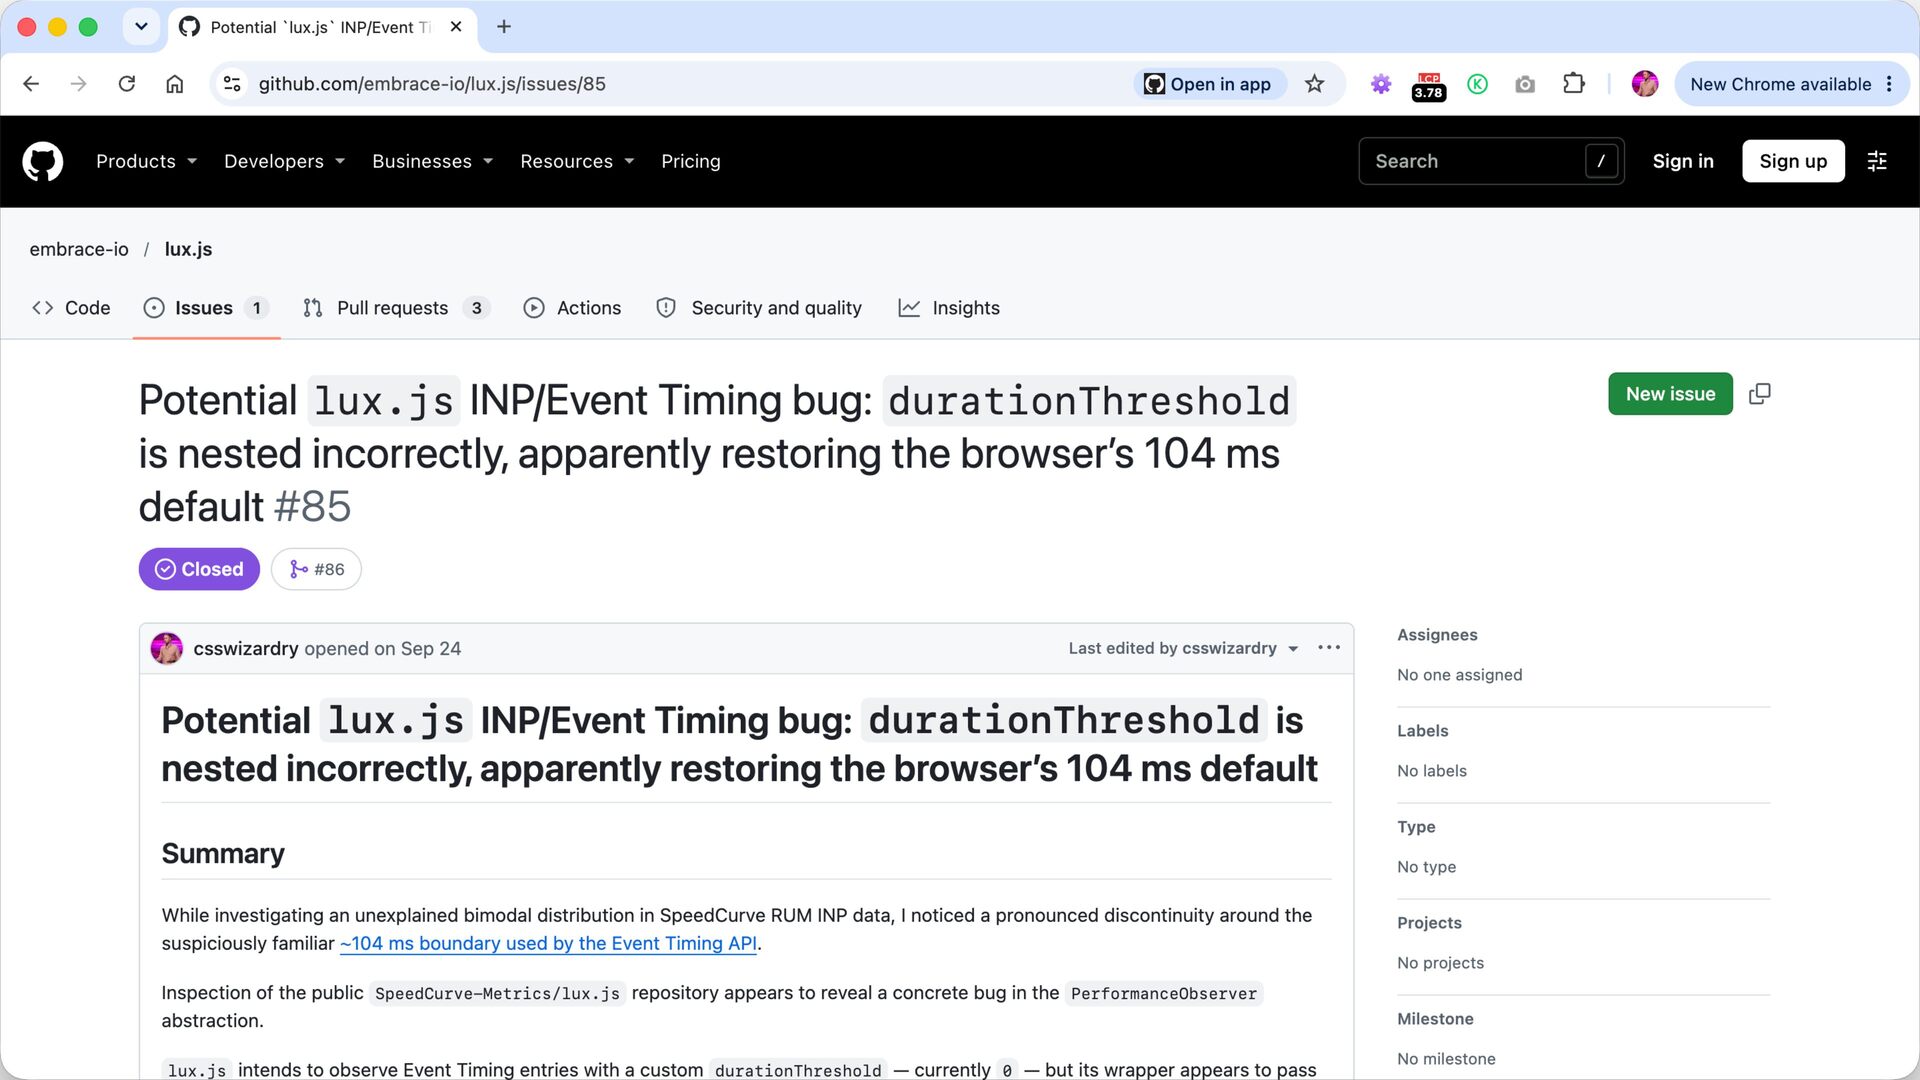
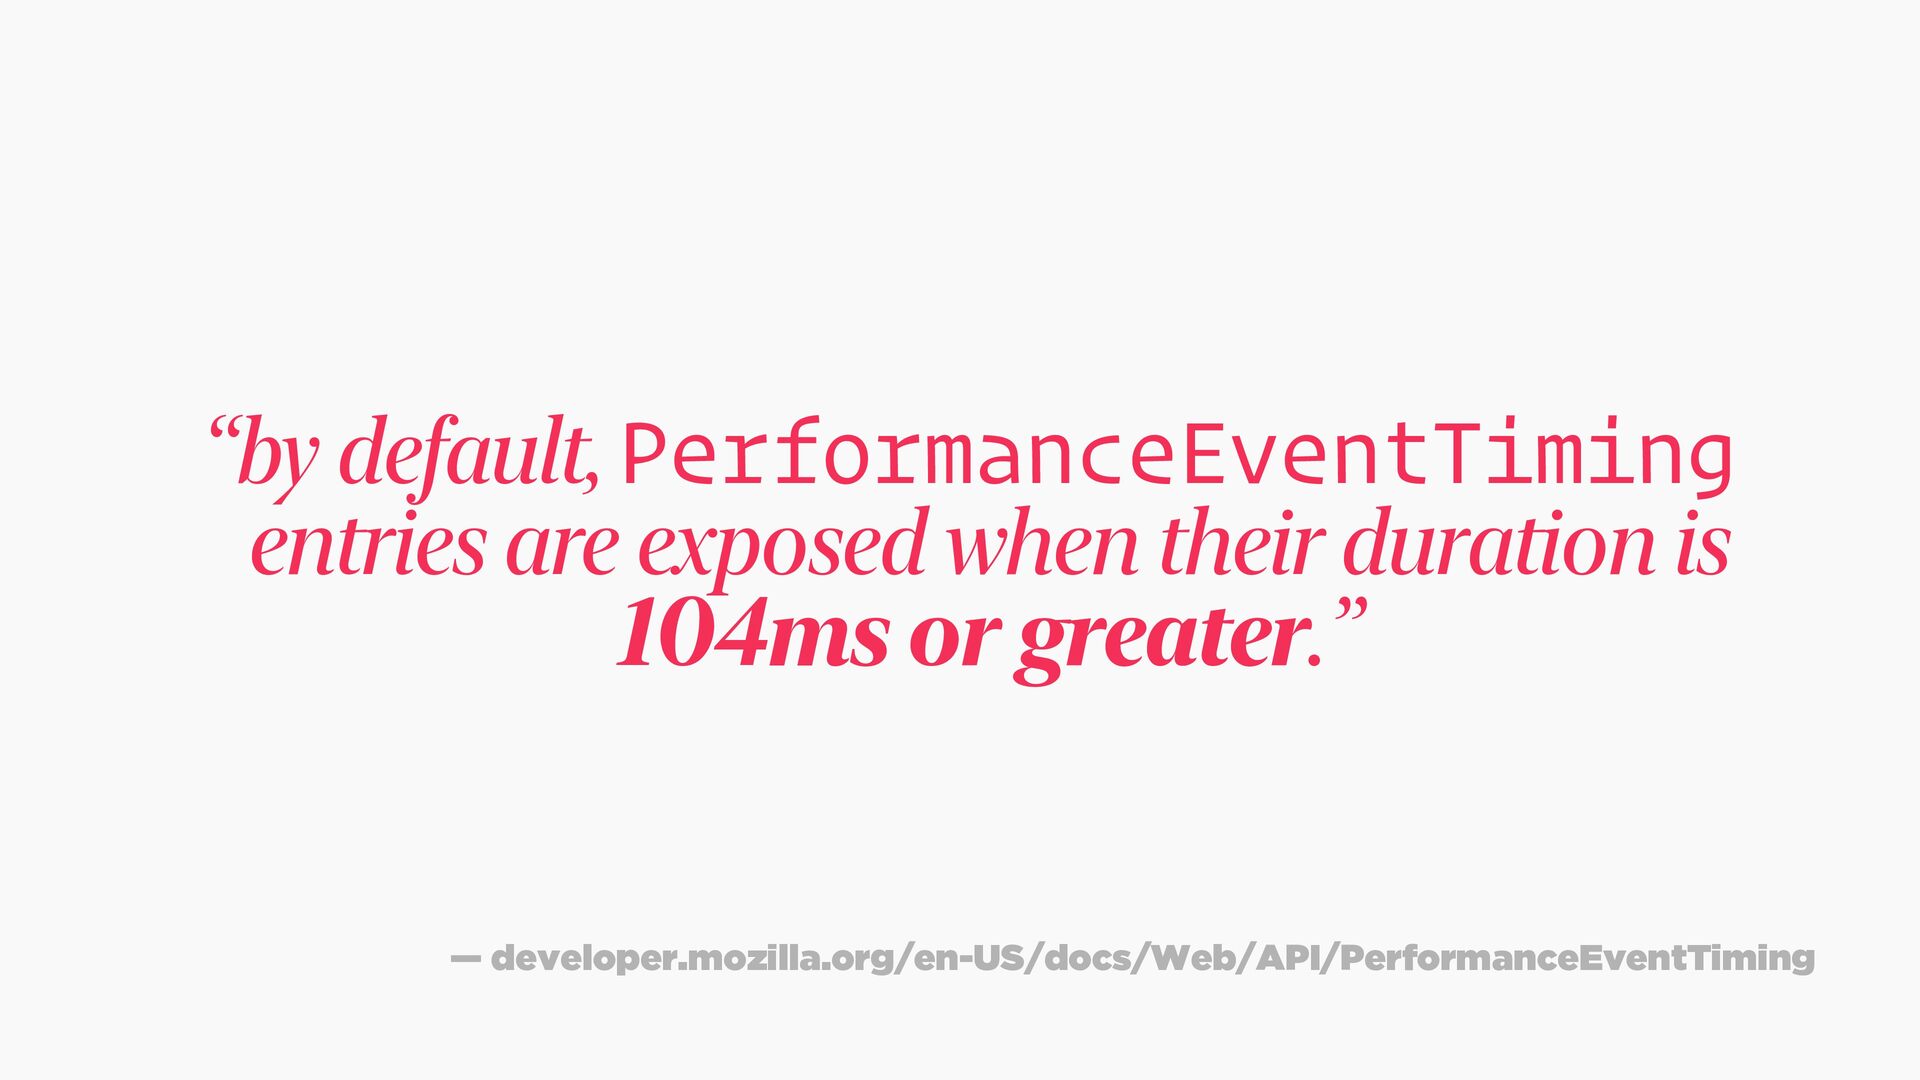
  12. “by default, PerformanceEventTiming entries are exposed when their duration is

    104ms or greater.” — developer.mozilla.org/en-US/docs/Web/API/PerformanceEventTiming
  13. first input (fid) second interaction page view a 24 ms

    ✓ logged 96 ms × missed page view b 104 ms ✓ logged 120 ms ✓ logged
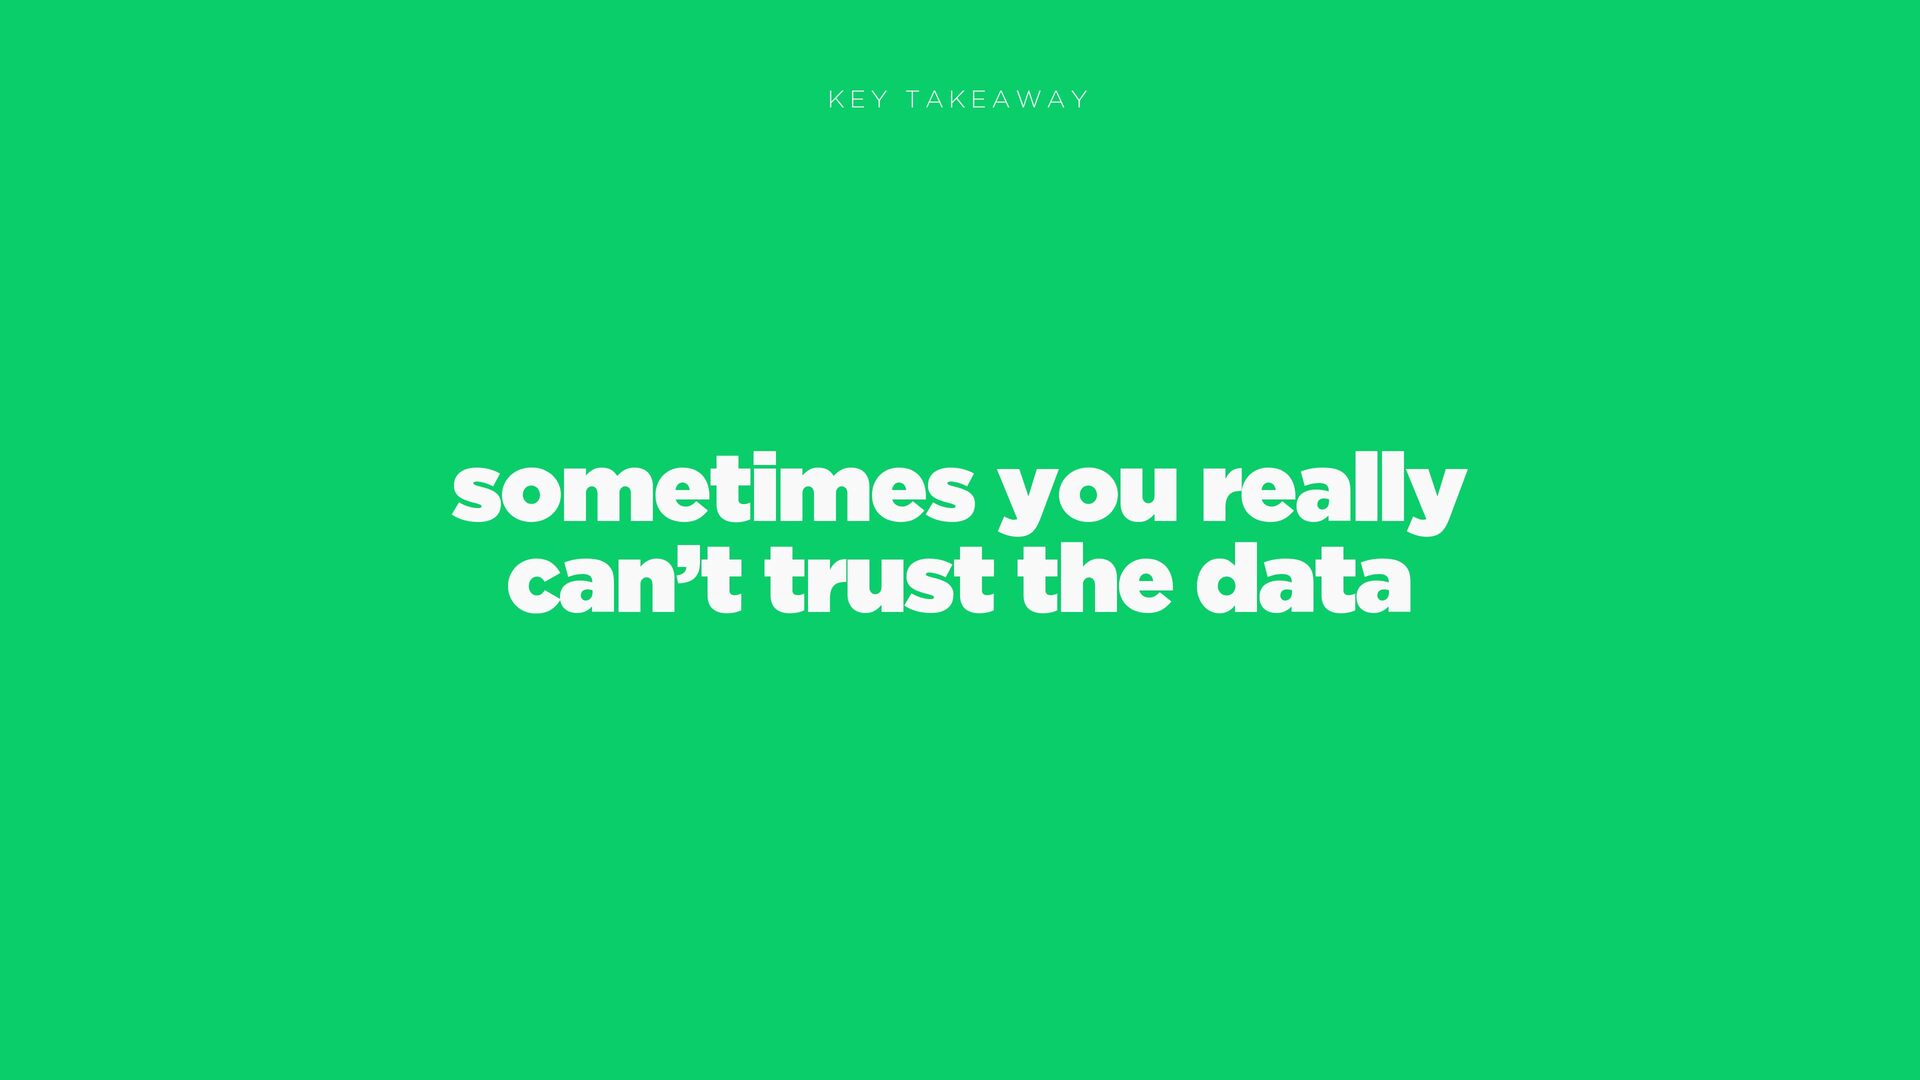
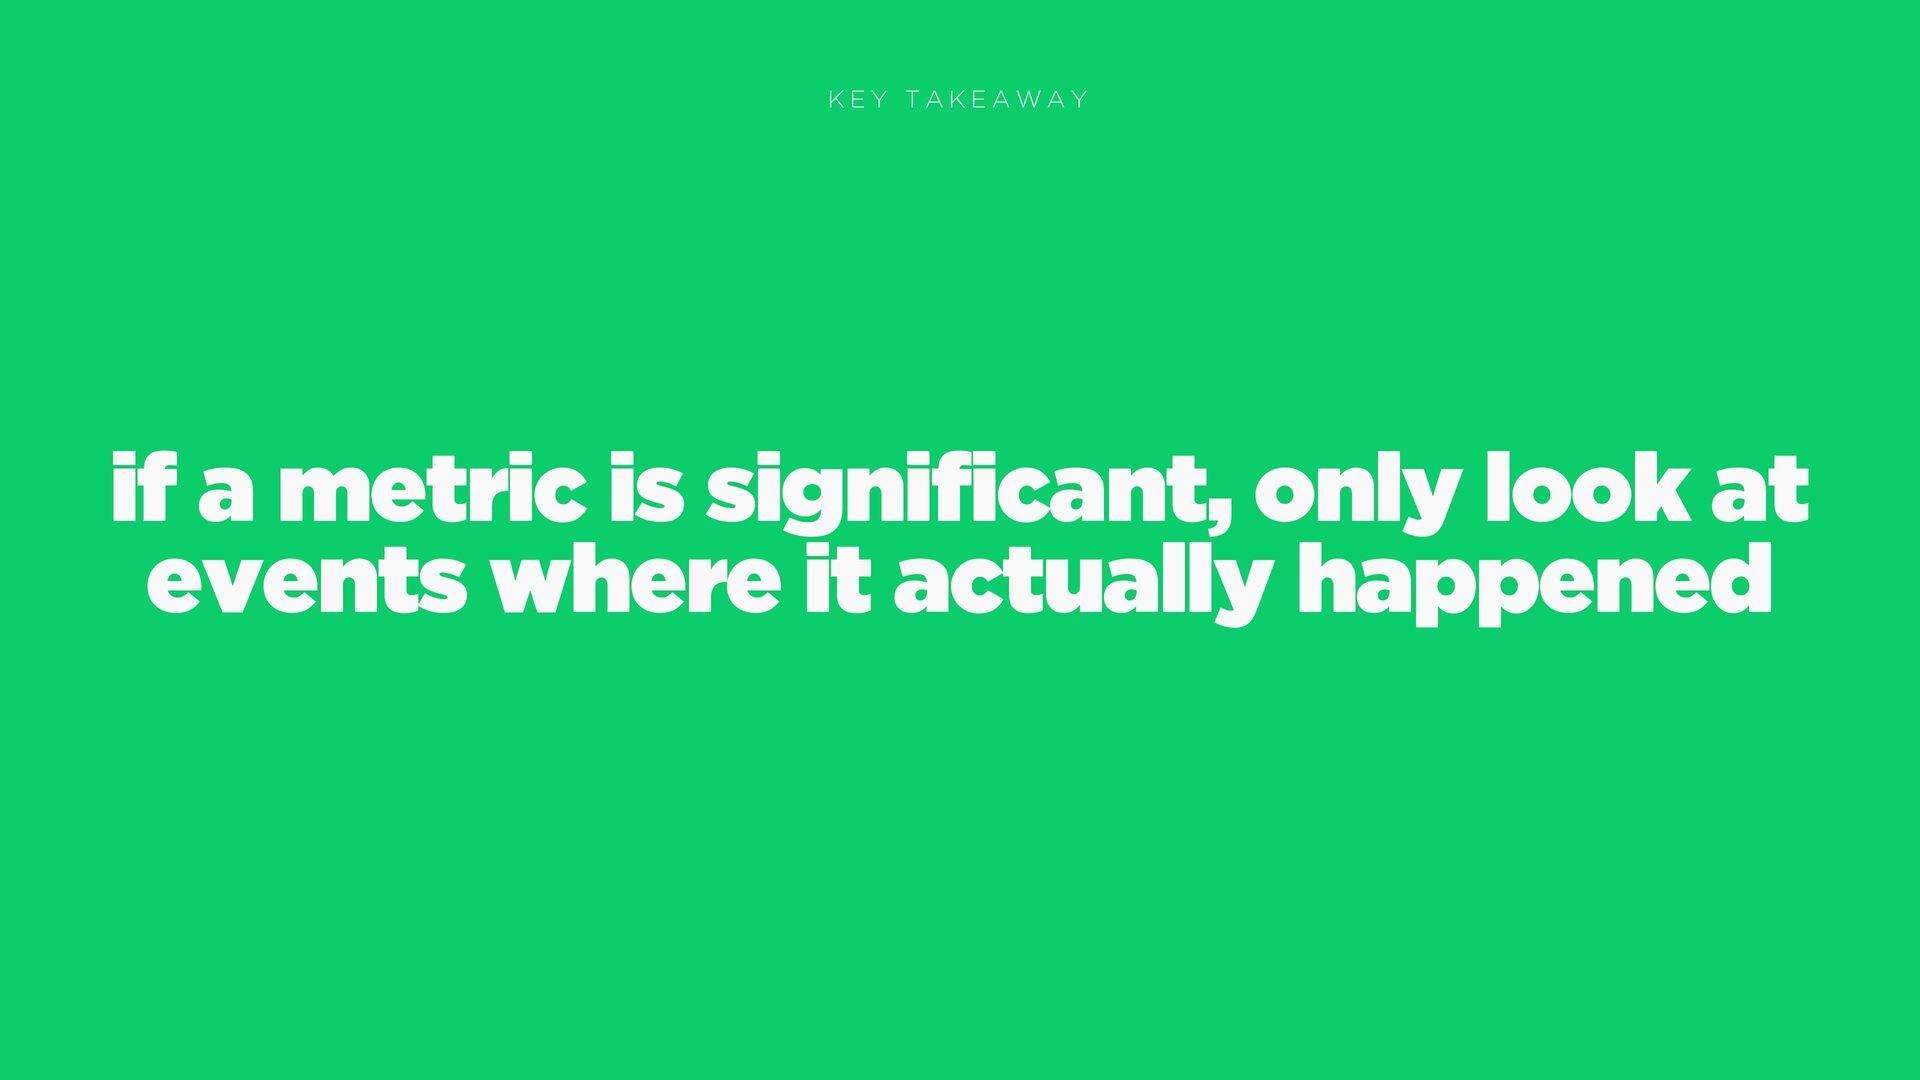
  14. KEY TAKEAWAY if a metric is significant, only look at

    events where it actually happened
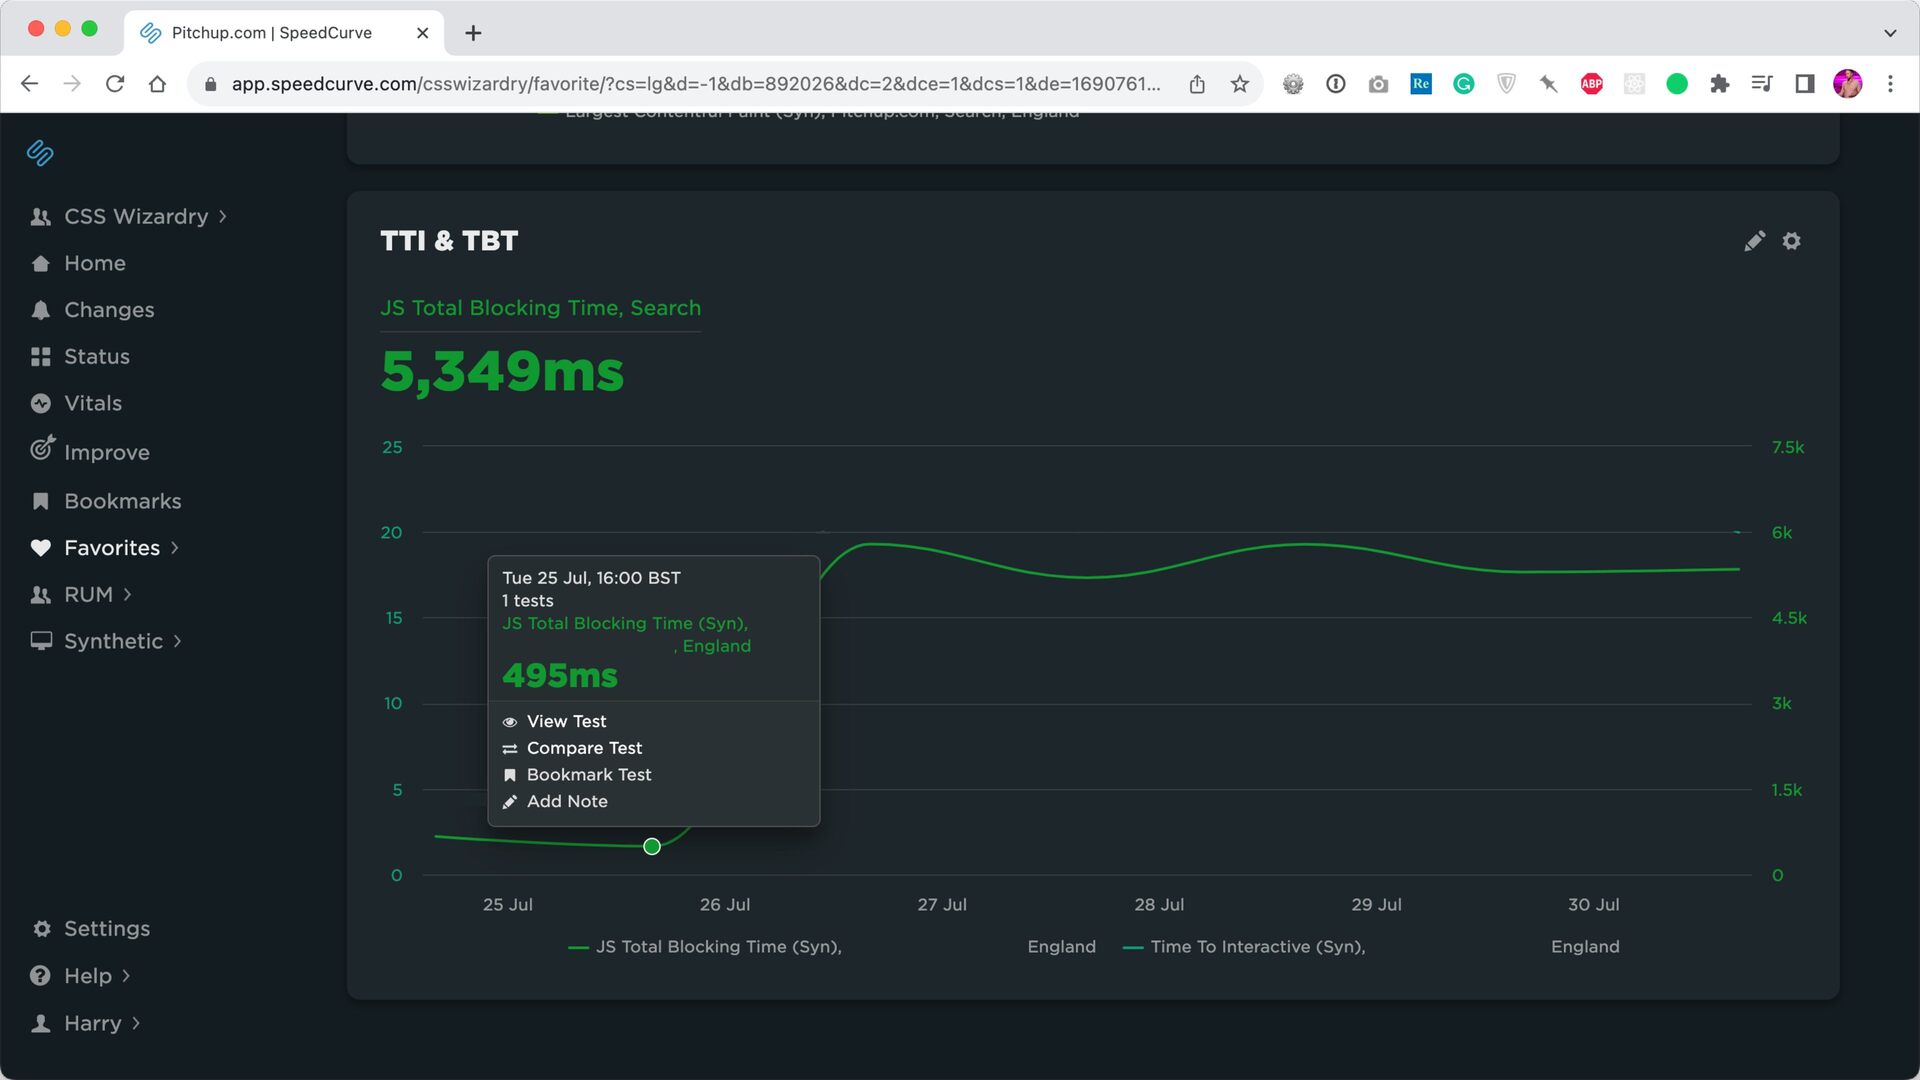
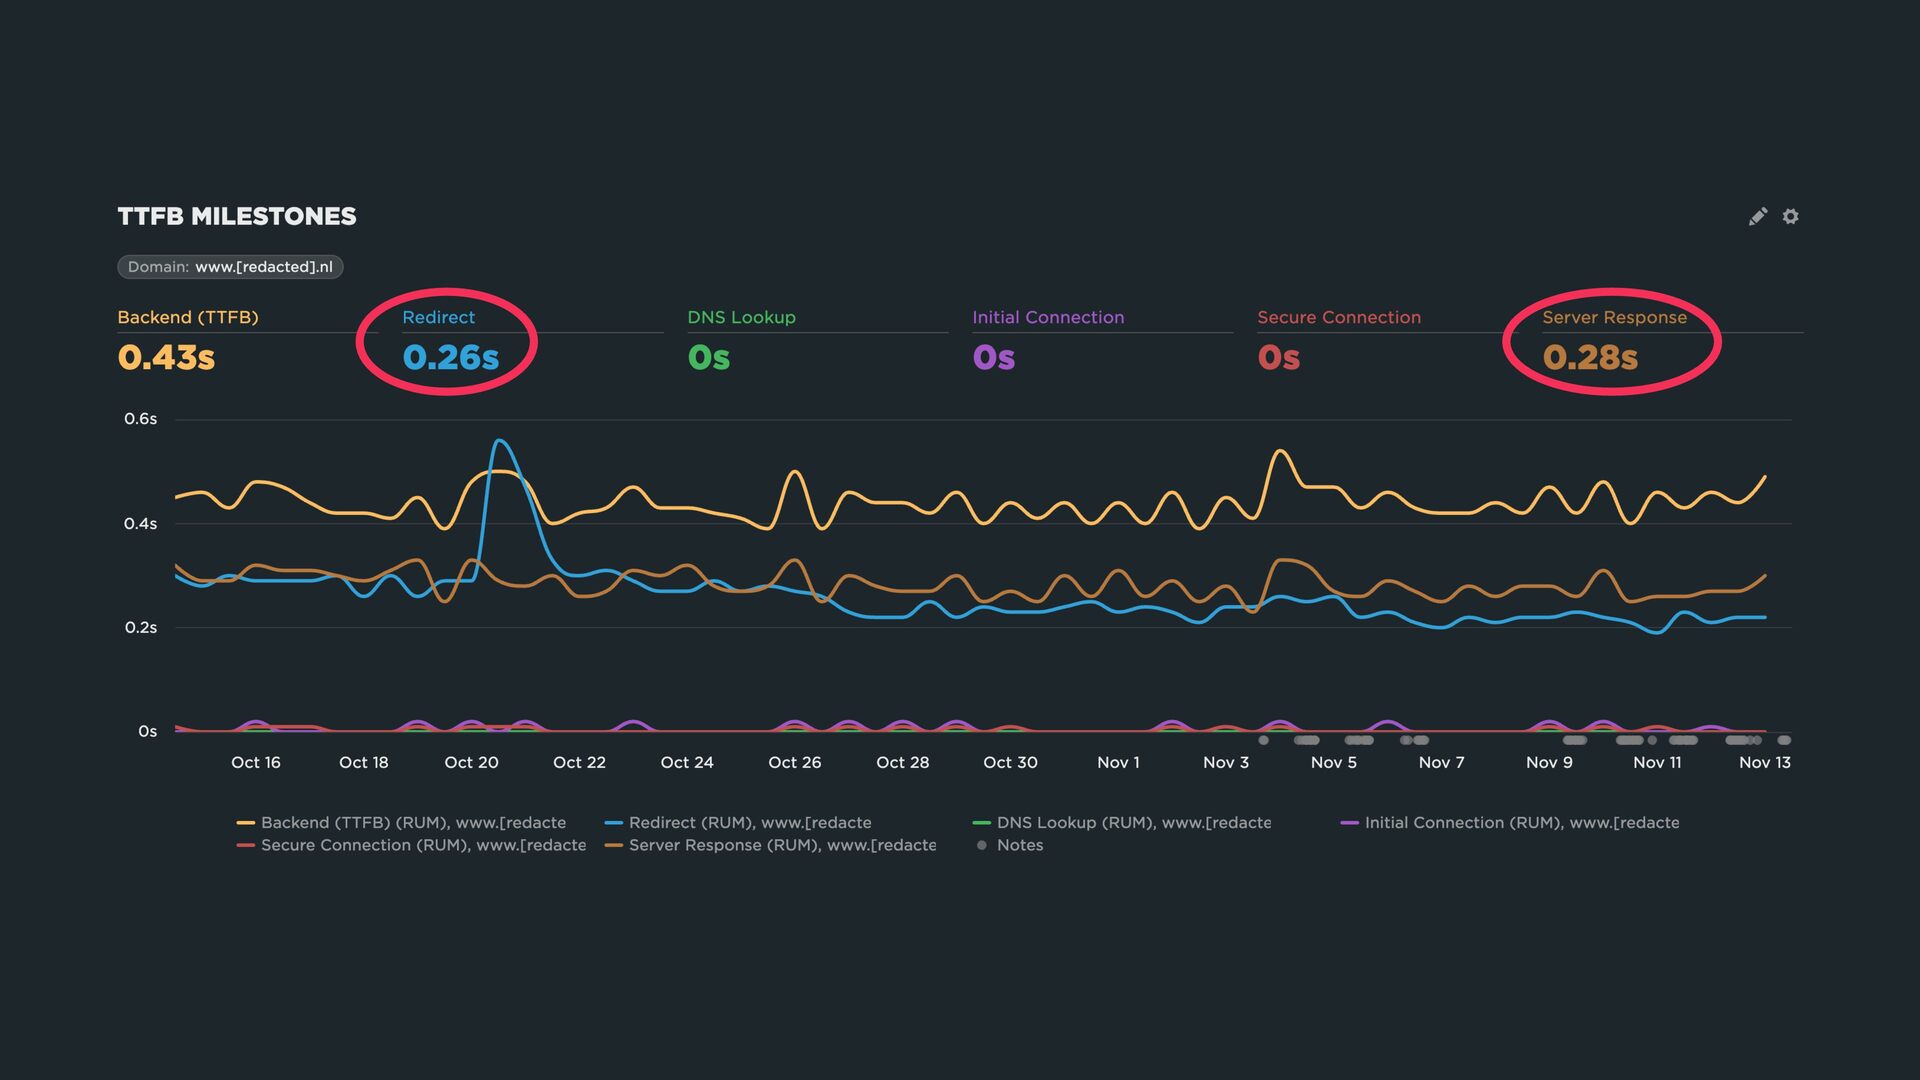
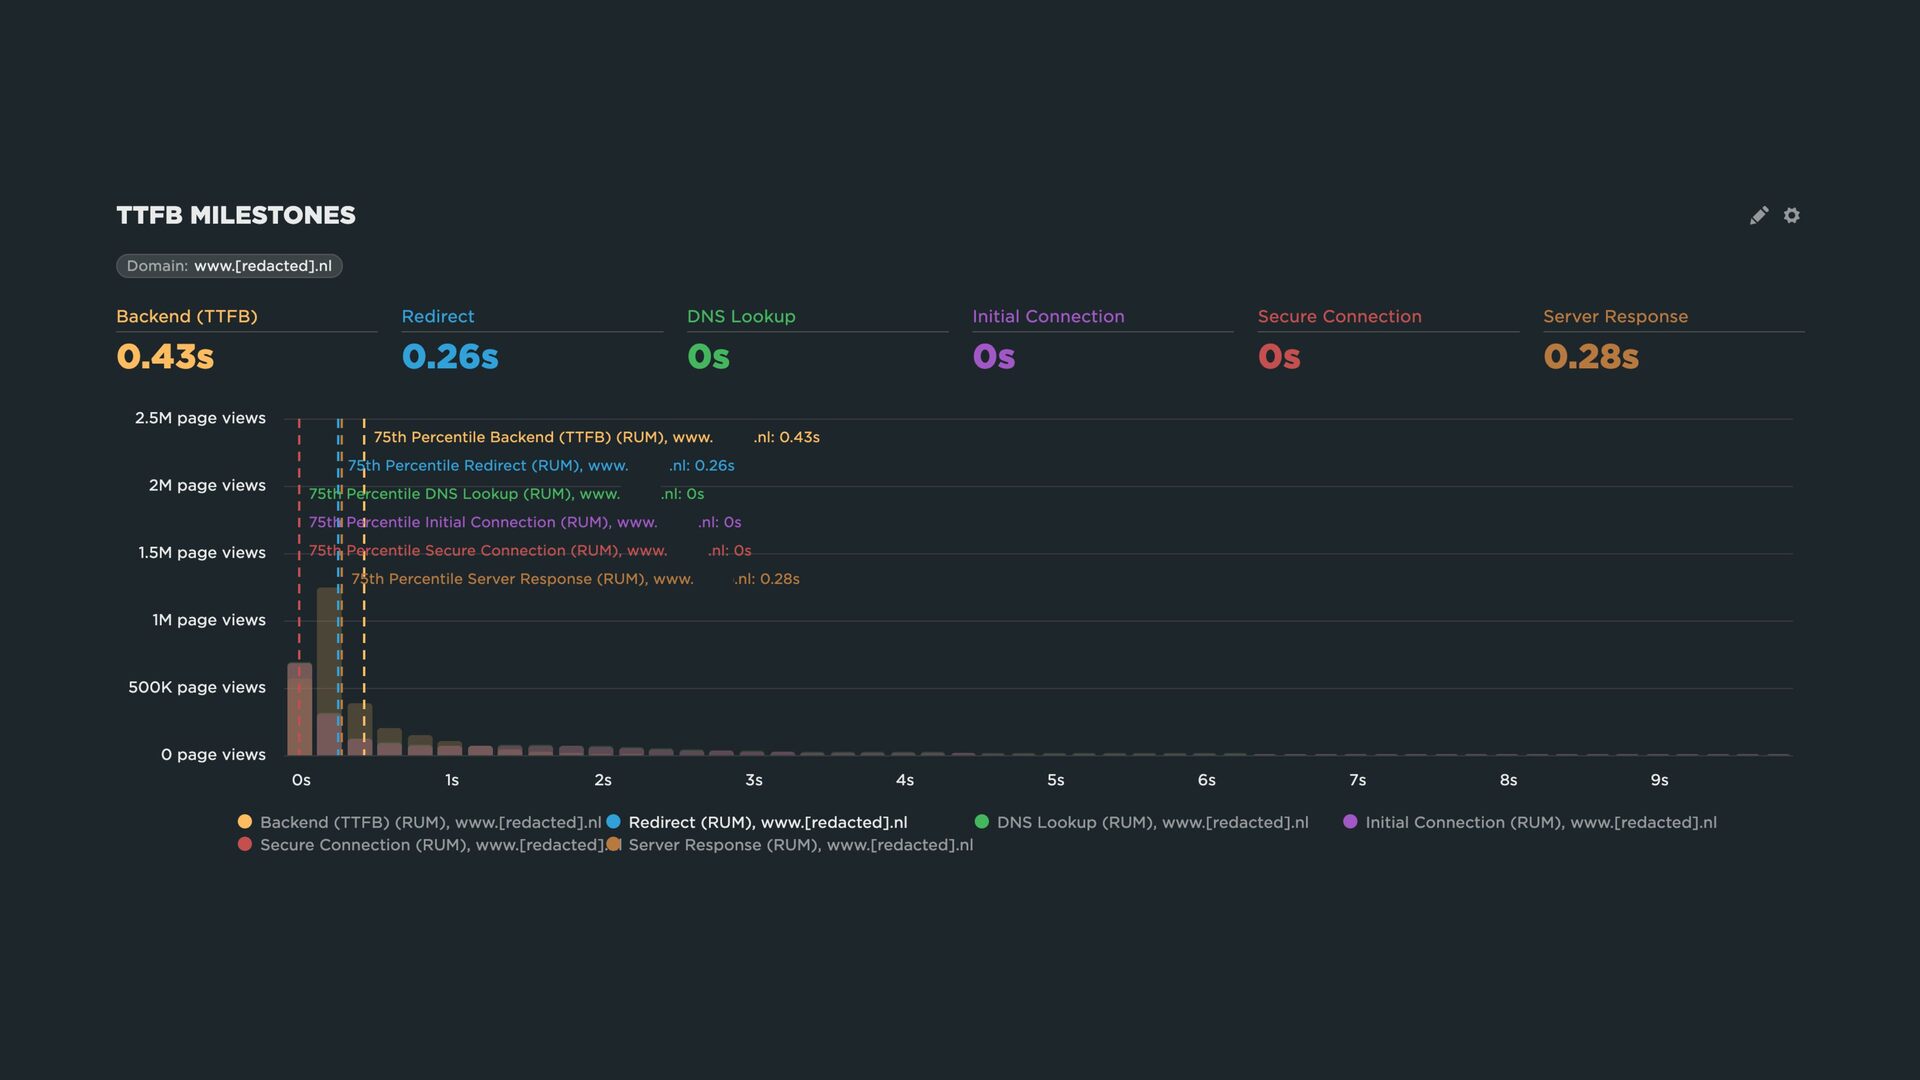
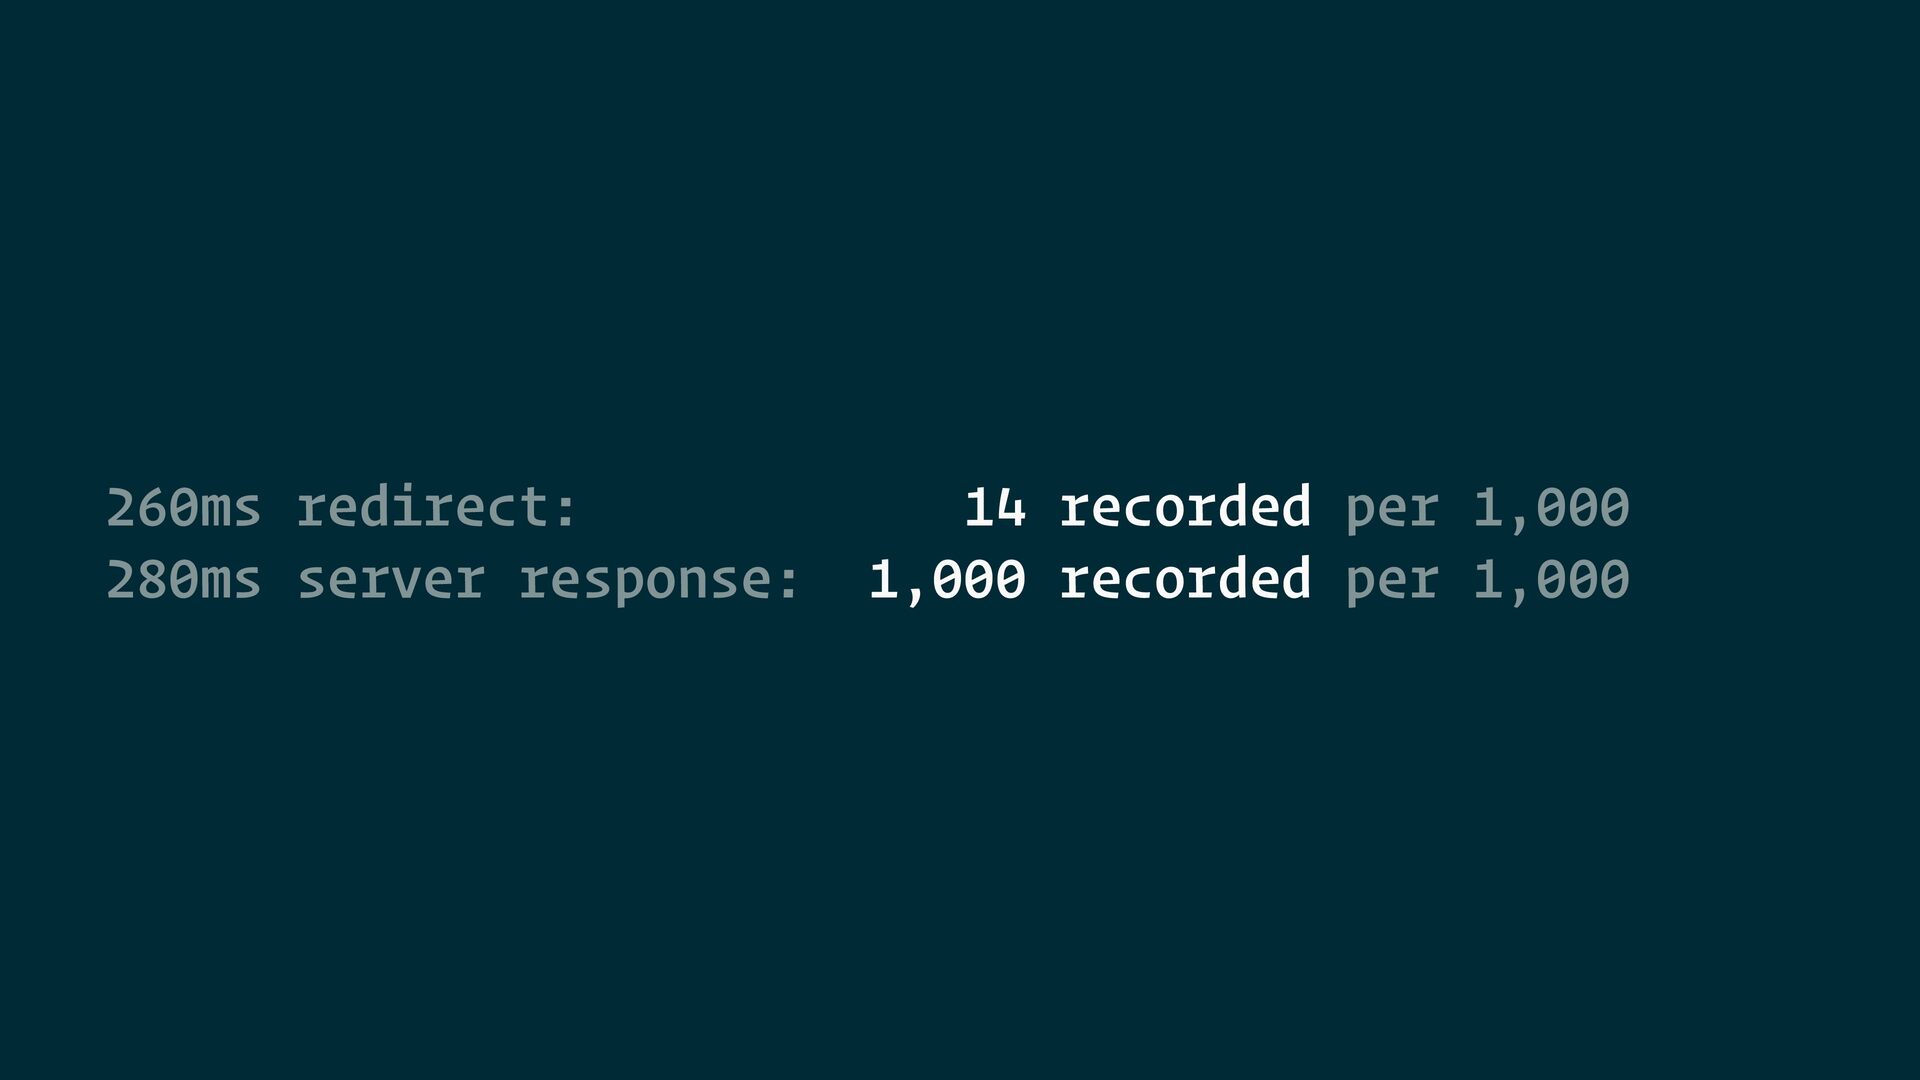
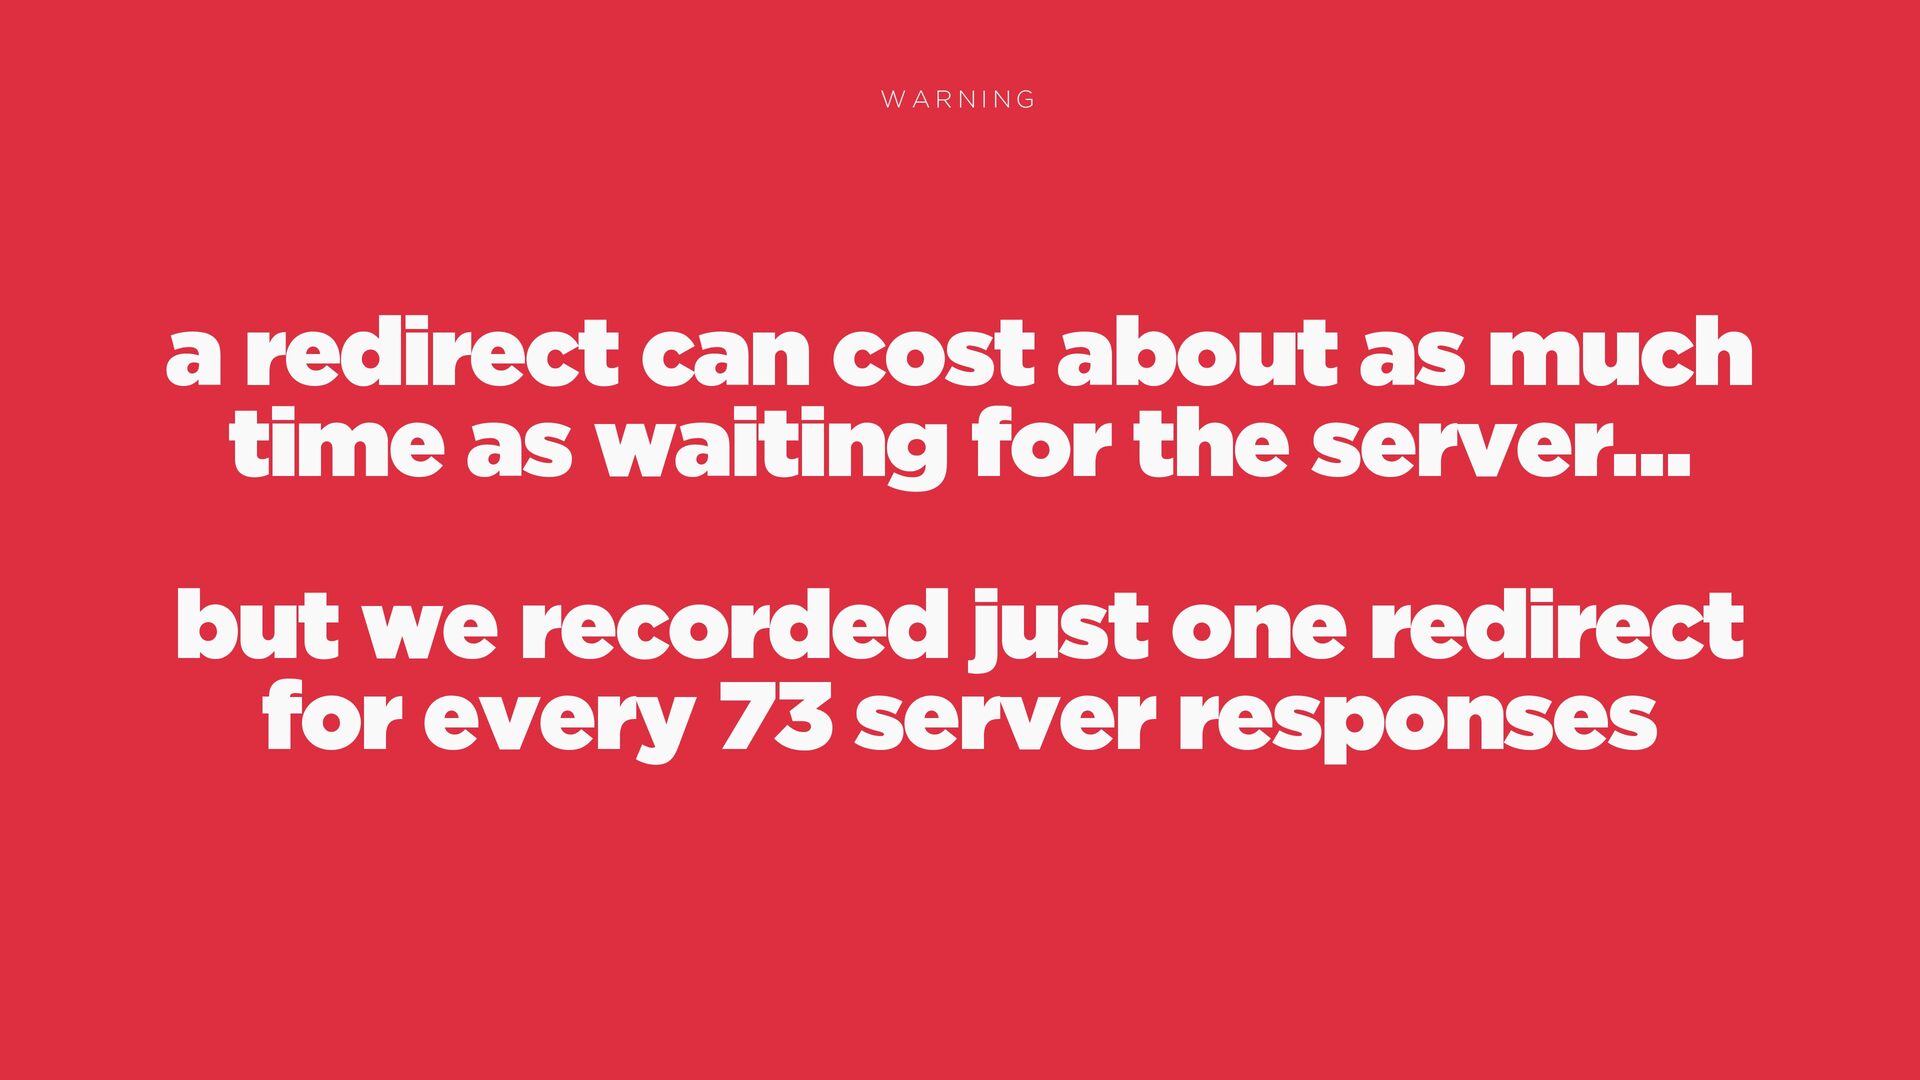
  15. WARNING a redirect can cost about as much time as
    waiting for the server… but we recorded just one redirect for every 73 server responses
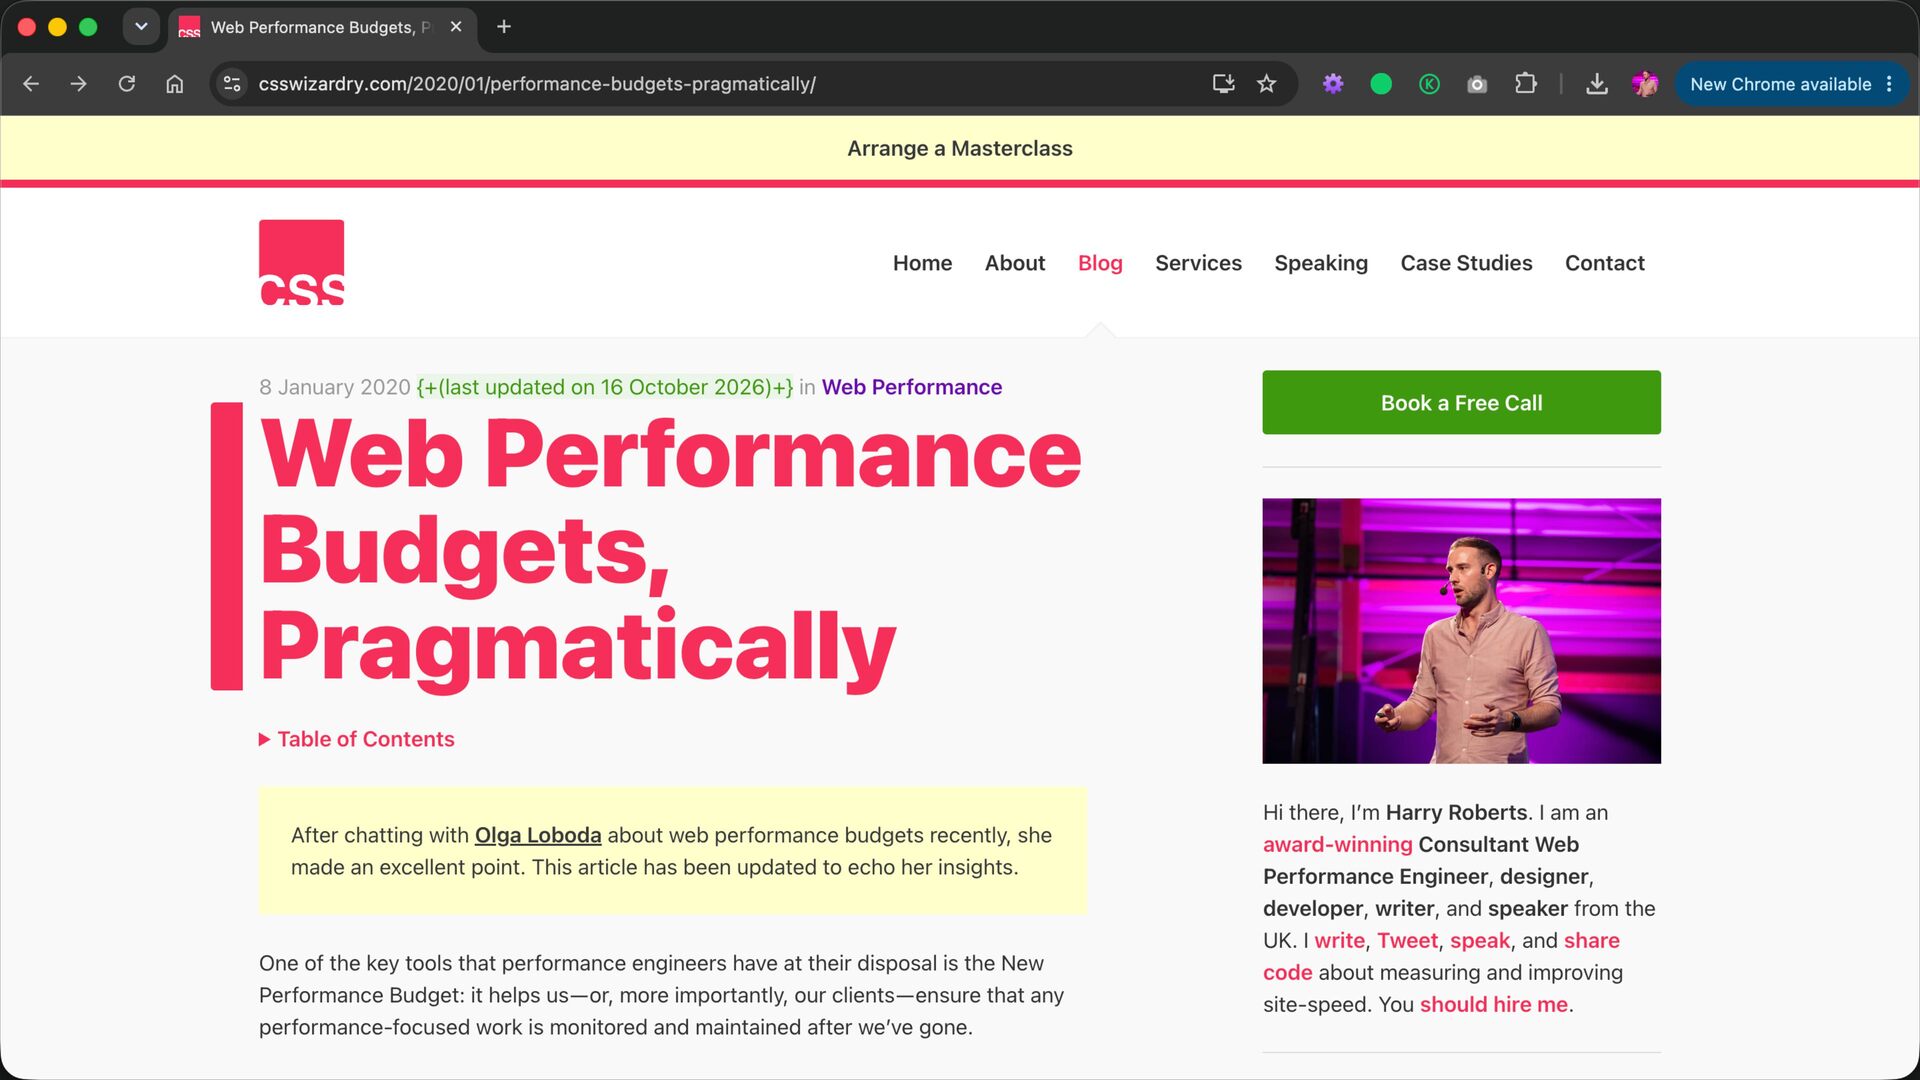
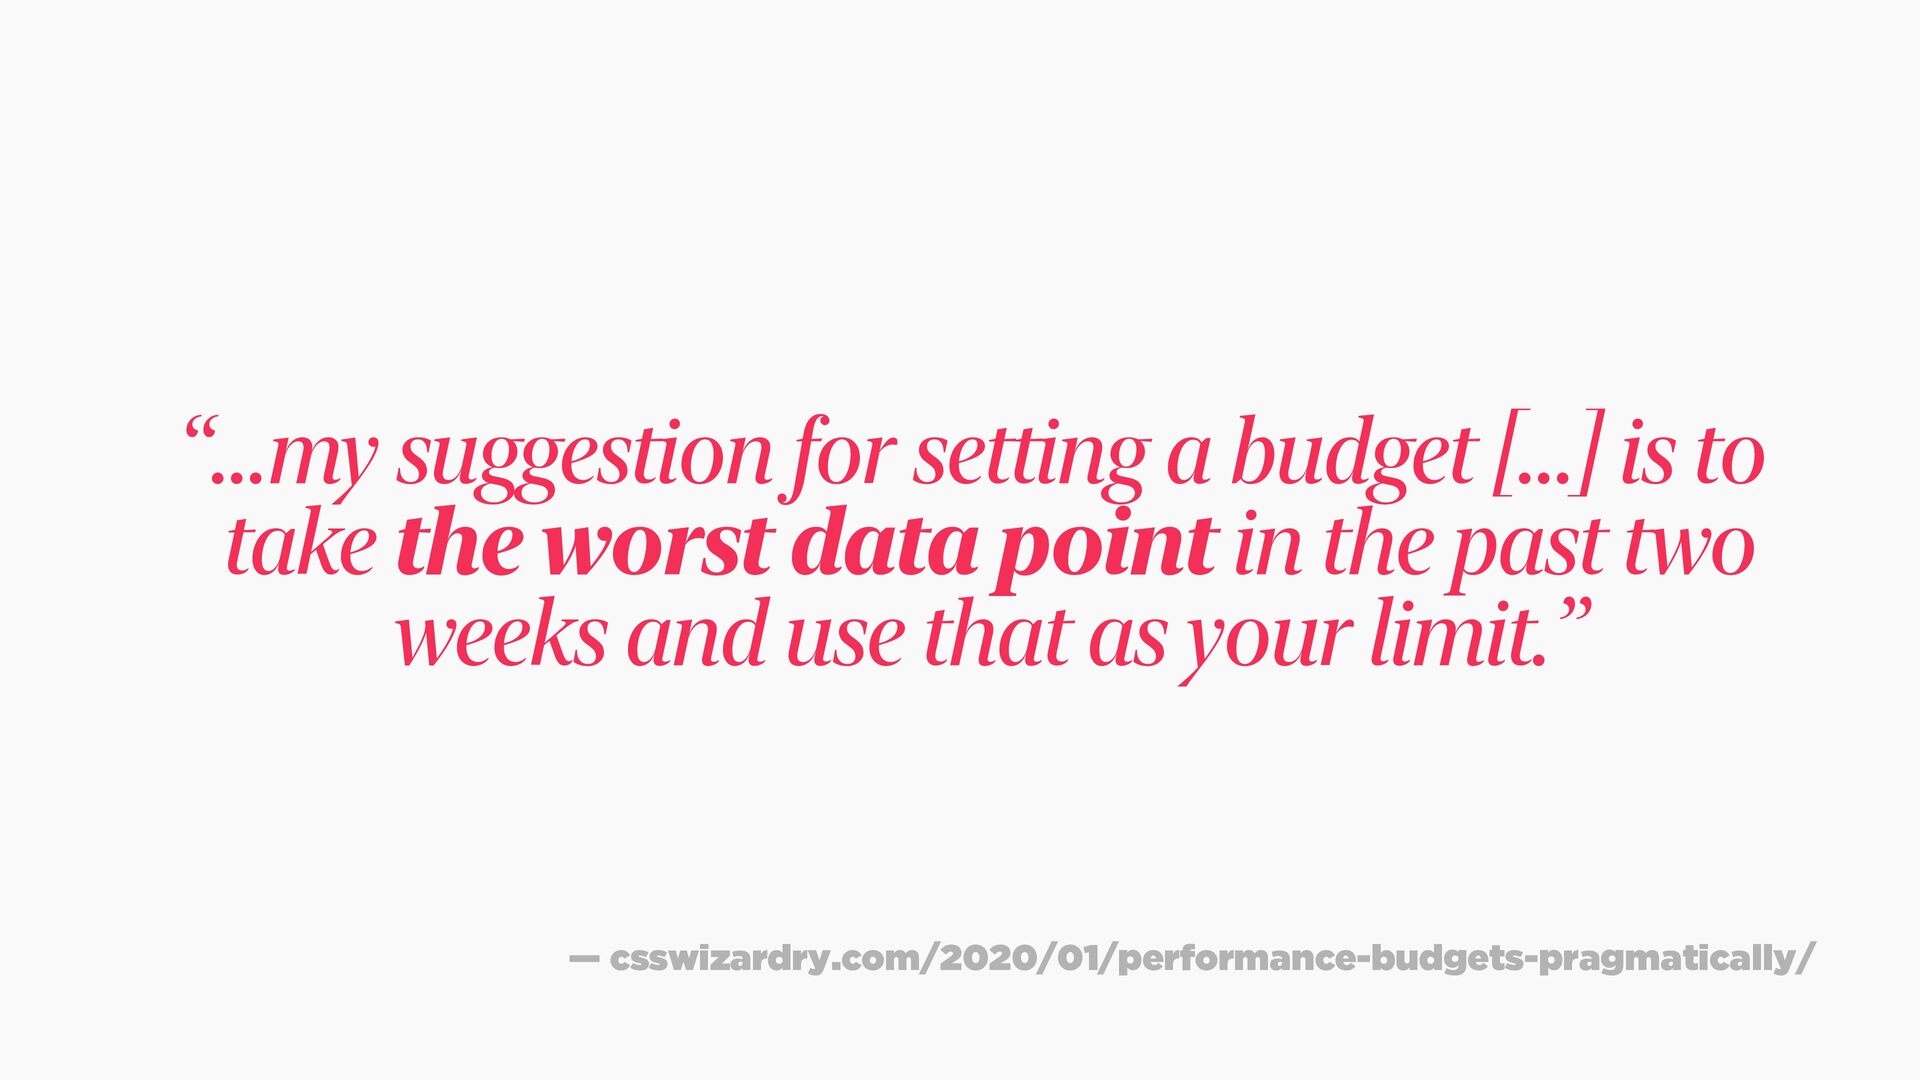
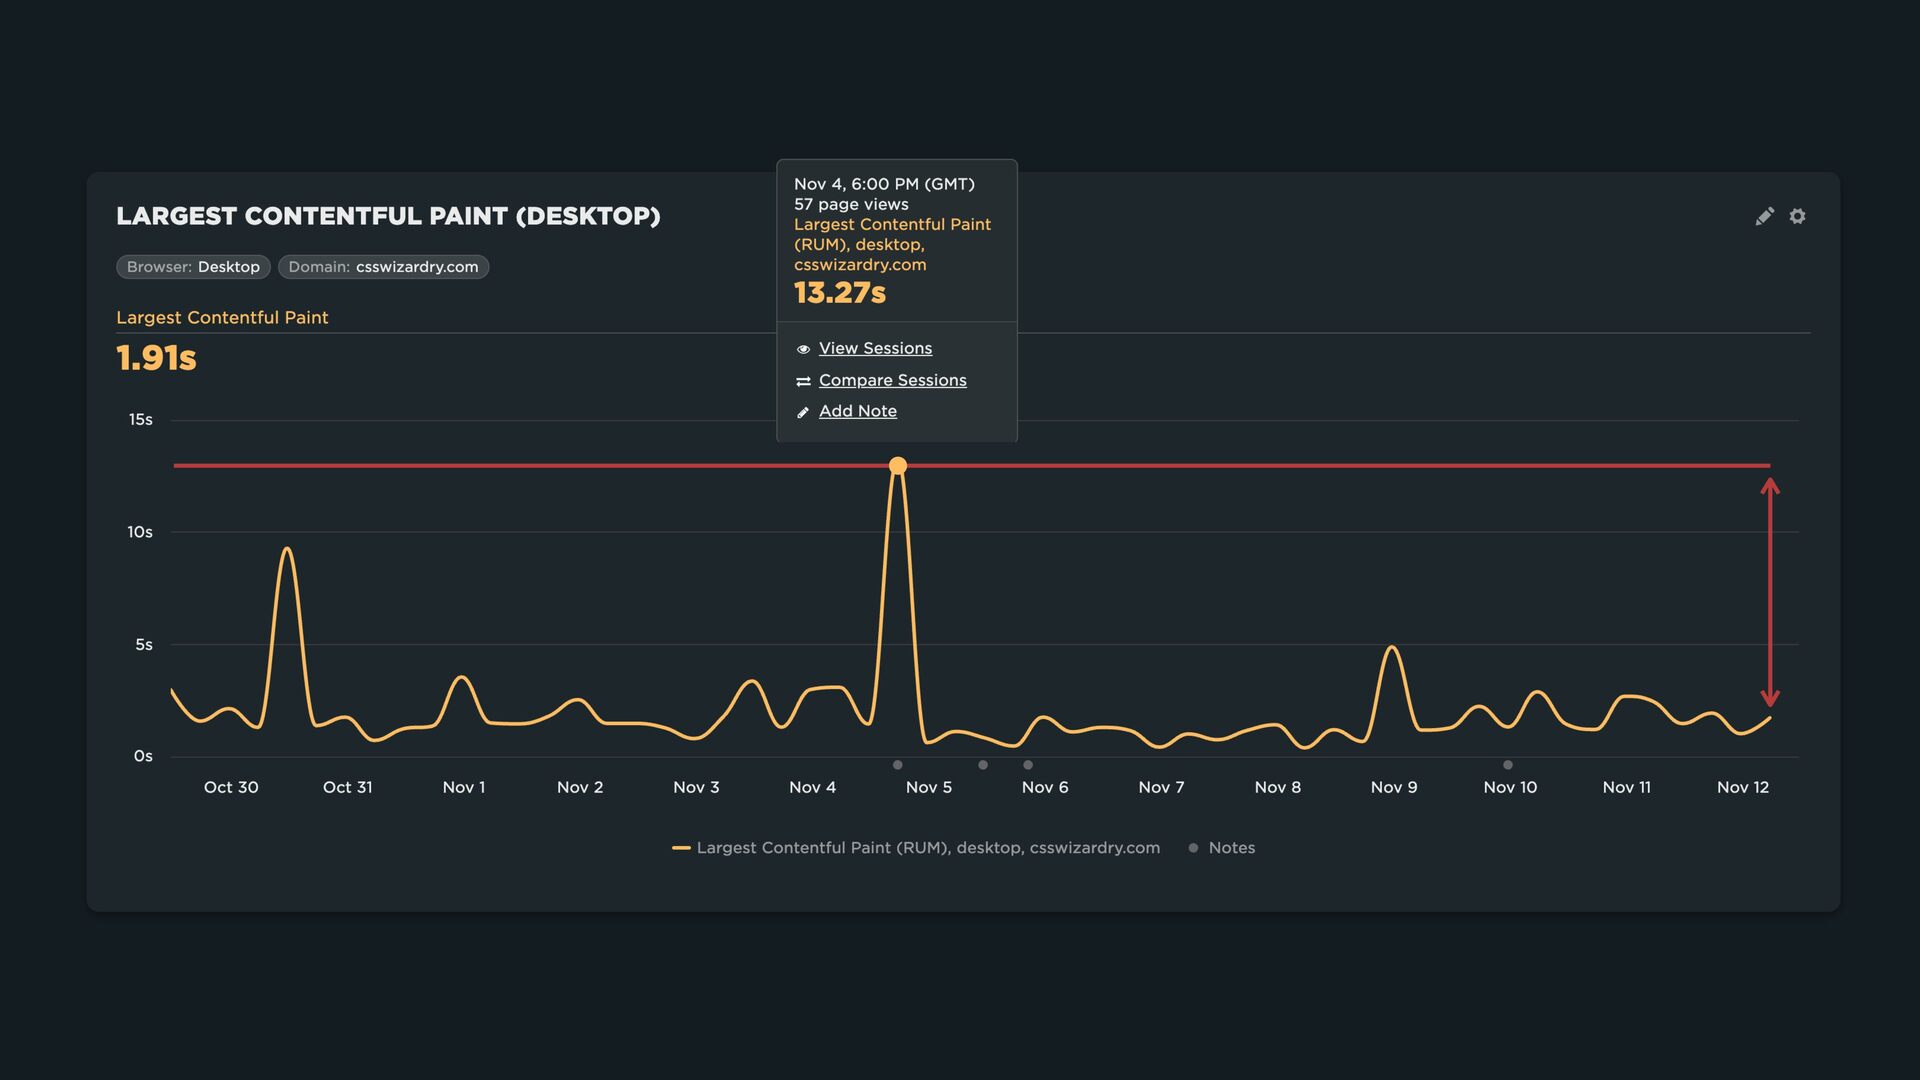
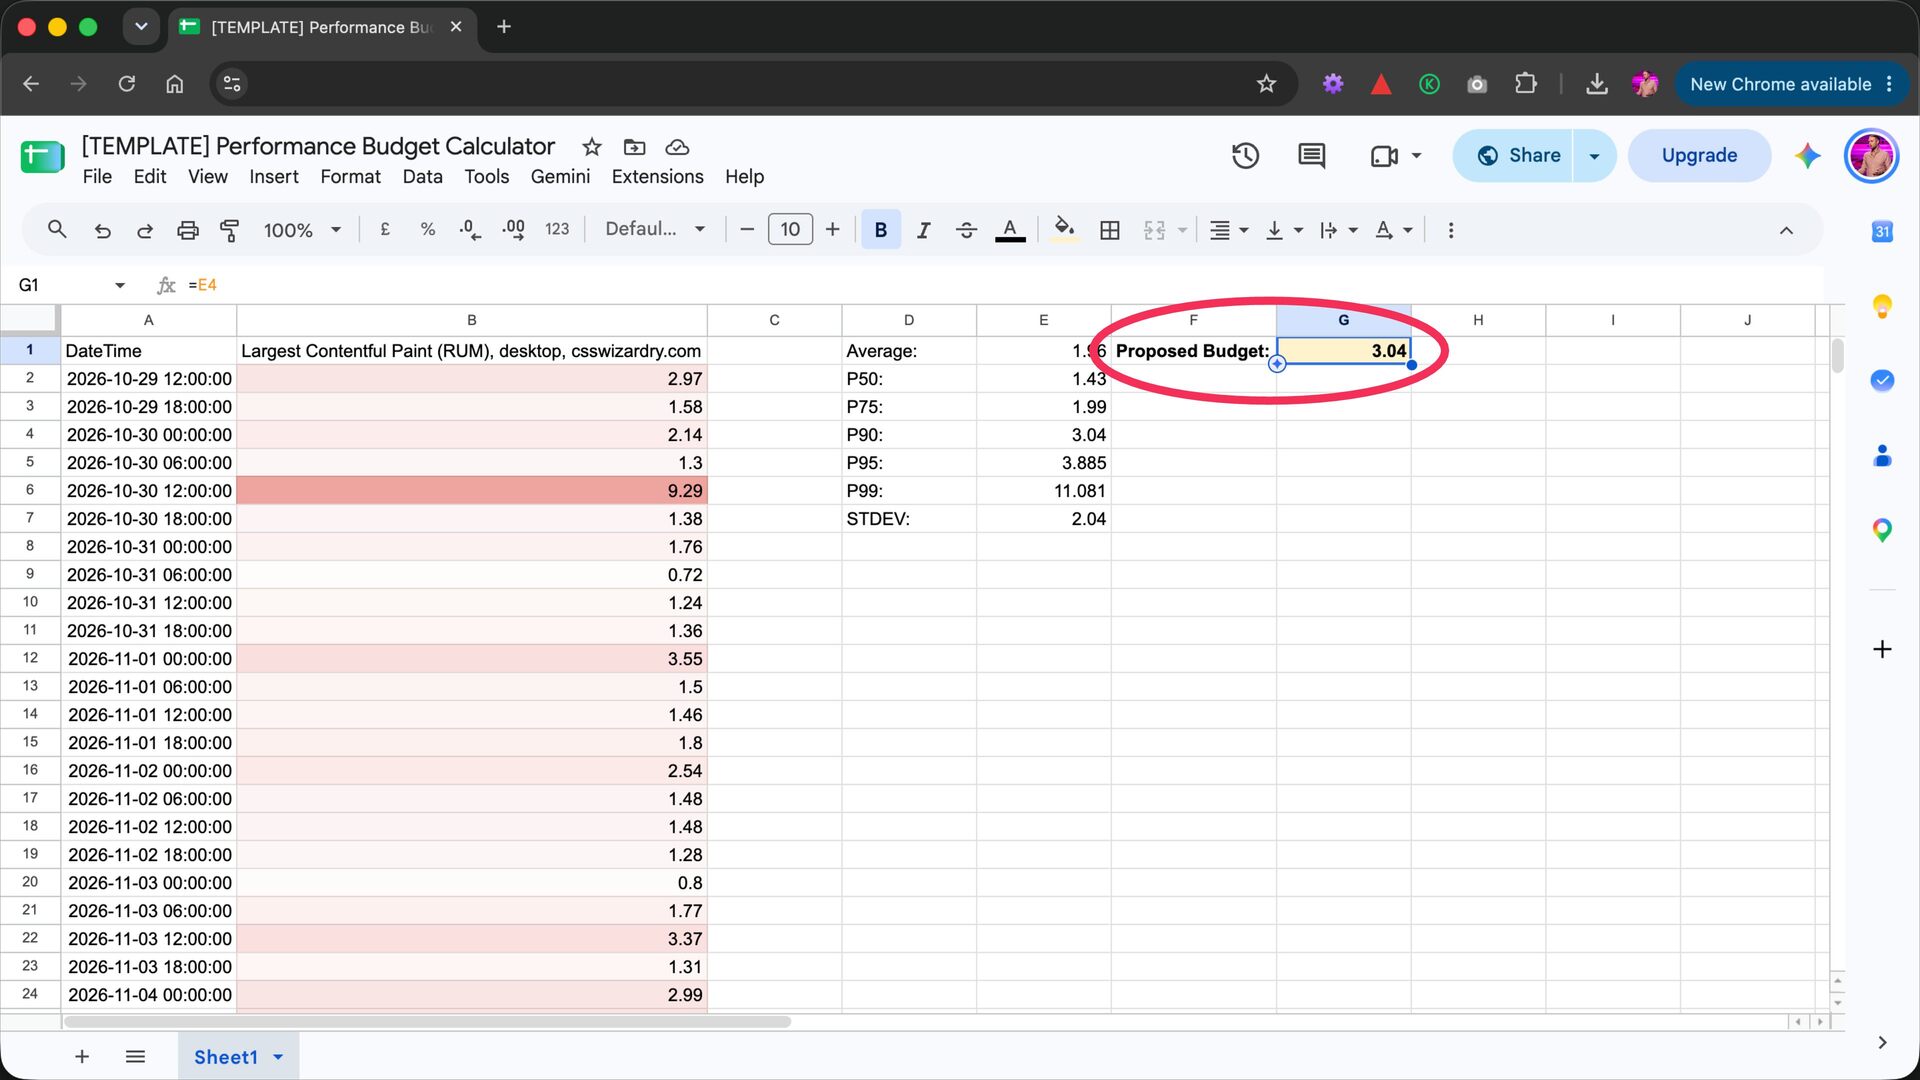
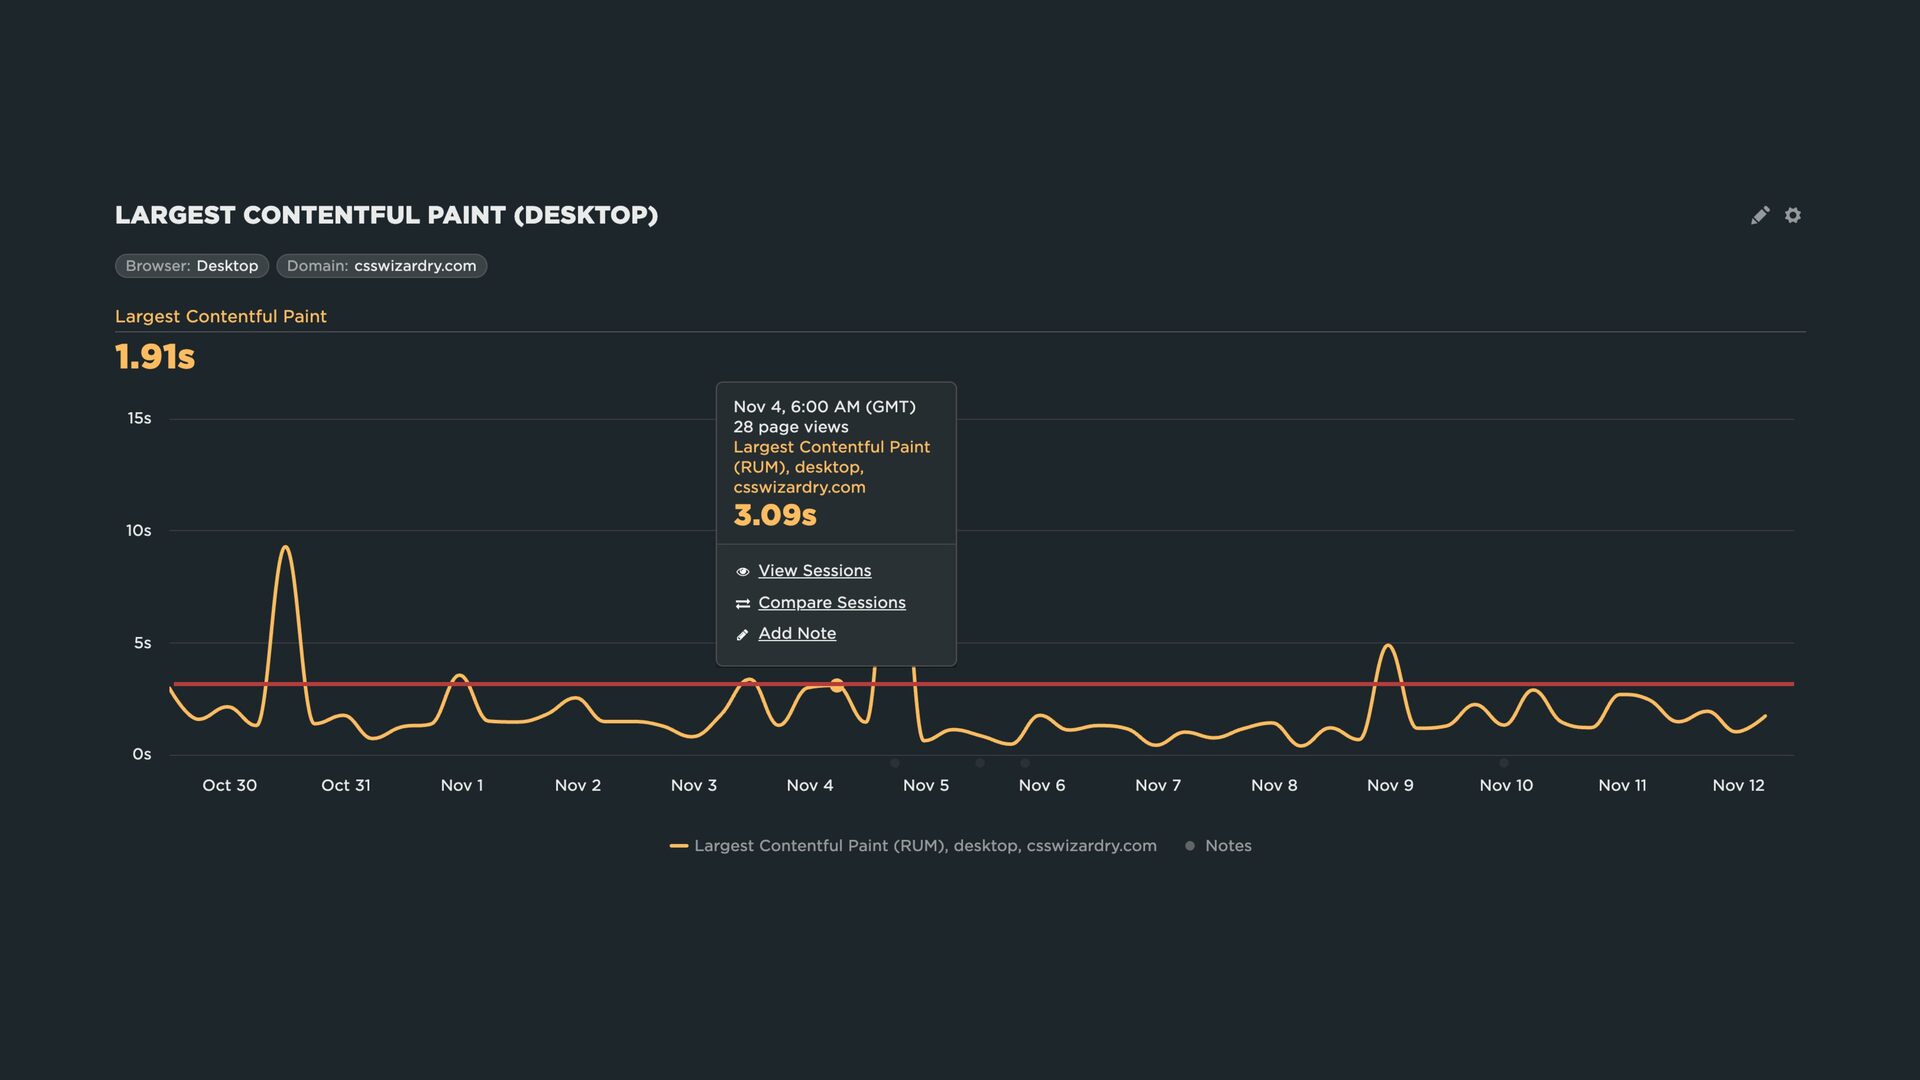
  16. “…my suggestion for setting a budget […] is to take

    the worst data point in the past two weeks and use that as your limit.” — csswizardry.com/2020/01/performance-budgets-pragmatically/
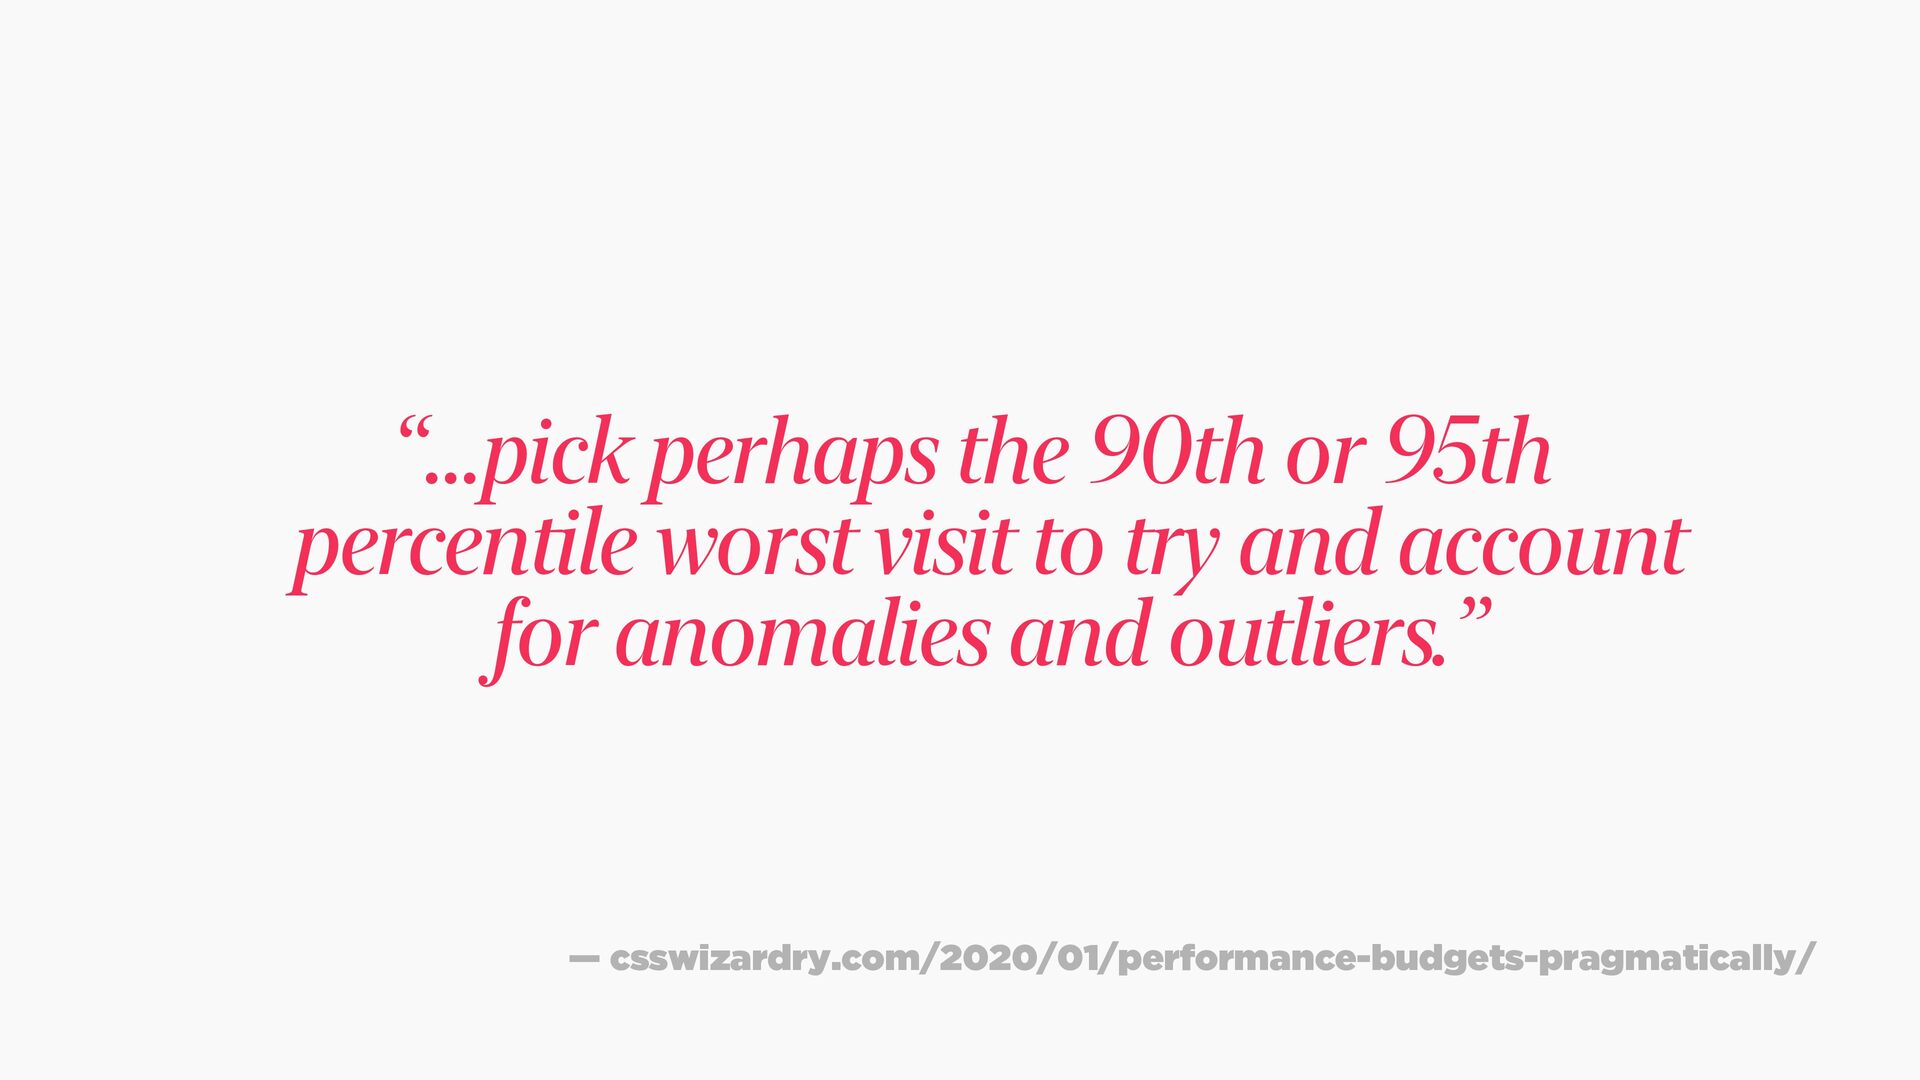
  17. “…pick perhaps the 90th or 95th percentile worst visit to

    try and account for anomalies and outliers.” — csswizardry.com/2020/01/performance-budgets-pragmatically/
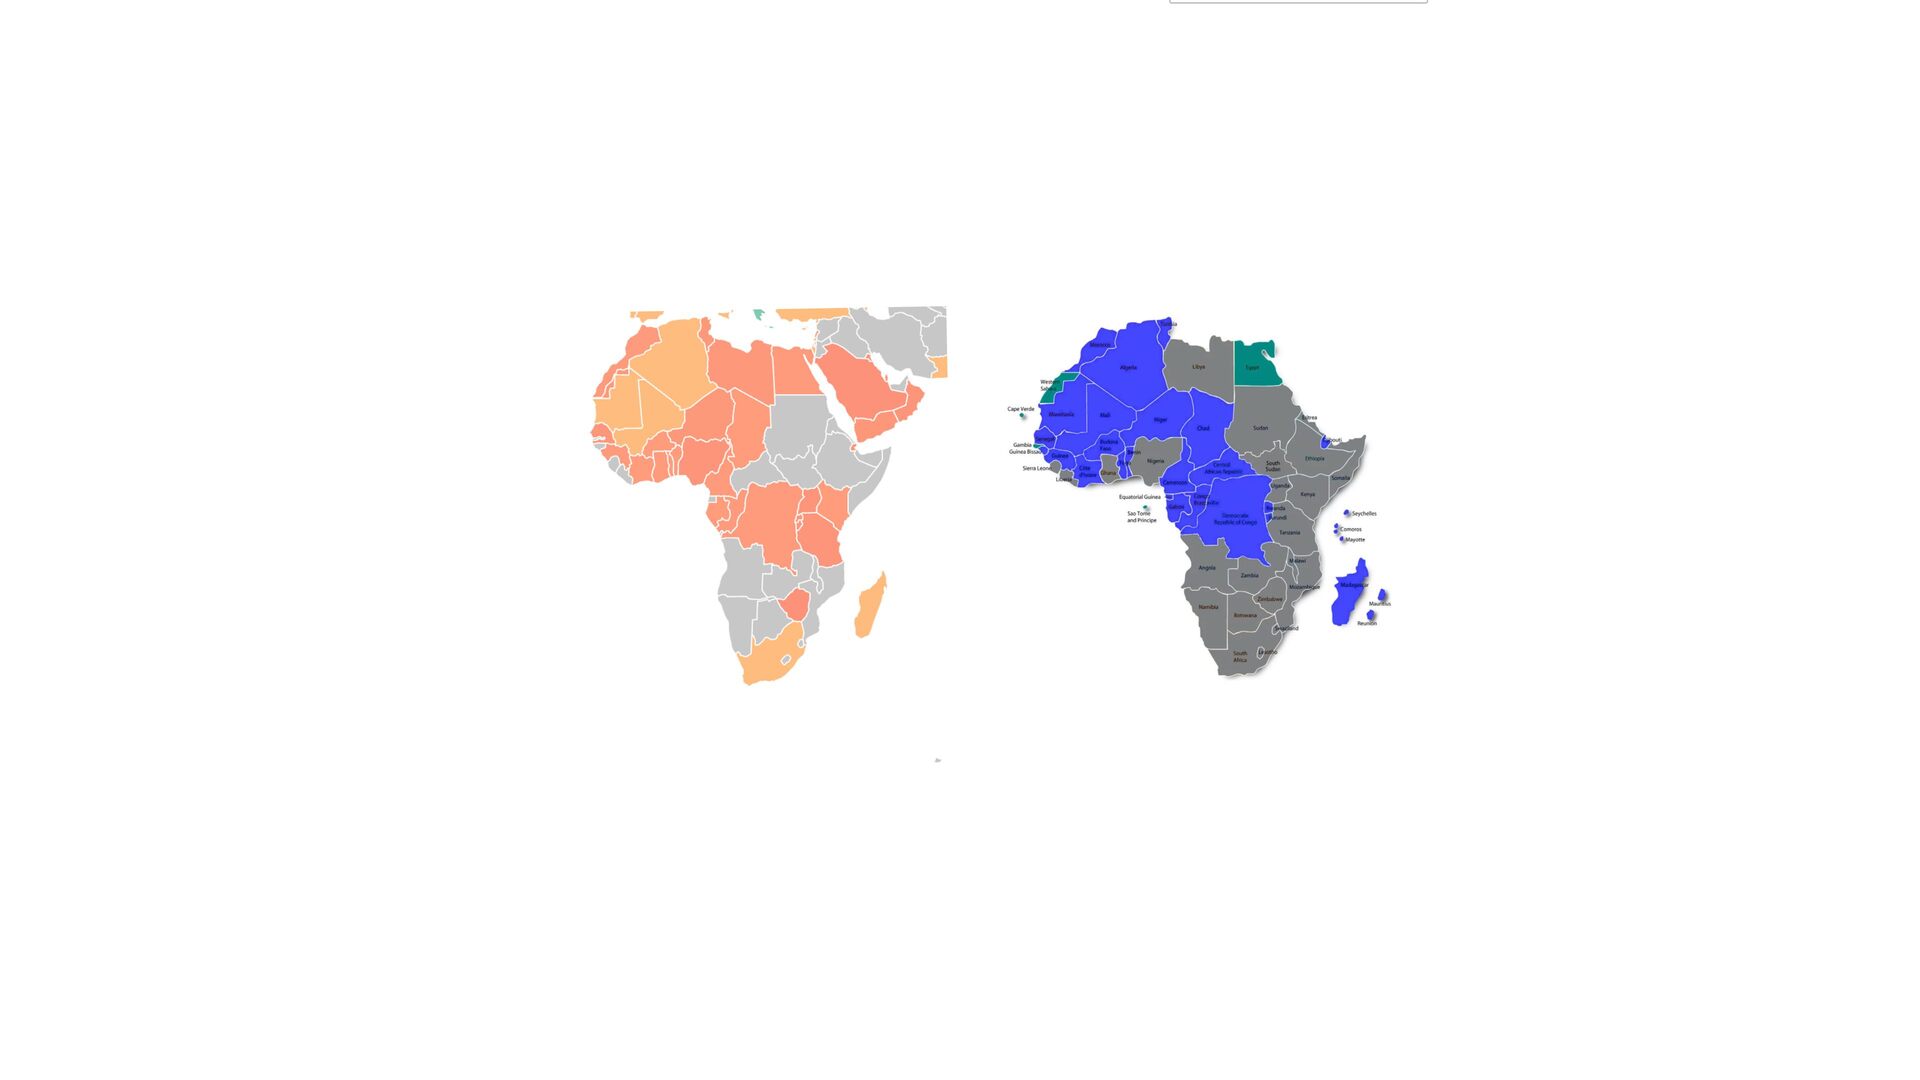
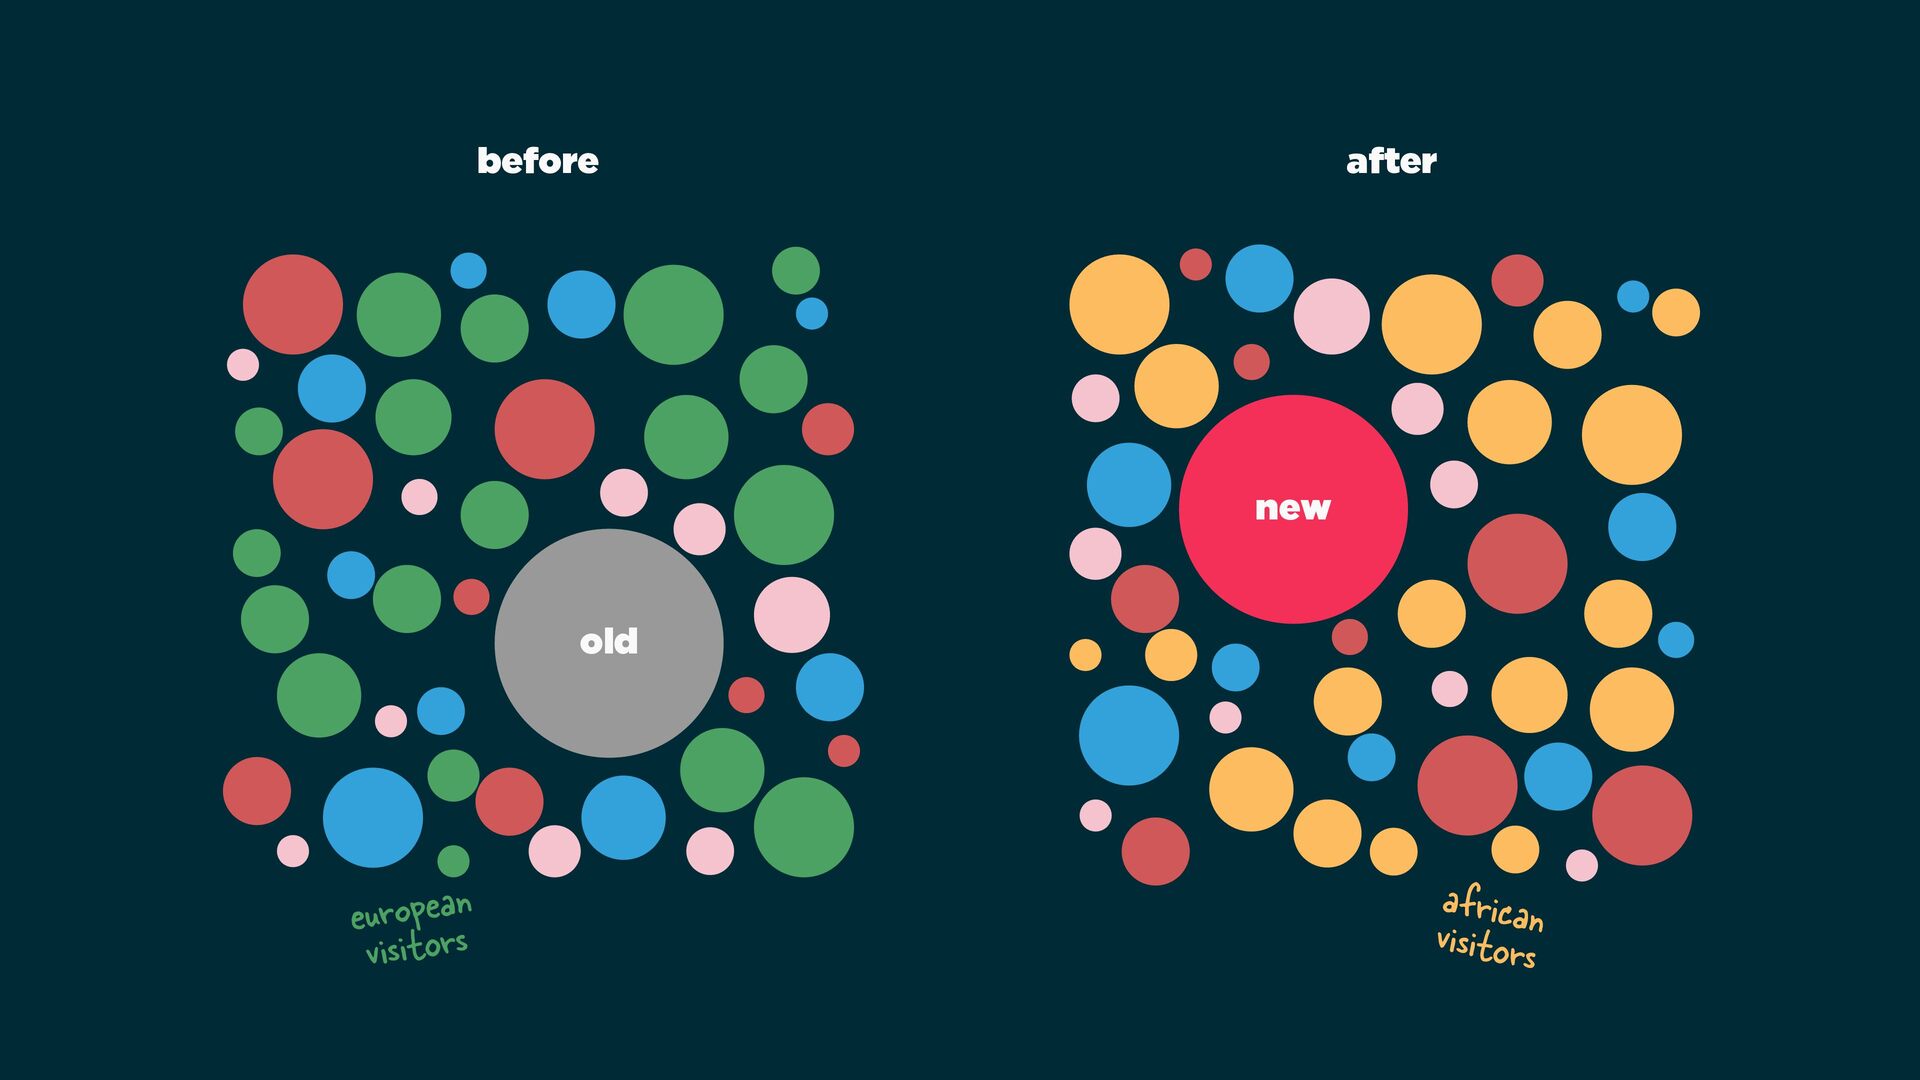
  18. before after new old o o n a e p

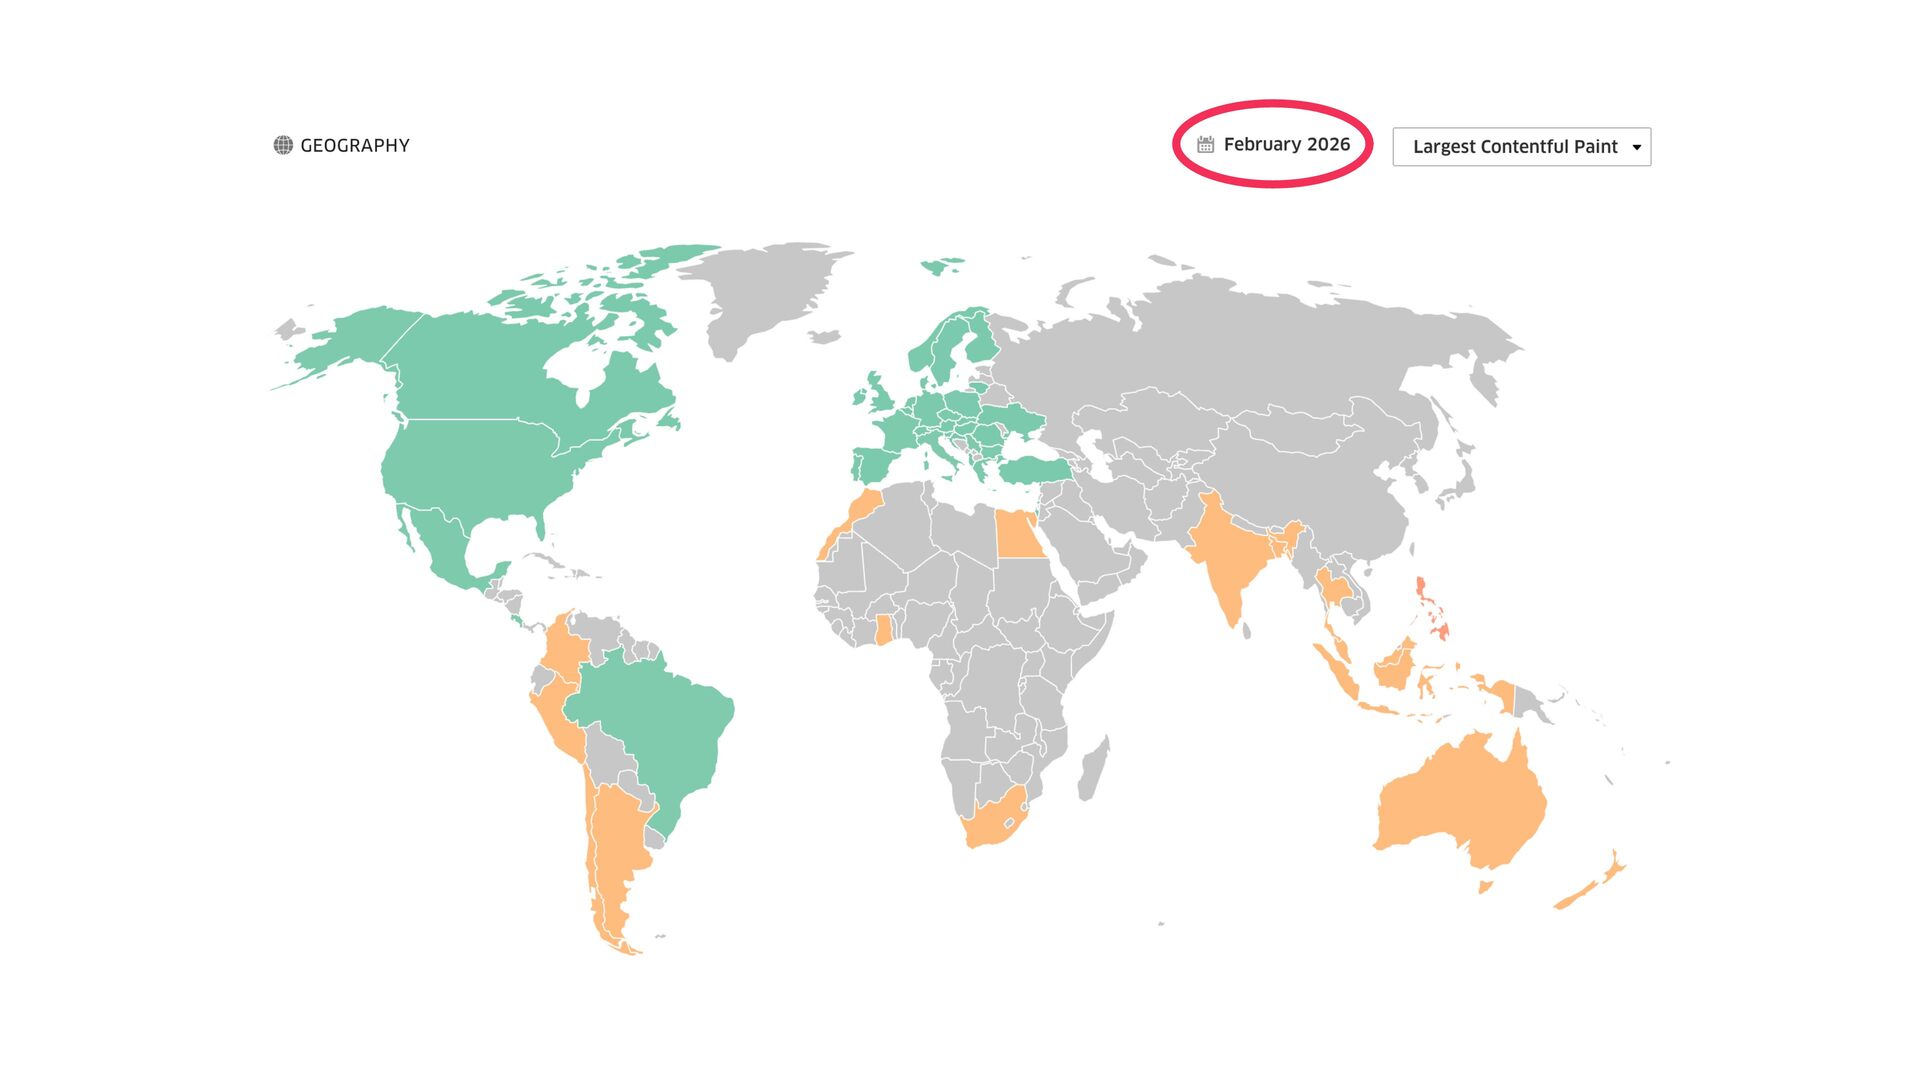
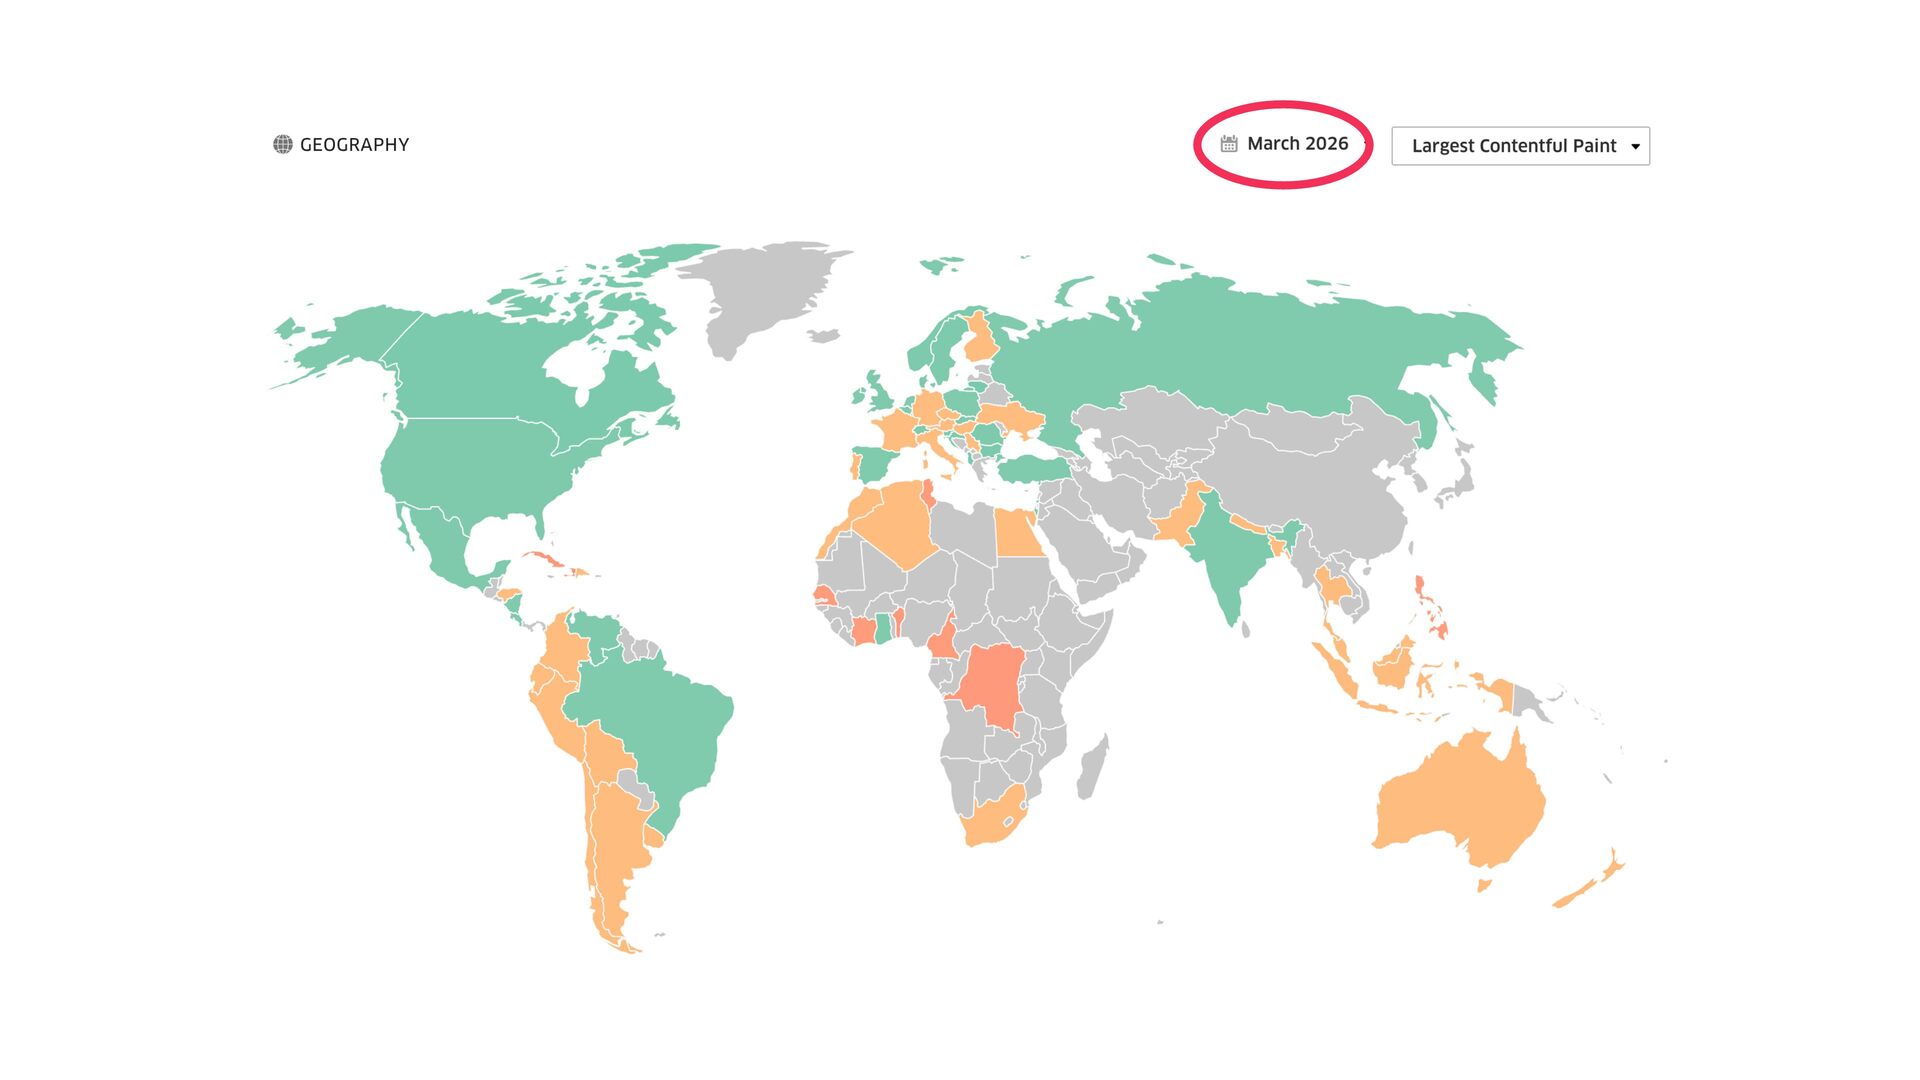
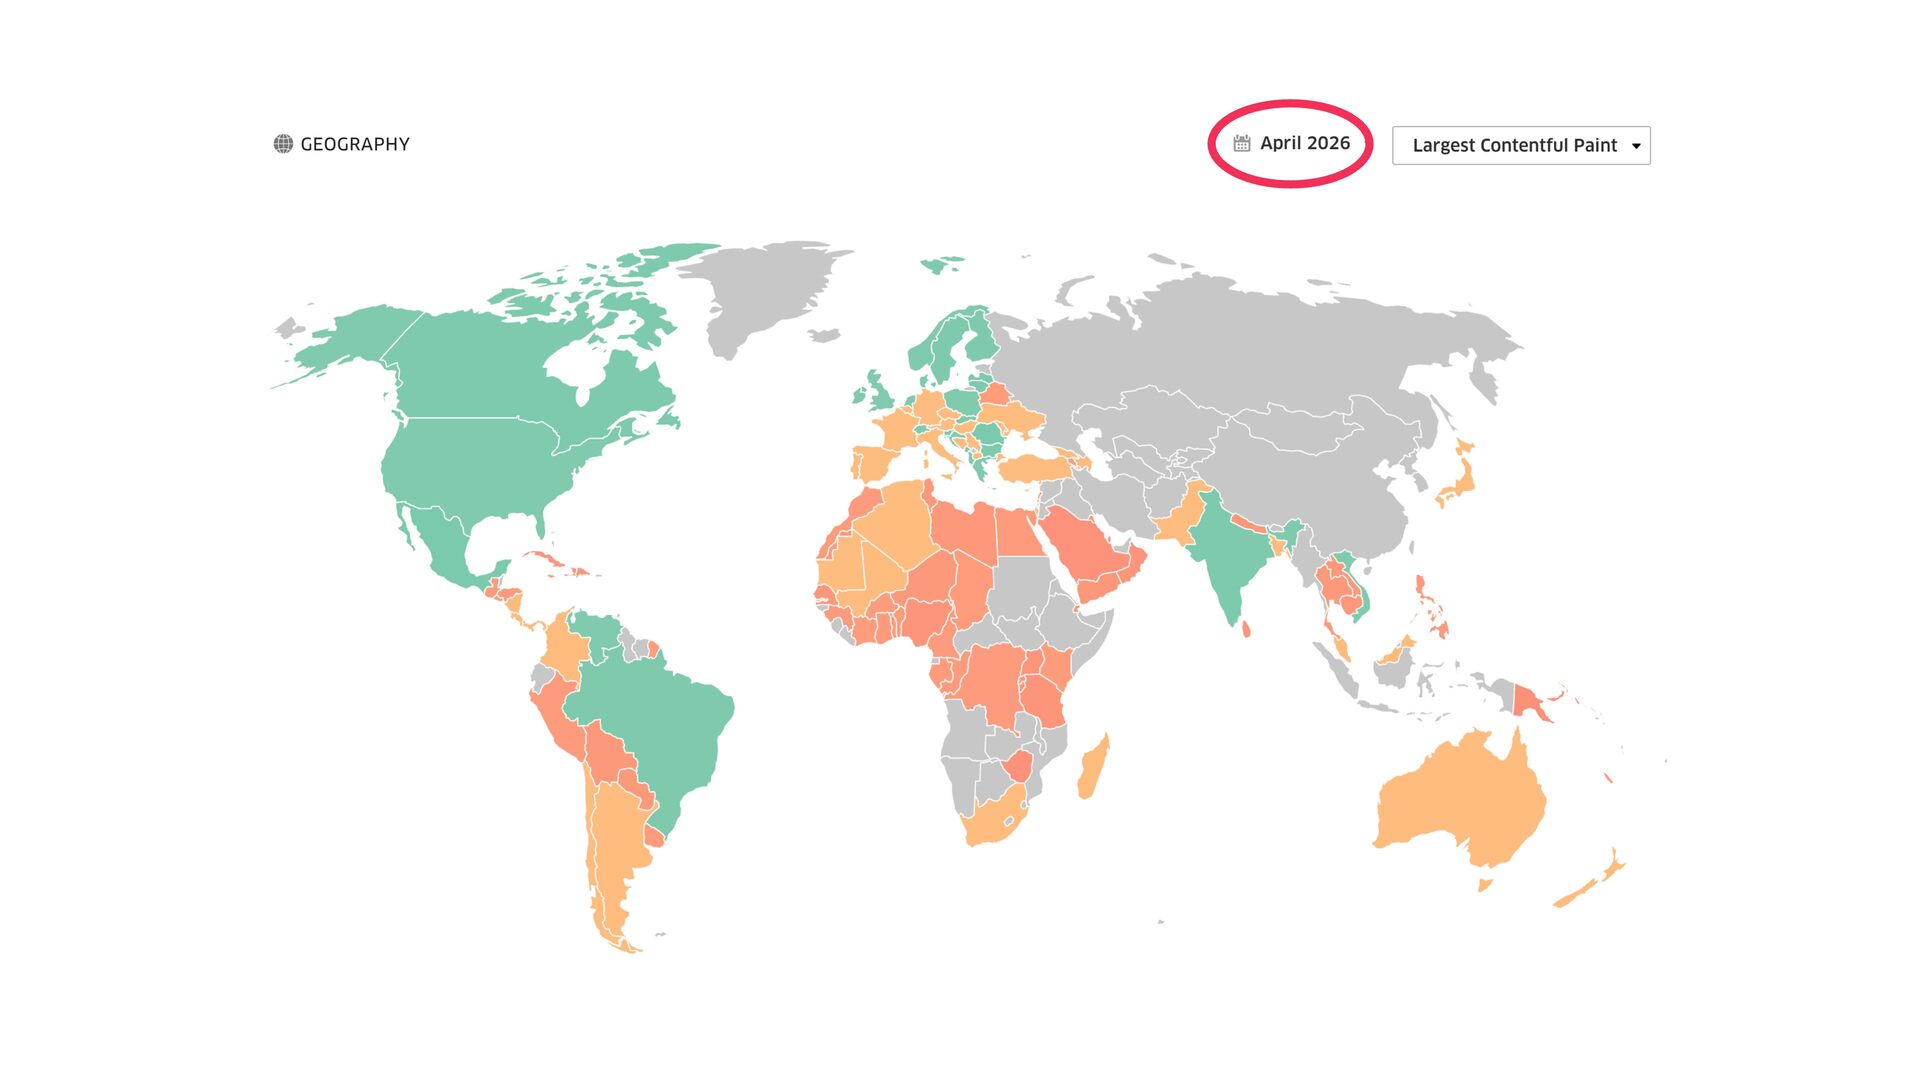
    o r eu visit rs african visit rs

More Decks by Harry Roberts

Other Decks in Technology