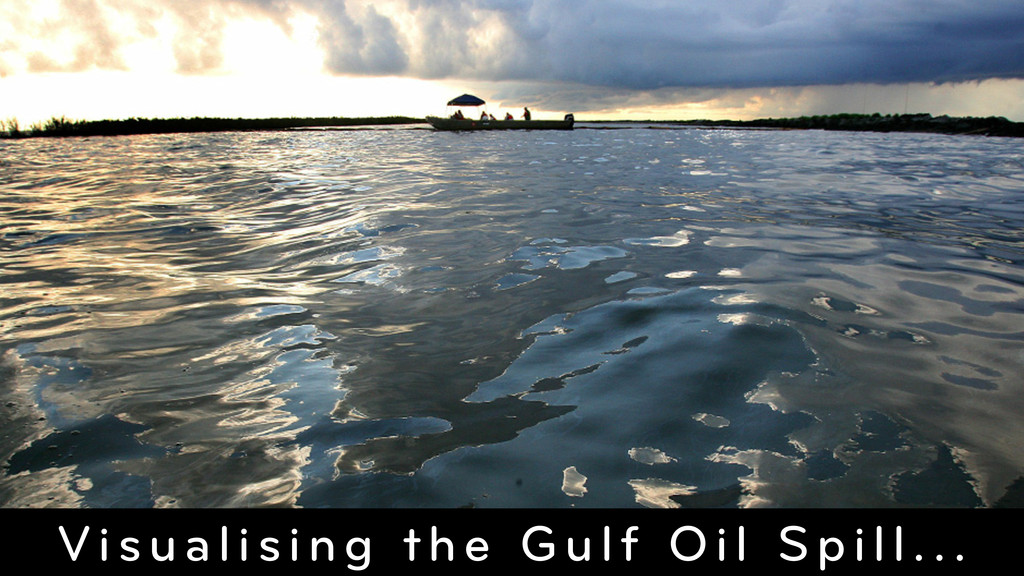
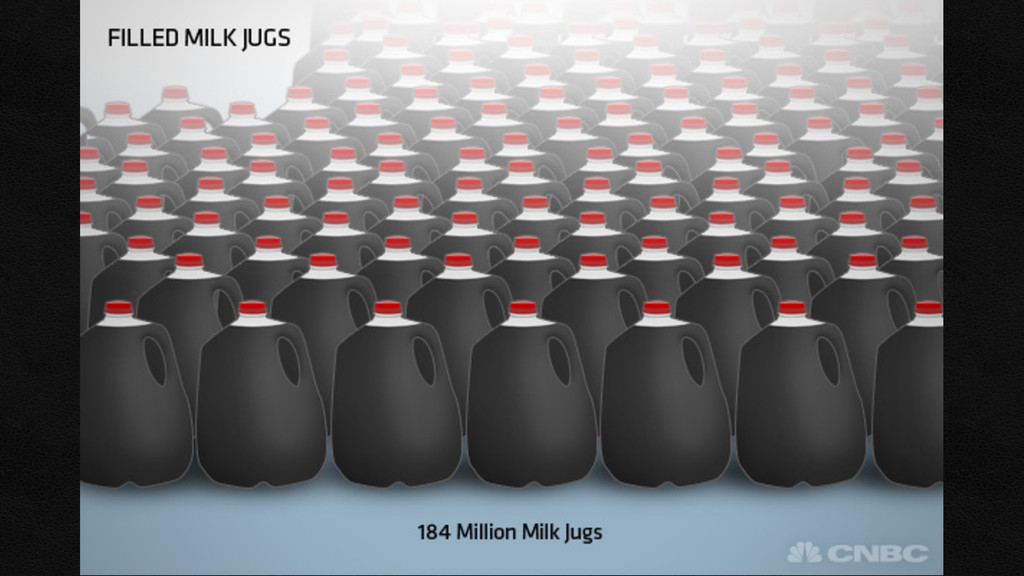
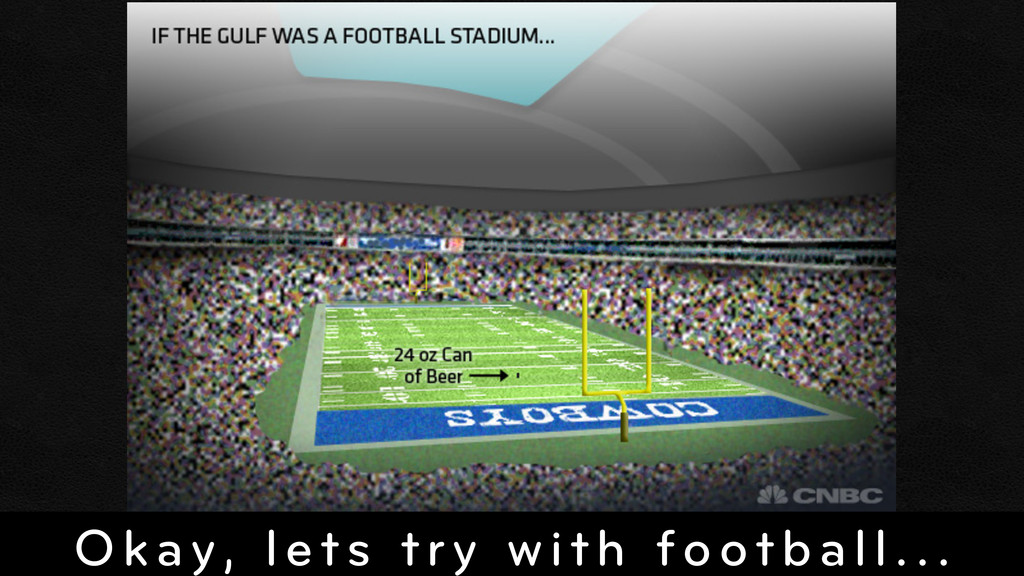
of water in the world, containing approximately 660 quadrillion gallons of water (that's 660 with 15 zeros) - was represented by Cowboys Stadium in Dallas - the largest domed stadium in the world - how would the spill stack up? In this example, the amount of oil spilled - if the Gulf of Mexico was the size of Cowboys Stadium - would be about the size of a 24 ounce can of beer. Cowboys stadium has an internal volume of approximately 104 million cubic feet, compared to the just over 50 cubic inches of volume in a 24-ounce can. Just like the can, the spilled oil represents only . 00000002788% of the liquid volume present in the Gulf of Mexico, although as the oil is dispersed, the amount of water affected becomes substantially greater.
of water in the world, containing approximately 660 quadrillion gallons of water (that's 660 with 15 zeros) - was represented by Cowboys Stadium in Dallas - the largest domed stadium in the world - how would the spill stack up? In this example, the amount of oil spilled - if the Gulf of Mexico was the size of Cowboys Stadium - would be about the size of a 24 ounce can of beer. Cowboys stadium has an internal volume of approximately 104 million cubic feet, compared to the just over 50 cubic inches of volume in a 24-ounce can. Just like the can, the spilled oil represents only . 00000002788% of the liquid volume present in the Gulf of Mexico, although as the oil is dispersed, the amount of water affected becomes substantially greater.
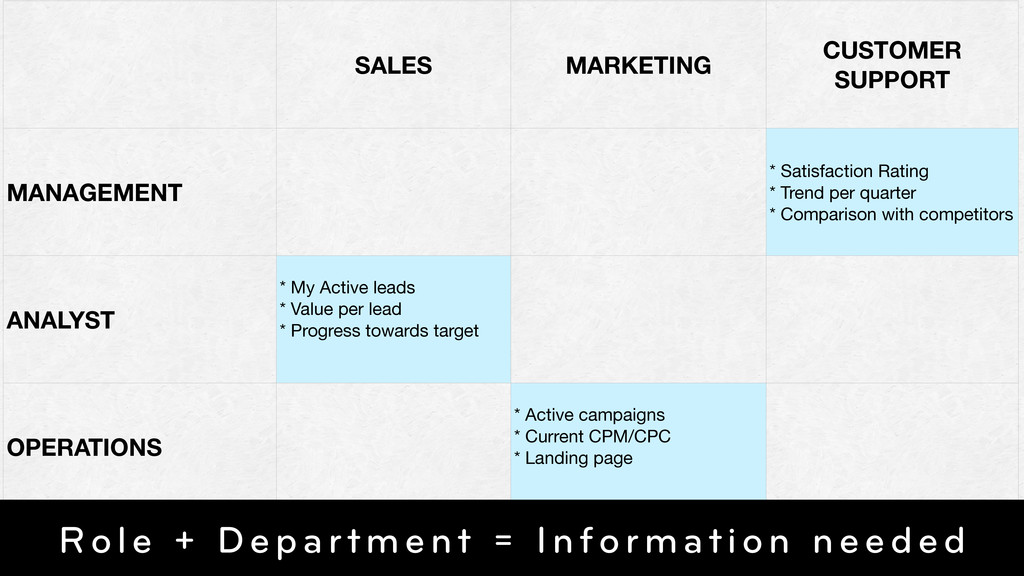
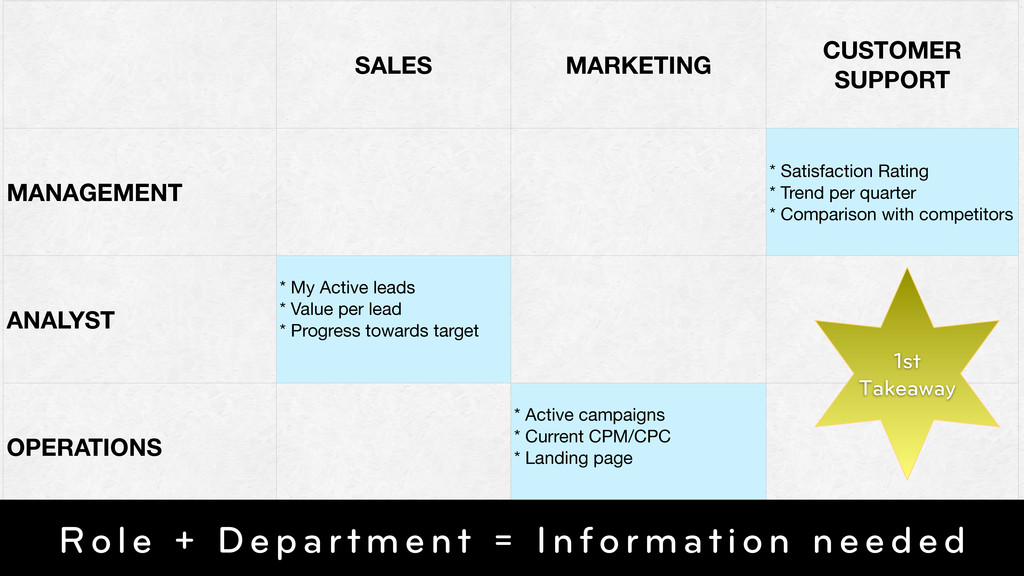
per quarter * Comparison with competitors ANALYST * My Active leads * Value per lead * Progress towards target OPERATIONS * Active campaigns * Current CPM/CPC * Landing page Role + Department = Information needed
per quarter * Comparison with competitors ANALYST * My Active leads * Value per lead * Progress towards target OPERATIONS * Active campaigns * Current CPM/CPC * Landing page Role + Department = Information needed 1st Takeaway
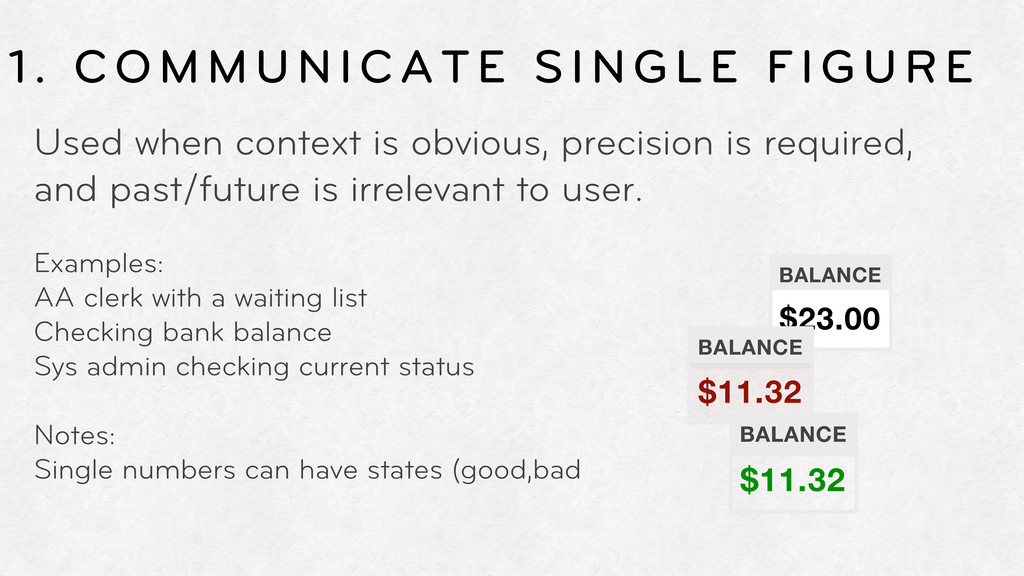
is required, and past/future is irrelevant to user. BALANCE $23.00 BALANCE $11.32 BALANCE $11.32 Examples: AA clerk with a waiting list Checking bank balance Sys admin checking current status Notes: Single numbers can have states (good,bad
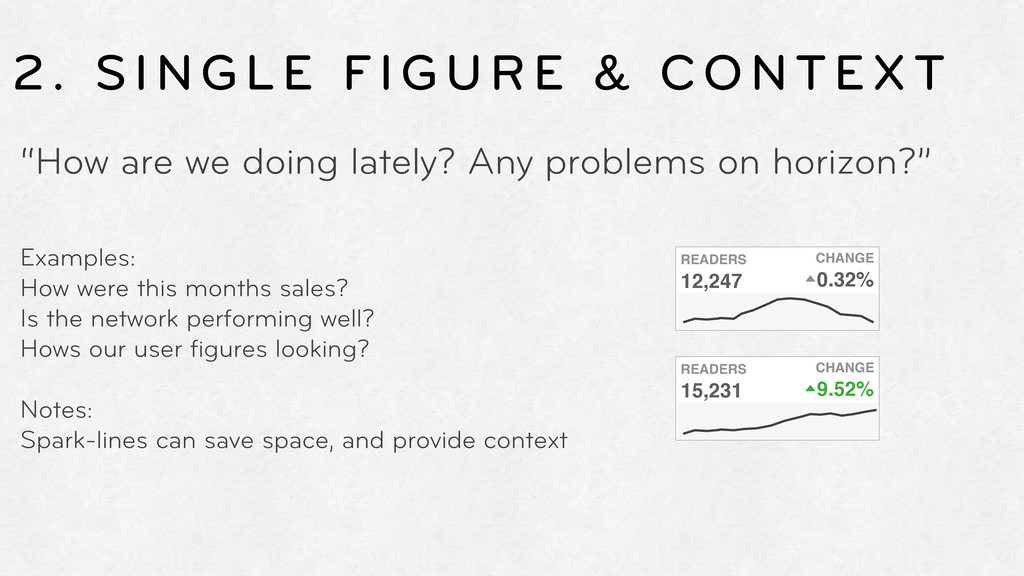
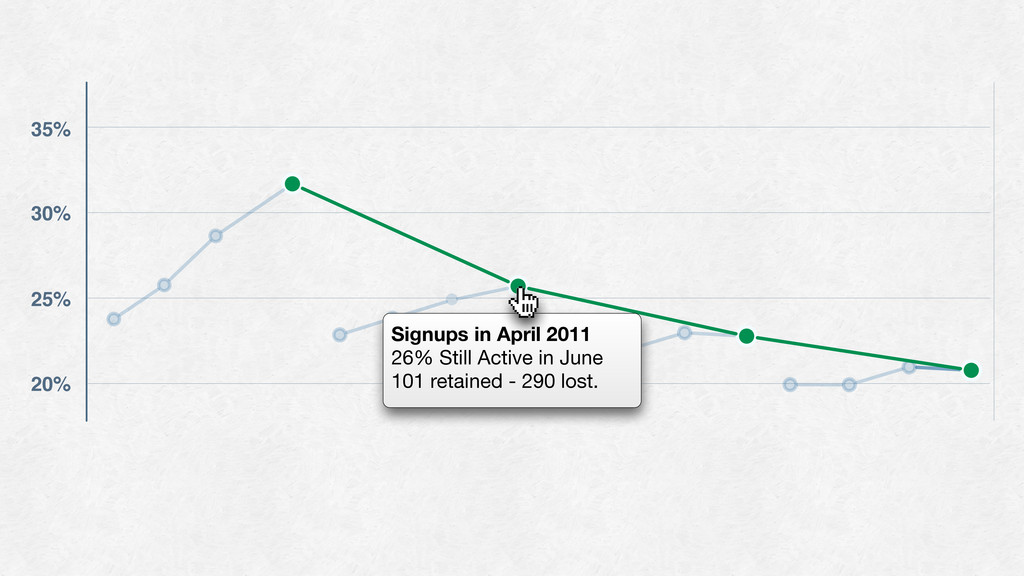
Any problems on horizon?” Examples: How were this months sales? Is the network performing well? Hows our user figures looking? Notes: Spark-lines can save space, and provide context READERS 12,247 CHANGE 0.32% READERS 15,231 CHANGE 9.52%
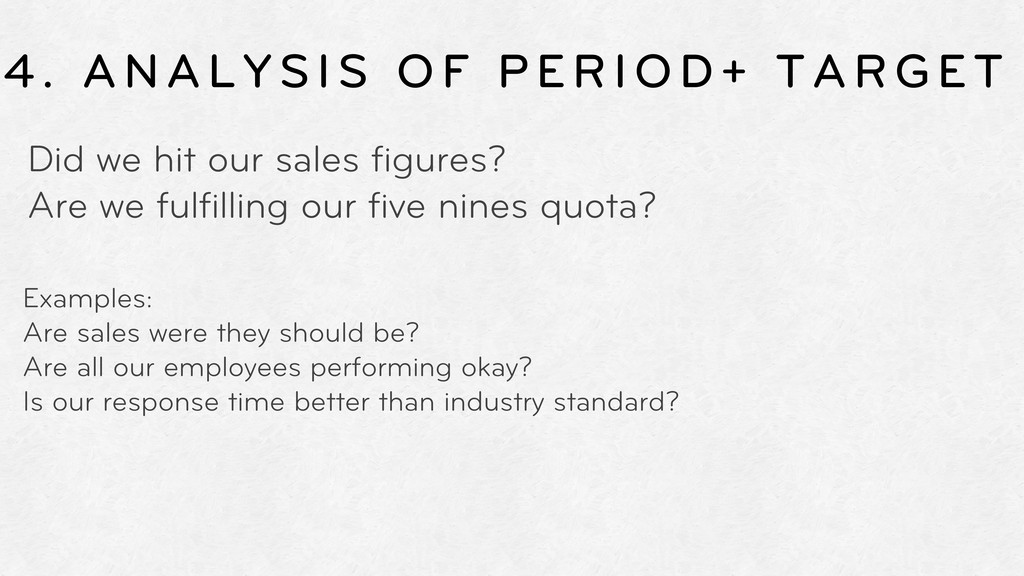
figures? Are we fulfilling our five nines quota? Examples: Are sales were they should be? Are all our employees performing okay? Is our response time better than industry standard?
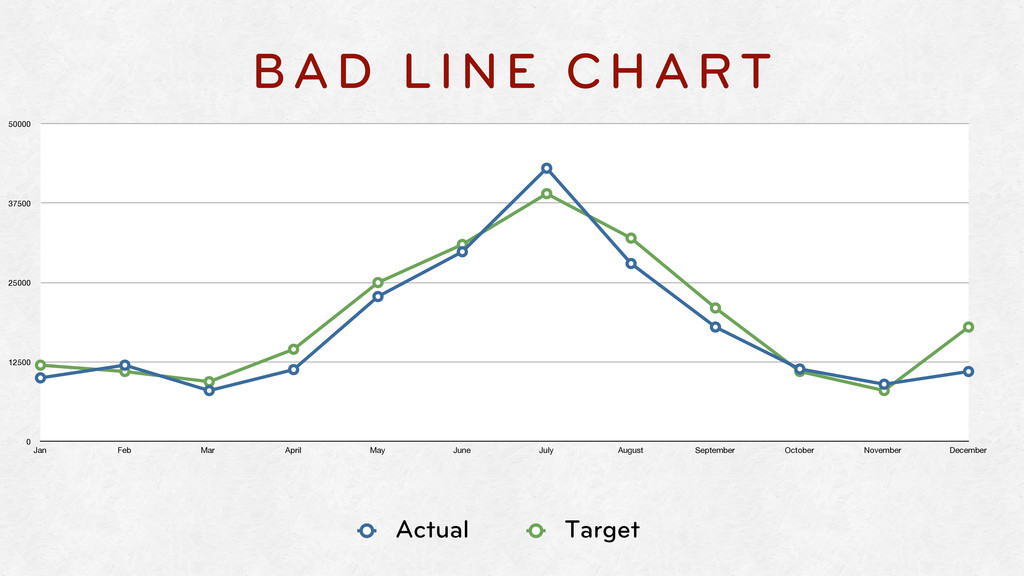
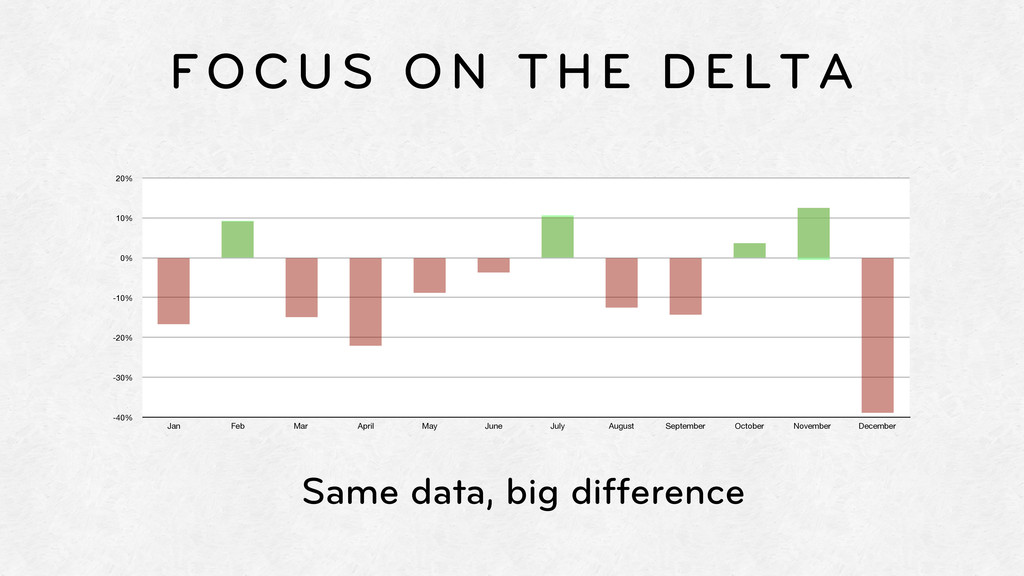
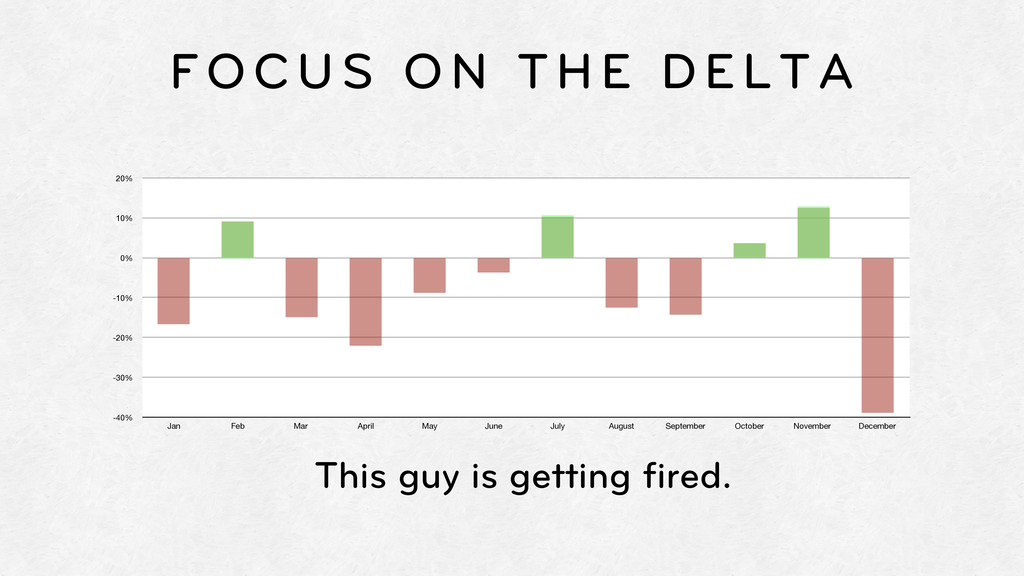
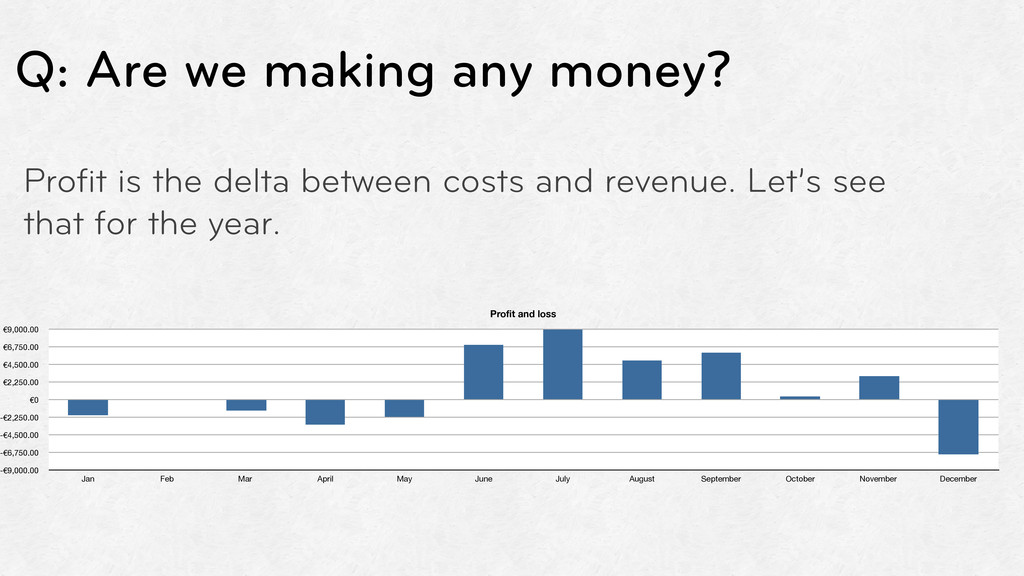
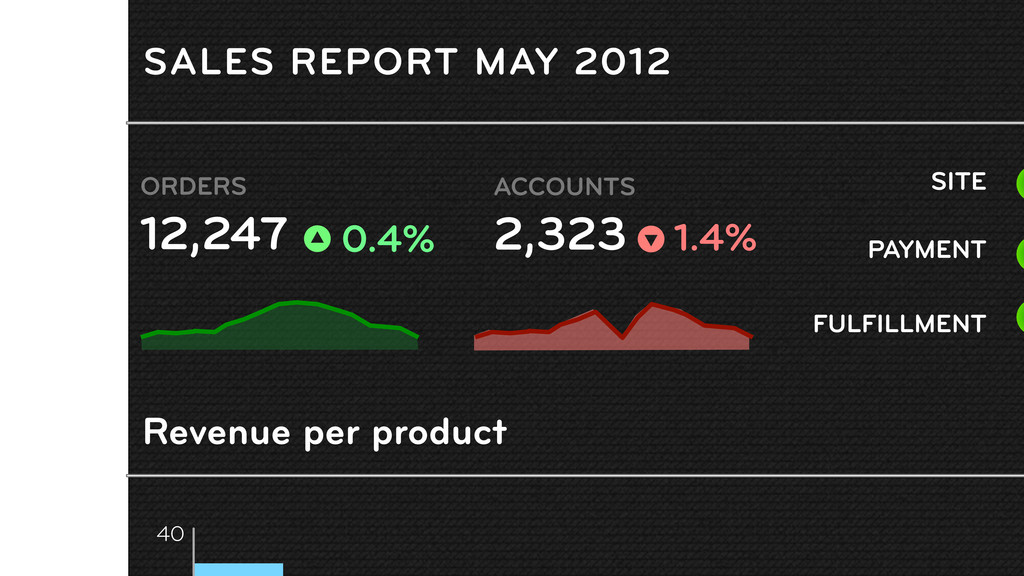
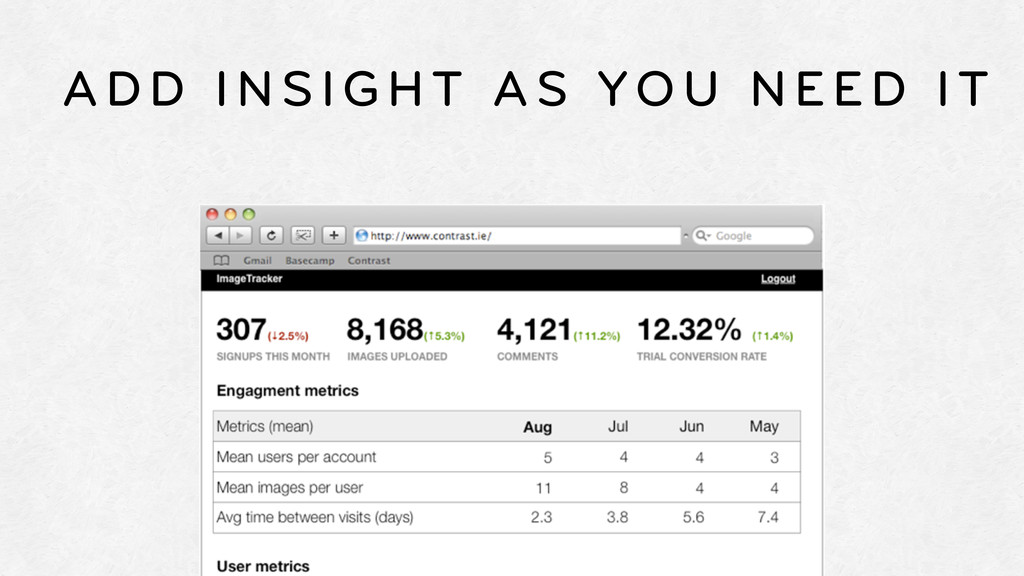
to the reader. At a glance it looks like we’re doing okay here. In this case, we’re talking about a delta, but we’re not showing the delta... 3rd Takeaway
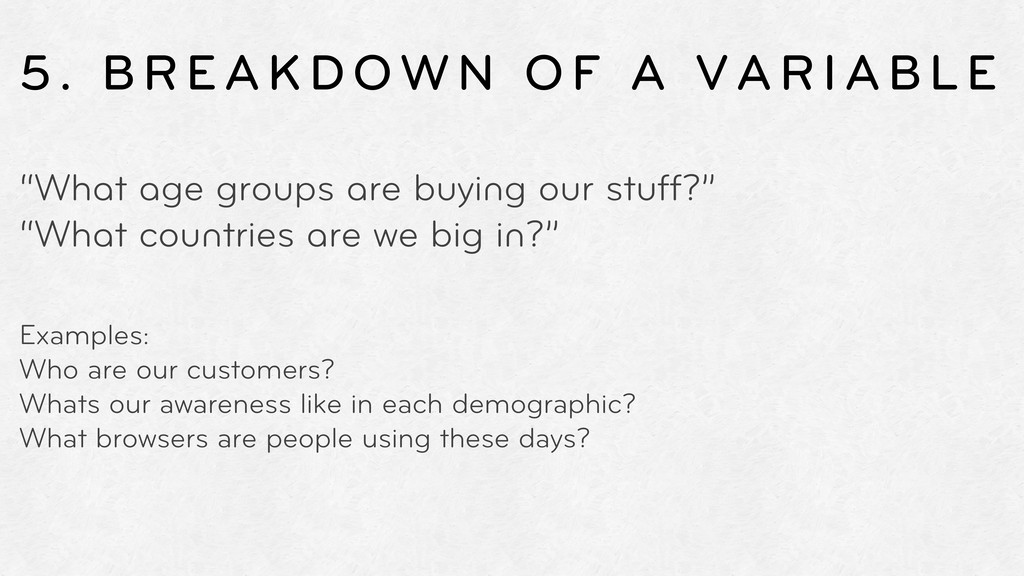
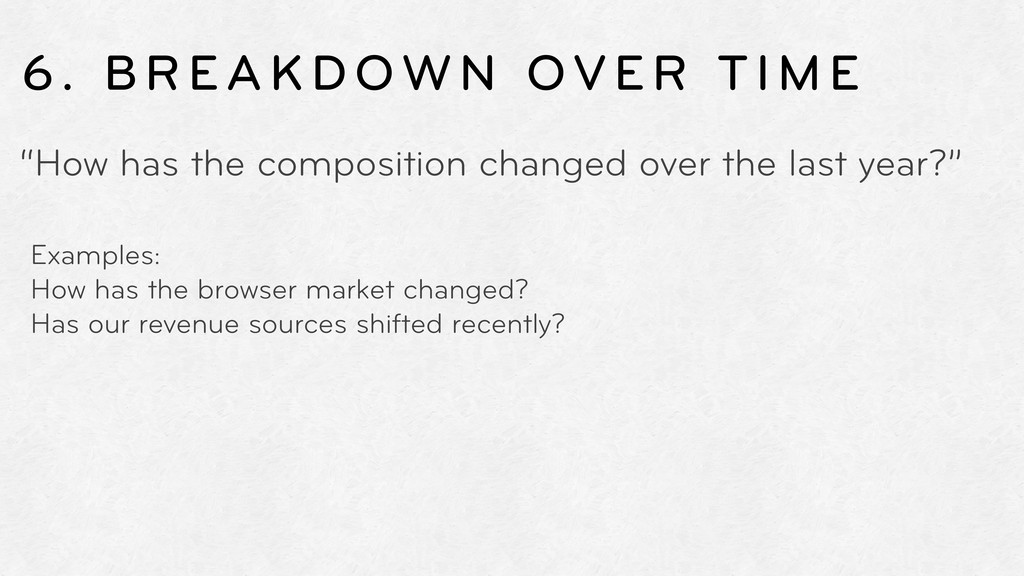
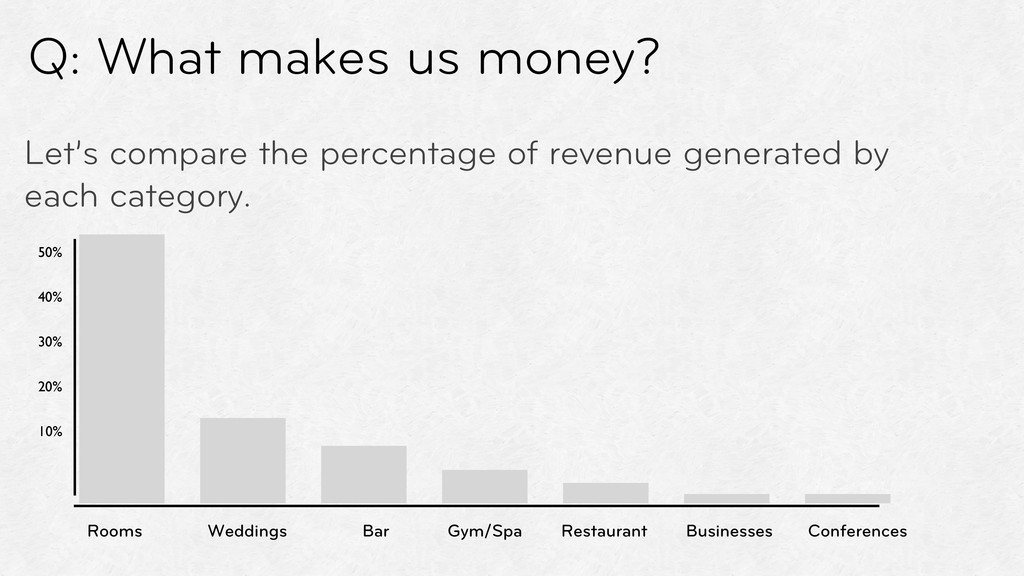
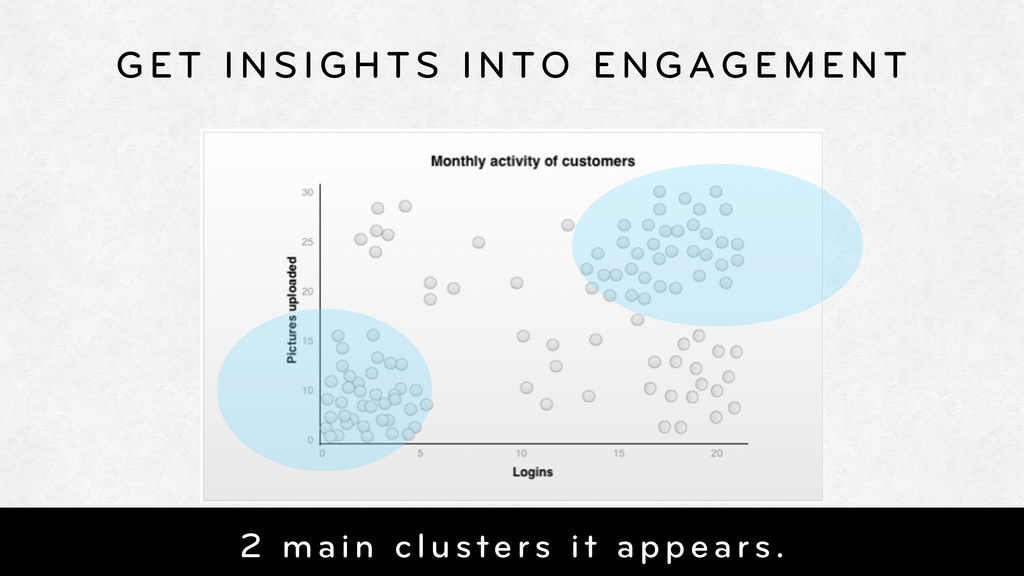
our stuff?” “What countries are we big in?” Examples: Who are our customers? Whats our awareness like in each demographic? What browsers are people using these days?
between costs and revenue. Let’s see that for the year. -€9,000.00 -€6,750.00 -€4,500.00 -€2,250.00 €0 €2,250.00 €4,500.00 €6,750.00 €9,000.00 Jan Feb Mar April May June July August September October November December Profit and loss
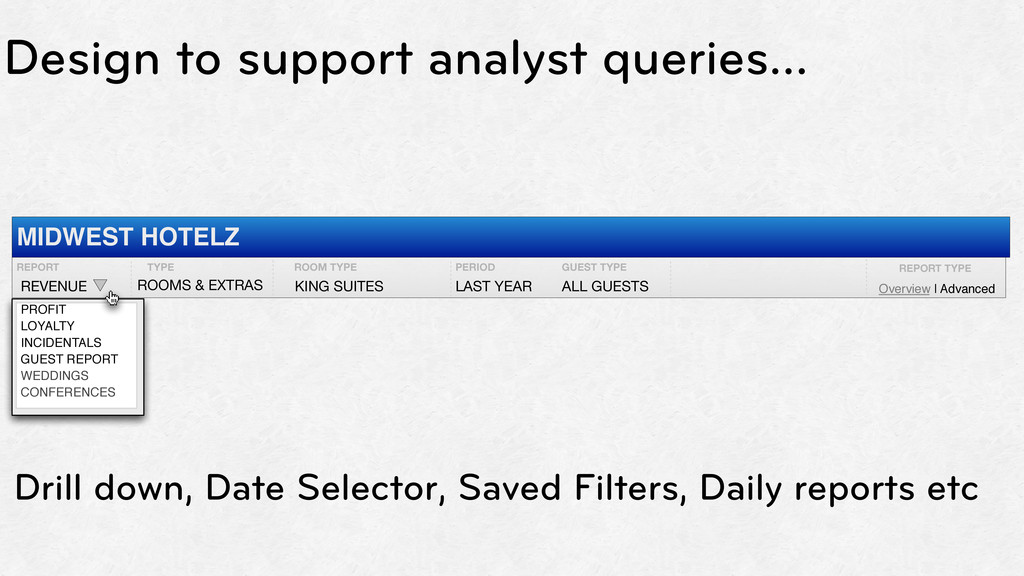
PERIOD LAST YEAR Overview | Advanced REPORT TYPE MIDWEST HOTELZ PROFIT LOYALTY INCIDENTALS GUEST REPORT WEDDINGS CONFERENCES GUEST TYPE ALL GUESTS Design to support analyst queries... Drill down, Date Selector, Saved Filters, Daily reports etc
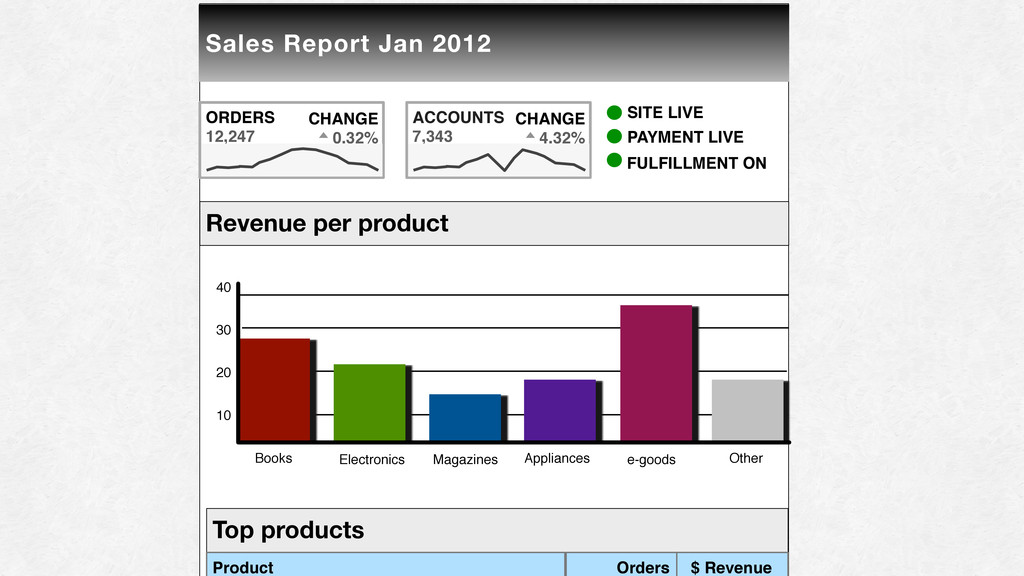
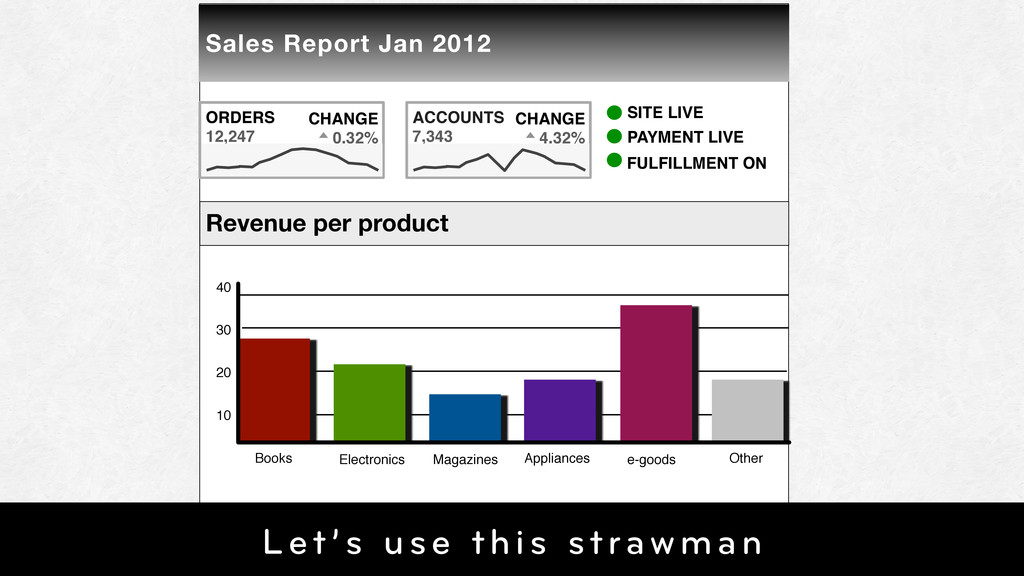
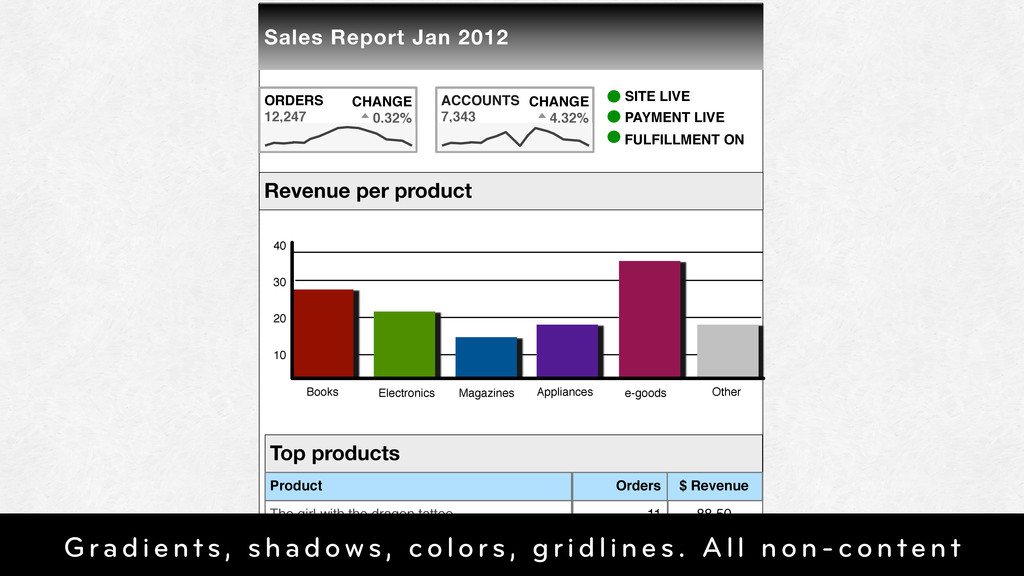
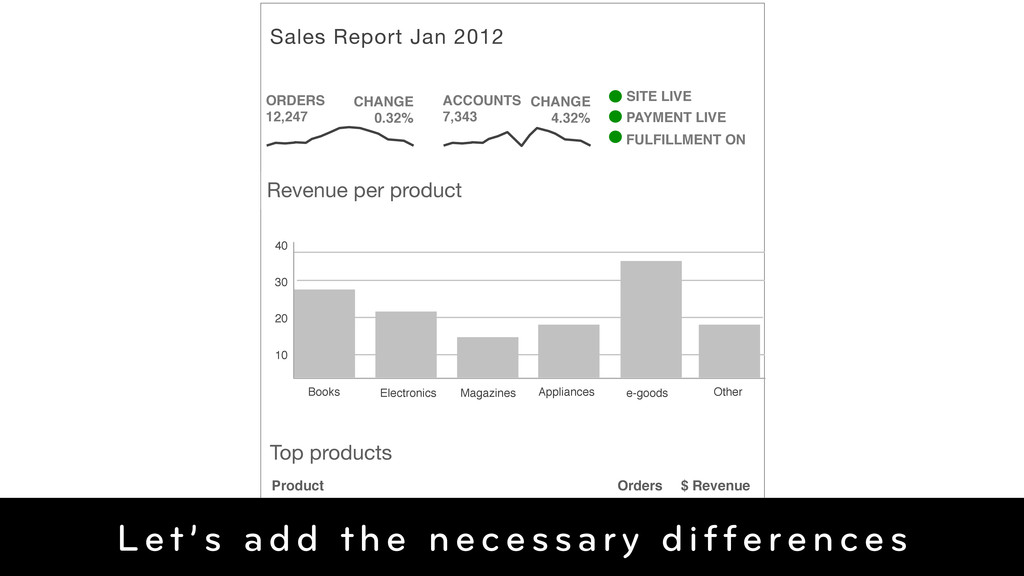
e-goods Other 10 20 30 40 Revenue per product Sales Report Jan 2012 ORDERS 12,247 CHANGE 0.32% ACCOUNTS 7,343 CHANGE 4.32% SITE LIVE PAYMENT LIVE FULFILLMENT ON
e-goods Other 10 20 30 40 Revenue per product Sales Report Jan 2012 ORDERS 12,247 CHANGE 0.32% ACCOUNTS 7,343 CHANGE 4.32% SITE LIVE PAYMENT LIVE FULFILLMENT ON Let’s use this strawman
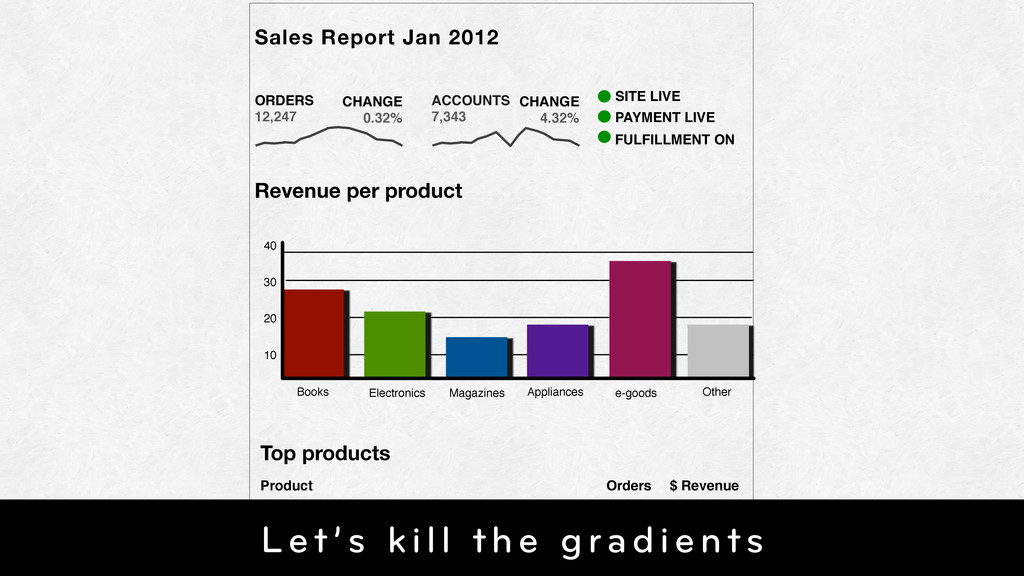
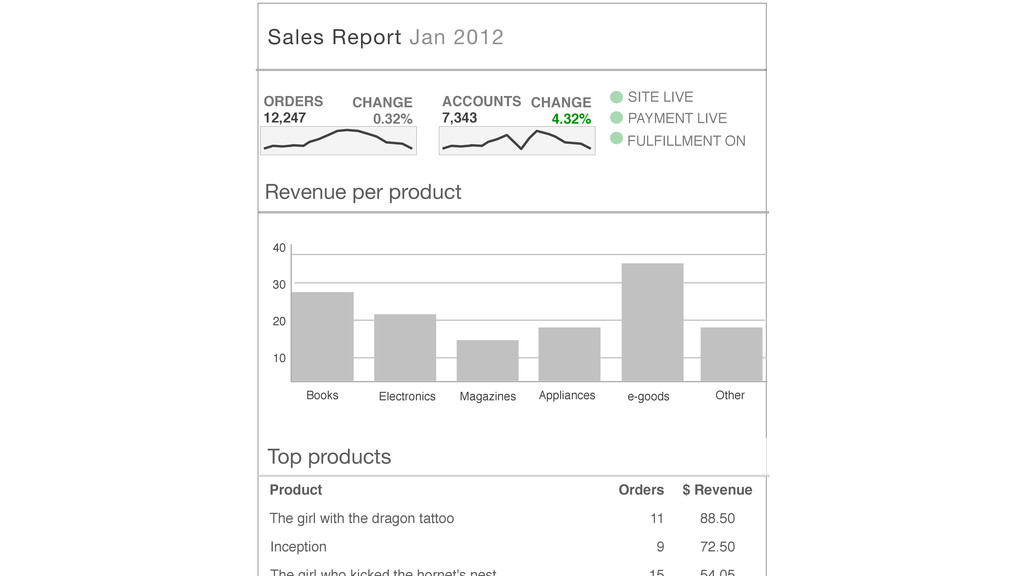
dragon tattoo 11 88.50 Inception 9 72.50 The girl who kicked the hornet's nest 15 54.05 Books Electronics Magazines Appliances e-goods Other 10 20 30 40 Revenue per product Sales Report Jan 2012 ORDERS 12,247 CHANGE 0.32% ACCOUNTS 7,343 CHANGE 4.32% SITE LIVE PAYMENT LIVE FULFILLMENT ON Gradients, shadows, colors, gridlines. All non-content
dragon tattoo 11 88.50 Inception 9 72.50 The girl who kicked the hornet's nest 15 54.05 Books Electronics Magazines Appliances e-goods Other 10 20 30 40 Revenue per product Sales Report Jan 2012 ORDERS 12,247 CHANGE 0.32% ACCOUNTS 7,343 CHANGE 4.32% SITE LIVE PAYMENT LIVE FULFILLMENT ON Let’s kill the gradients
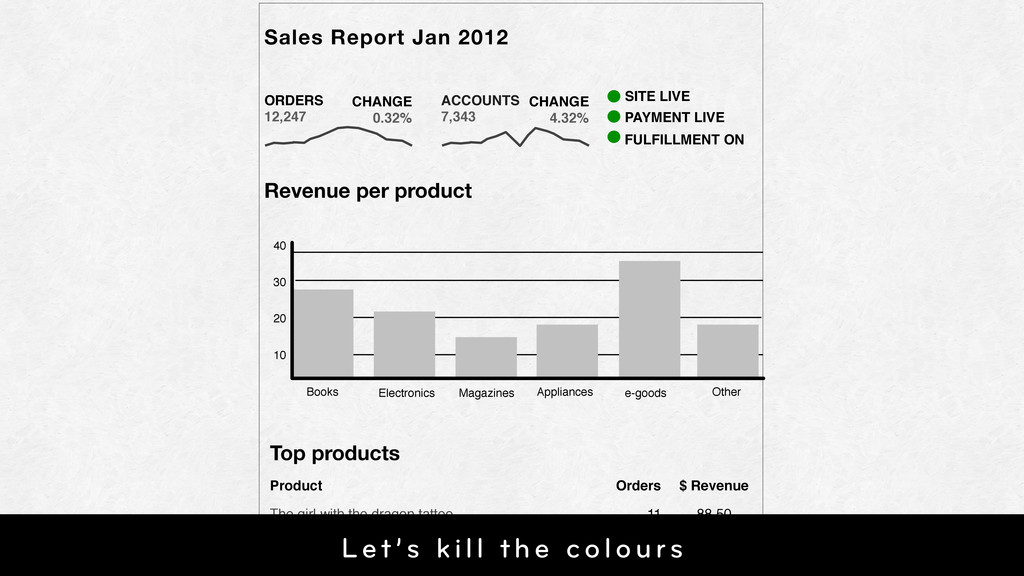
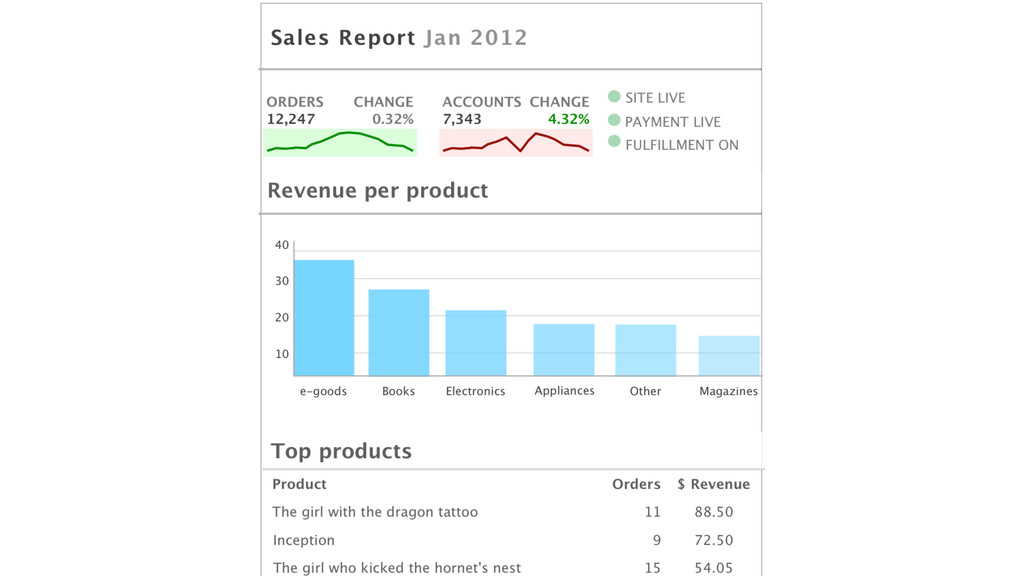
dragon tattoo 11 88.50 Inception 9 72.50 The girl who kicked the hornet's nest 15 54.05 Books Electronics Magazines Appliances e-goods Other 10 20 30 40 Revenue per product Sales Report Jan 2012 ORDERS 12,247 CHANGE 0.32% ACCOUNTS 7,343 CHANGE 4.32% SITE LIVE PAYMENT LIVE FULFILLMENT ON Let’s kill the colours
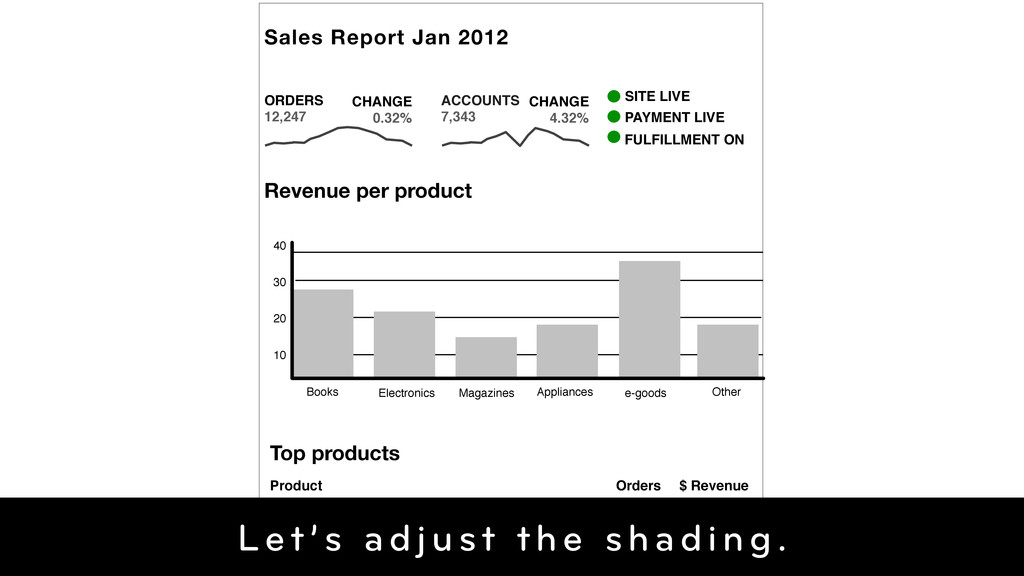
dragon tattoo 11 88.50 Inception 9 72.50 The girl who kicked the hornet's nest 15 54.05 Books Electronics Magazines Appliances e-goods Other 10 20 30 40 Revenue per product Sales Report Jan 2012 ORDERS 12,247 CHANGE 0.32% ACCOUNTS 7,343 CHANGE 4.32% SITE LIVE PAYMENT LIVE FULFILLMENT ON Let’s adjust the shading.
dragon tattoo 11 88.50 Inception 9 72.50 The girl who kicked the hornet's nest 15 54.05 Books Electronics Magazines Appliances e-goods Other 10 20 30 40 Revenue per product Sales Report Jan 2012 ORDERS 12,247 CHANGE 0.32% ACCOUNTS 7,343 CHANGE 4.32% SITE LIVE PAYMENT LIVE FULFILLMENT ON Let’s add the necessary differences
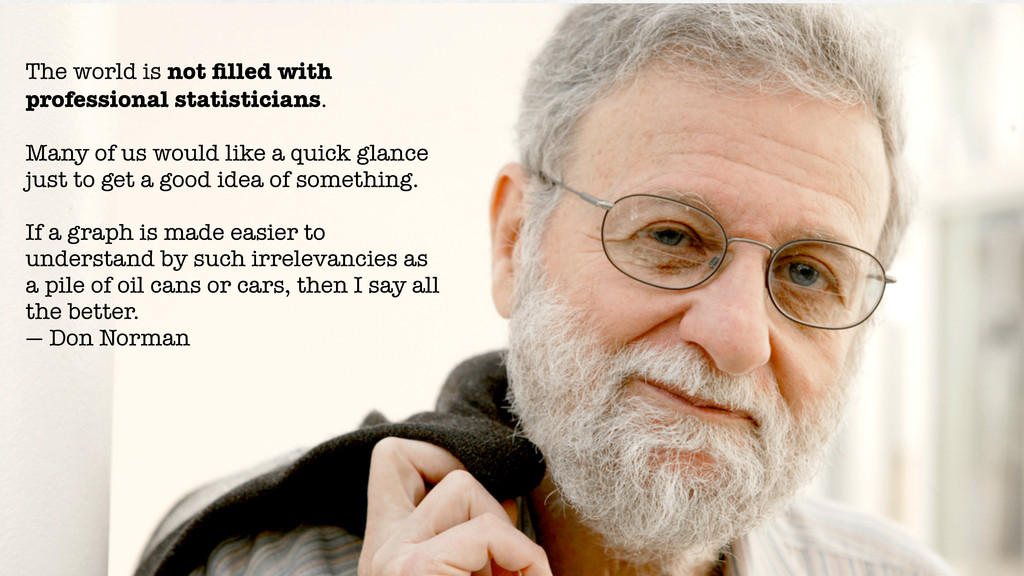
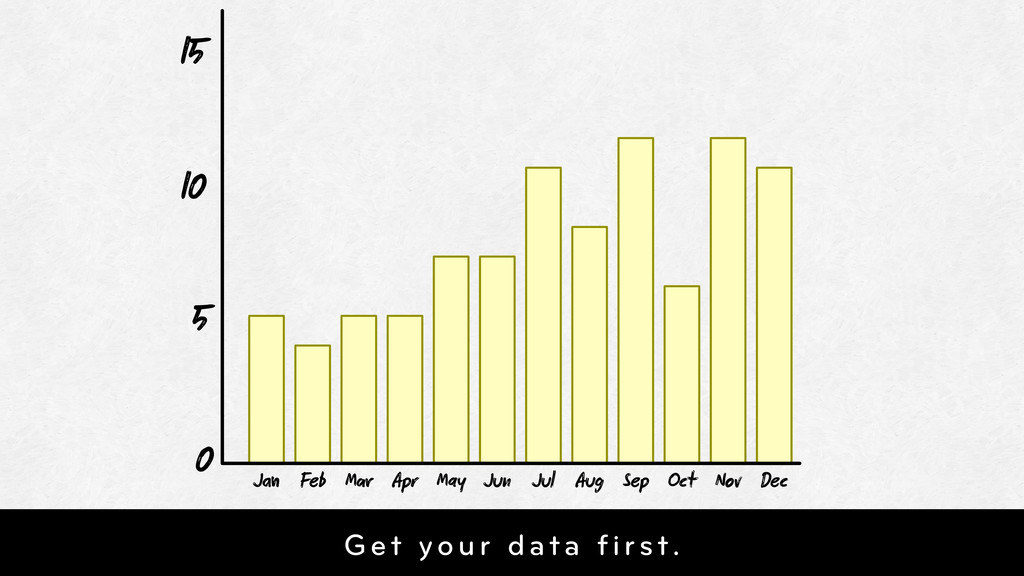
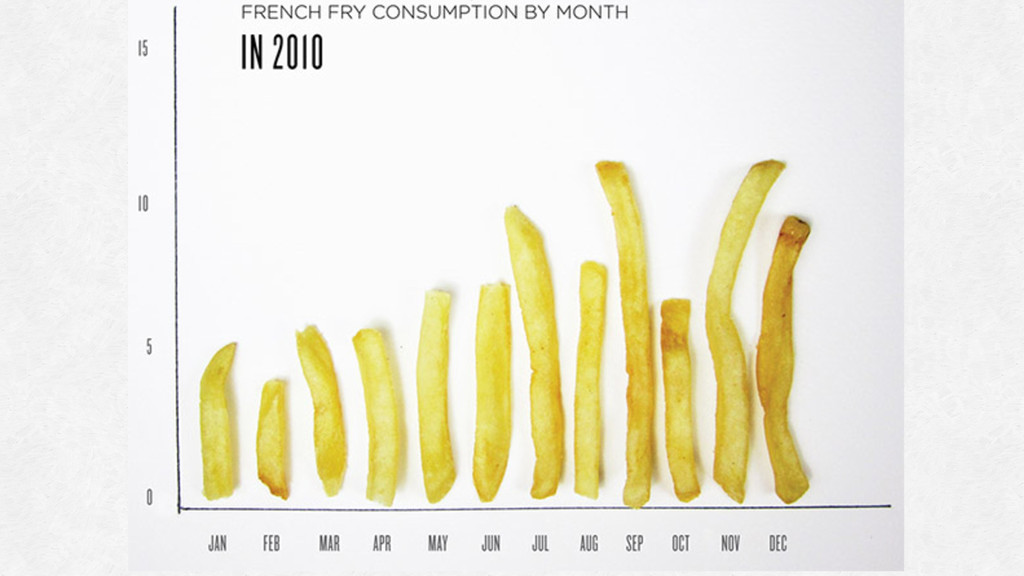
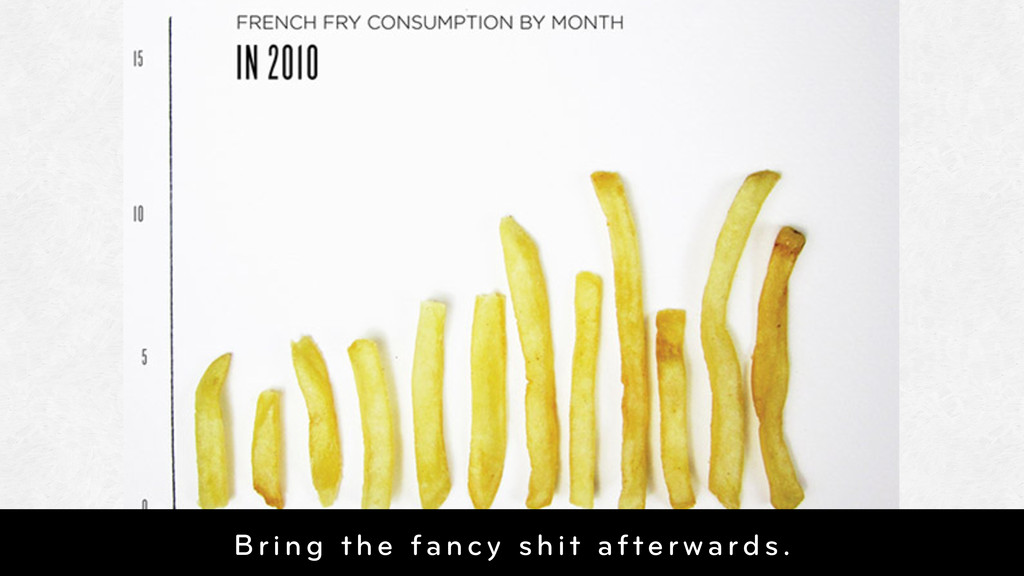
us would like a quick glance just to get a good idea of something. If a graph is made easier to understand by such irrelevancies as a pile of oil cans or cars, then I say all the better. — Don Norman
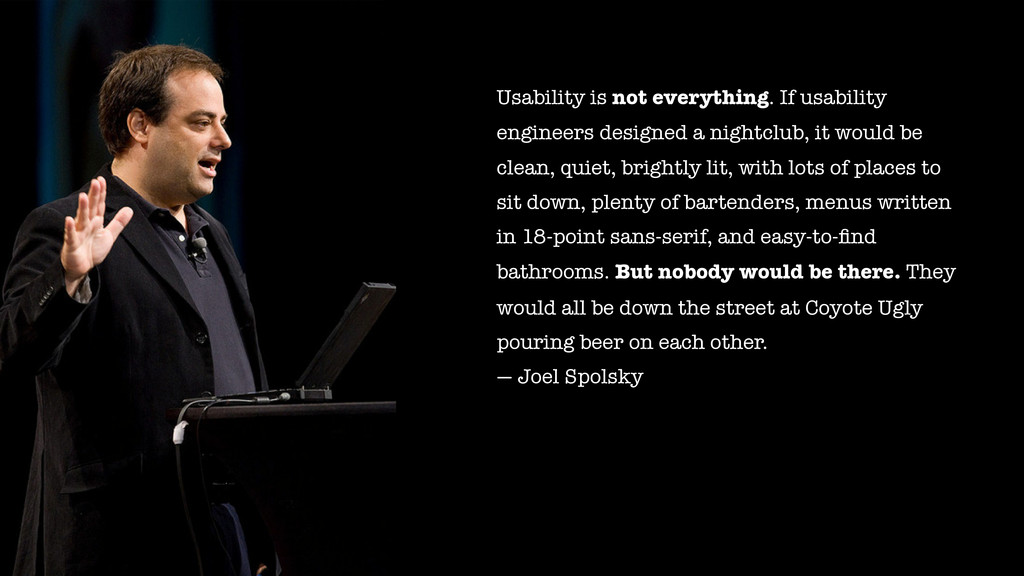
it would be clean, quiet, brightly lit, with lots of places to sit down, plenty of bartenders, menus written in 18-point sans-serif, and easy-to-find bathrooms. But nobody would be there. They would all be down the street at Coyote Ugly pouring beer on each other. — Joel Spolsky
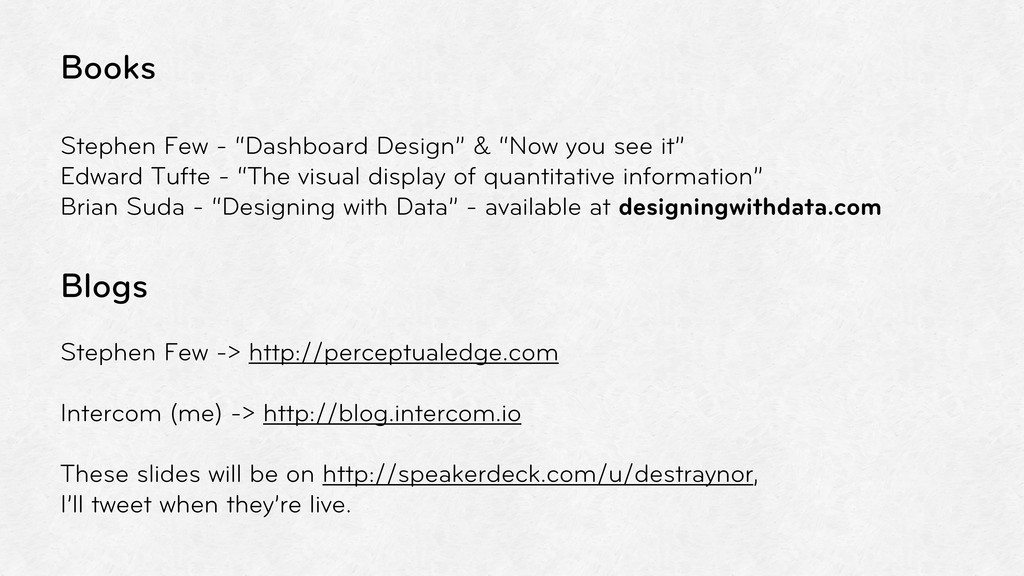
it” Edward Tufte - “The visual display of quantitative information” Brian Suda - “Designing with Data” - available at designingwithdata.com Blogs Stephen Few -> http://perceptualedge.com Intercom (me) -> http://blog.intercom.io These slides will be on http://speakerdeck.com/u/destraynor, I’ll tweet when they’re live.