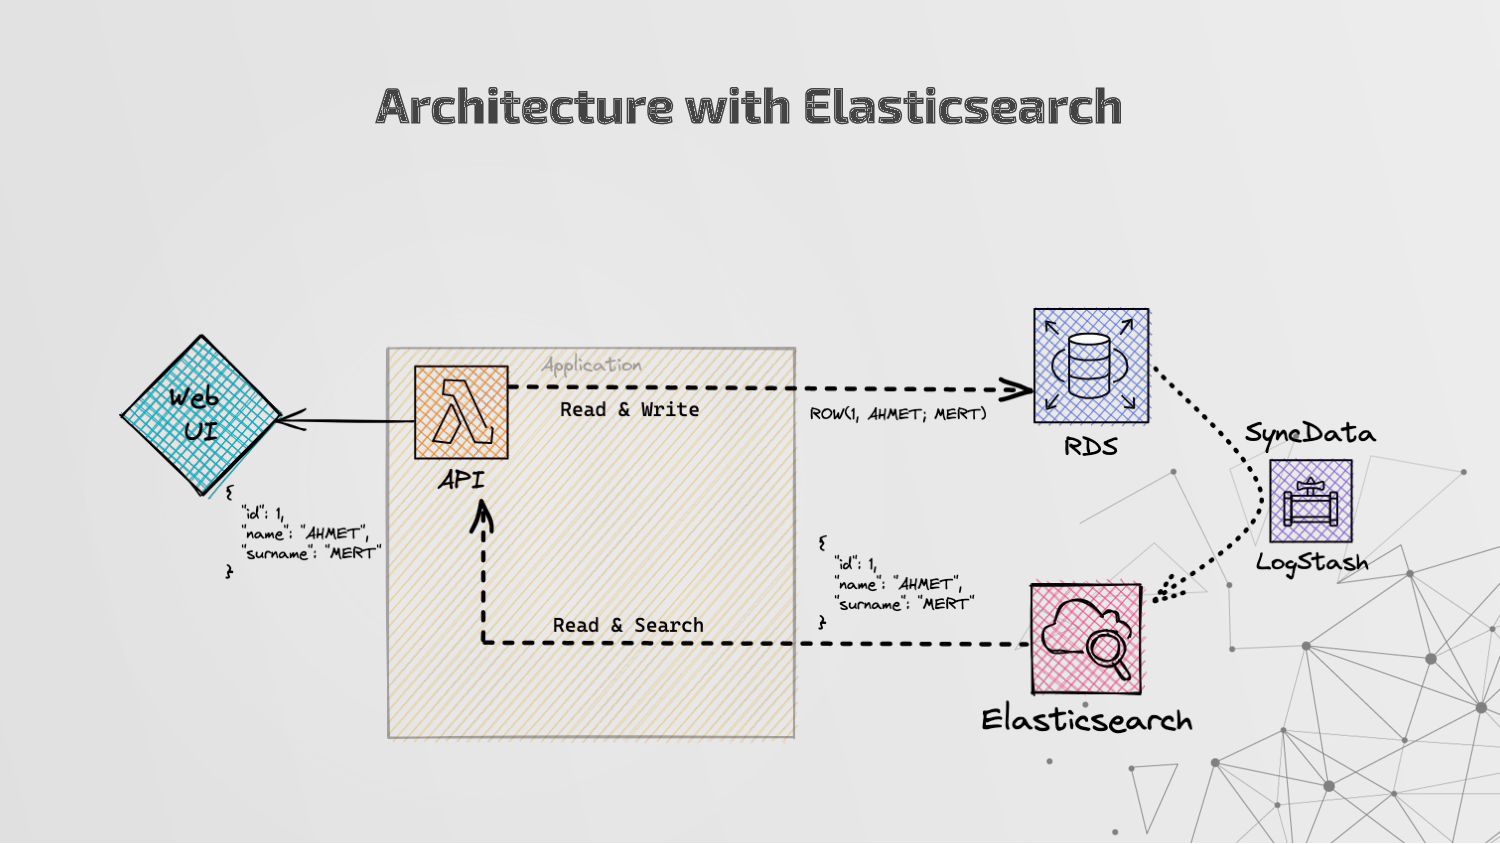
faster than an RDBMS • Improved scalability: Elasticsearch is designed to scale horizontally, meaning that you can add more nodes to your cluster as your data grows, without sacrificing performance. • Better analytics capabilities: Elasticsearch offers a wide range of analytics features, including the ability to perform aggregations, generate histograms, and create geospatial queries. • Full-text search capabilities: Elasticsearch is optimized for full-text search, which means that users can perform complex queries that take into account factors like proximity, synonymy, and fuzzy matching. Benefits of Combining Elasticsearch with RDBMS
Here some configs: ◦ network.host : 127.0.0.1, 0.0.0.0 ◦ http.port : HTTP API port ◦ discovery.seed_hosts : to provide a list of other nodes in the cluster ◦ cluster.initial_master_nodes : While initialize a cluster you need to put here first nodes as a master eligible node. You should not use this setting when restarting a cluster or adding a new node to an existing cluster. ◦ gateway.recover_after_data_nodes : Recover as long as this many data nodes have joined the cluster. You can use _recovery endpoint to get active recovery tasks for the shards. ◦ action.destructive_requires_name : This prevent the delete requests with “*”. DELETE accounts-* Elasticsearch Configuration
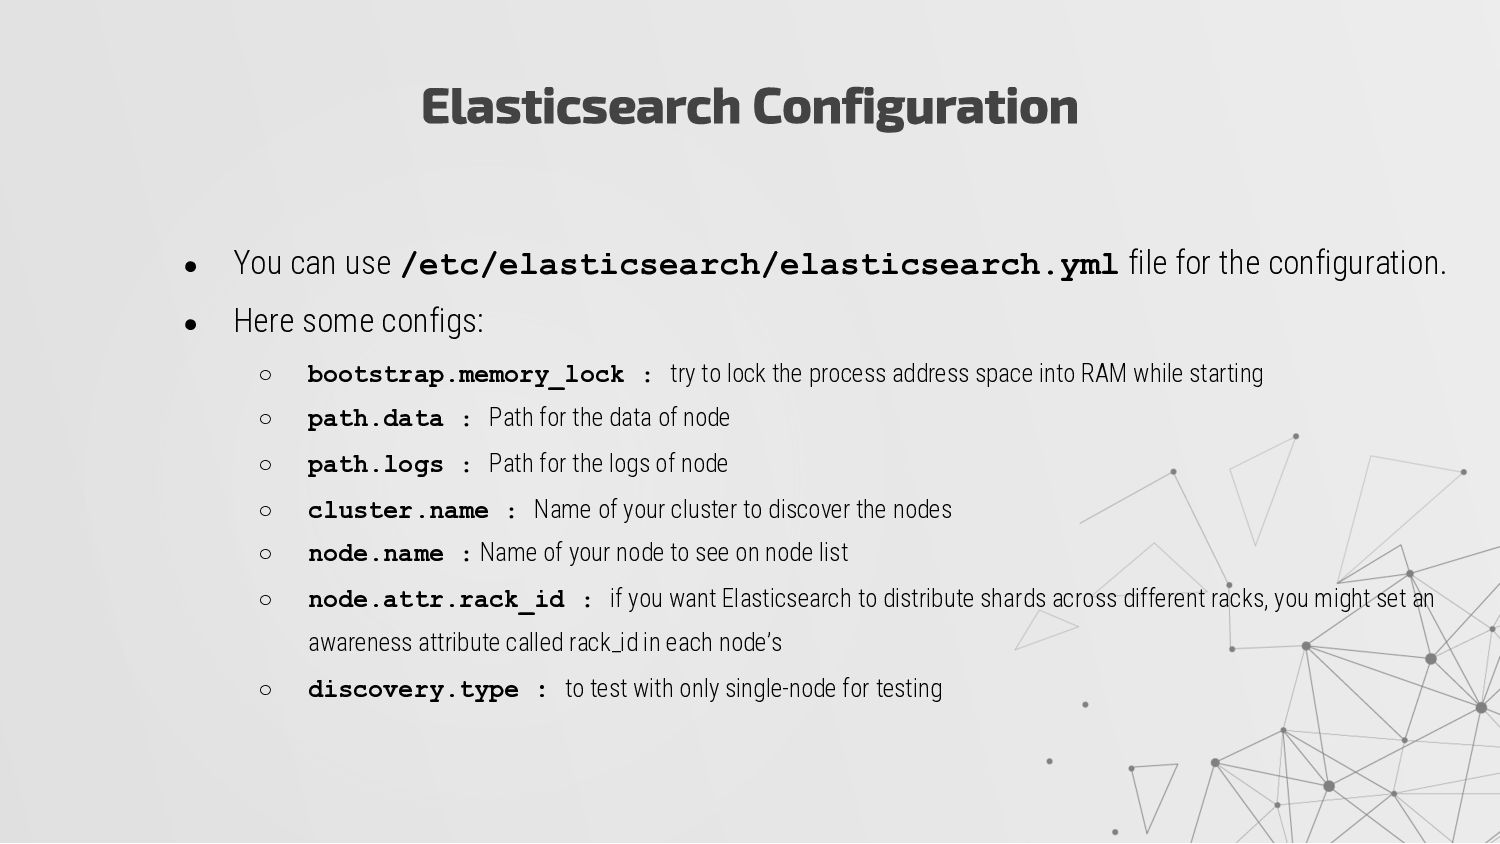
Here some configs: ◦ bootstrap.memory_lock : try to lock the process address space into RAM while starting ◦ path.data : Path for the data of node ◦ path.logs : Path for the logs of node ◦ cluster.name : Name of your cluster to discover the nodes ◦ node.name : Name of your node to see on node list ◦ node.attr.rack_id : if you want Elasticsearch to distribute shards across different racks, you might set an awareness attribute called rack_id in each node’s ◦ discovery.type : to test with only single-node for testing Elasticsearch Configuration
dependent on the JVM configuration. • JVM configuration affects how Elasticsearch uses memory, CPU, and other system resources. • Common JVM configuration parameters that can impact Elasticsearch performance include heap size, garbage collection settings, and thread stack size.
Here some configs: ◦ -Xms2g: the initial size of total heap space ◦ -Xmx2g: the maximum size of total heap space ◦ 14-:-XX:+UseG1GC: to use G1GC as a garbage collector ◦ -XX:+UseConcMarkSweepGC: to use Concurrent Mark Sweep(CMS) as a garbage collector ◦ 8-13:-XX:CMSInitiatingOccupancyFraction=75: to sets the percentage of the old generation occupancy (0 to 100) at which to start a CMS collection cycle ◦ -XX:+HeapDumpOnOutOfMemoryError: to generate a heap dump when you get an OOM error ◦ -XX:HeapDumpPath=/heap/dump/path: this is the path of output of heap dumps JVM Options
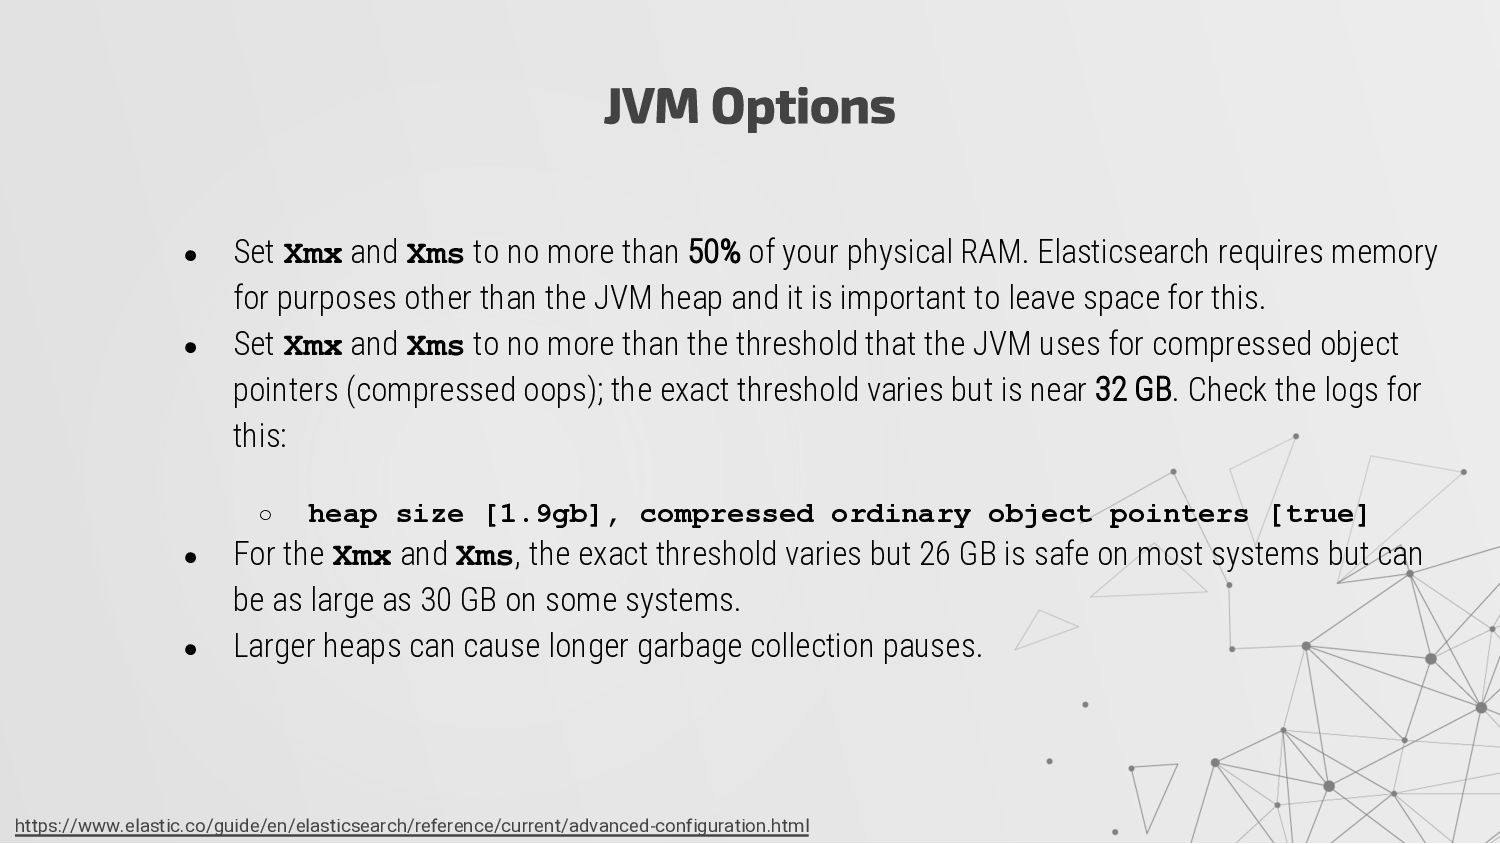
of your physical RAM. Elasticsearch requires memory for purposes other than the JVM heap and it is important to leave space for this. • Set Xmx and Xms to no more than the threshold that the JVM uses for compressed object pointers (compressed oops); the exact threshold varies but is near 32 GB. Check the logs for this: ◦ heap size [1.9gb], compressed ordinary object pointers [true] • For the Xmx and Xms, the exact threshold varies but 26 GB is safe on most systems but can be as large as 30 GB on some systems. • Larger heaps can cause longer garbage collection pauses. JVM Options https://www.elastic.co/guide/en/elasticsearch/reference/current/advanced-configuration.html
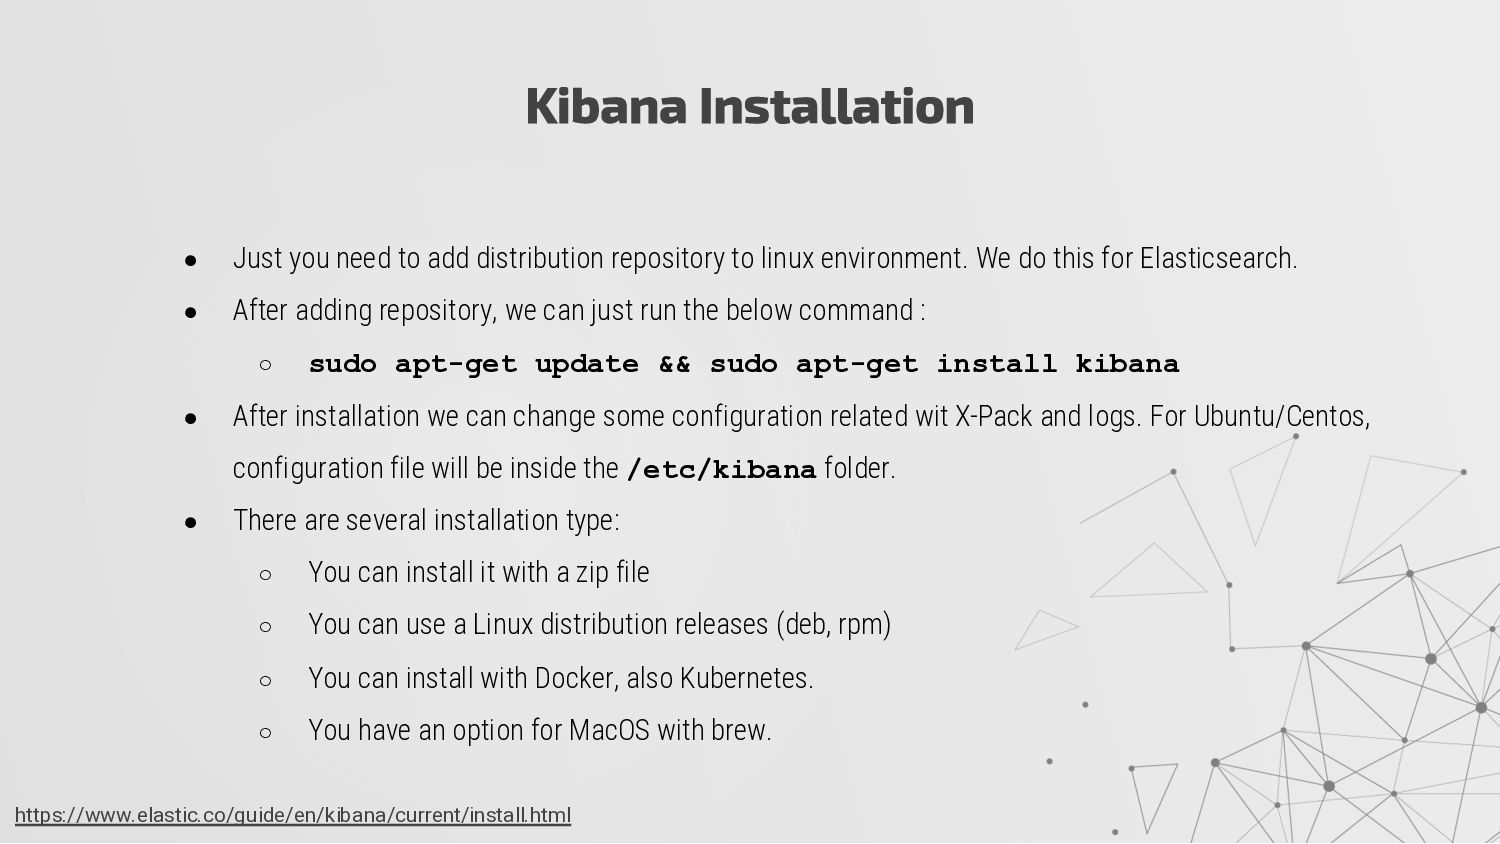
environment. We do this for Elasticsearch. • After adding repository, we can just run the below command : ◦ sudo apt-get update && sudo apt-get install kibana • After installation we can change some configuration related wit X-Pack and logs. For Ubuntu/Centos, configuration file will be inside the /etc/kibana folder. • There are several installation type: ◦ You can install it with a zip file ◦ You can use a Linux distribution releases (deb, rpm) ◦ You can install with Docker, also Kubernetes. ◦ You have an option for MacOS with brew. Kibana Installation https://www.elastic.co/guide/en/kibana/current/install.html
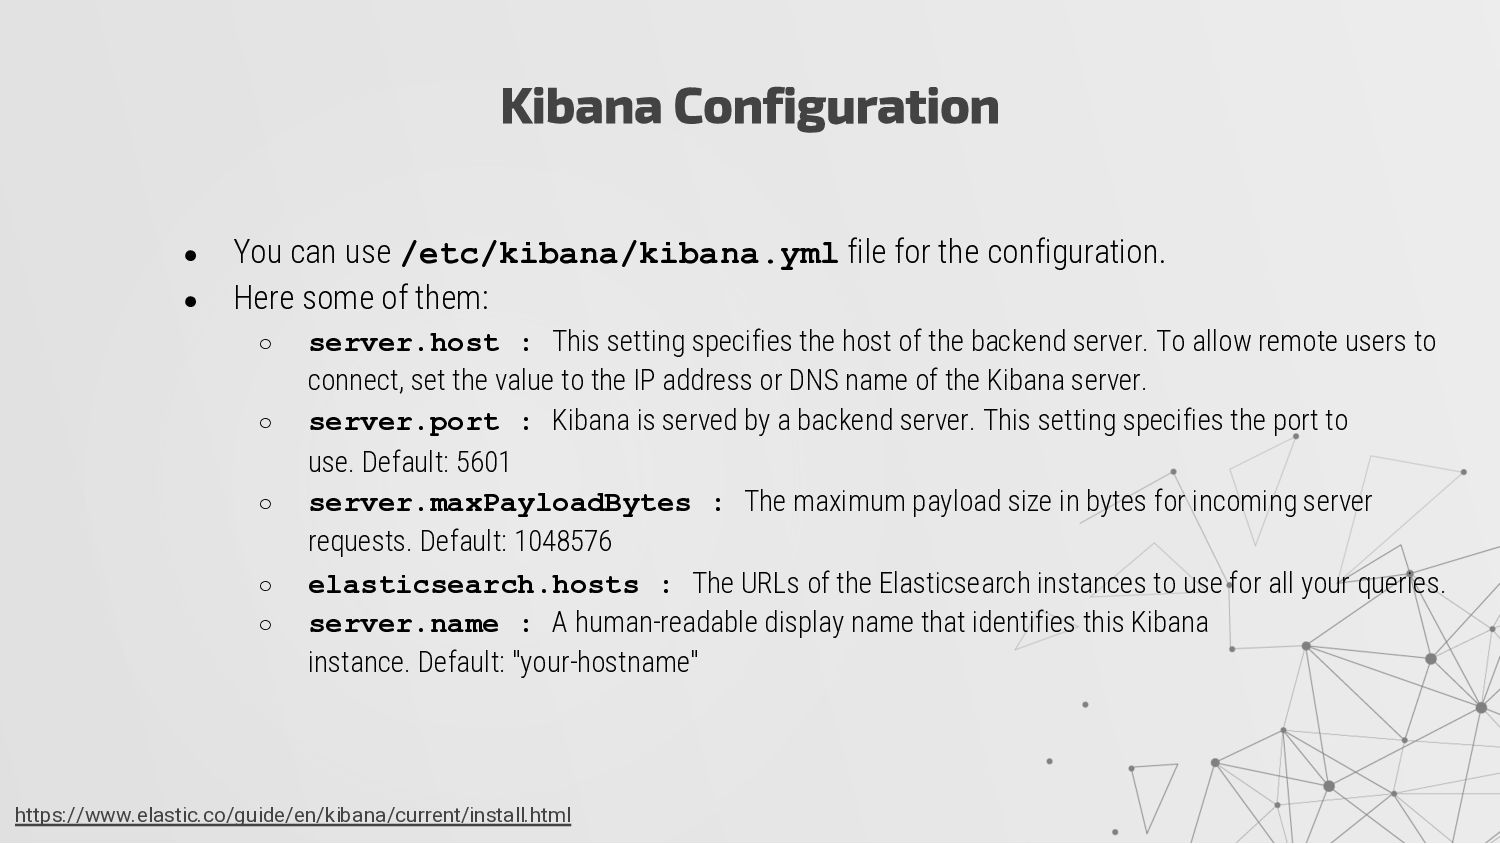
Here some of them: ◦ server.host : This setting specifies the host of the backend server. To allow remote users to connect, set the value to the IP address or DNS name of the Kibana server. ◦ server.port : Kibana is served by a backend server. This setting specifies the port to use. Default: 5601 ◦ server.maxPayloadBytes : The maximum payload size in bytes for incoming server requests. Default: 1048576 ◦ elasticsearch.hosts : The URLs of the Elasticsearch instances to use for all your queries. ◦ server.name : A human-readable display name that identifies this Kibana instance. Default: "your-hostname" Kibana Configuration https://www.elastic.co/guide/en/kibana/current/install.html
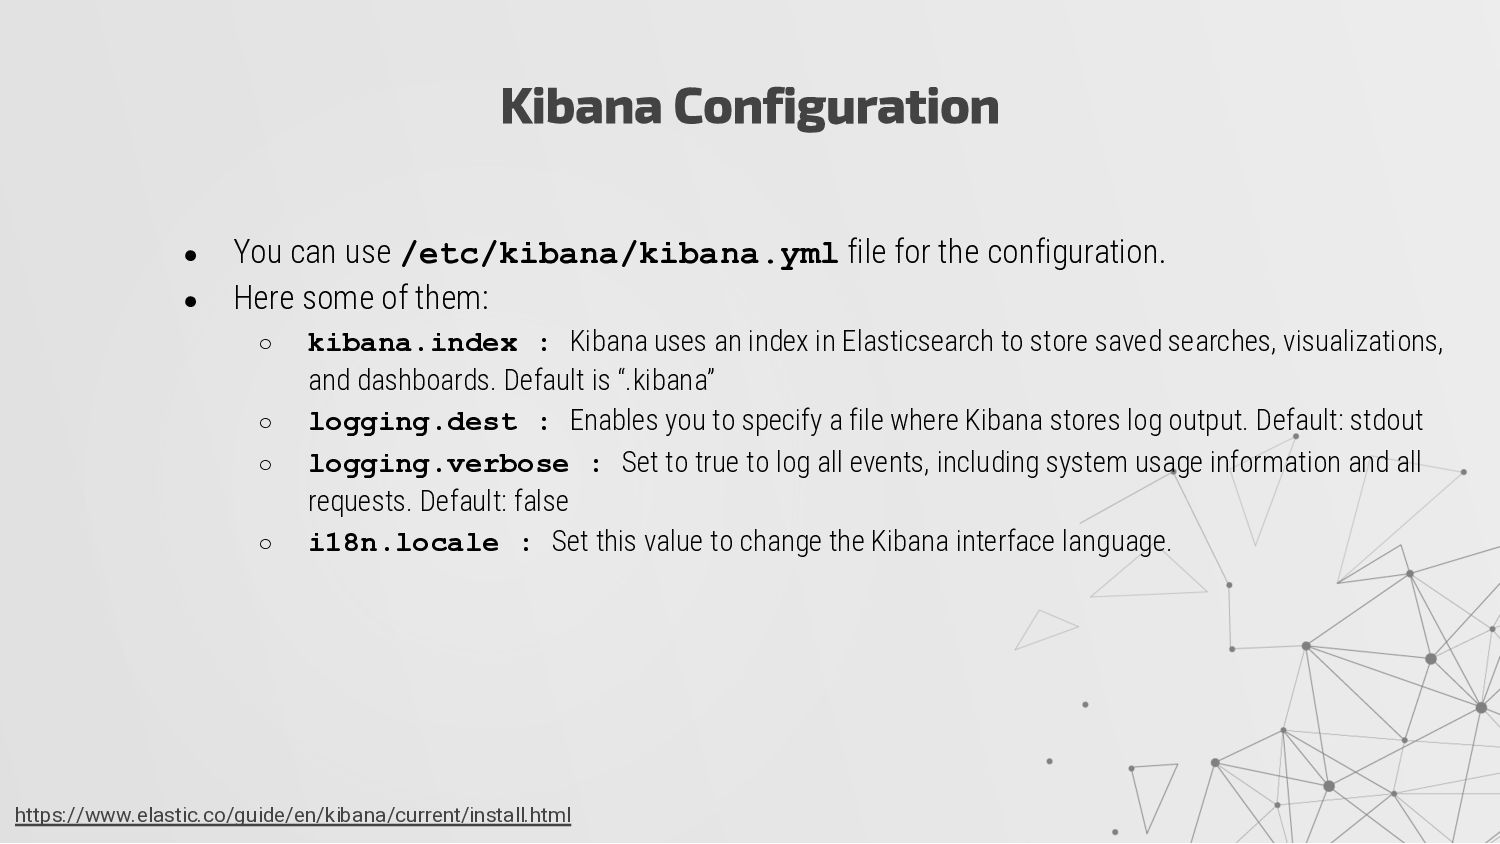
Here some of them: ◦ kibana.index : Kibana uses an index in Elasticsearch to store saved searches, visualizations, and dashboards. Default is “.kibana” ◦ logging.dest : Enables you to specify a file where Kibana stores log output. Default: stdout ◦ logging.verbose : Set to true to log all events, including system usage information and all requests. Default: false ◦ i18n.locale : Set this value to change the Kibana interface language. Kibana Configuration https://www.elastic.co/guide/en/kibana/current/install.html
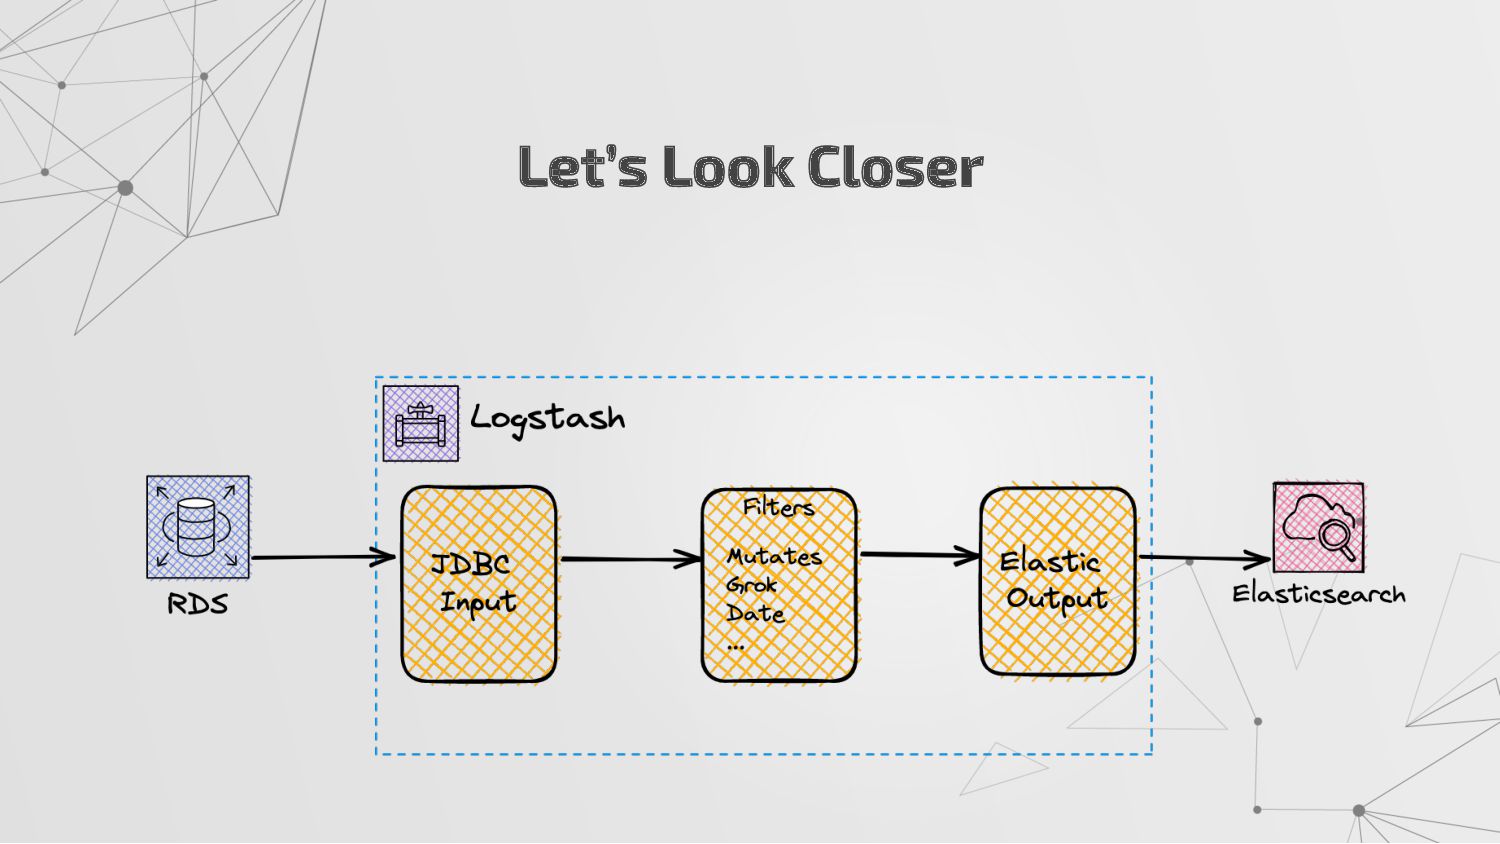
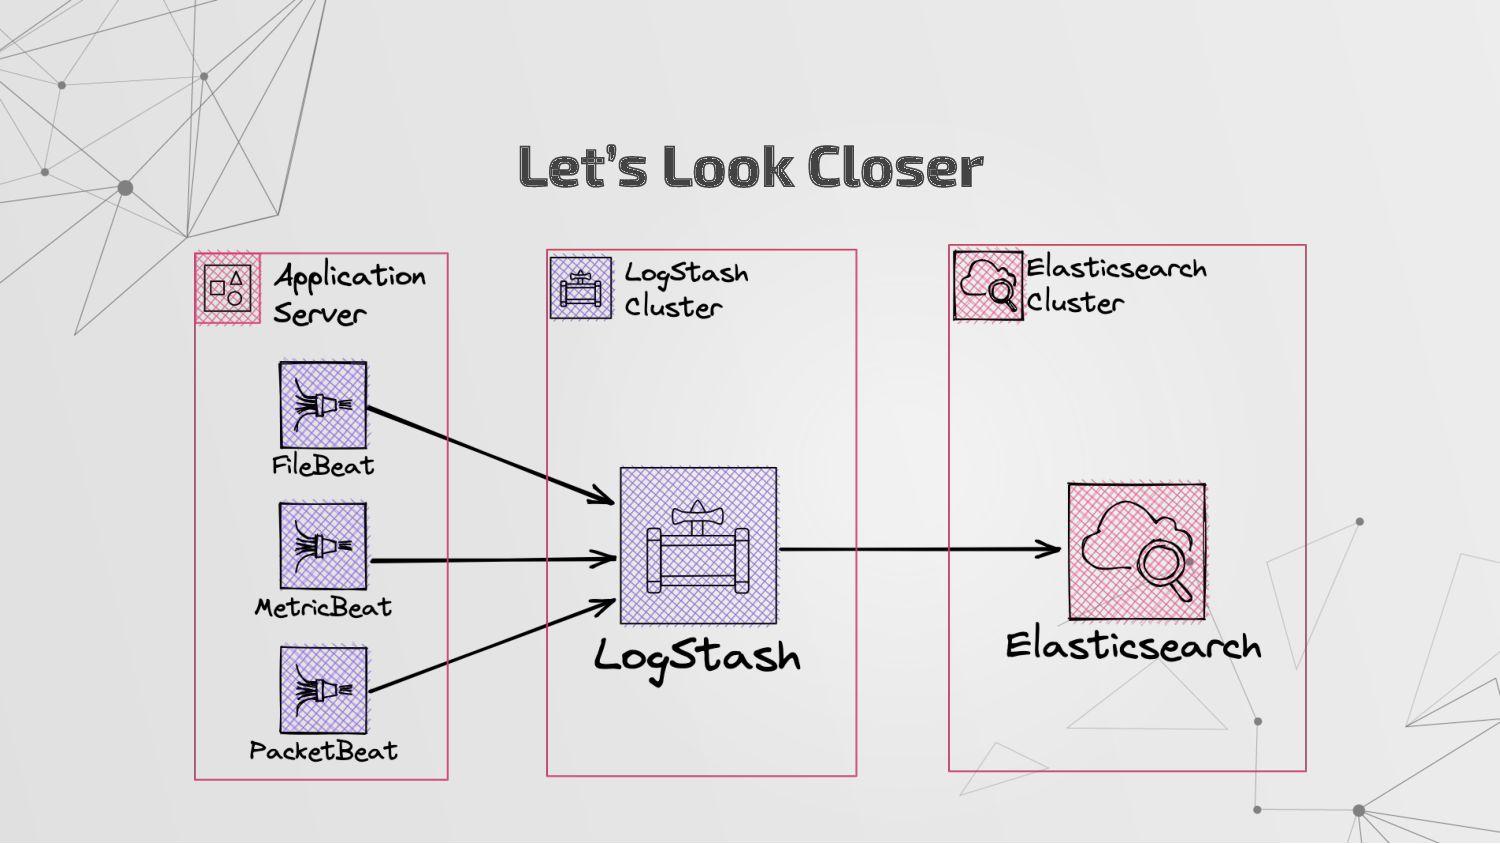
Works as an agent inside the servers or a server • It will send operational data to Elasticsearch or other outputs • Have a pipeline capability to enrich or filter data What is Logstash? https://www.elastic.co/guide/en/logstash/current/install.html
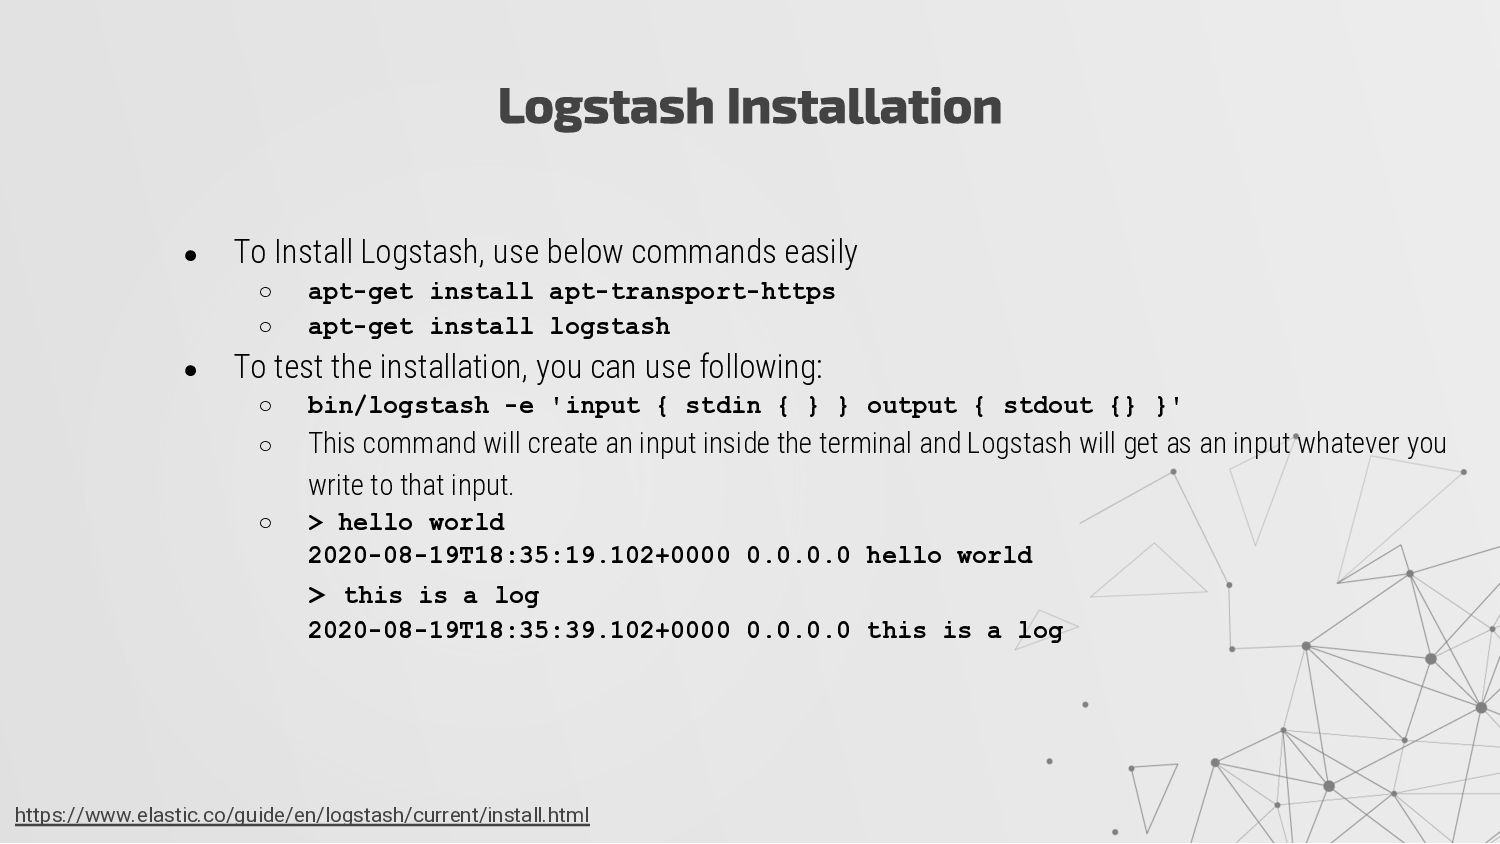
install apt-transport-https ◦ apt-get install logstash • To test the installation, you can use following: ◦ bin/logstash -e 'input { stdin { } } output { stdout {} }' ◦ This command will create an input inside the terminal and Logstash will get as an input whatever you write to that input. ◦ > hello world 2020-08-19T18:35:19.102+0000 0.0.0.0 hello world > this is a log 2020-08-19T18:35:39.102+0000 0.0.0.0 this is a log Logstash Installation https://www.elastic.co/guide/en/logstash/current/install.html
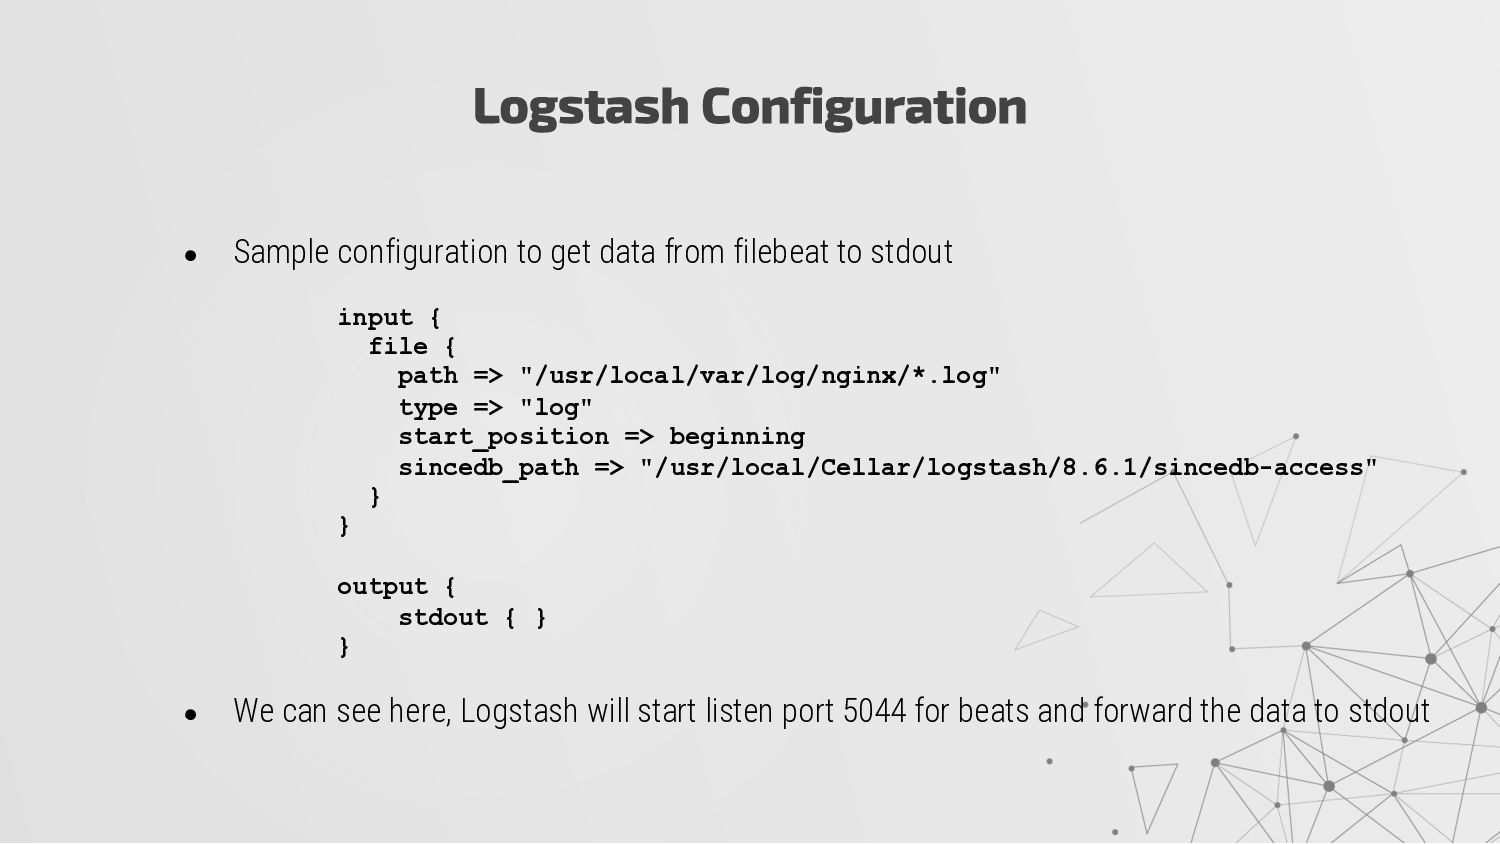
• We can see here, Logstash will start listen port 5044 for beats and forward the data to stdout Logstash Configuration input { file { path => "/usr/local/var/log/nginx/*.log" type => "log" start_position => beginning sincedb_path => "/usr/local/Cellar/logstash/8.6.1/sincedb-access" } } output { stdout { } }
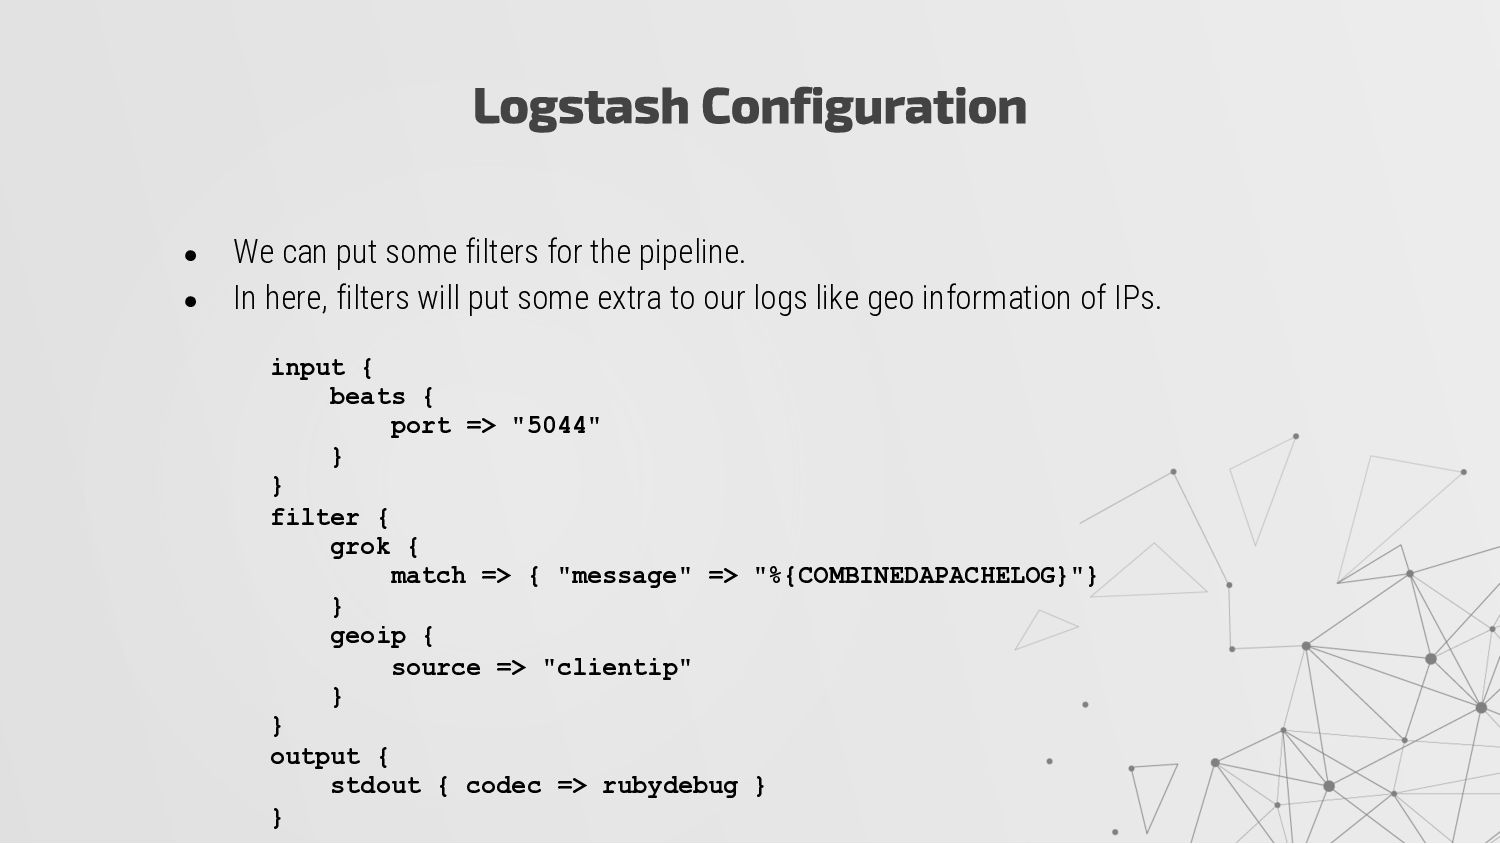
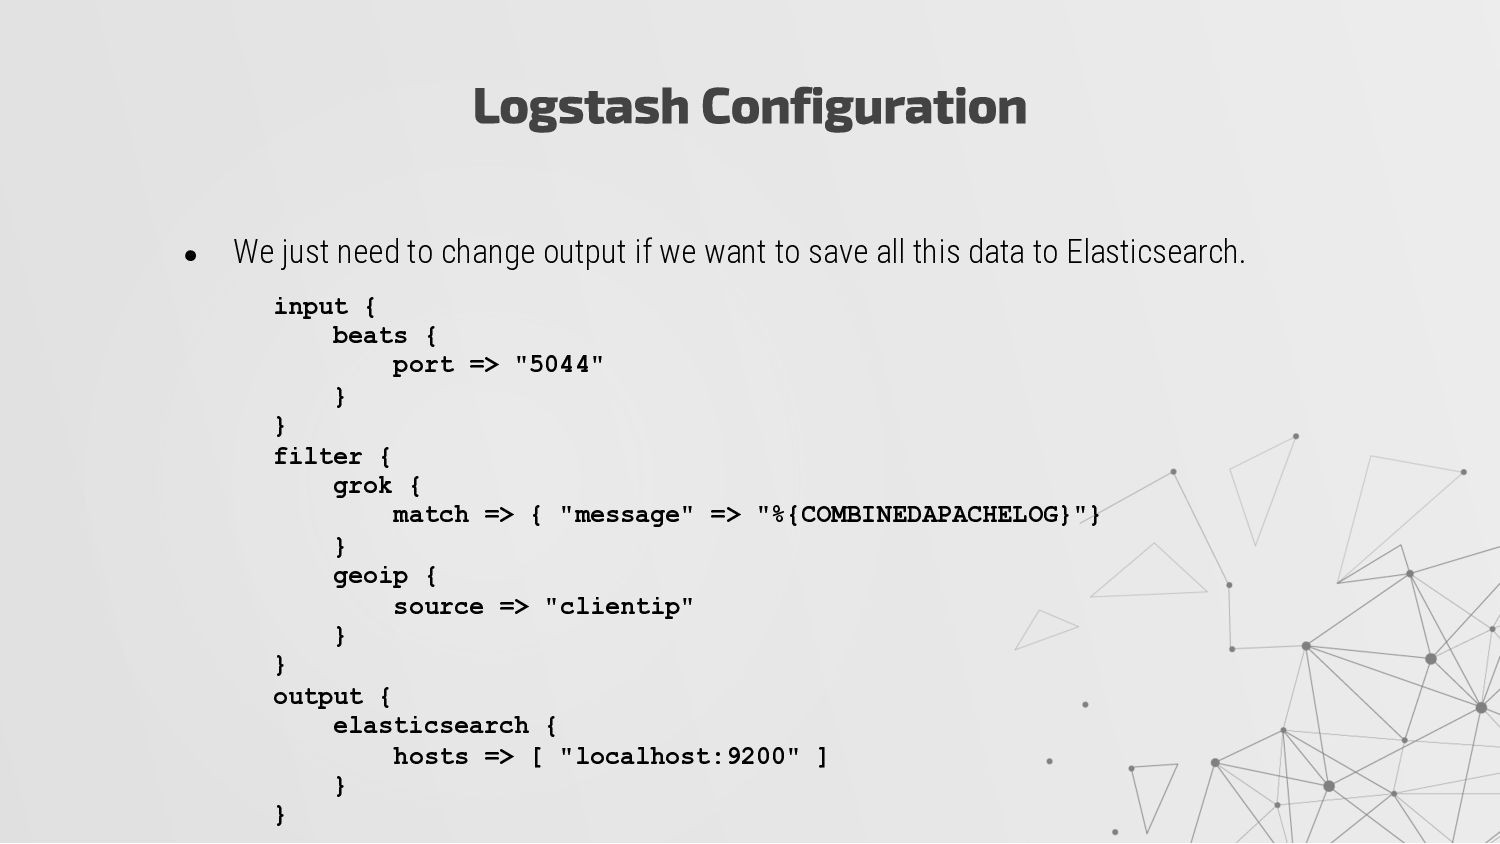
In here, filters will put some extra to our logs like geo information of IPs. Logstash Configuration input { beats { port => "5044" } } filter { grok { match => { "message" => "%{COMBINEDAPACHELOG}"} } geoip { source => "clientip" } } output { stdout { codec => rubydebug } }
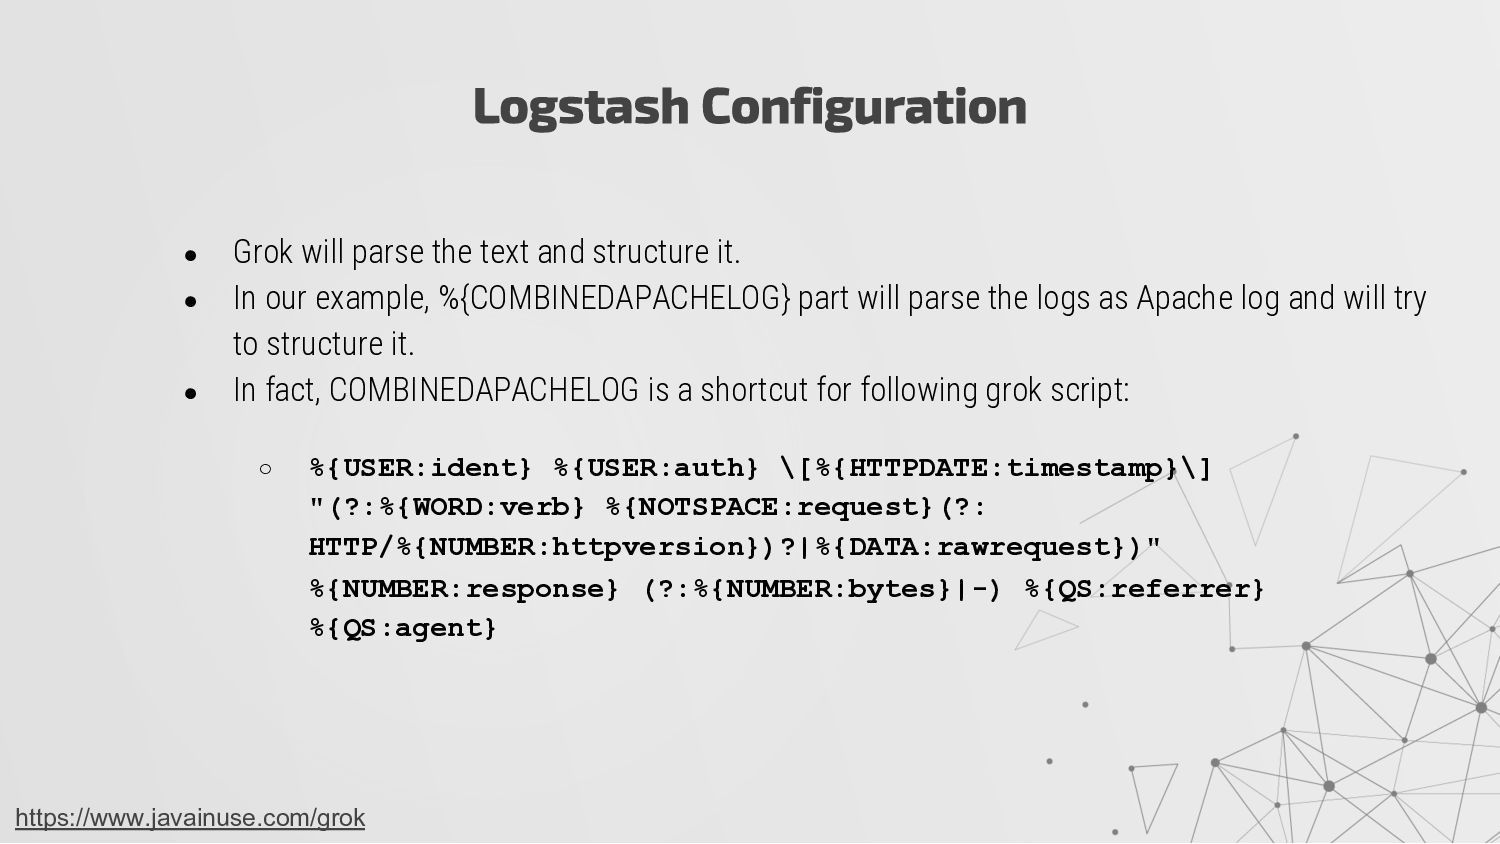
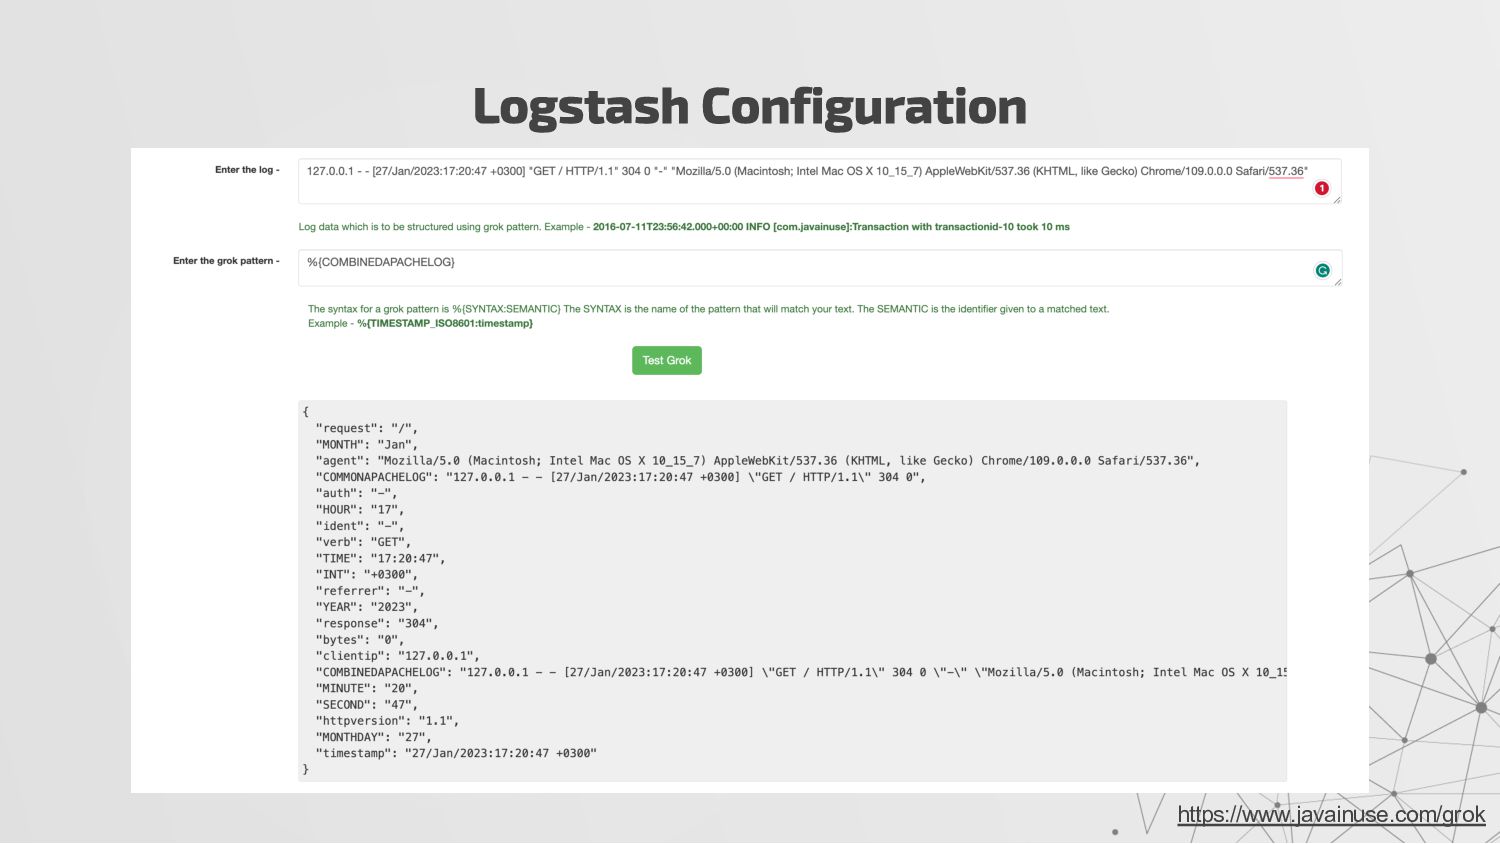
In our example, %{COMBINEDAPACHELOG} part will parse the logs as Apache log and will try to structure it. • In fact, COMBINEDAPACHELOG is a shortcut for following grok script: ◦ %{USER:ident} %{USER:auth} \[%{HTTPDATE:timestamp}\] "(?:%{WORD:verb} %{NOTSPACE:request}(?: HTTP/%{NUMBER:httpversion})?|%{DATA:rawrequest})" %{NUMBER:response} (?:%{NUMBER:bytes}|-) %{QS:referrer} %{QS:agent} Logstash Configuration https://www.javainuse.com/grok
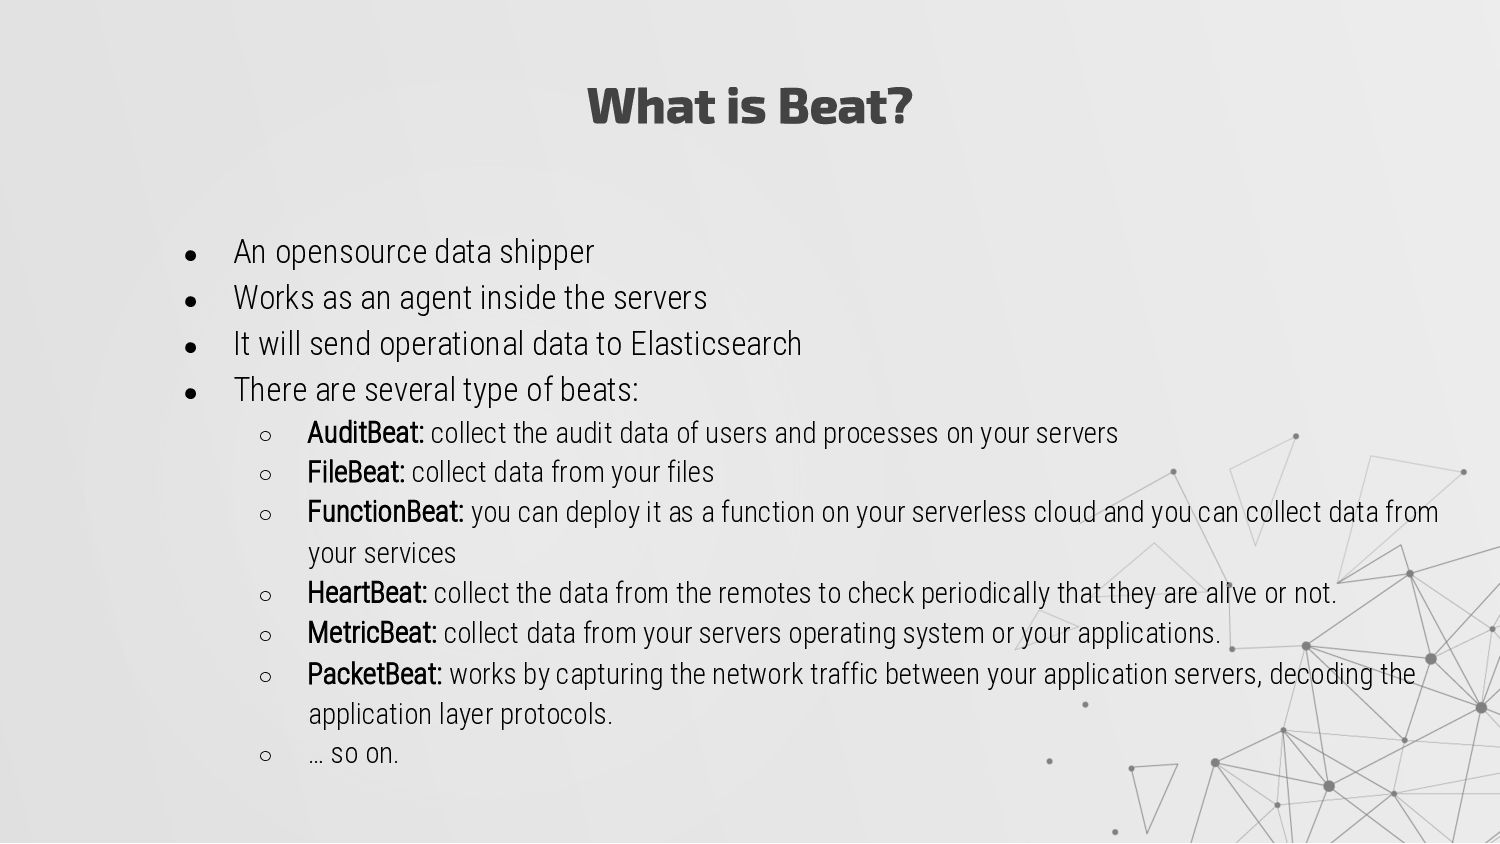
inside the servers • It will send operational data to Elasticsearch • There are several type of beats: ◦ AuditBeat: collect the audit data of users and processes on your servers ◦ FileBeat: collect data from your files ◦ FunctionBeat: you can deploy it as a function on your serverless cloud and you can collect data from your services ◦ HeartBeat: collect the data from the remotes to check periodically that they are alive or not. ◦ MetricBeat: collect data from your servers operating system or your applications. ◦ PacketBeat: works by capturing the network traffic between your application servers, decoding the application layer protocols. ◦ … so on. What is Beat?
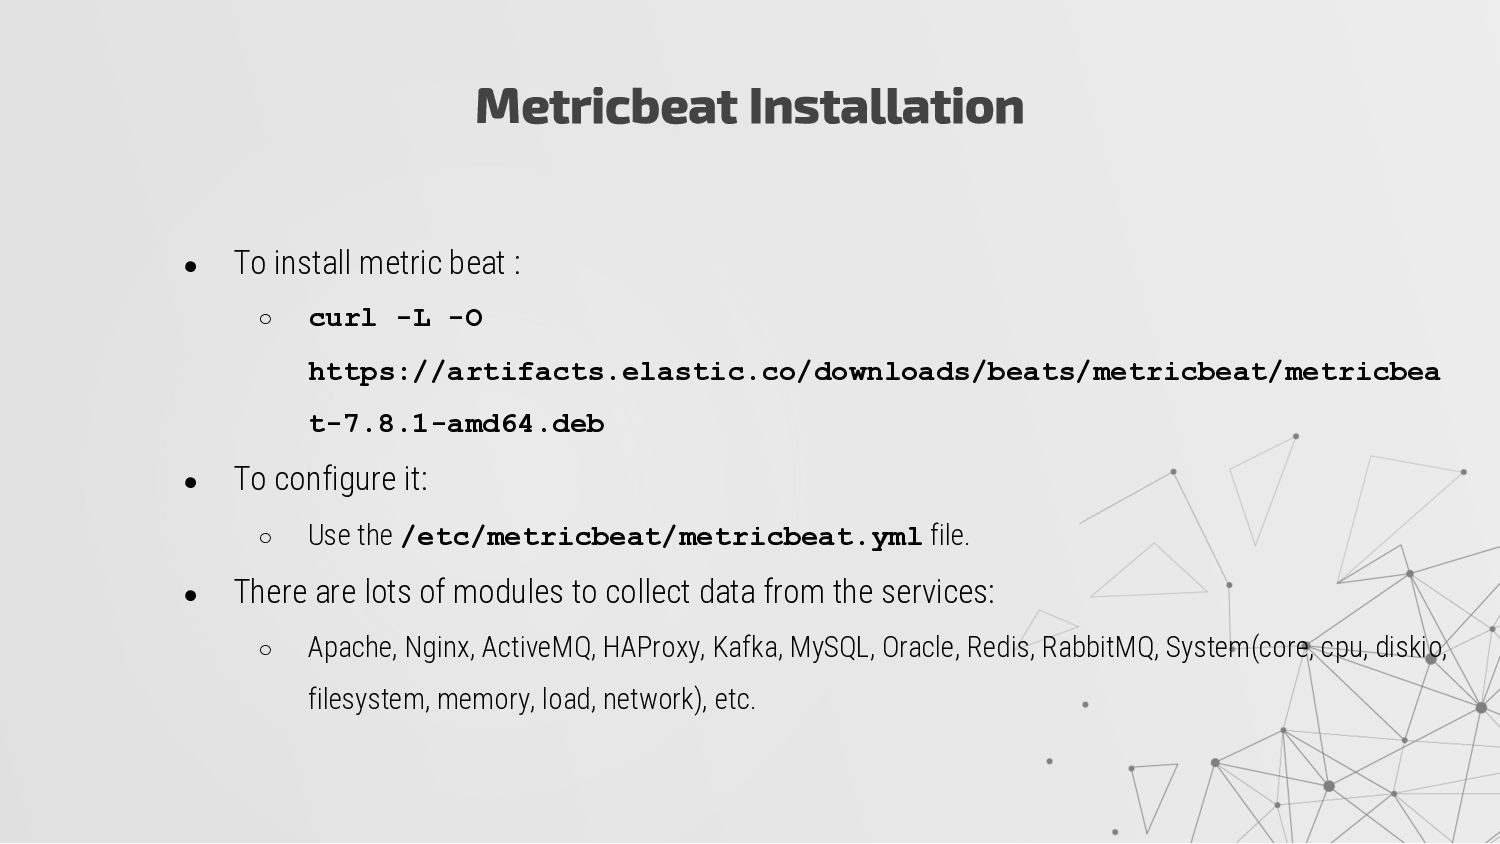
https://artifacts.elastic.co/downloads/beats/metricbeat/metricbea t-7.8.1-amd64.deb • To configure it: ◦ Use the /etc/metricbeat/metricbeat.yml file. • There are lots of modules to collect data from the services: ◦ Apache, Nginx, ActiveMQ, HAProxy, Kafka, MySQL, Oracle, Redis, RabbitMQ, System(core, cpu, diskio, filesystem, memory, load, network), etc. Metricbeat Installation
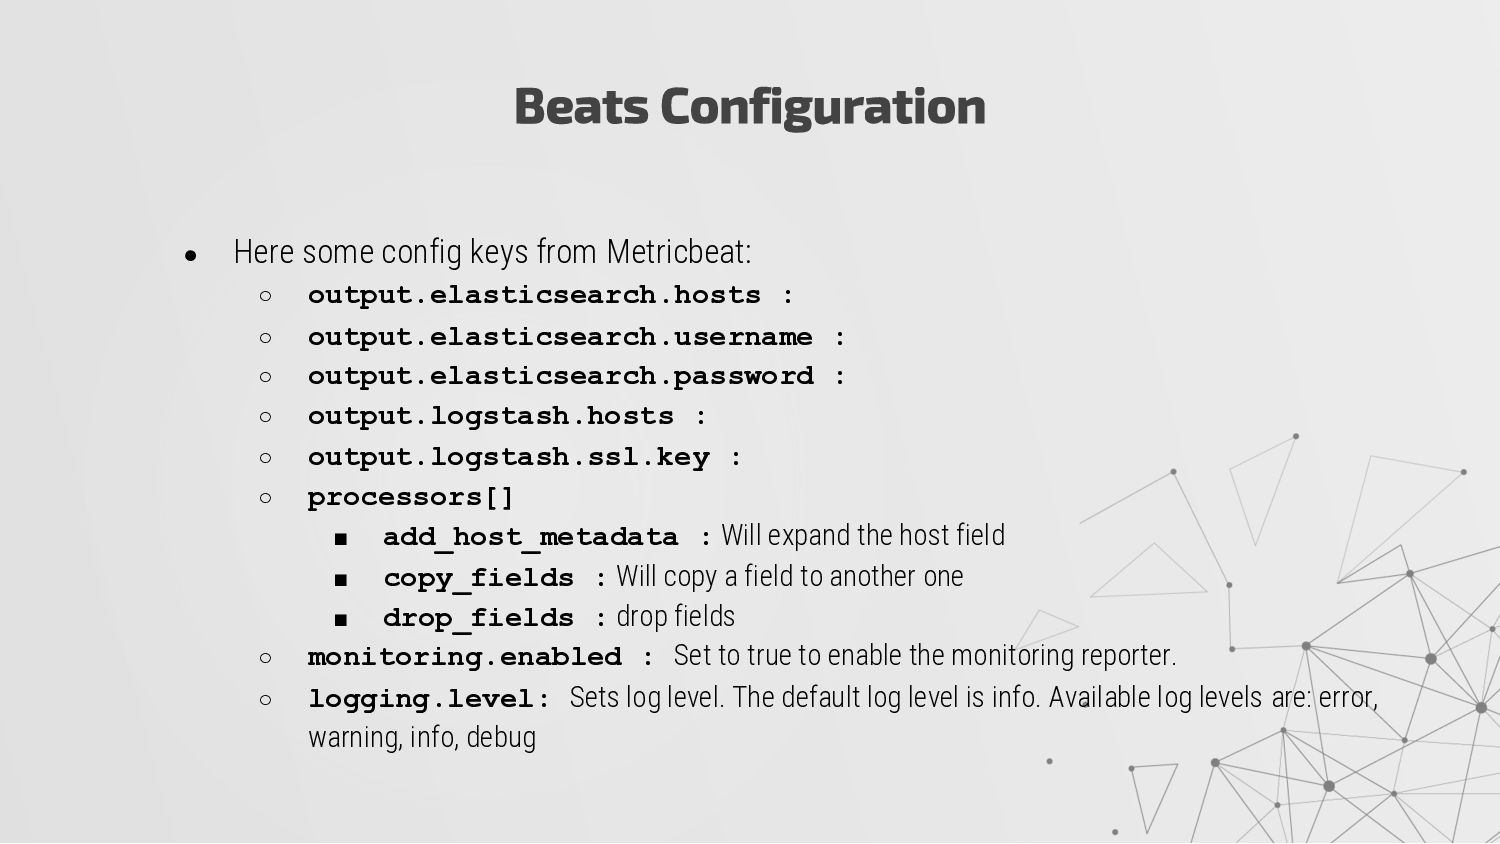
◦ output.elasticsearch.username : ◦ output.elasticsearch.password : ◦ output.logstash.hosts : ◦ output.logstash.ssl.key : ◦ processors[] ▪ add_host_metadata : Will expand the host field ▪ copy_fields : Will copy a field to another one ▪ drop_fields : drop fields ◦ monitoring.enabled : Set to true to enable the monitoring reporter. ◦ logging.level: Sets log level. The default log level is info. Available log levels are: error, warning, info, debug Beats Configuration