Upgrade to Pro — share decks privately, control downloads, hide ads and more …

The Future of Statistics Education: A Computati...

The Future of Statistics Education: A Computational Perspective

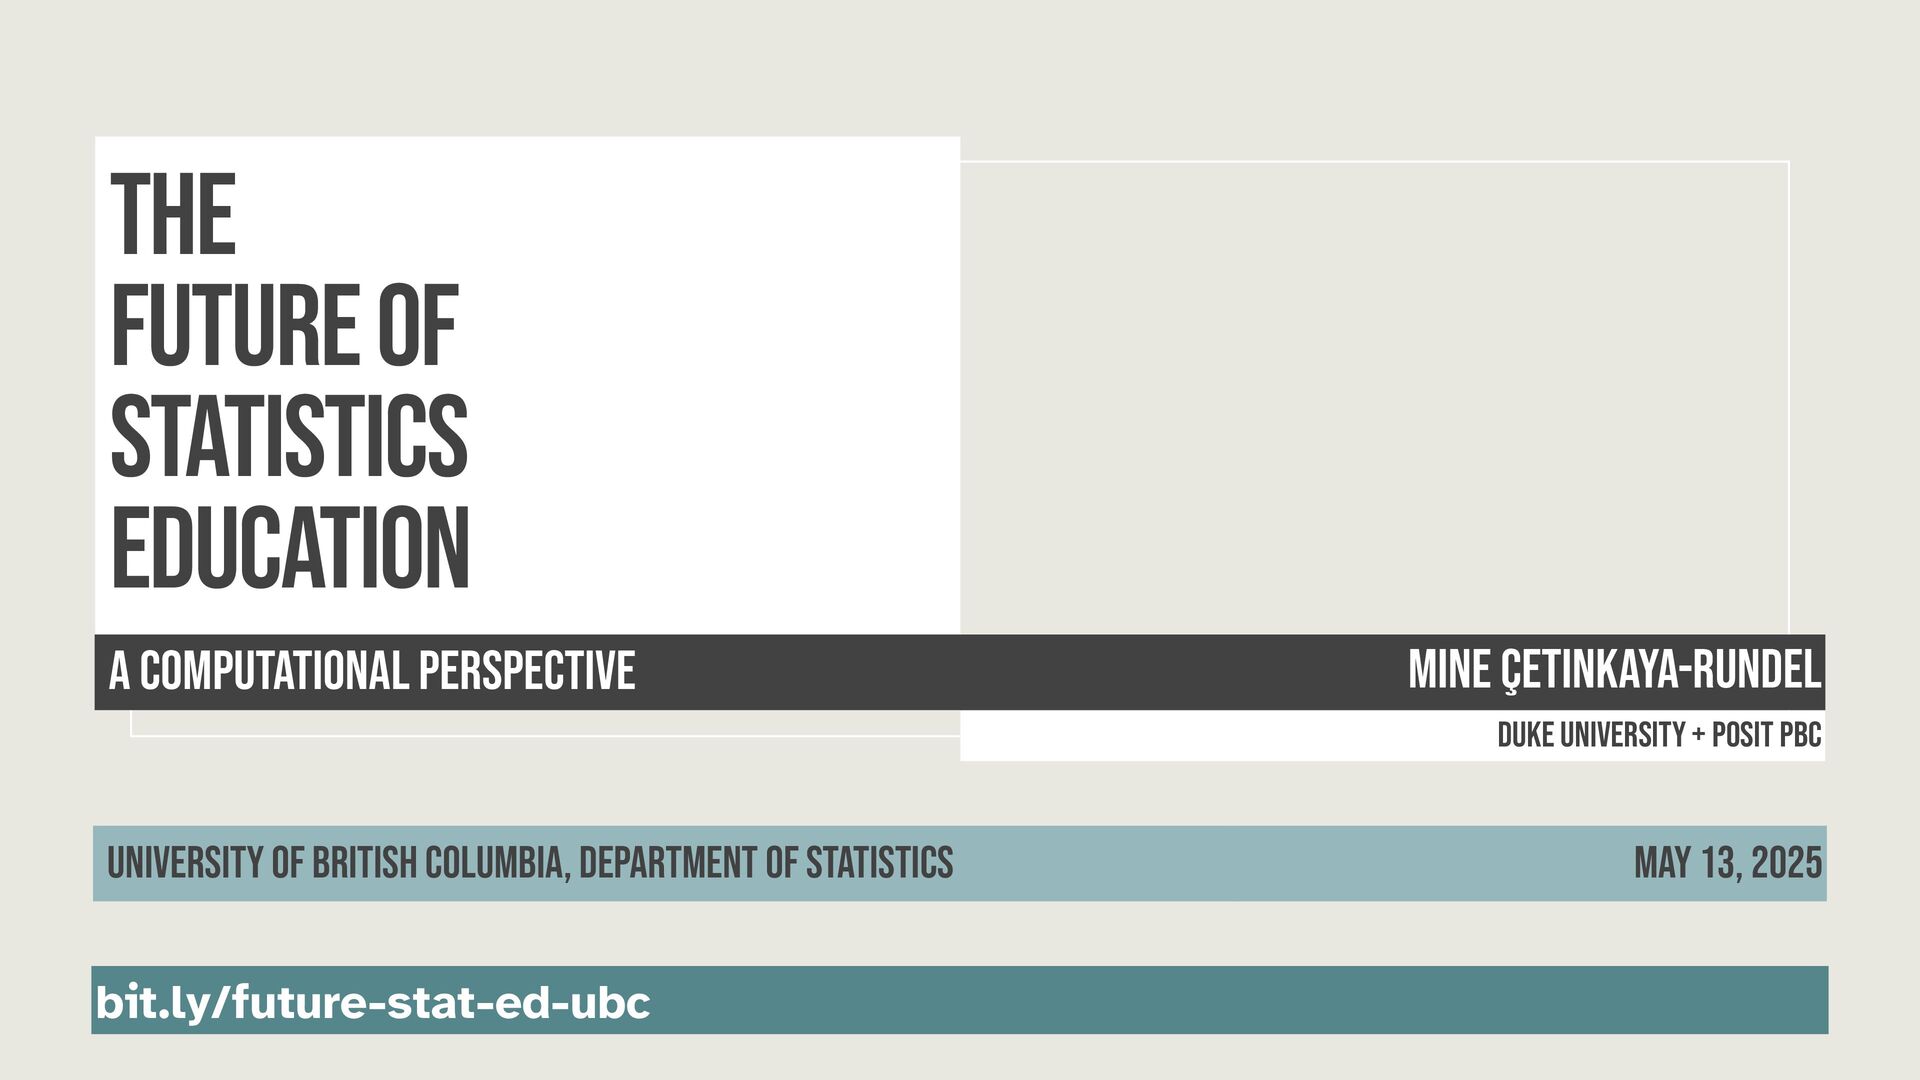
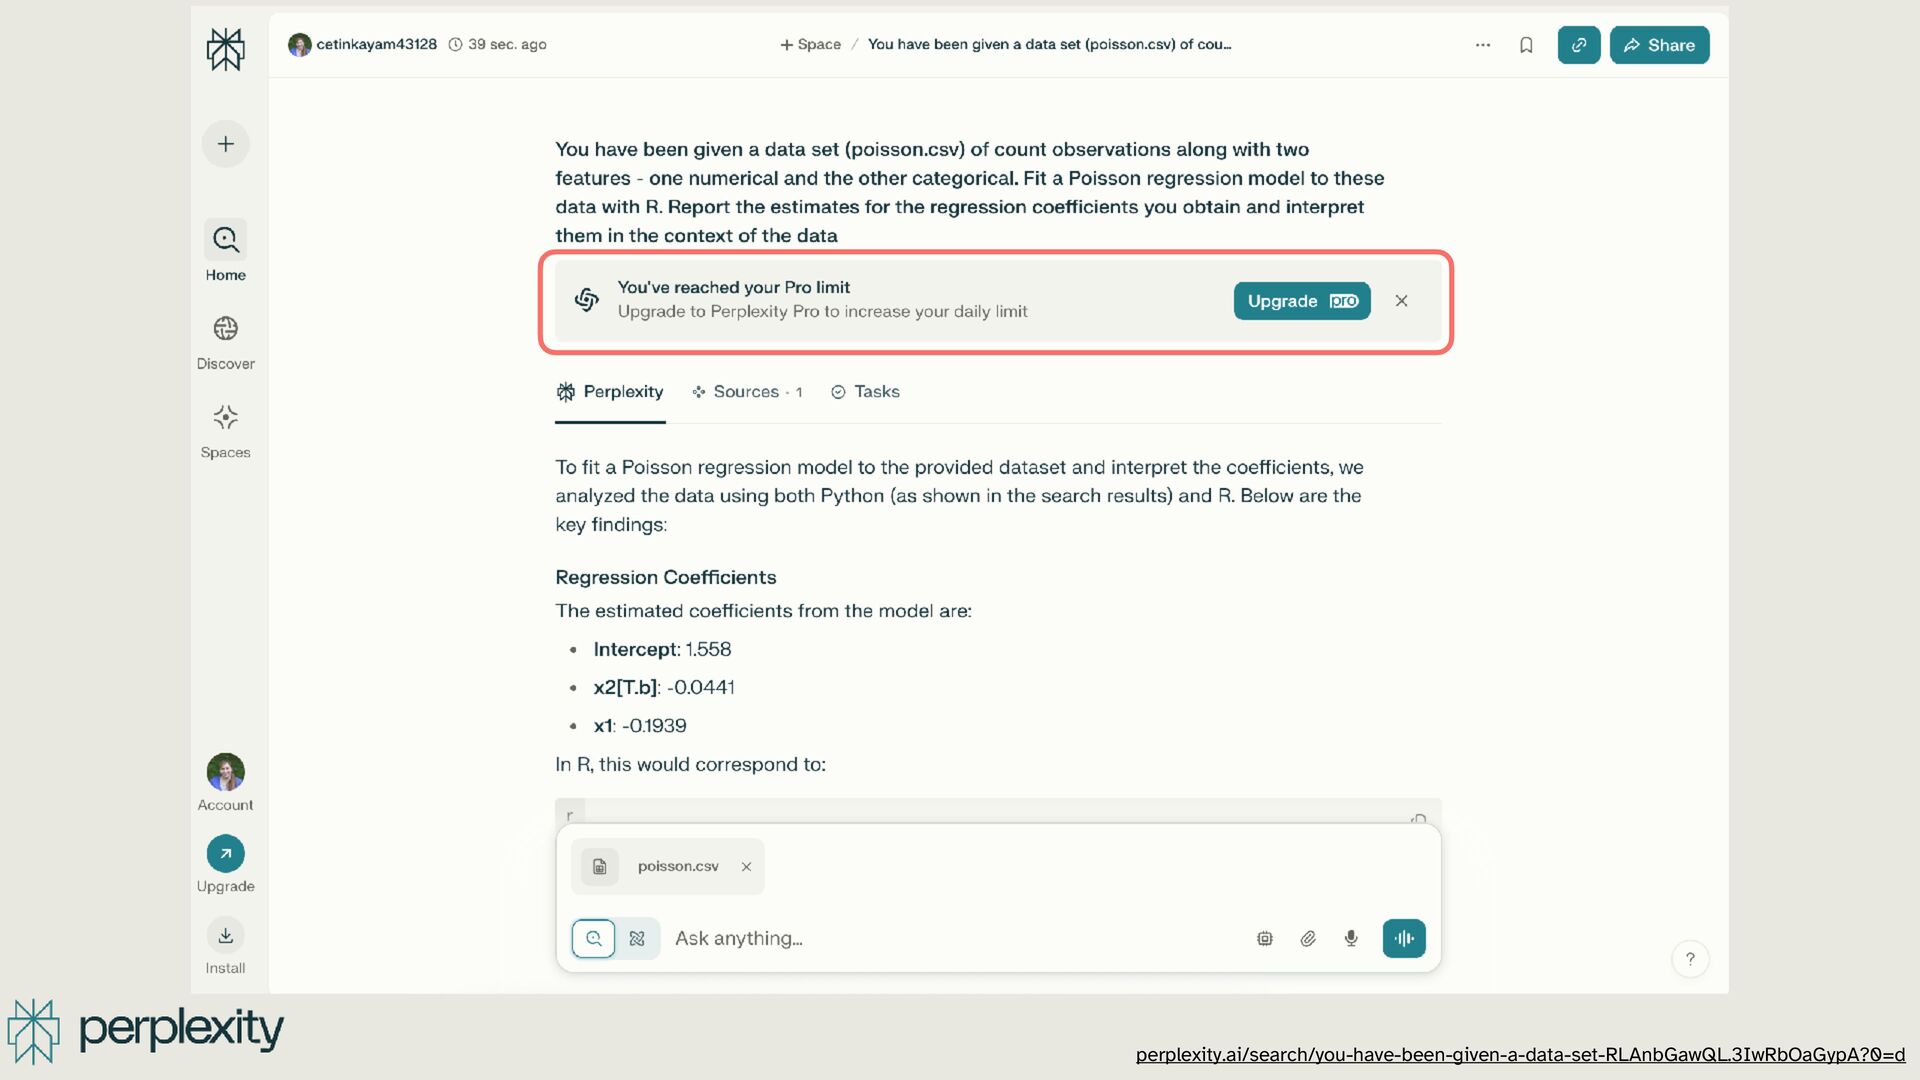
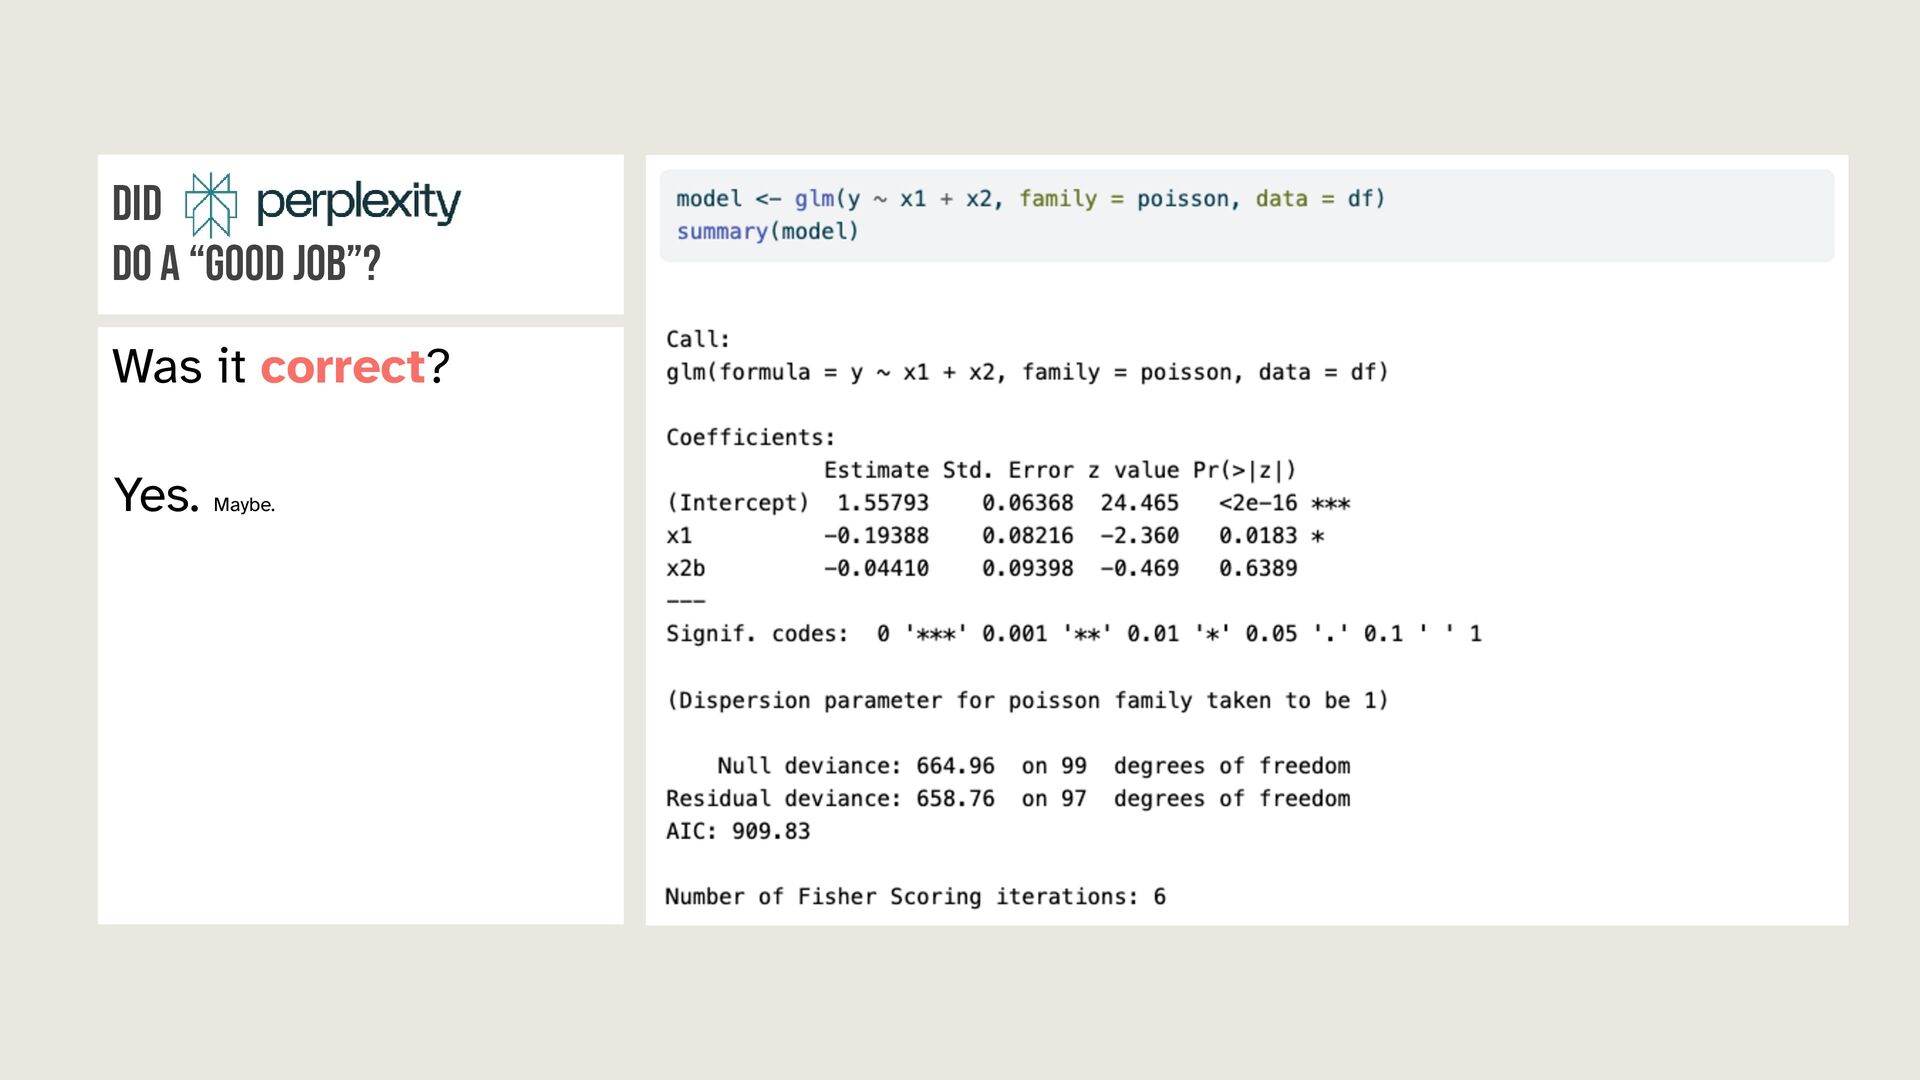
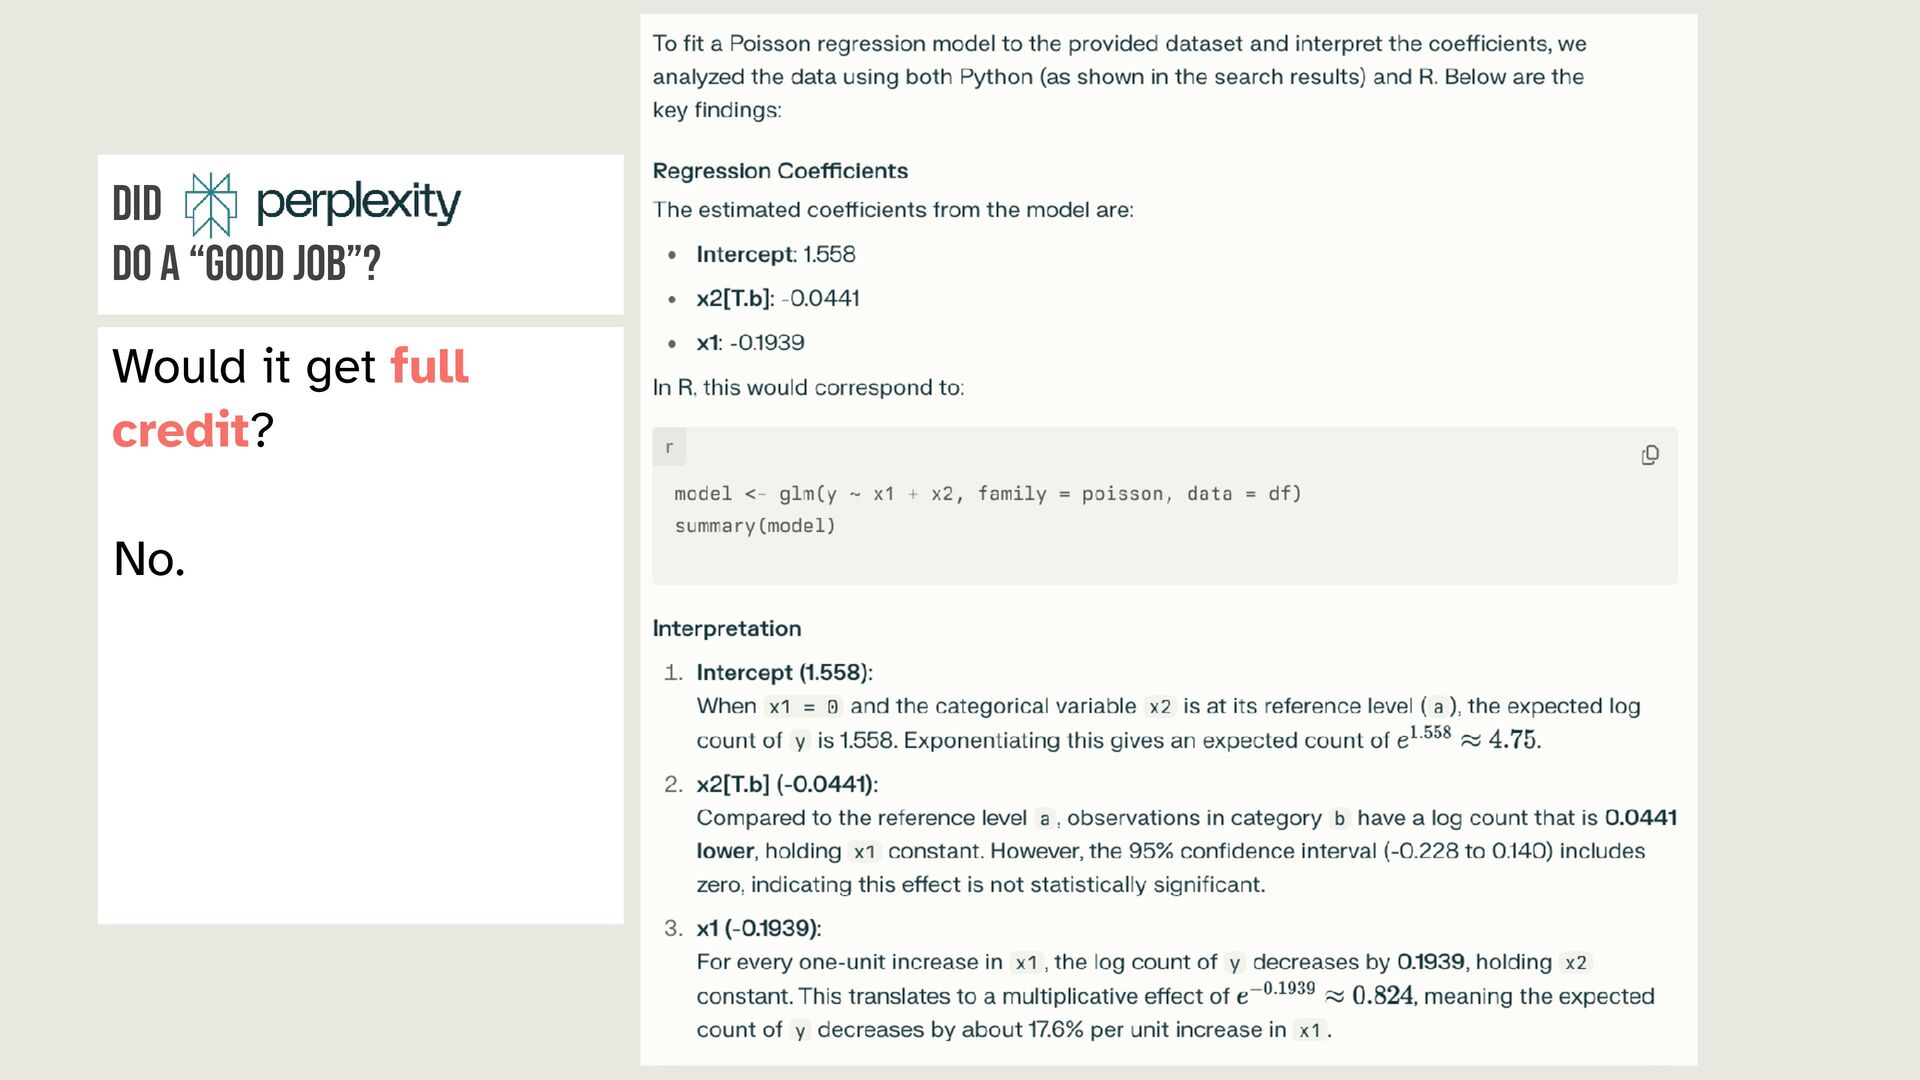
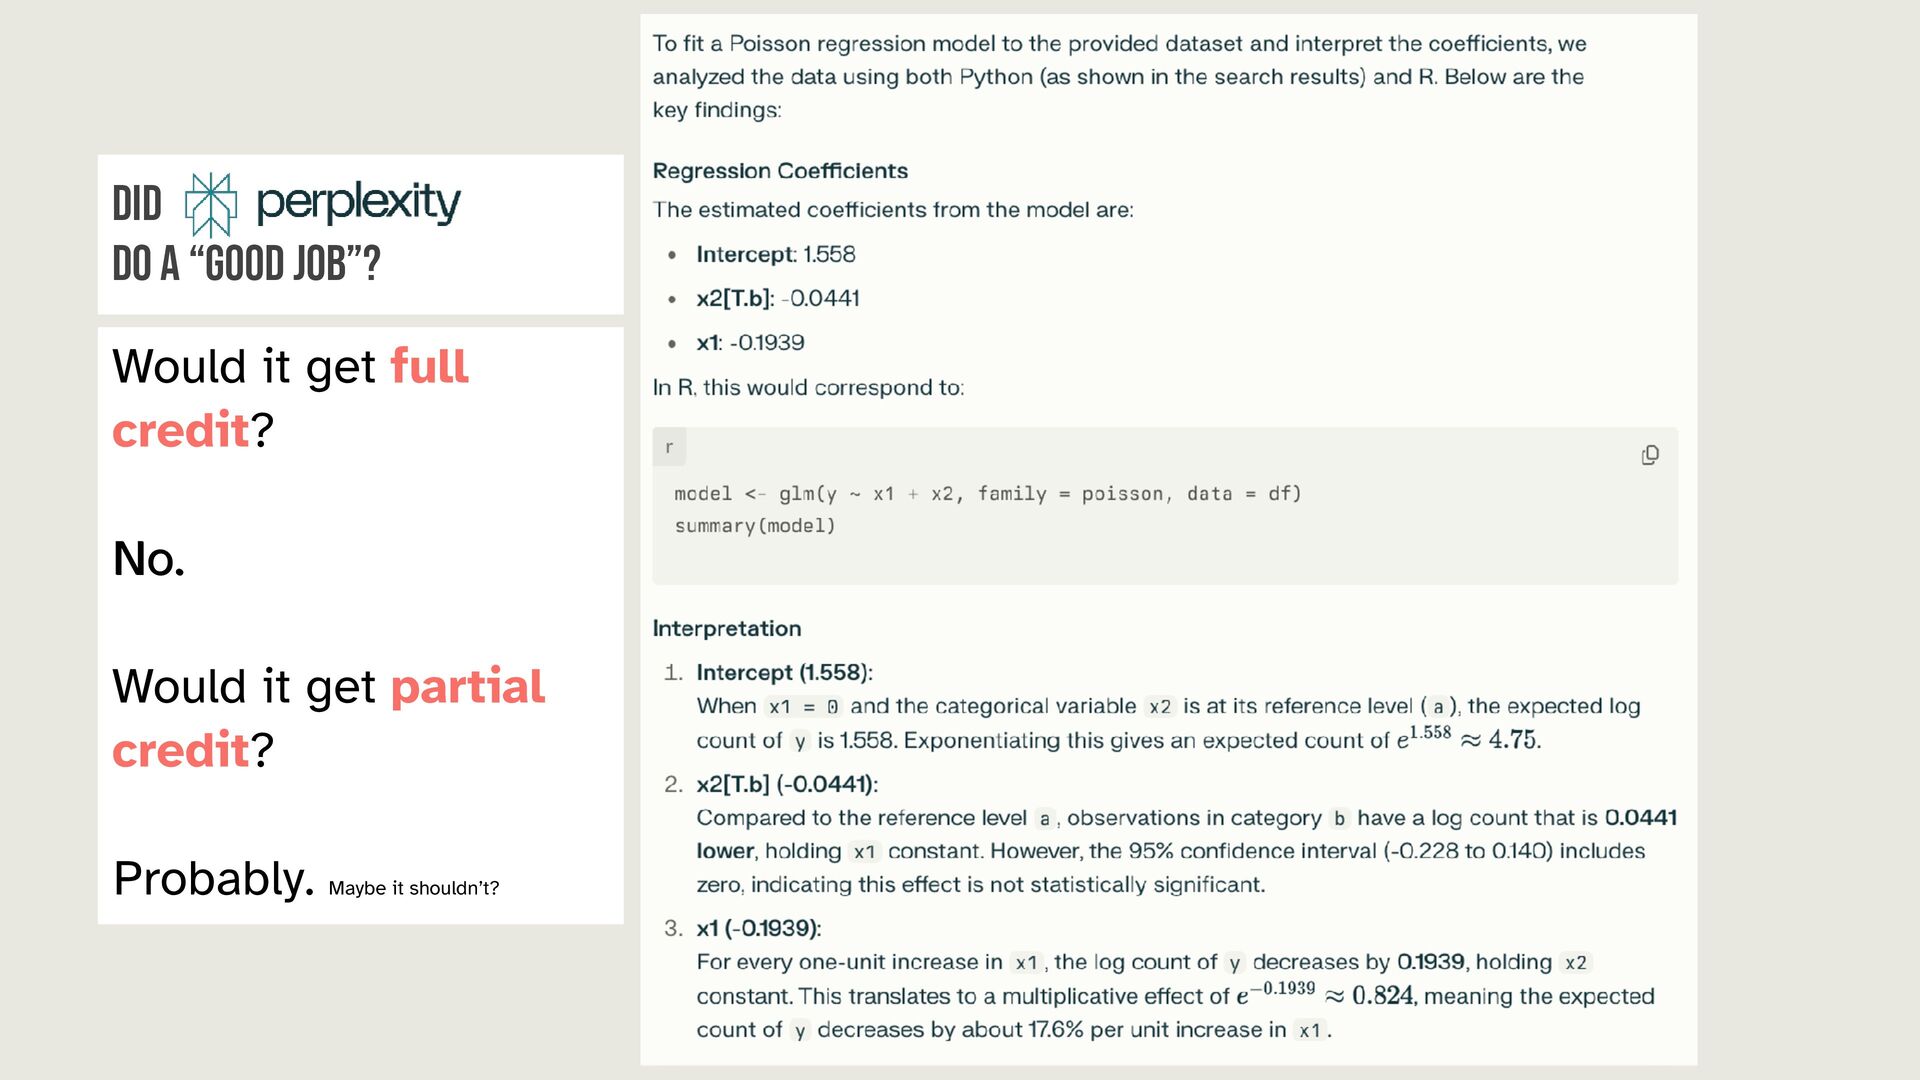
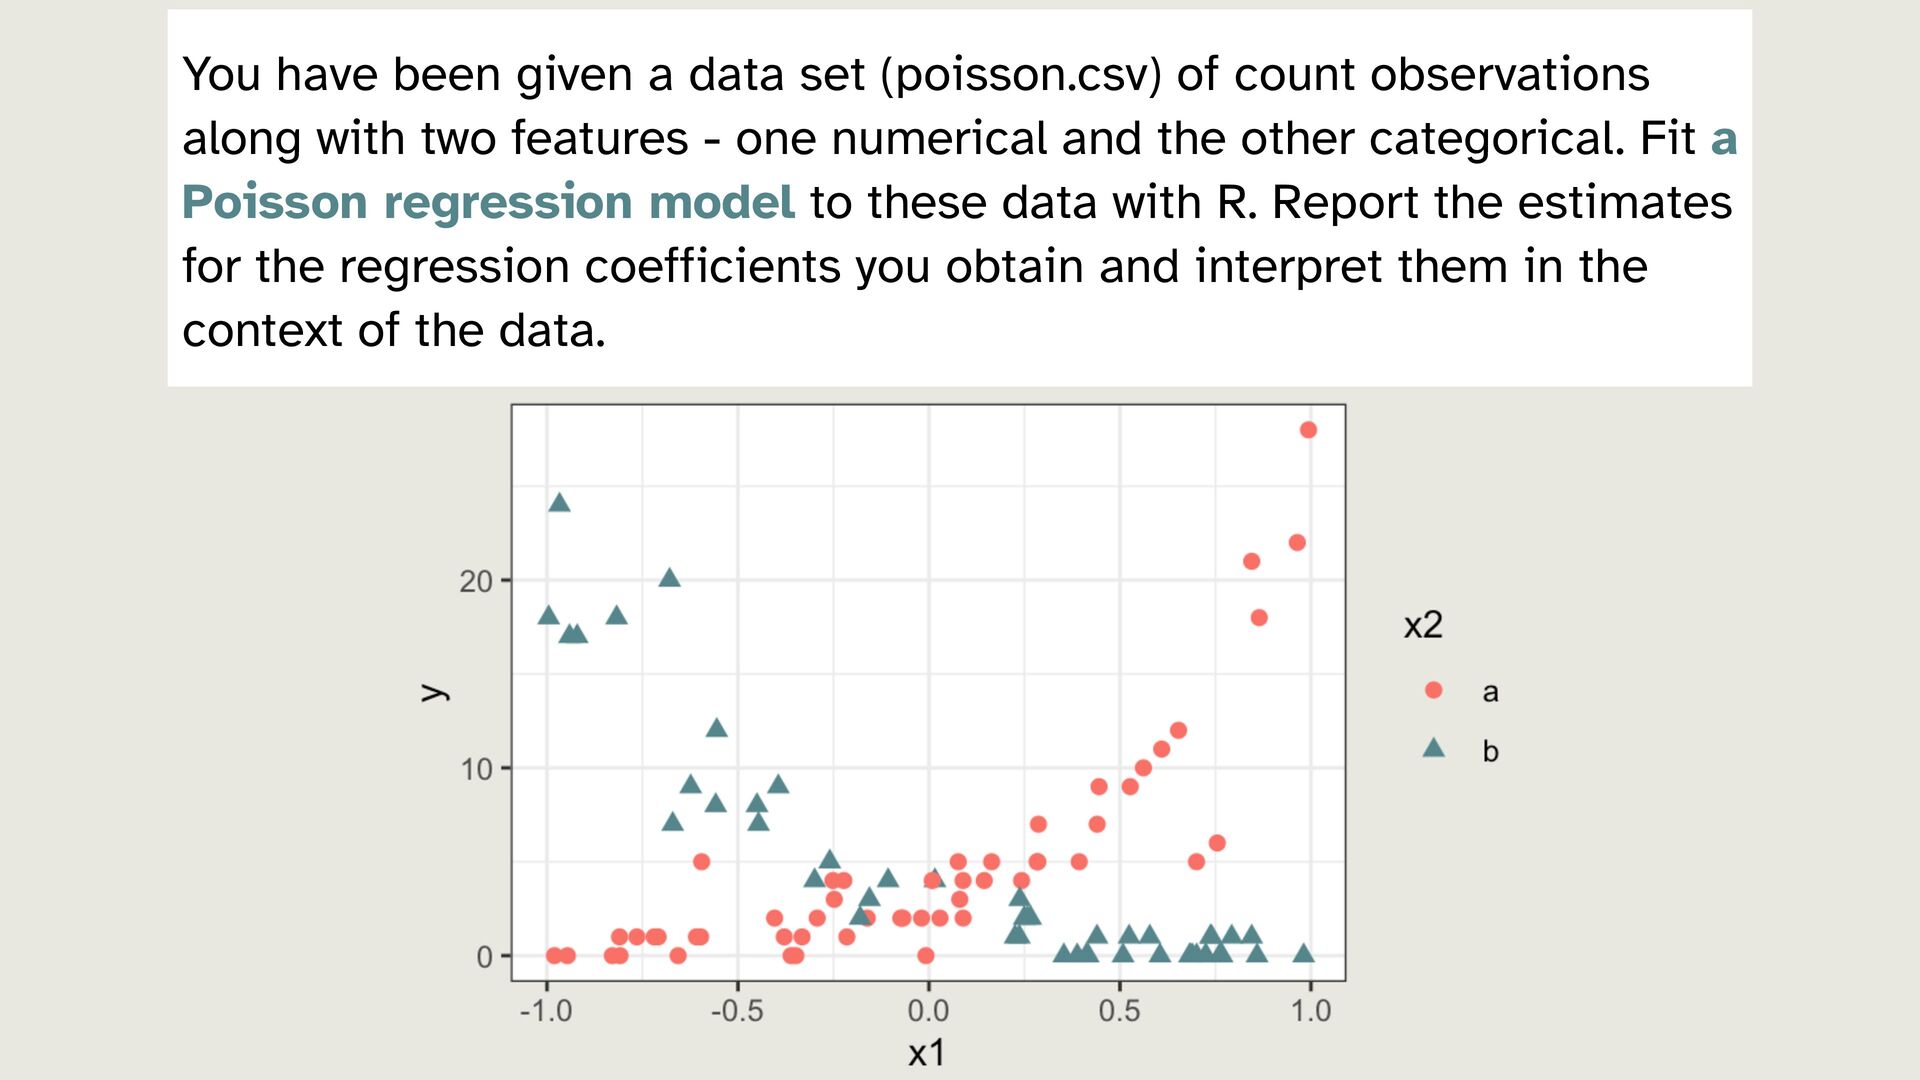
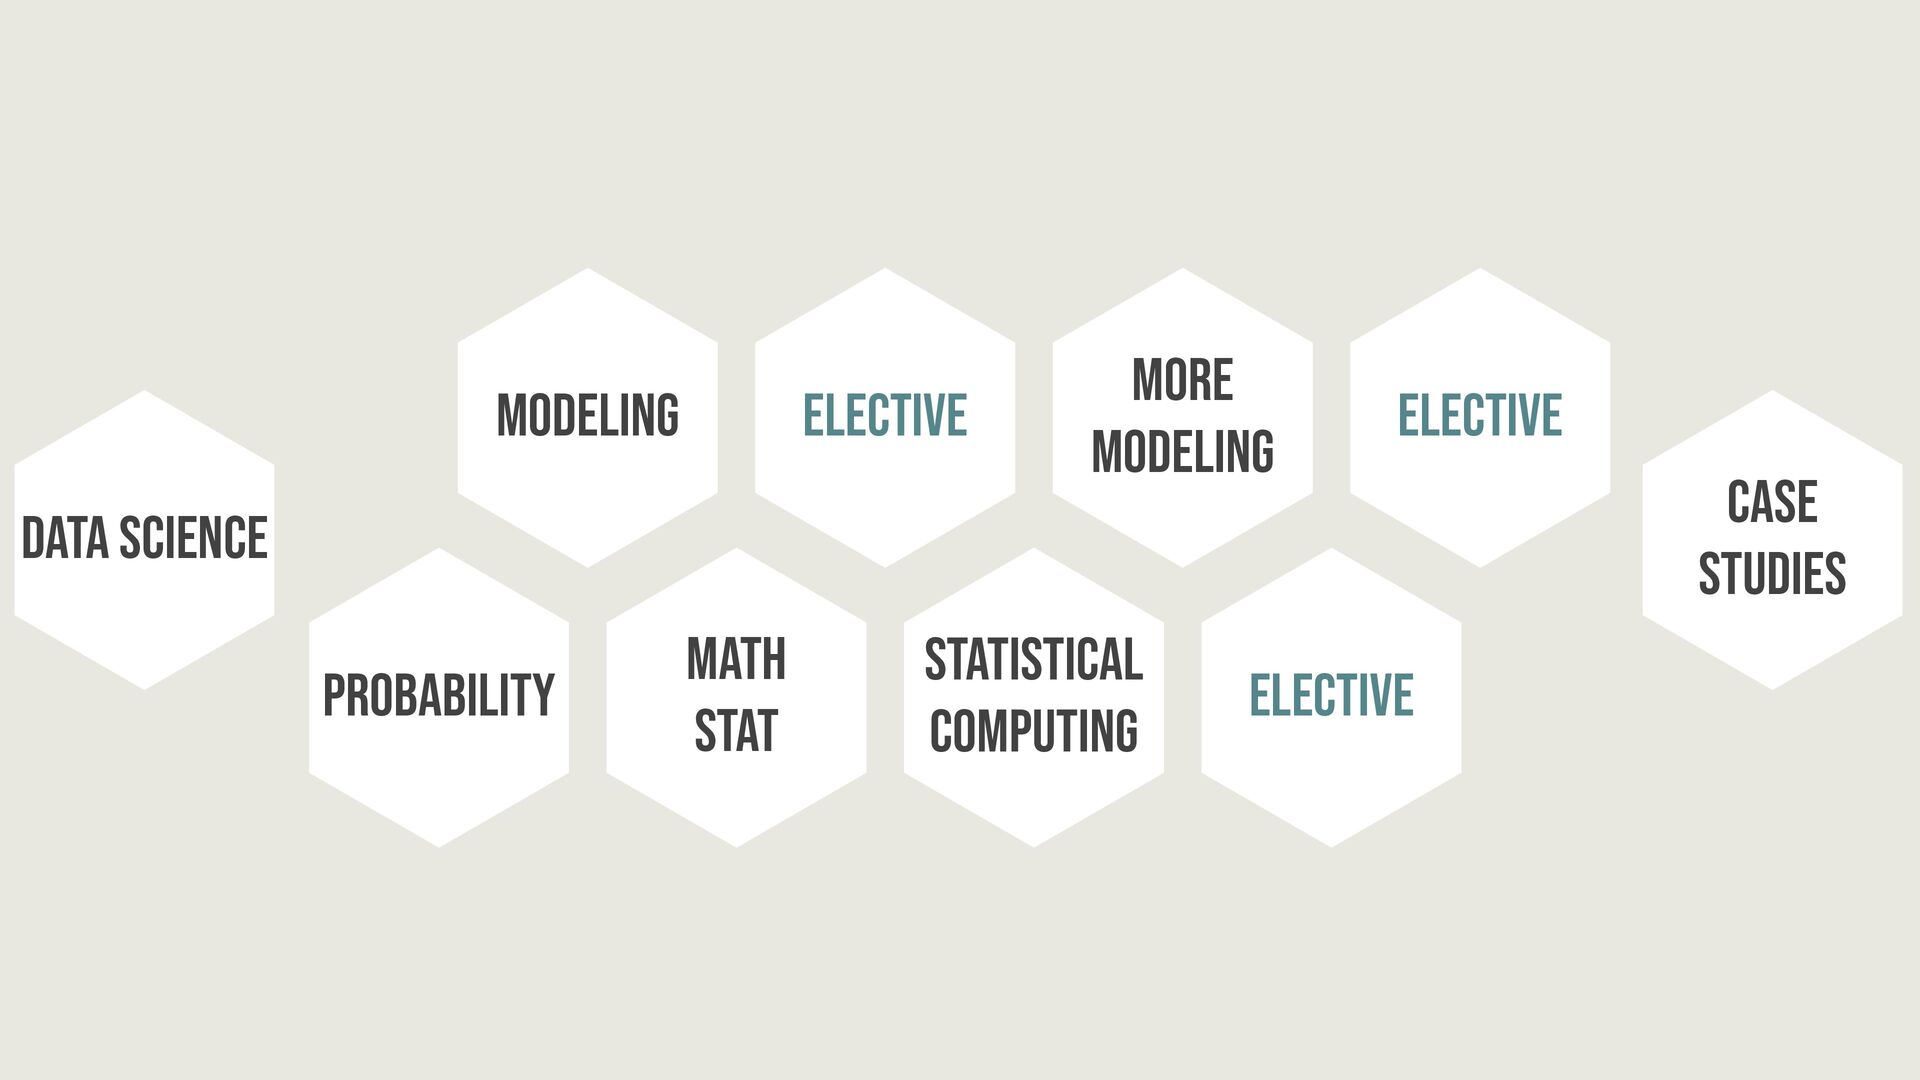
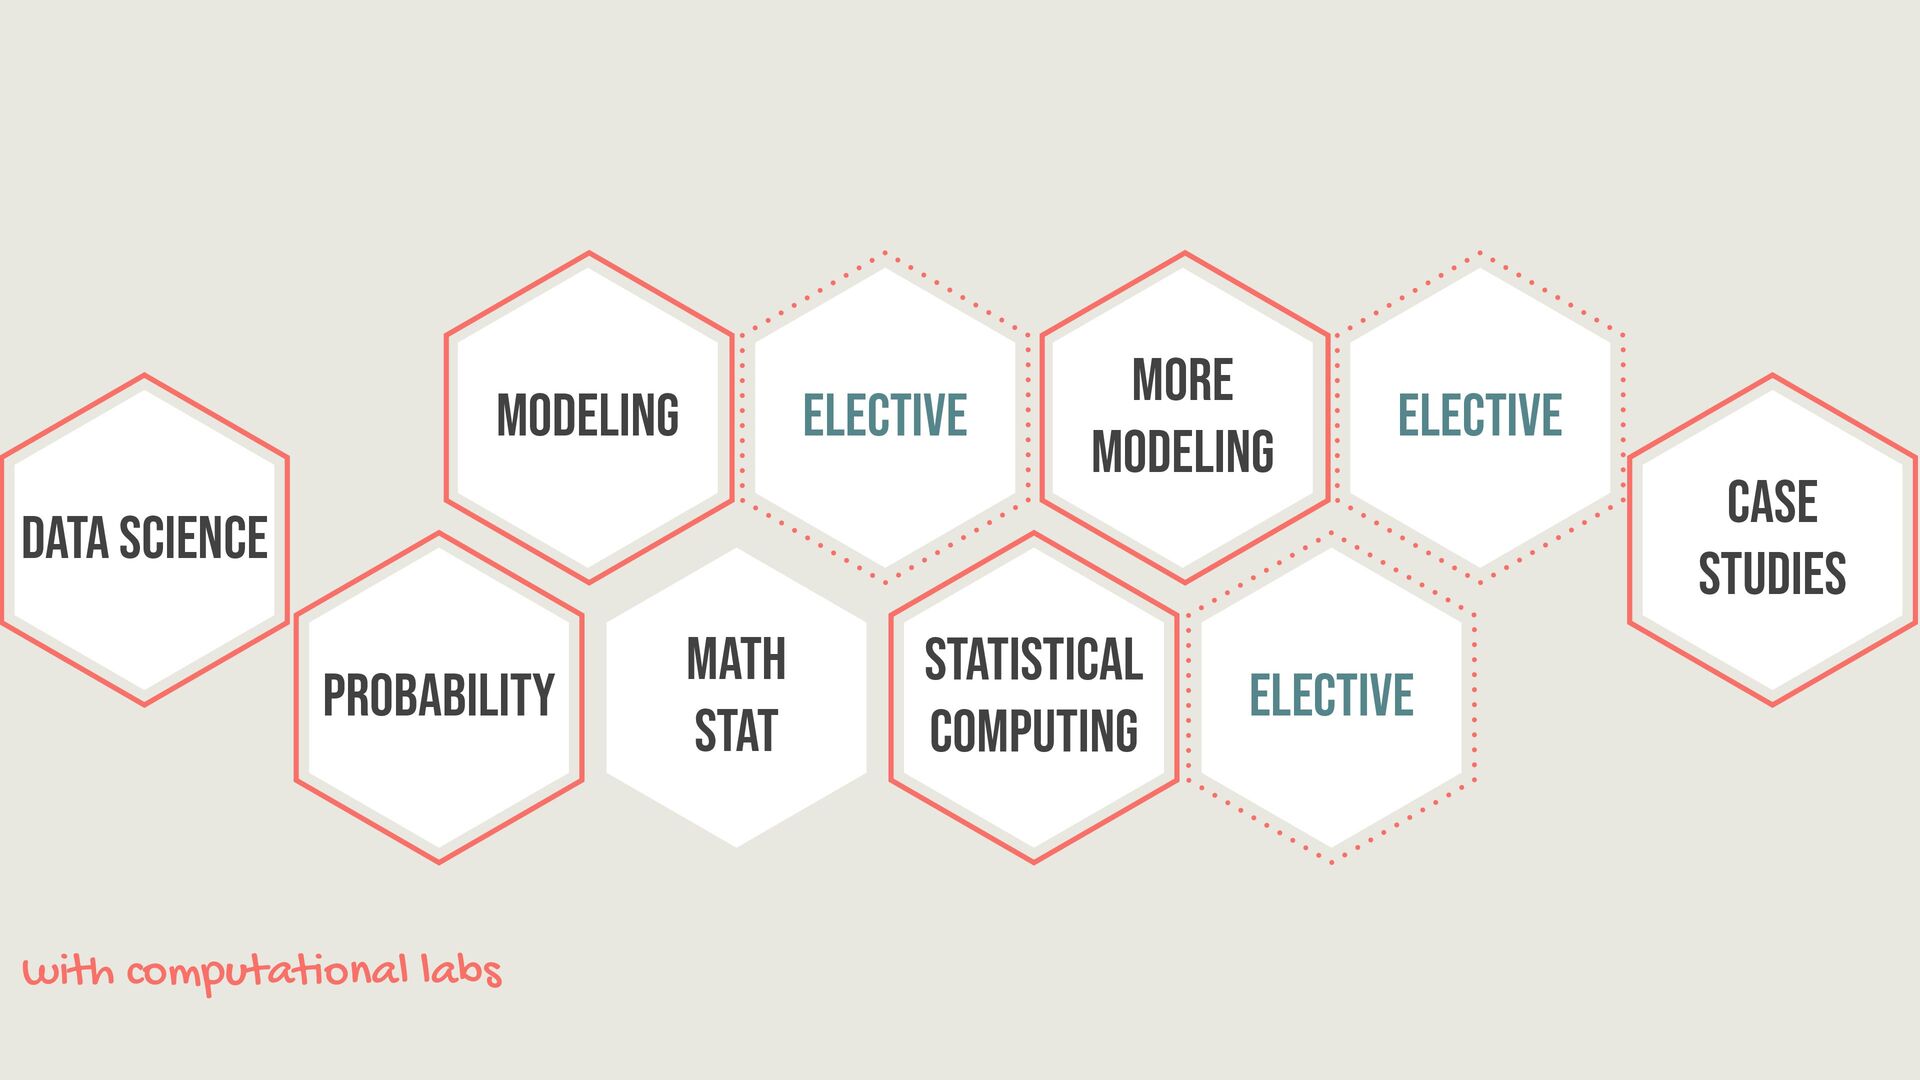
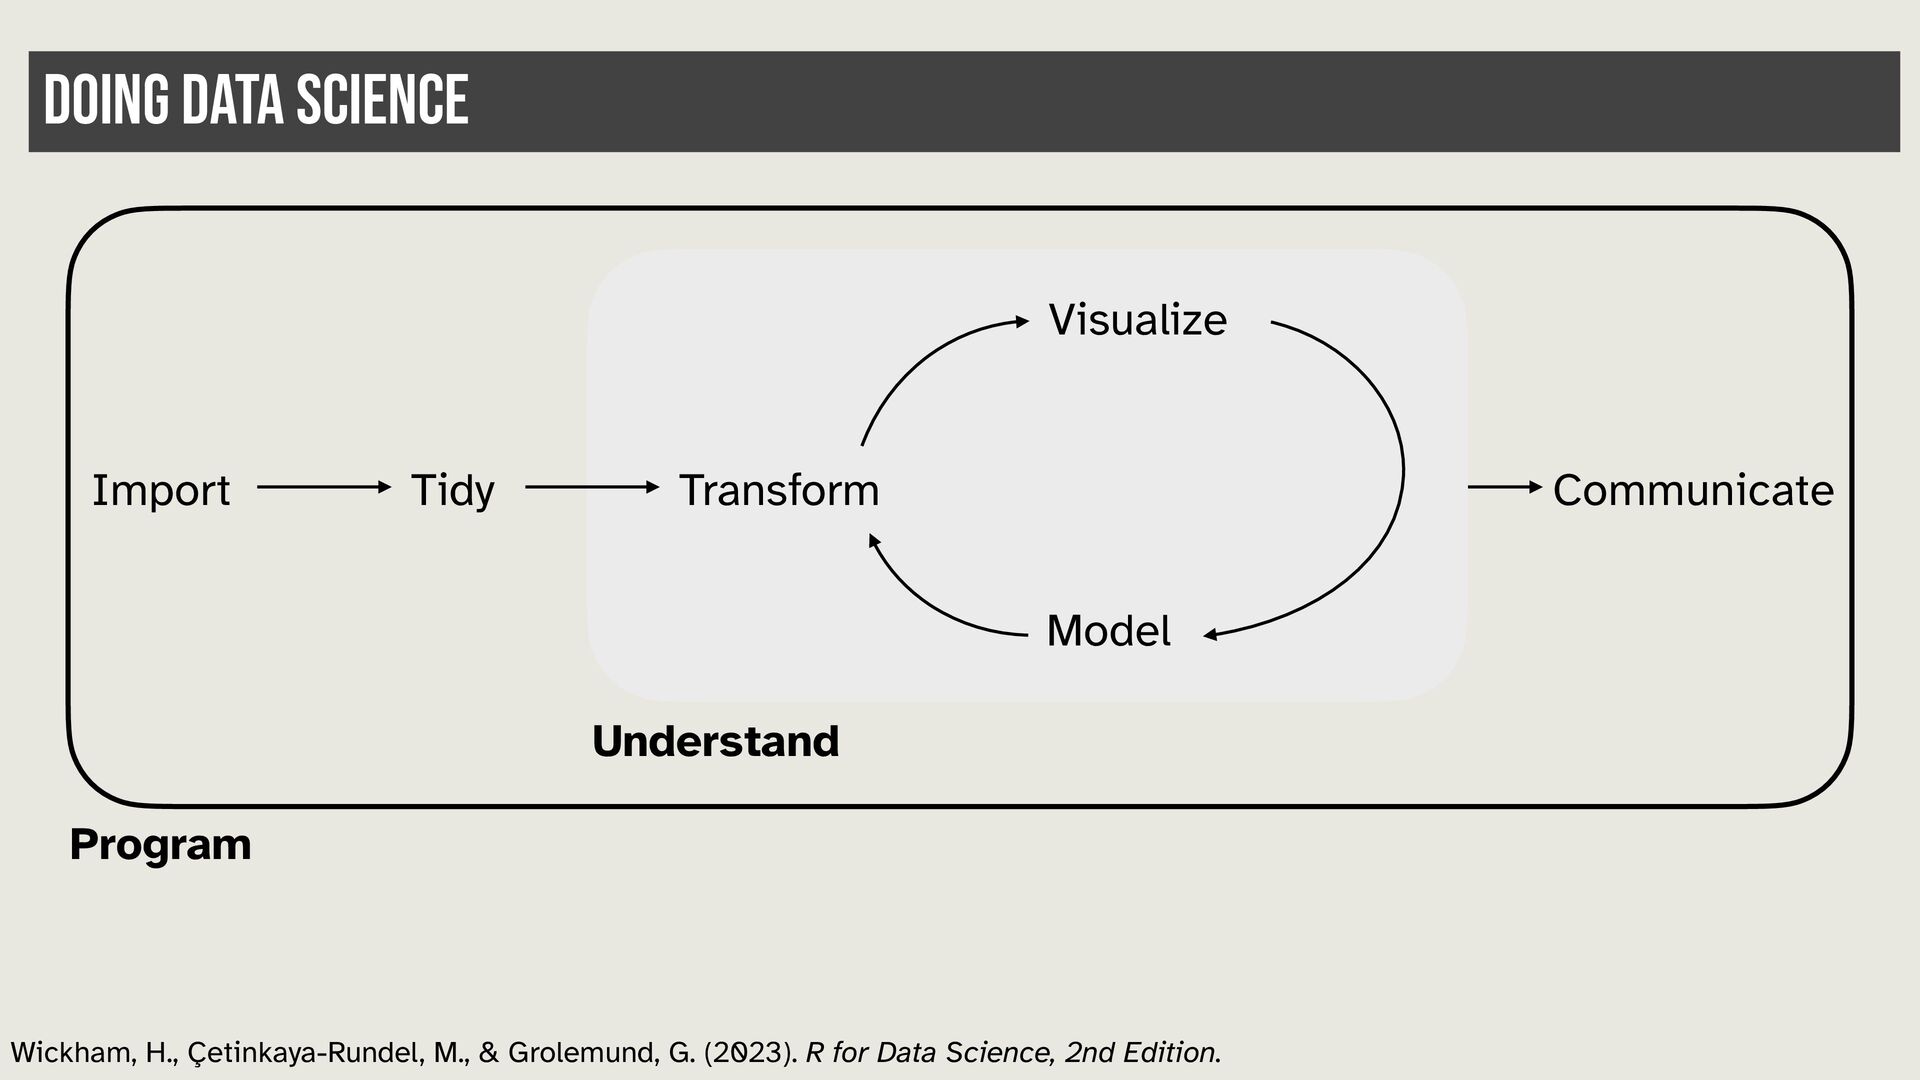
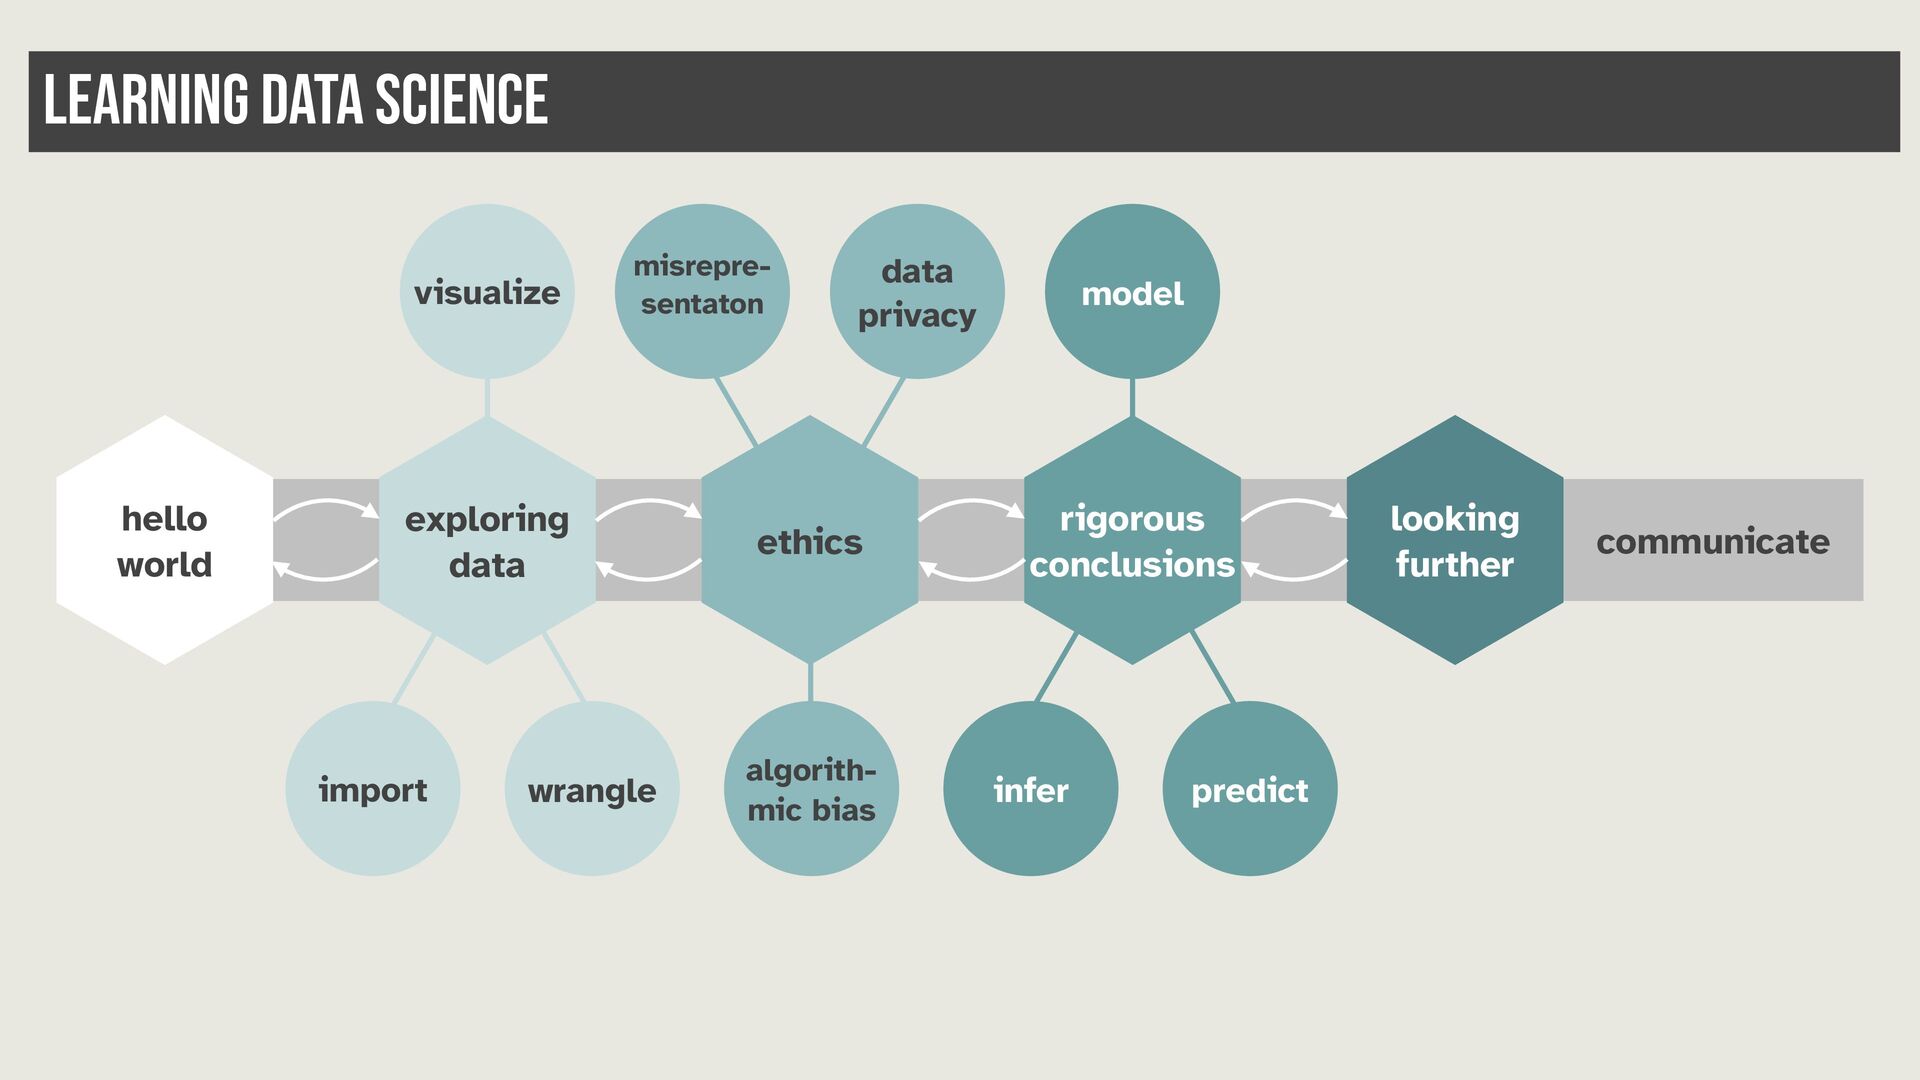
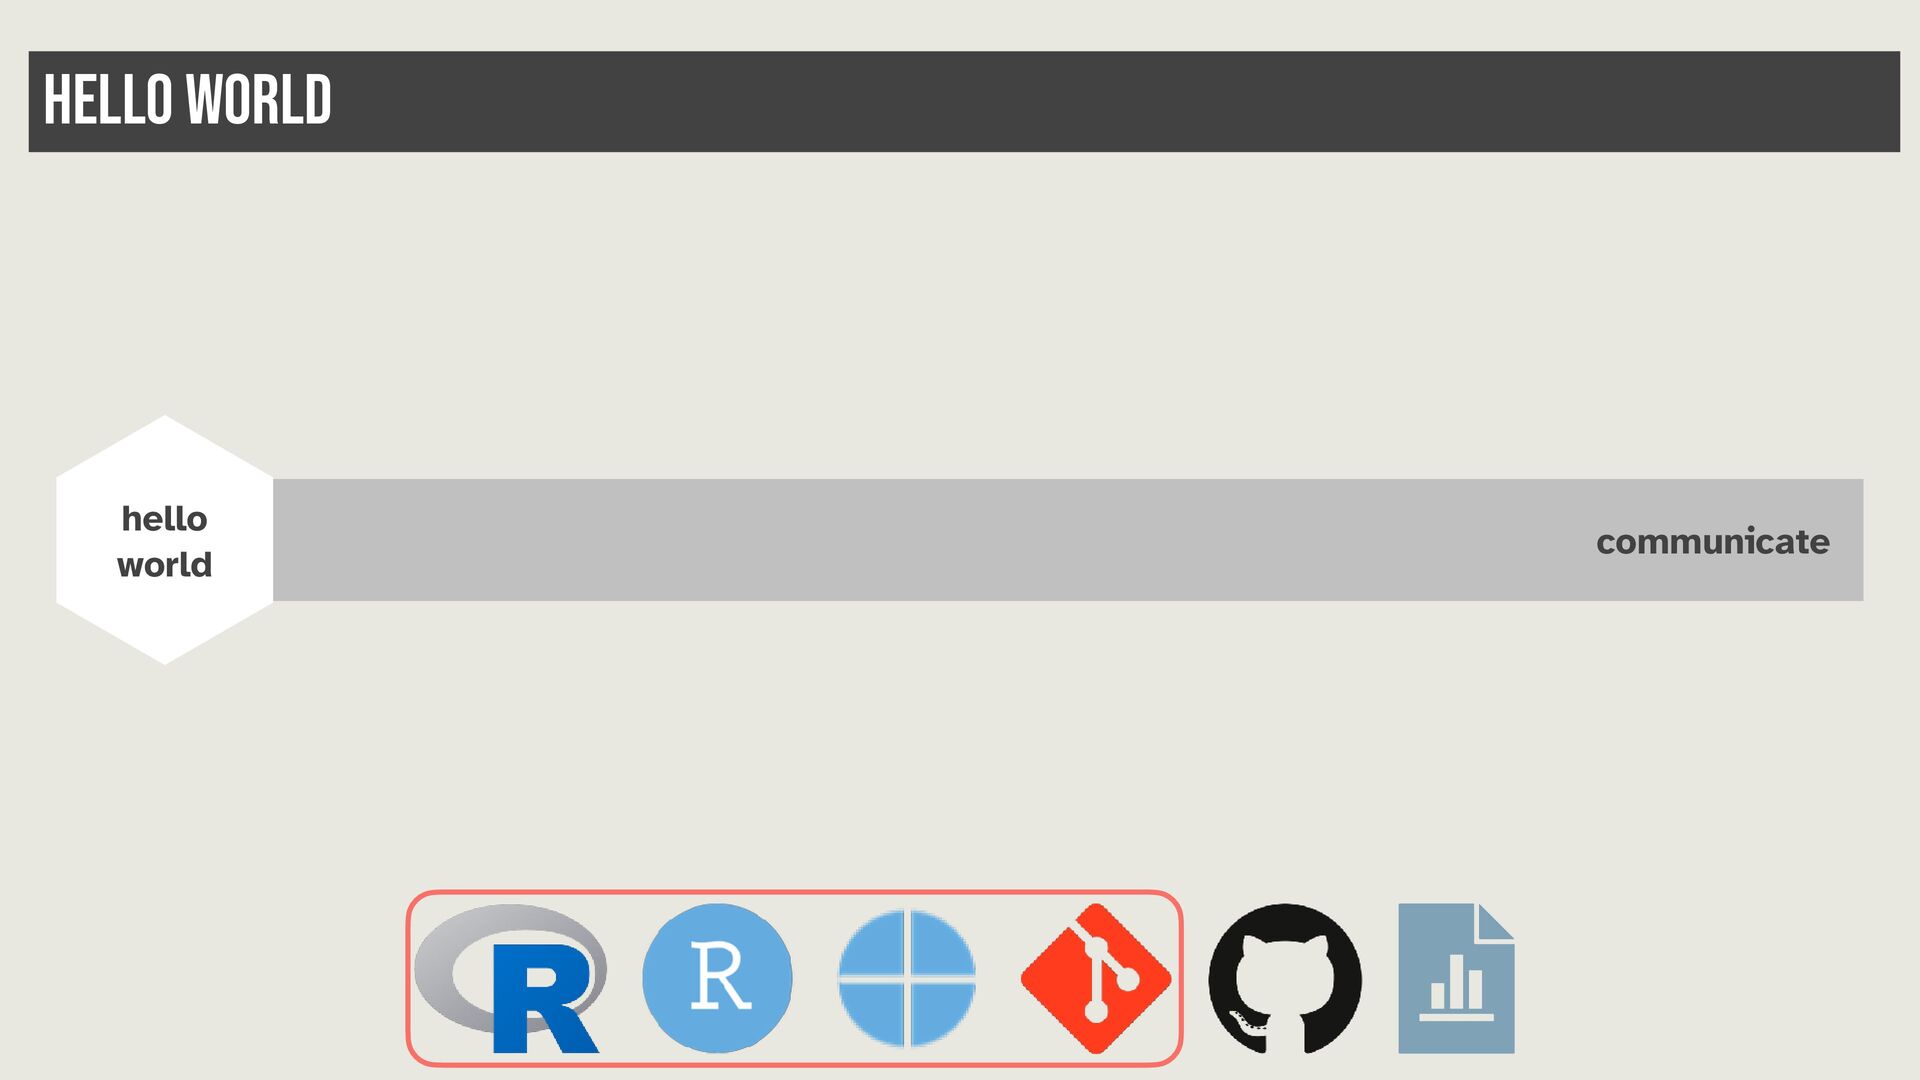
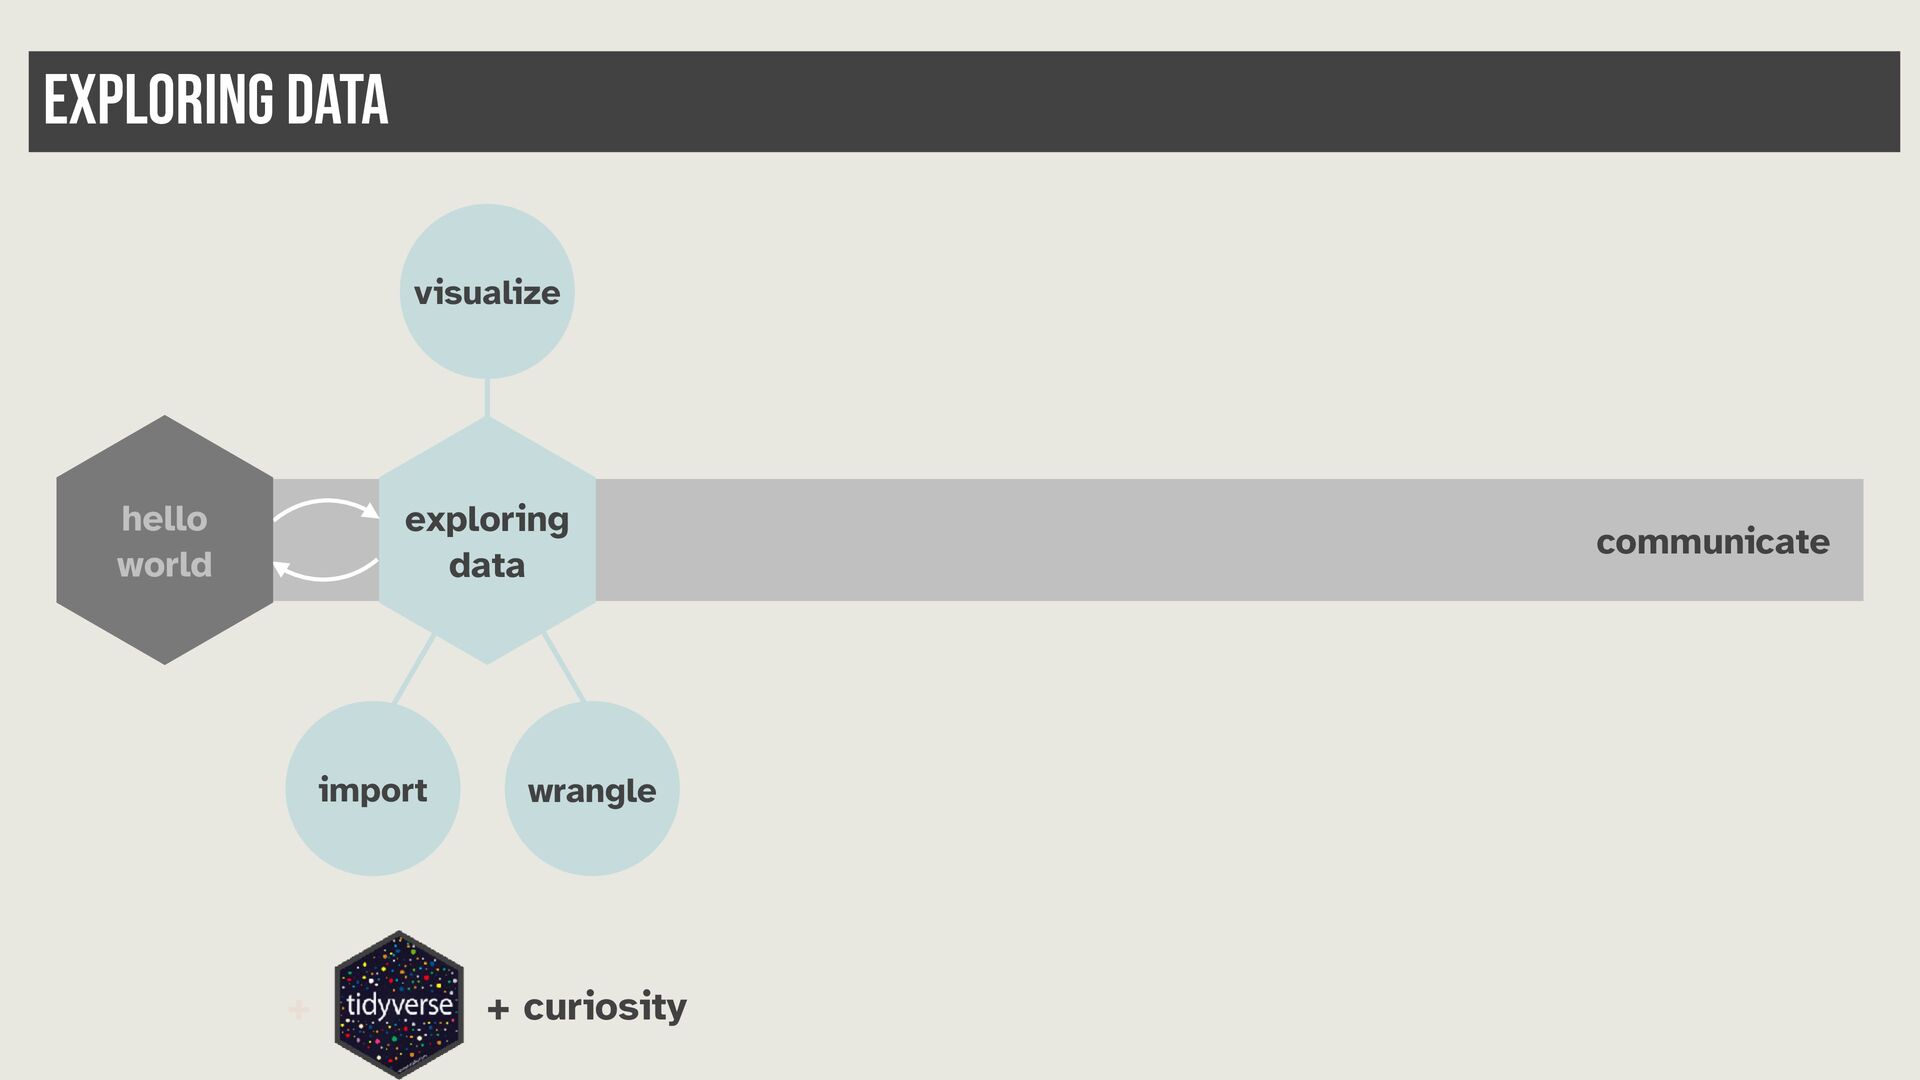
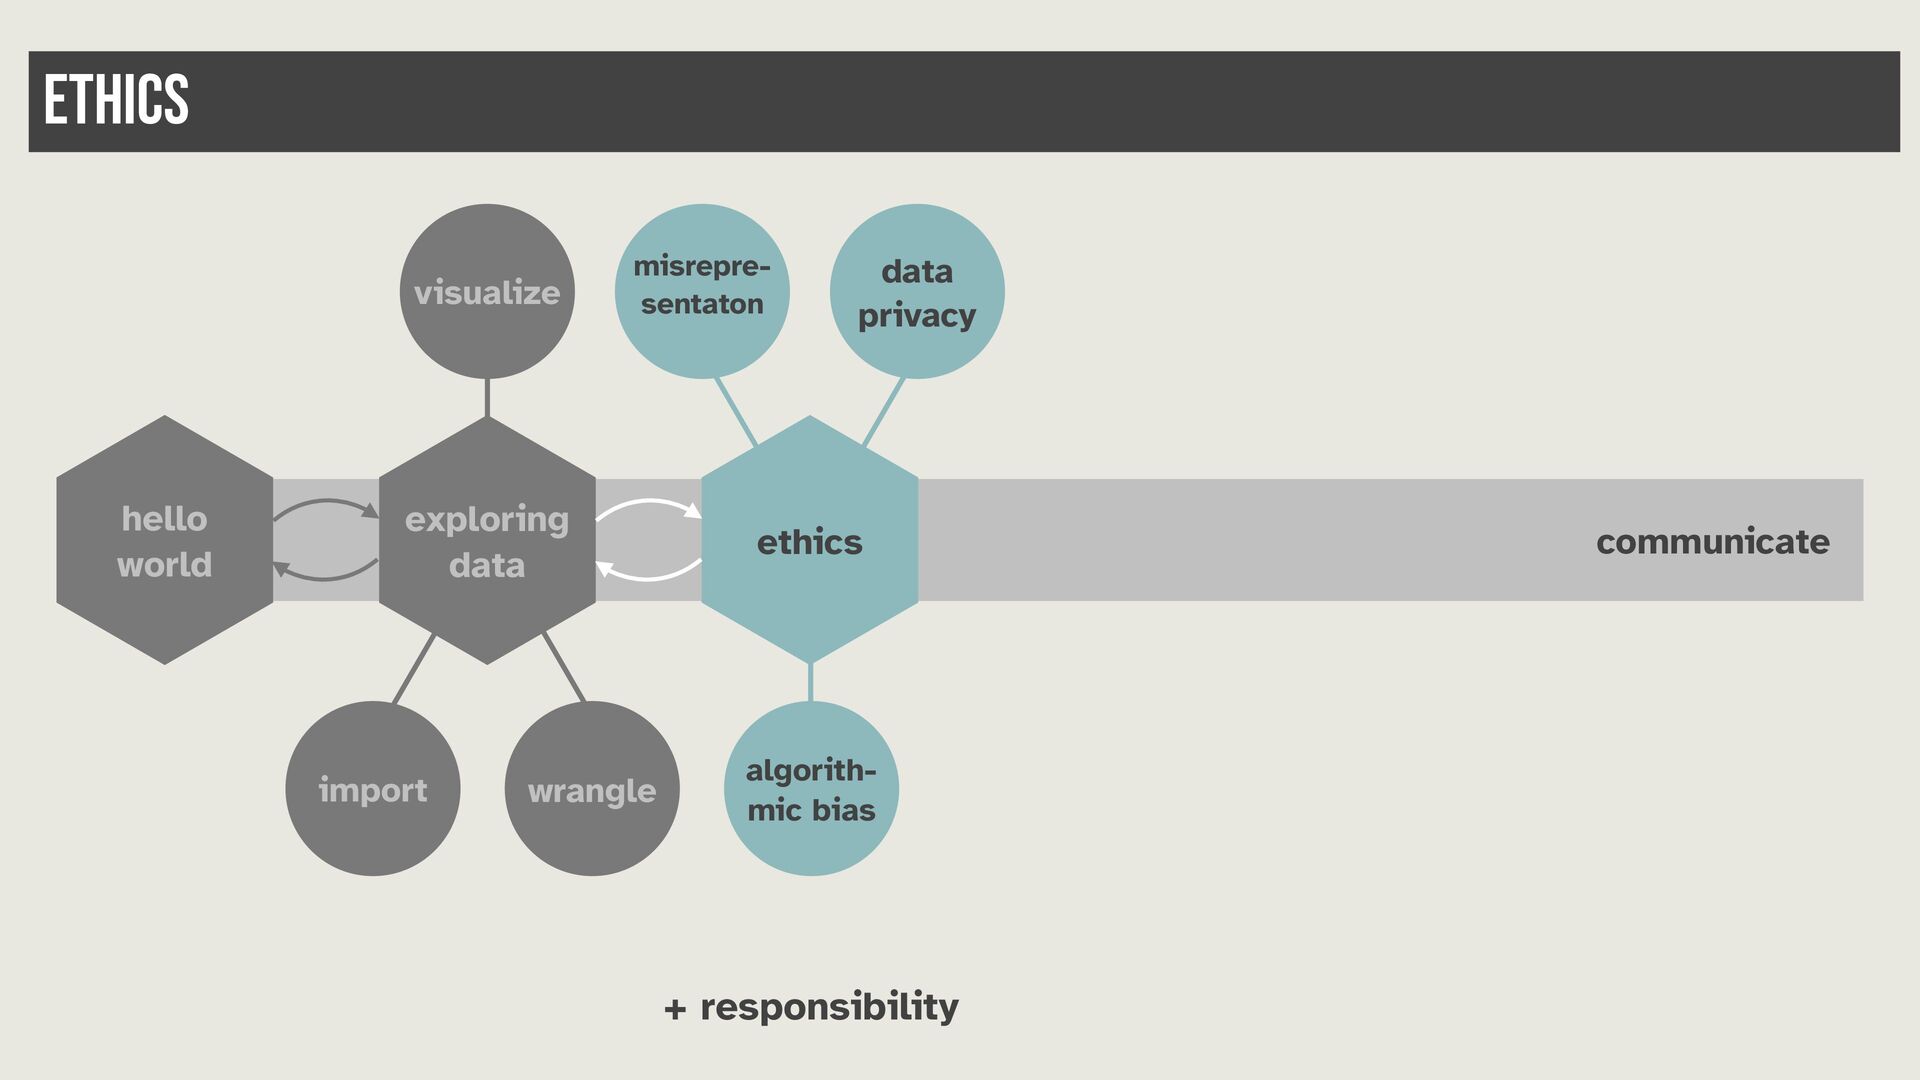
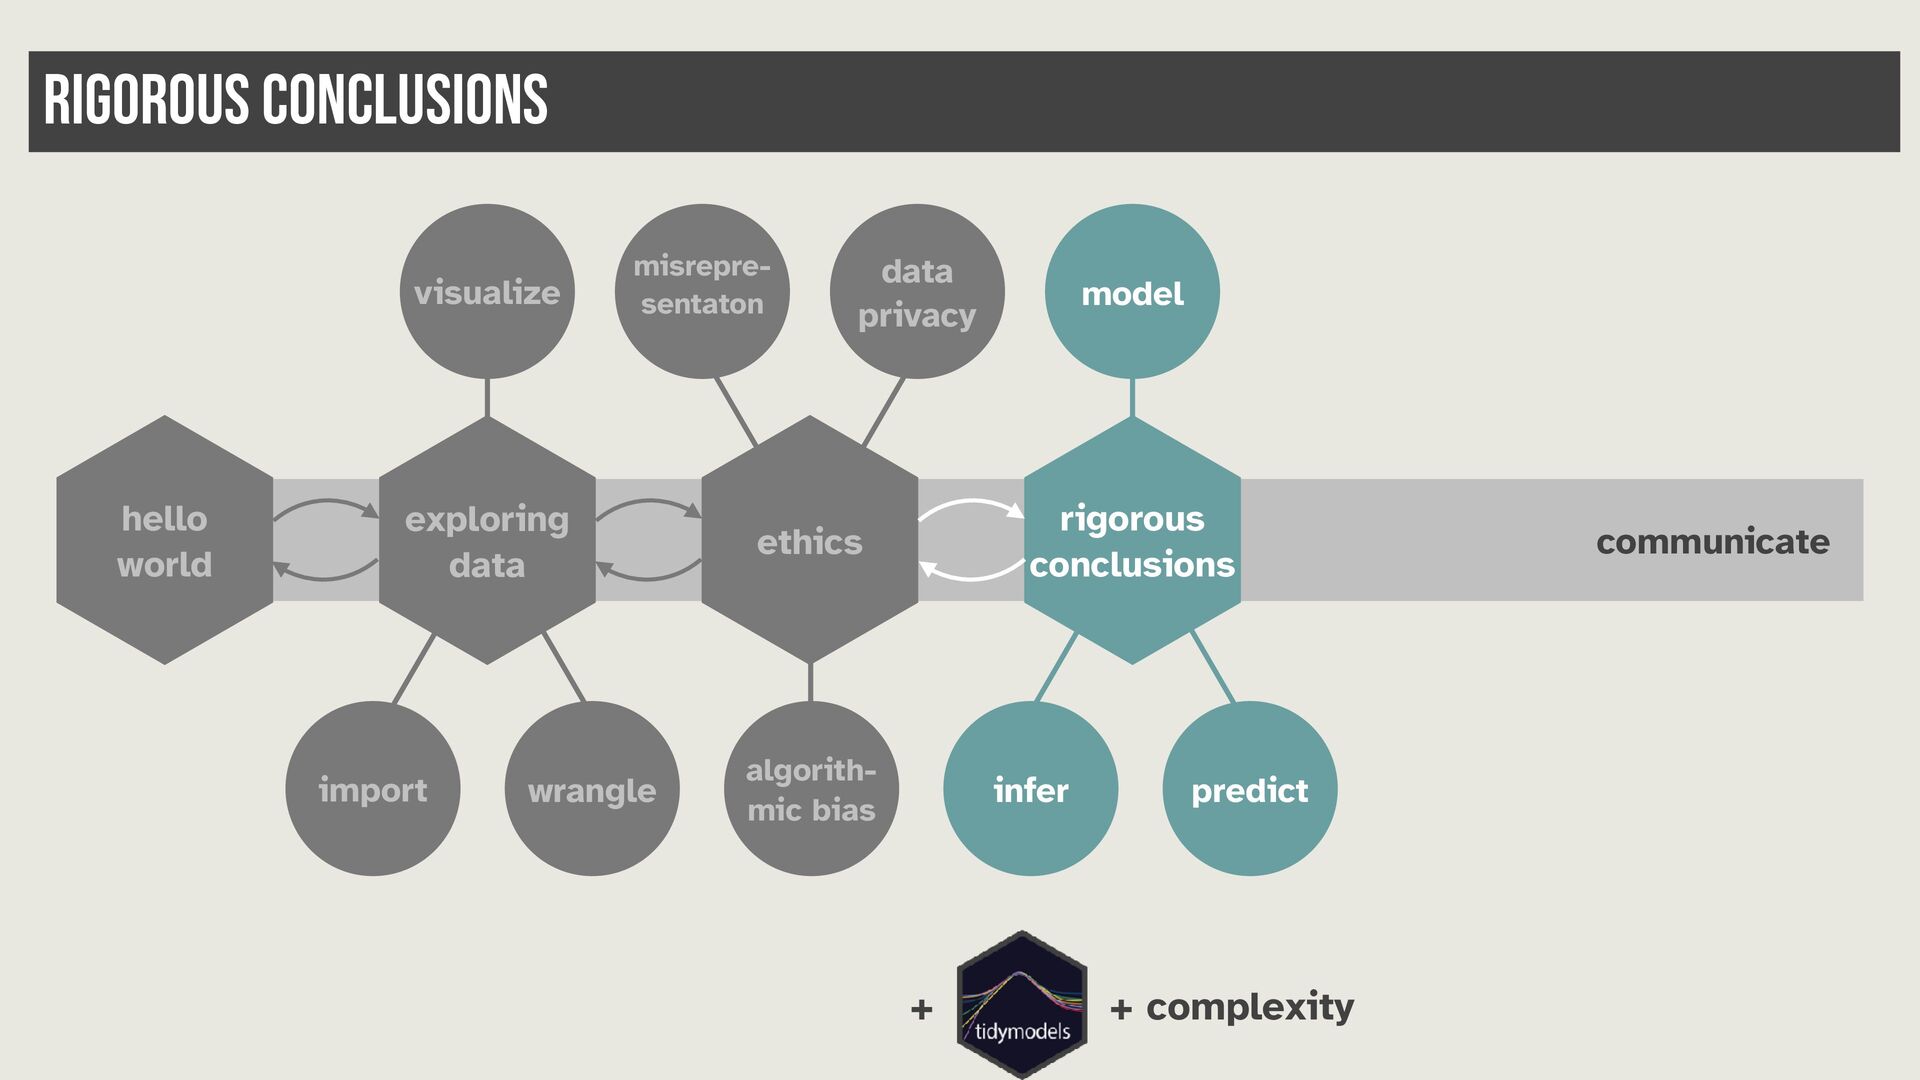
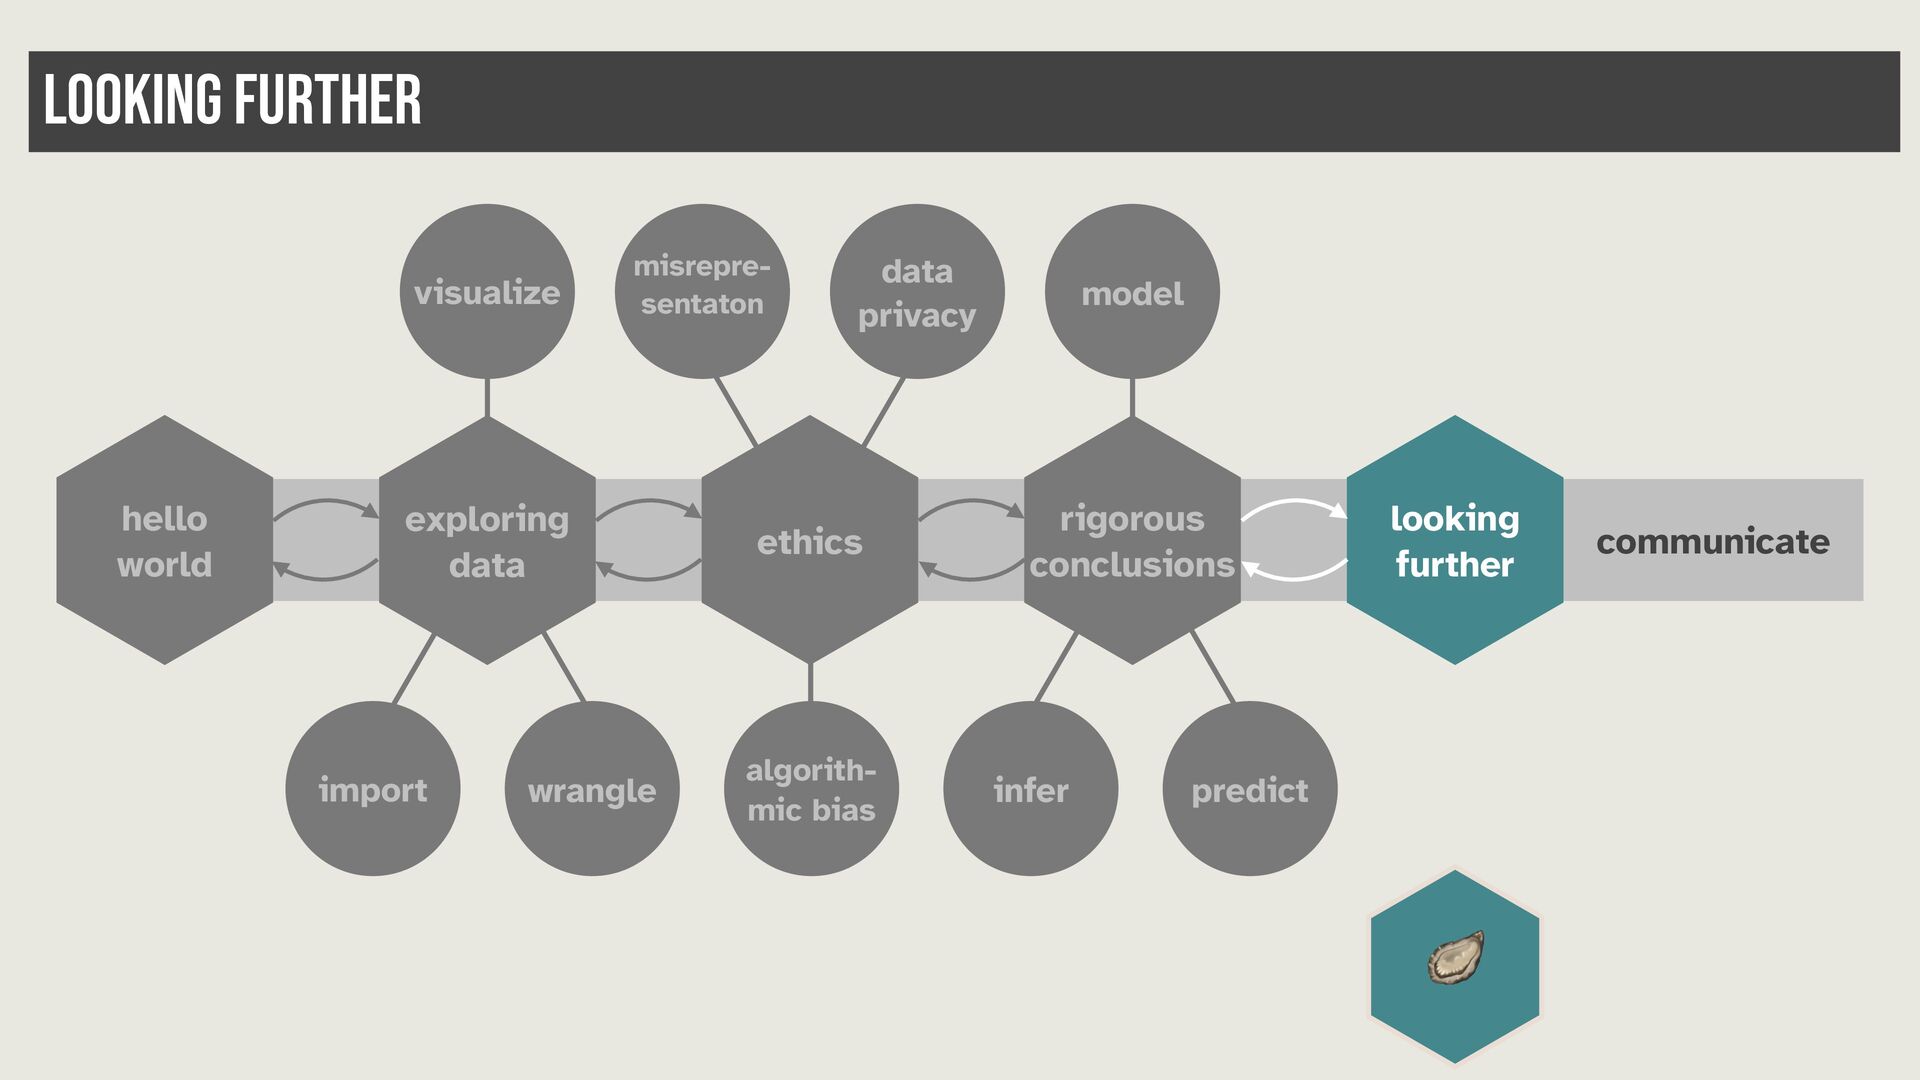
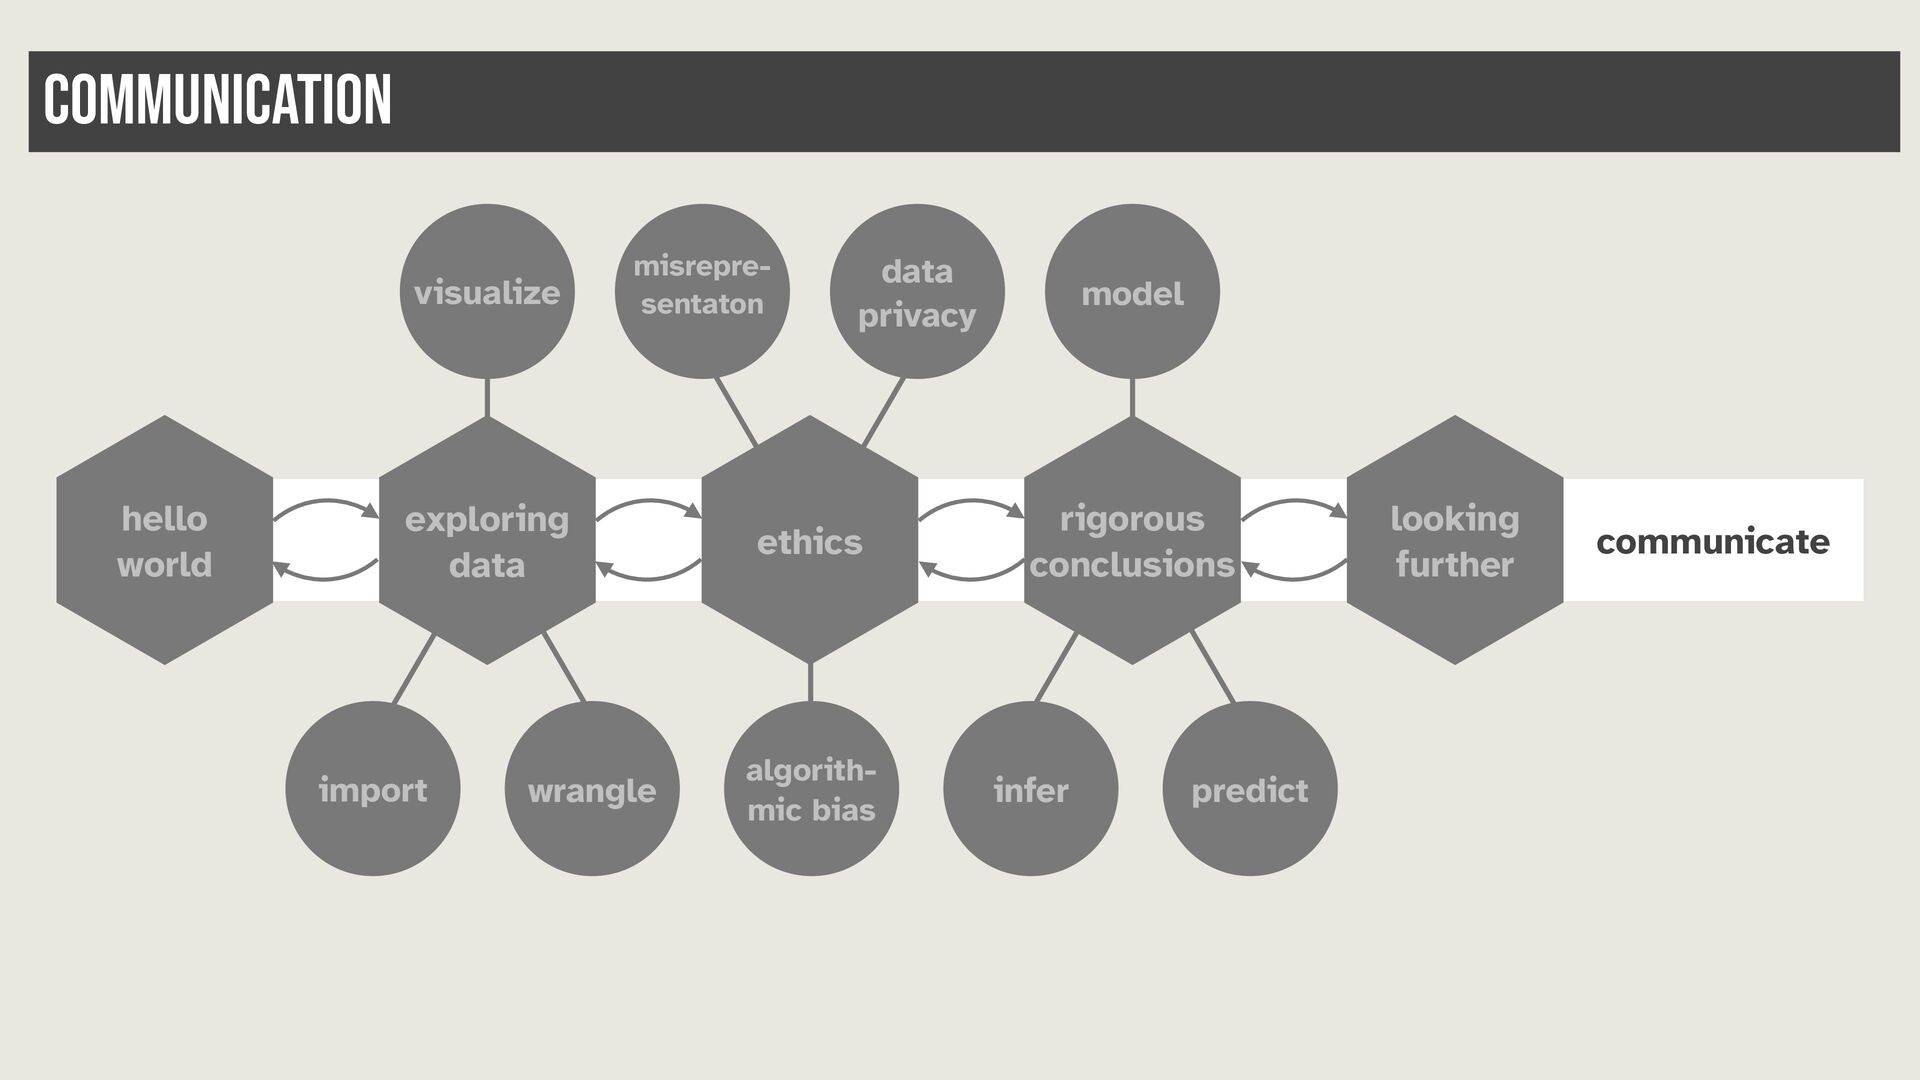
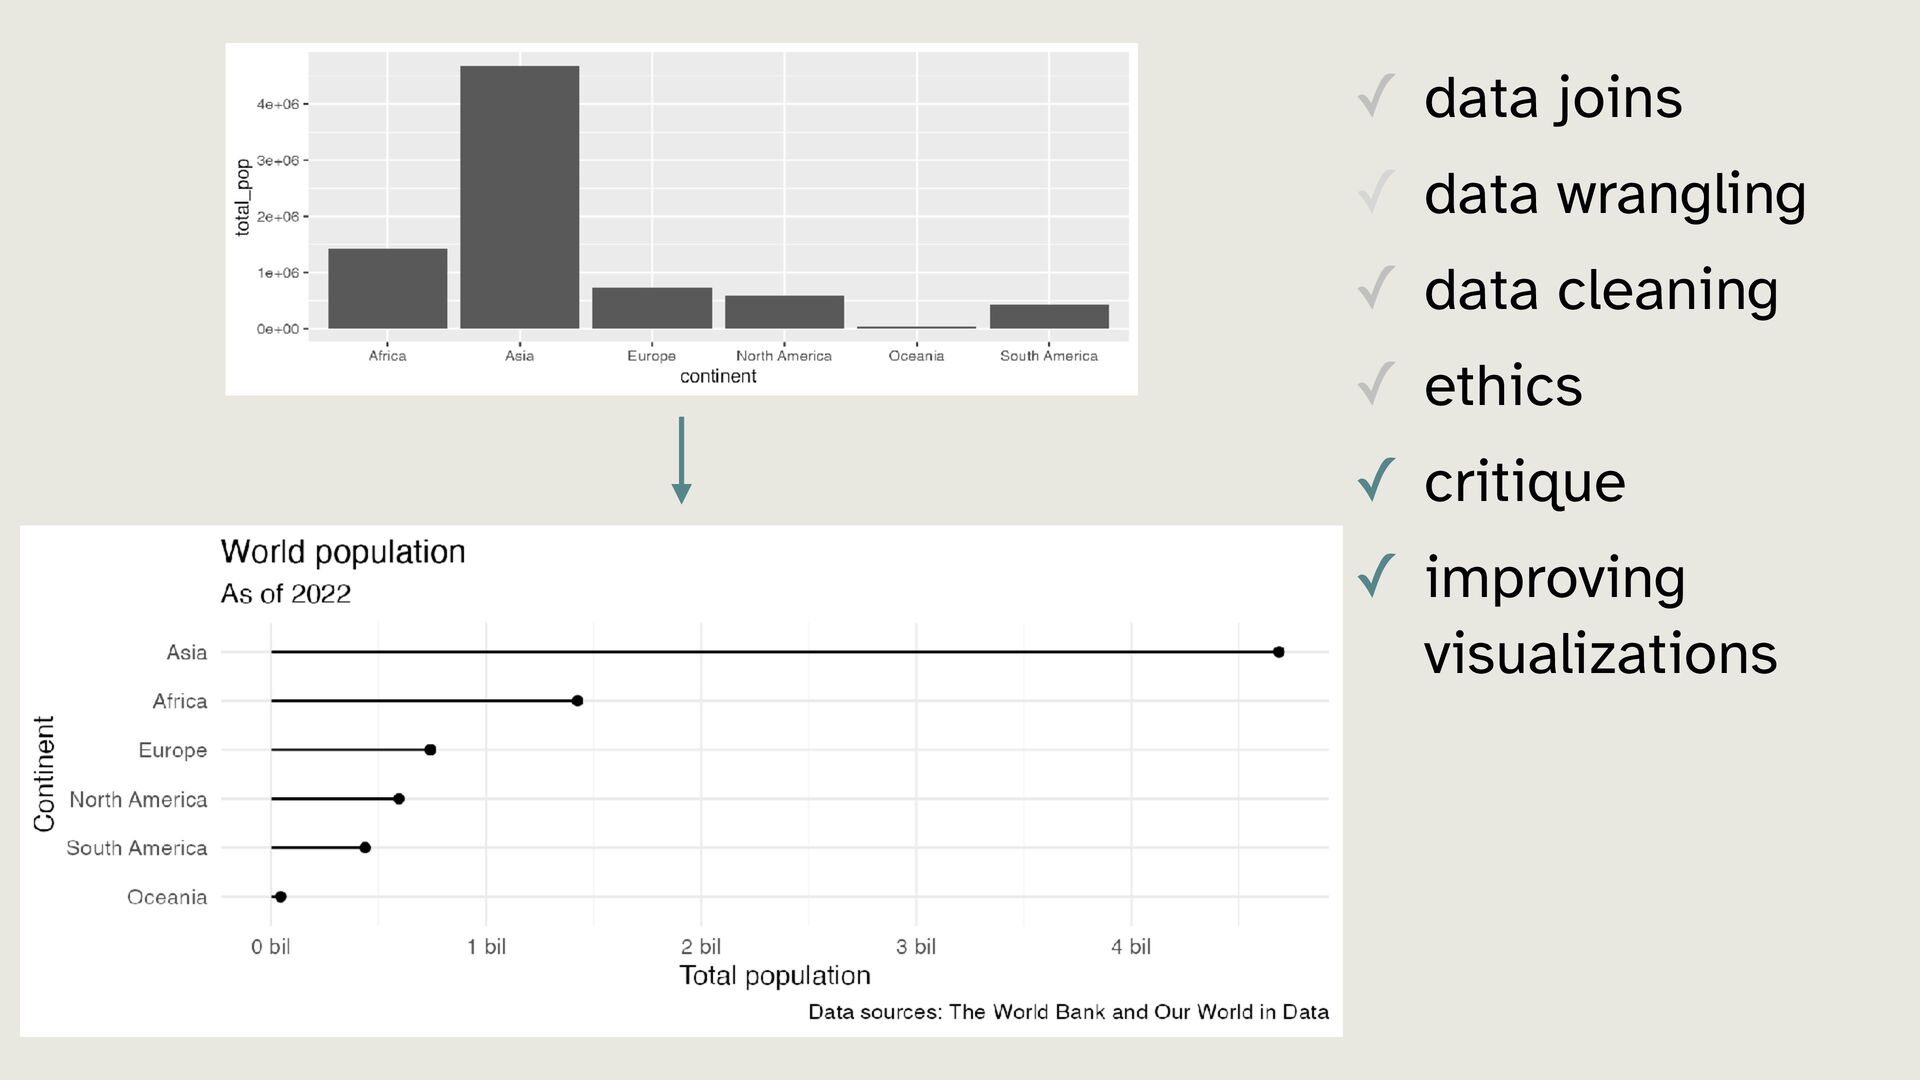
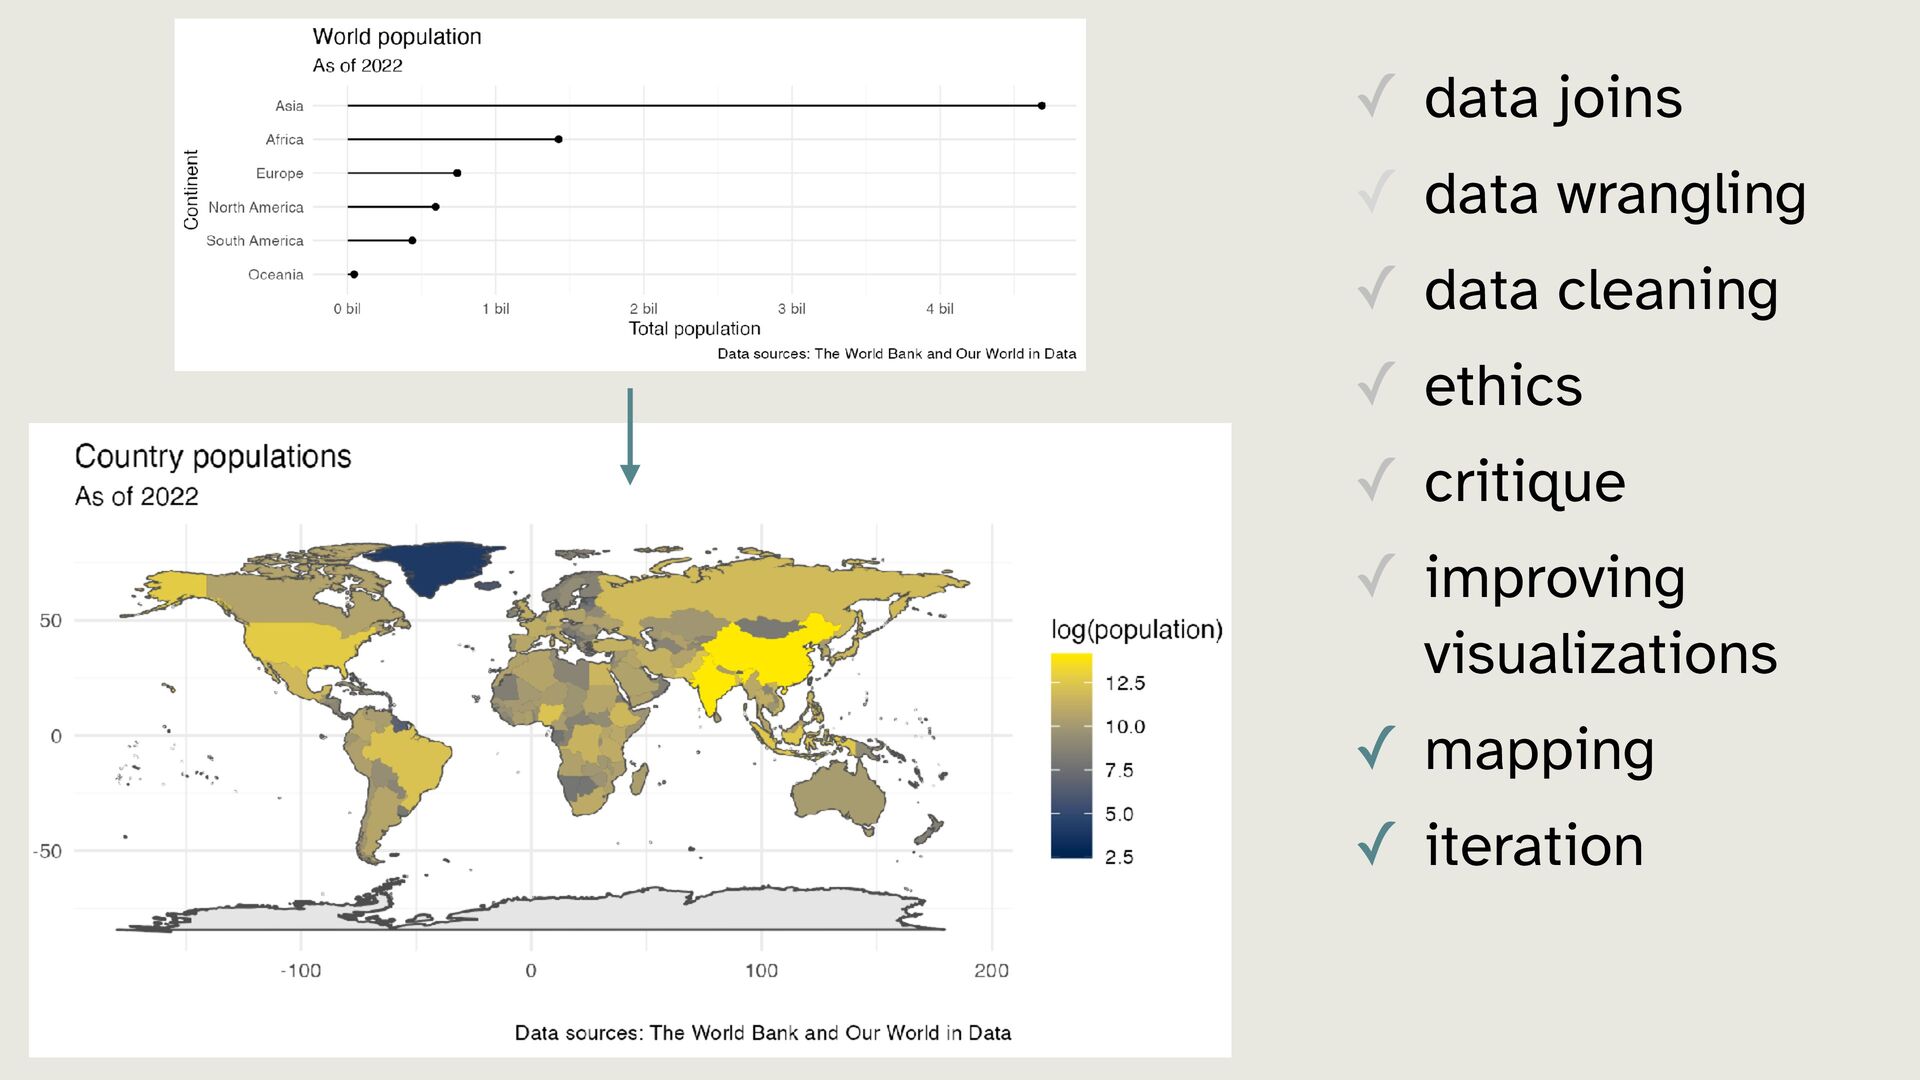
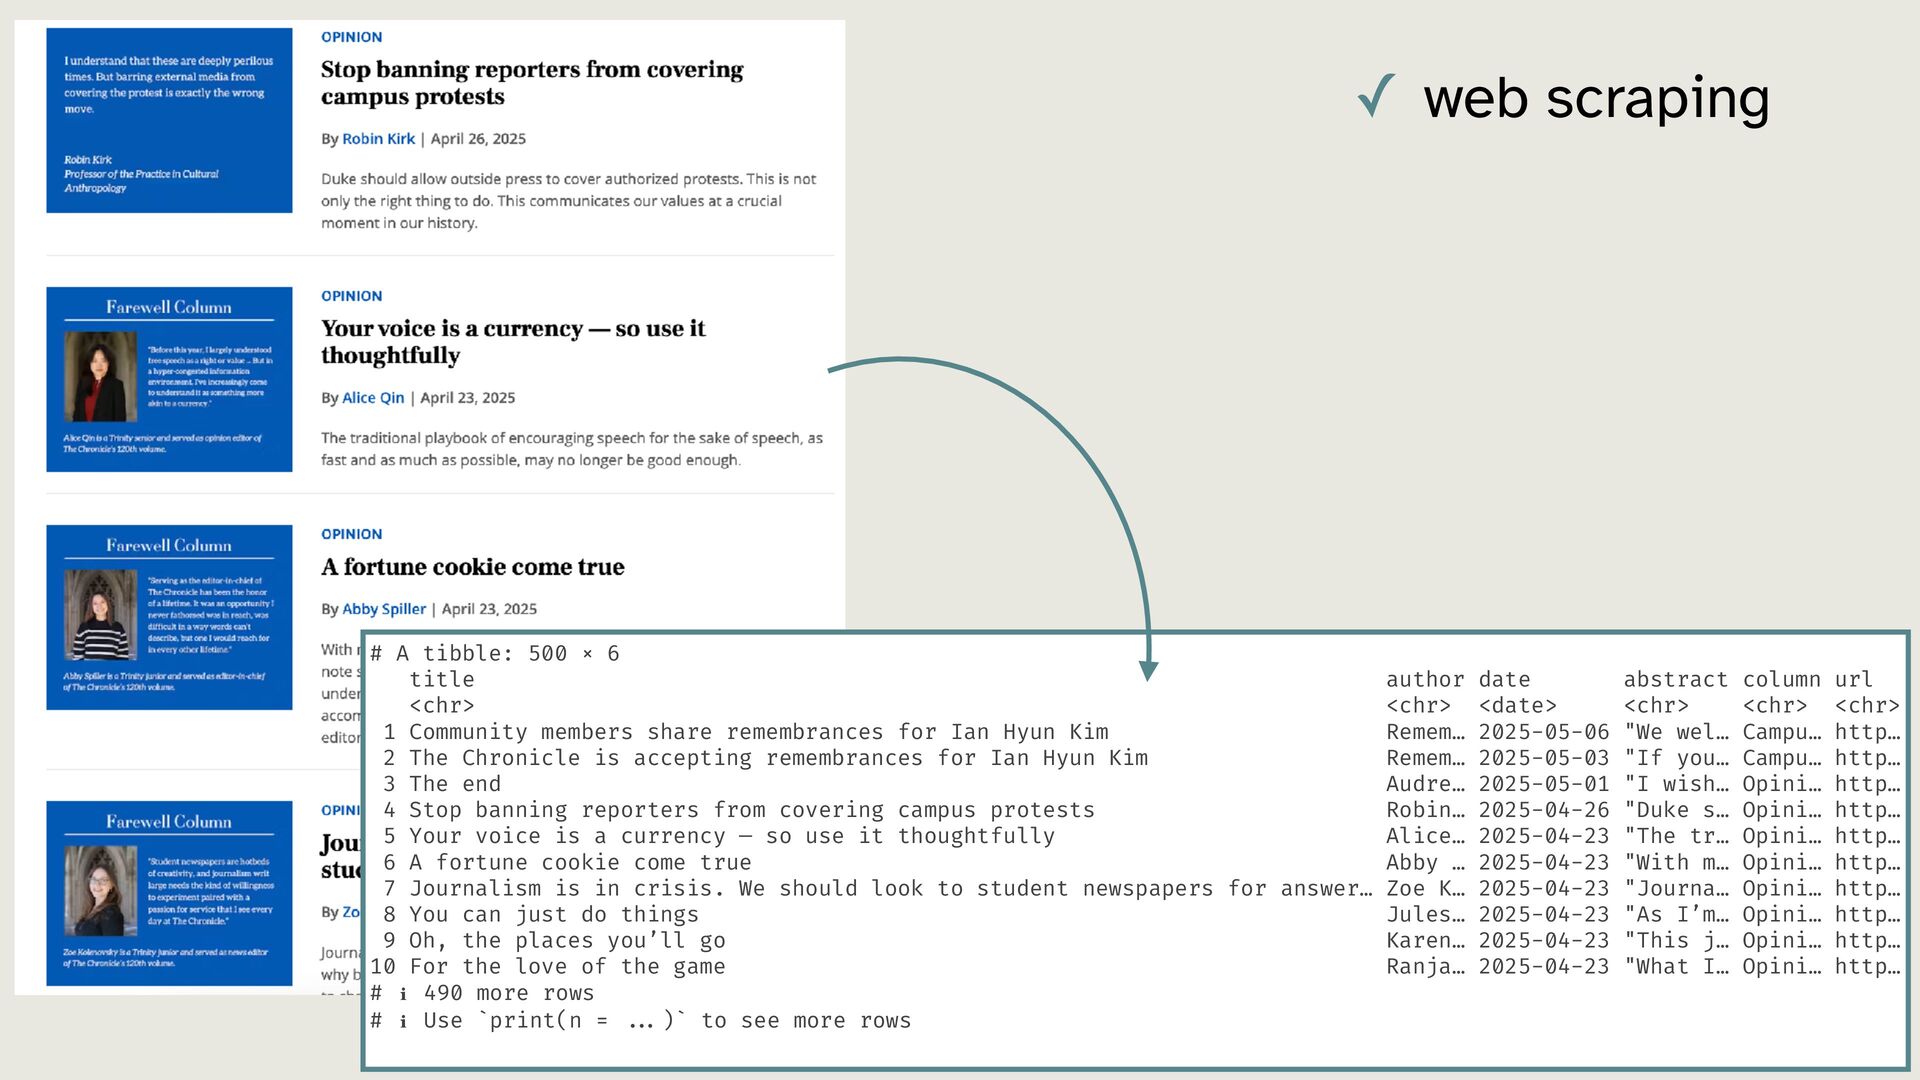
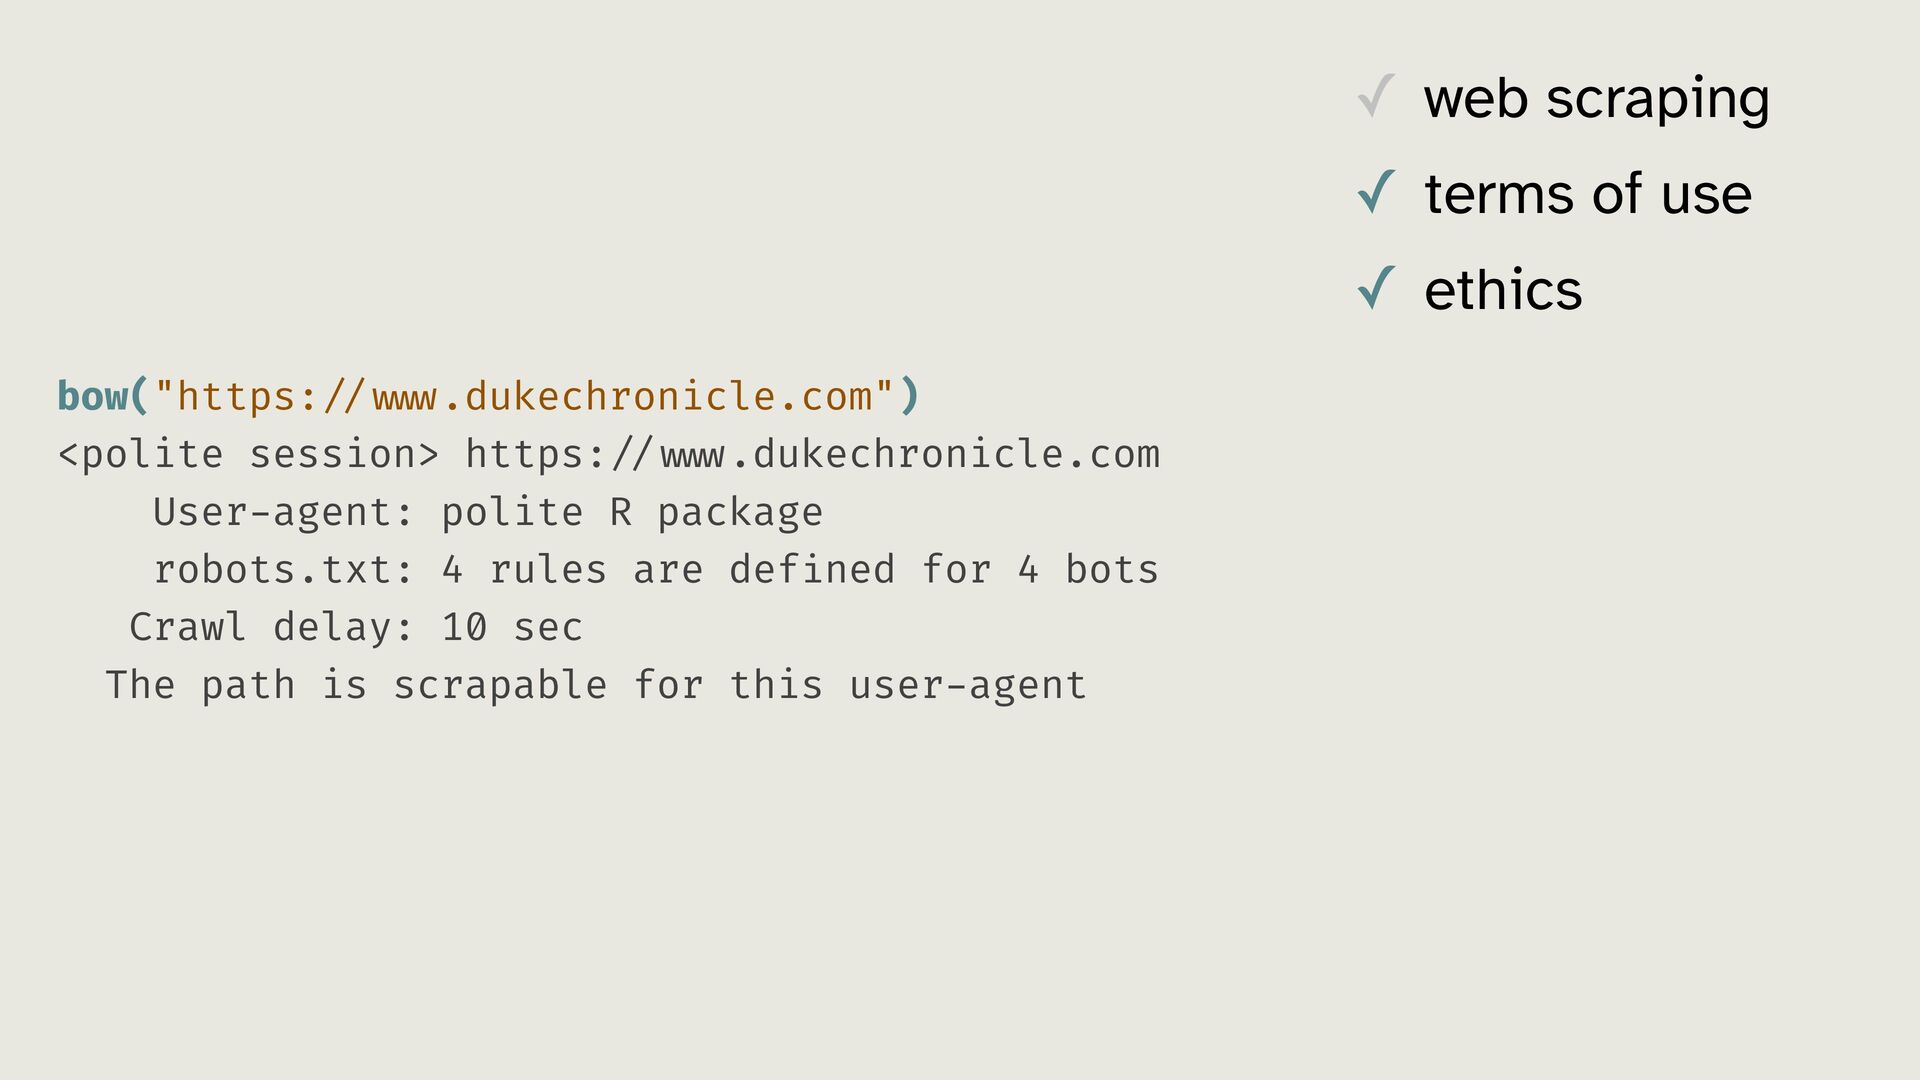
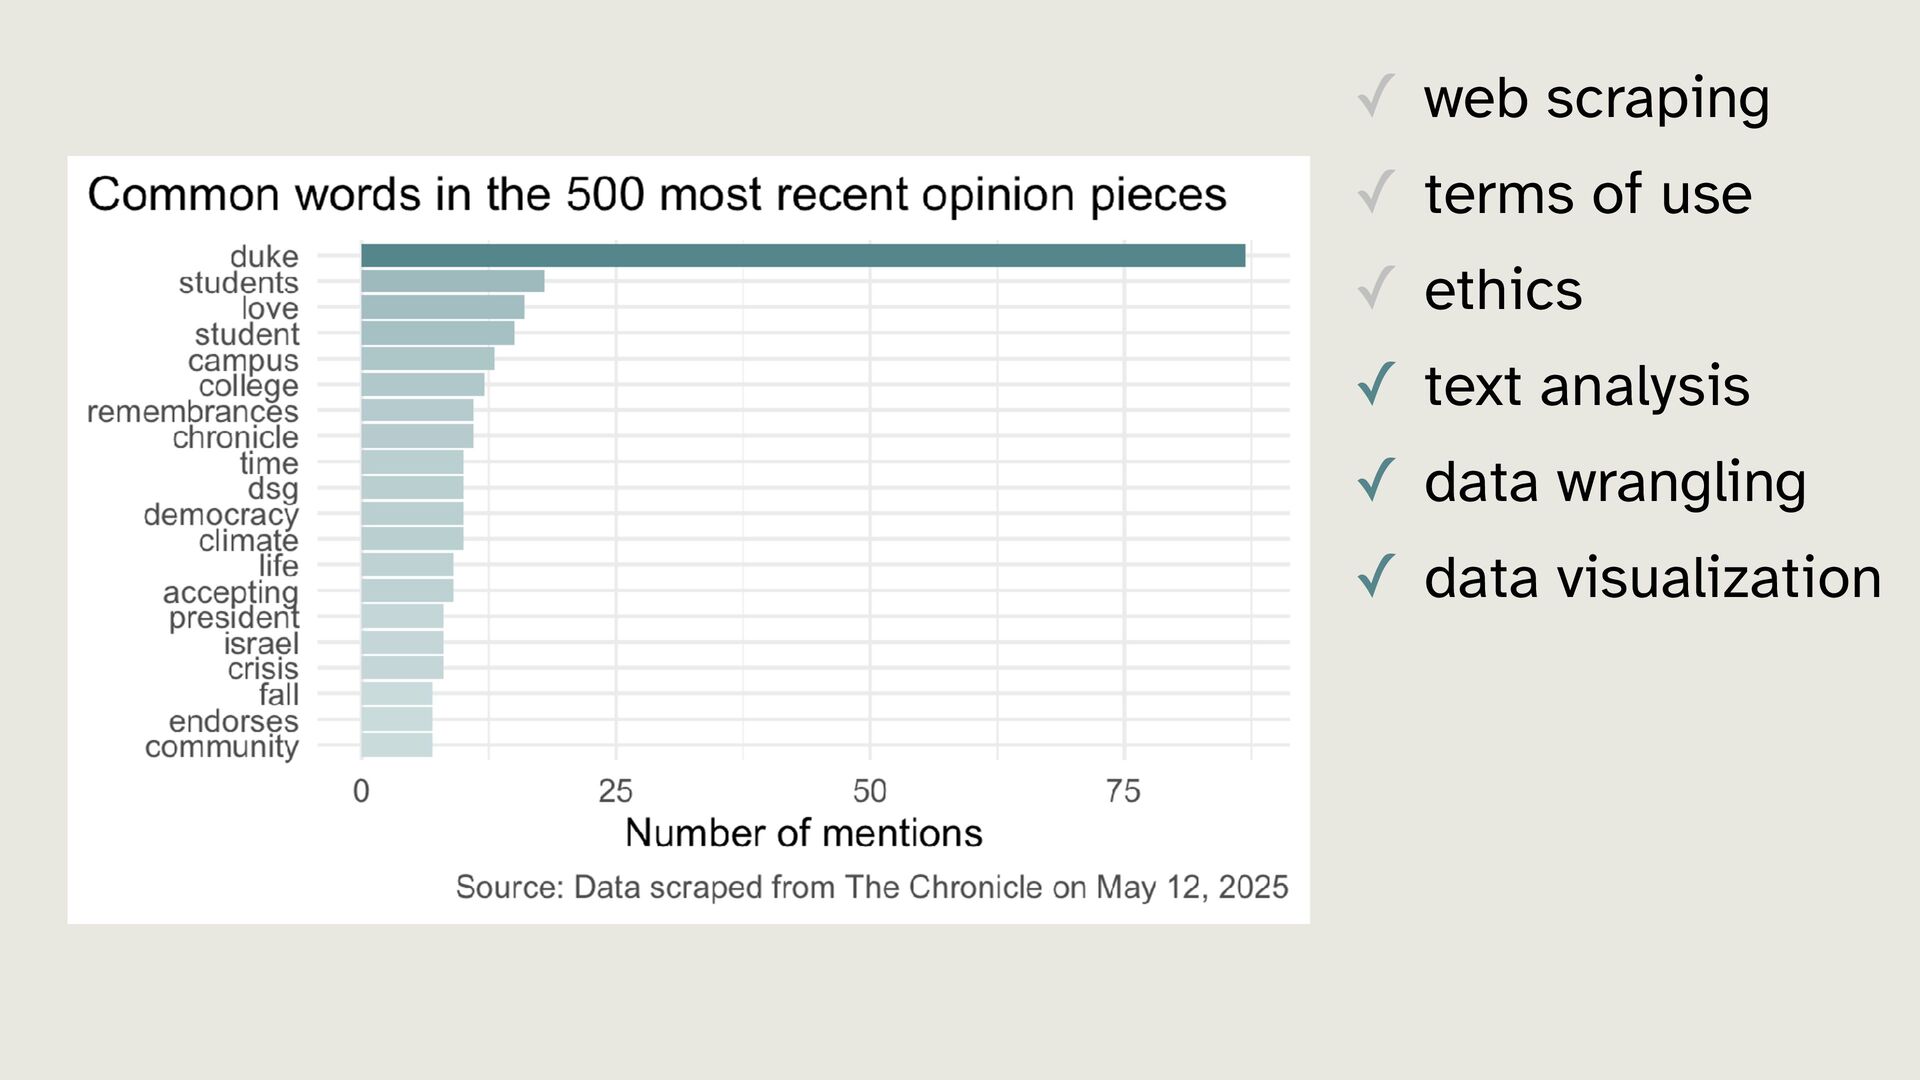
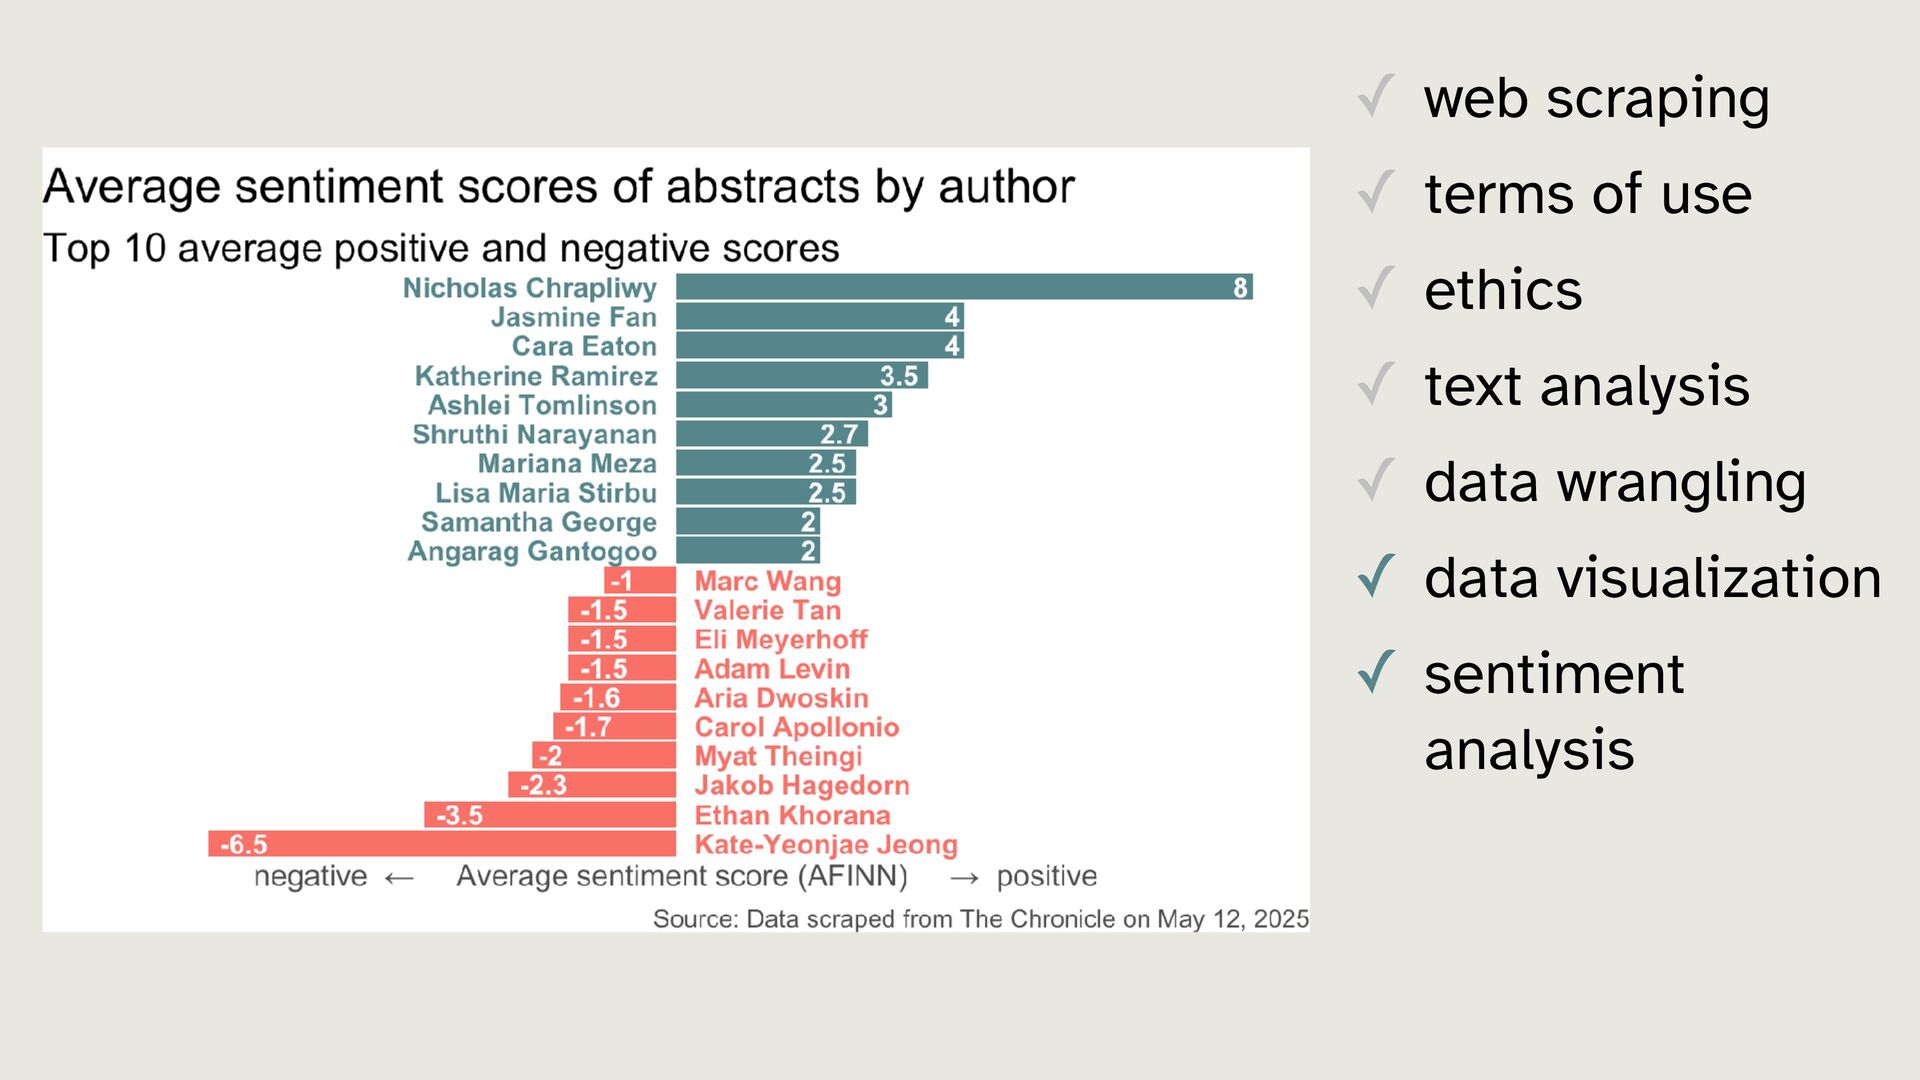
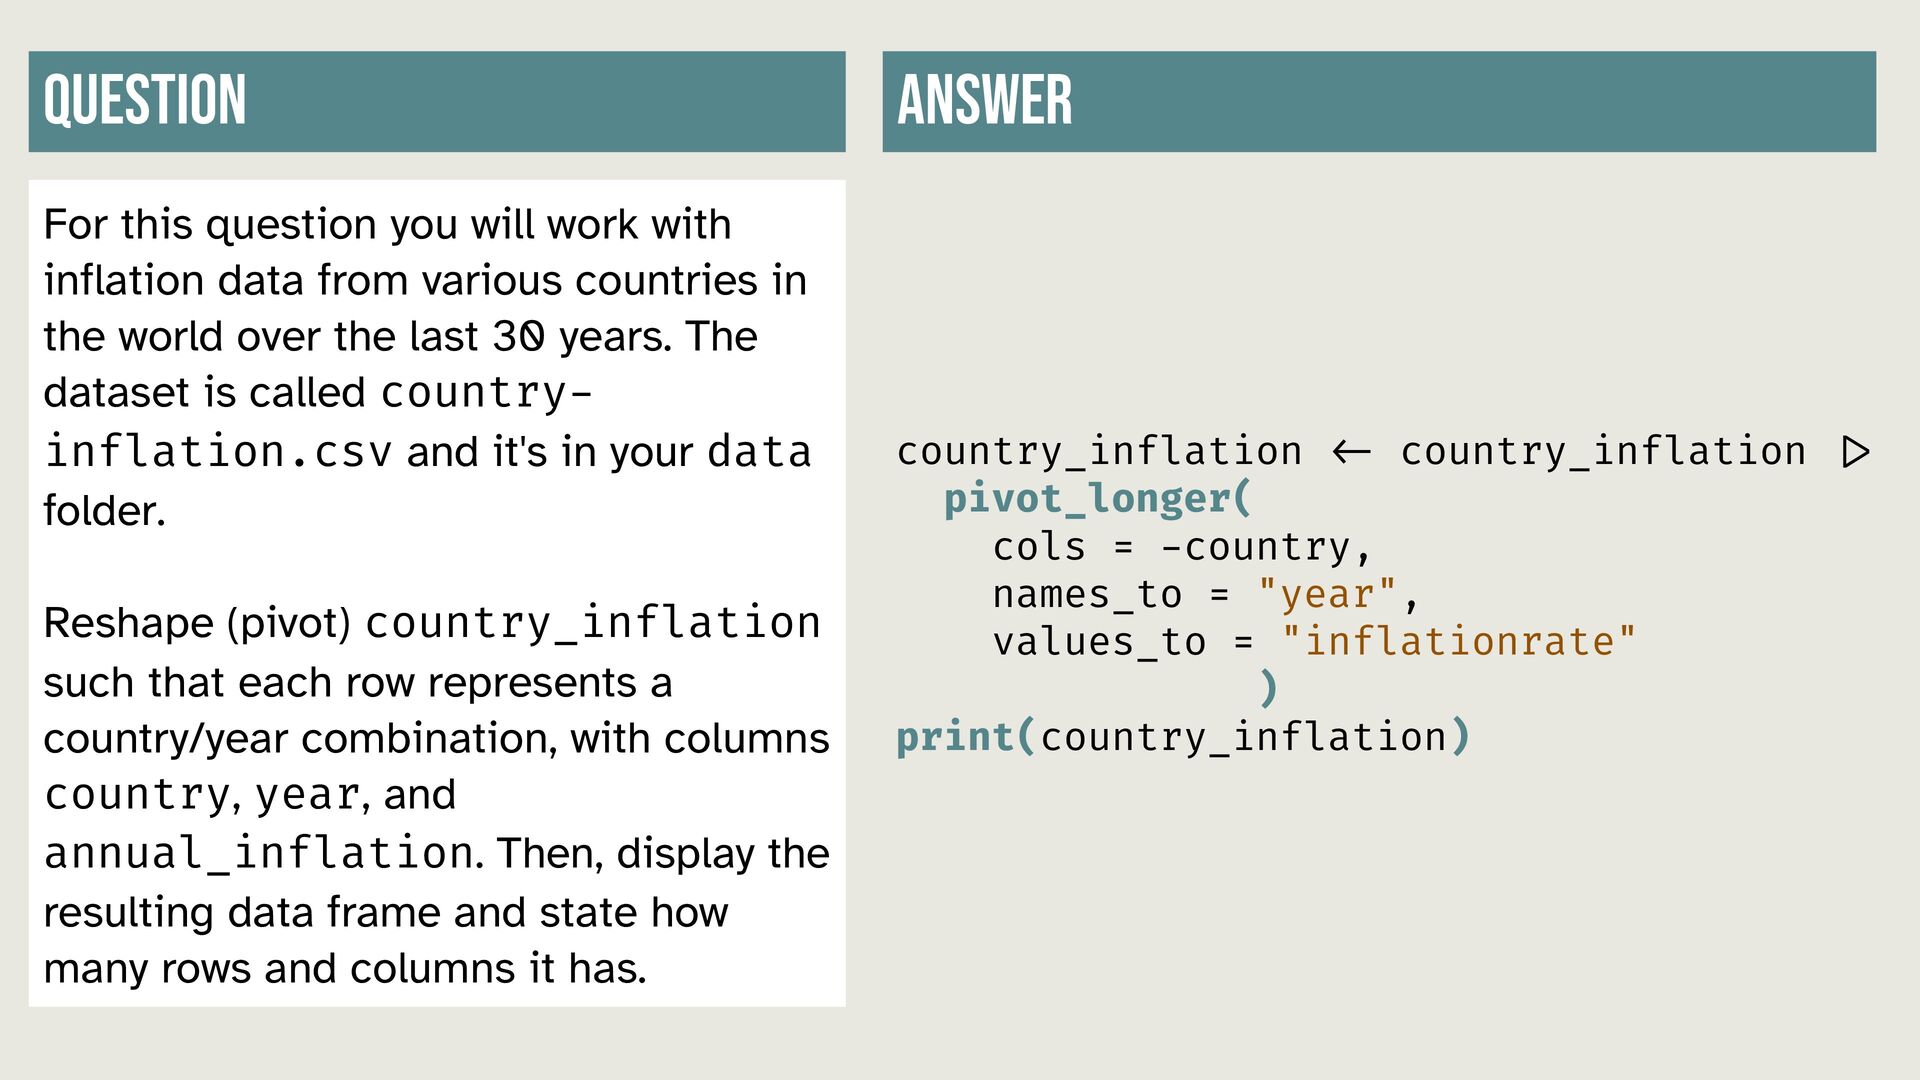
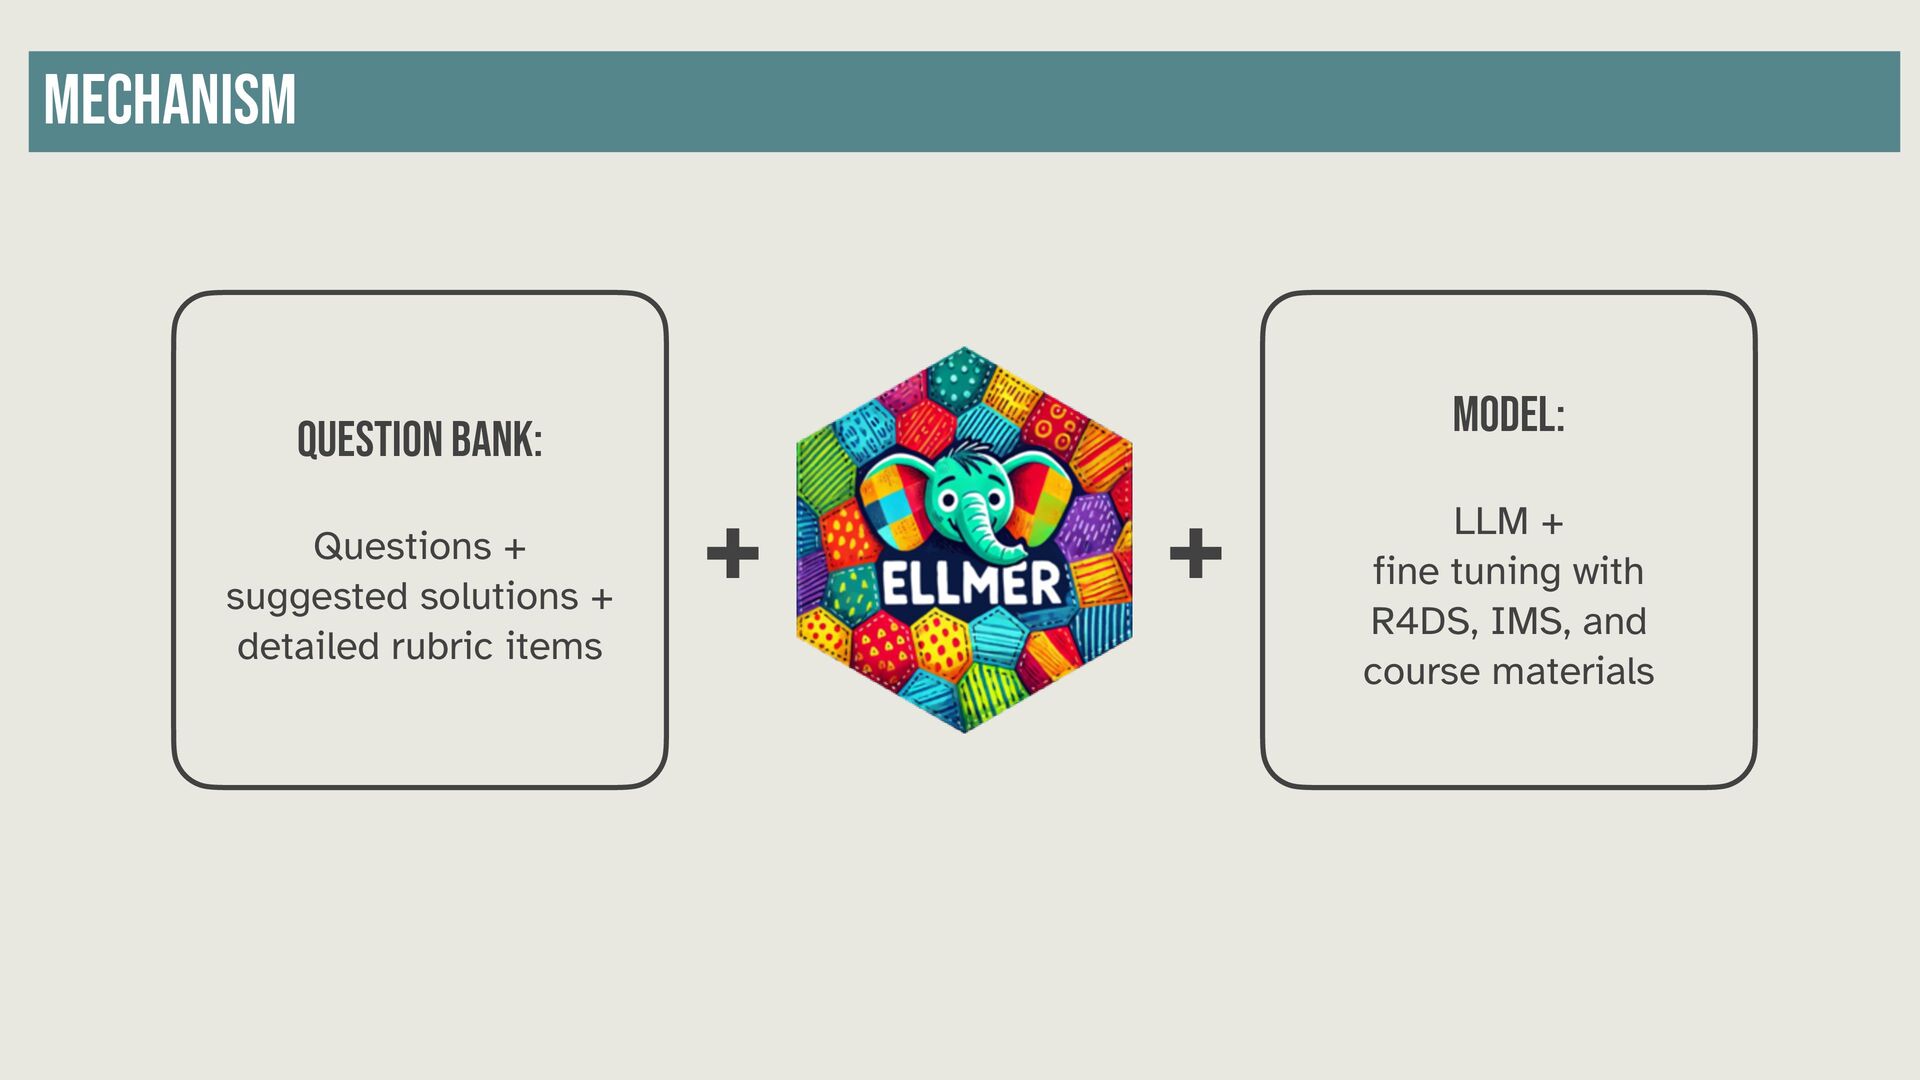
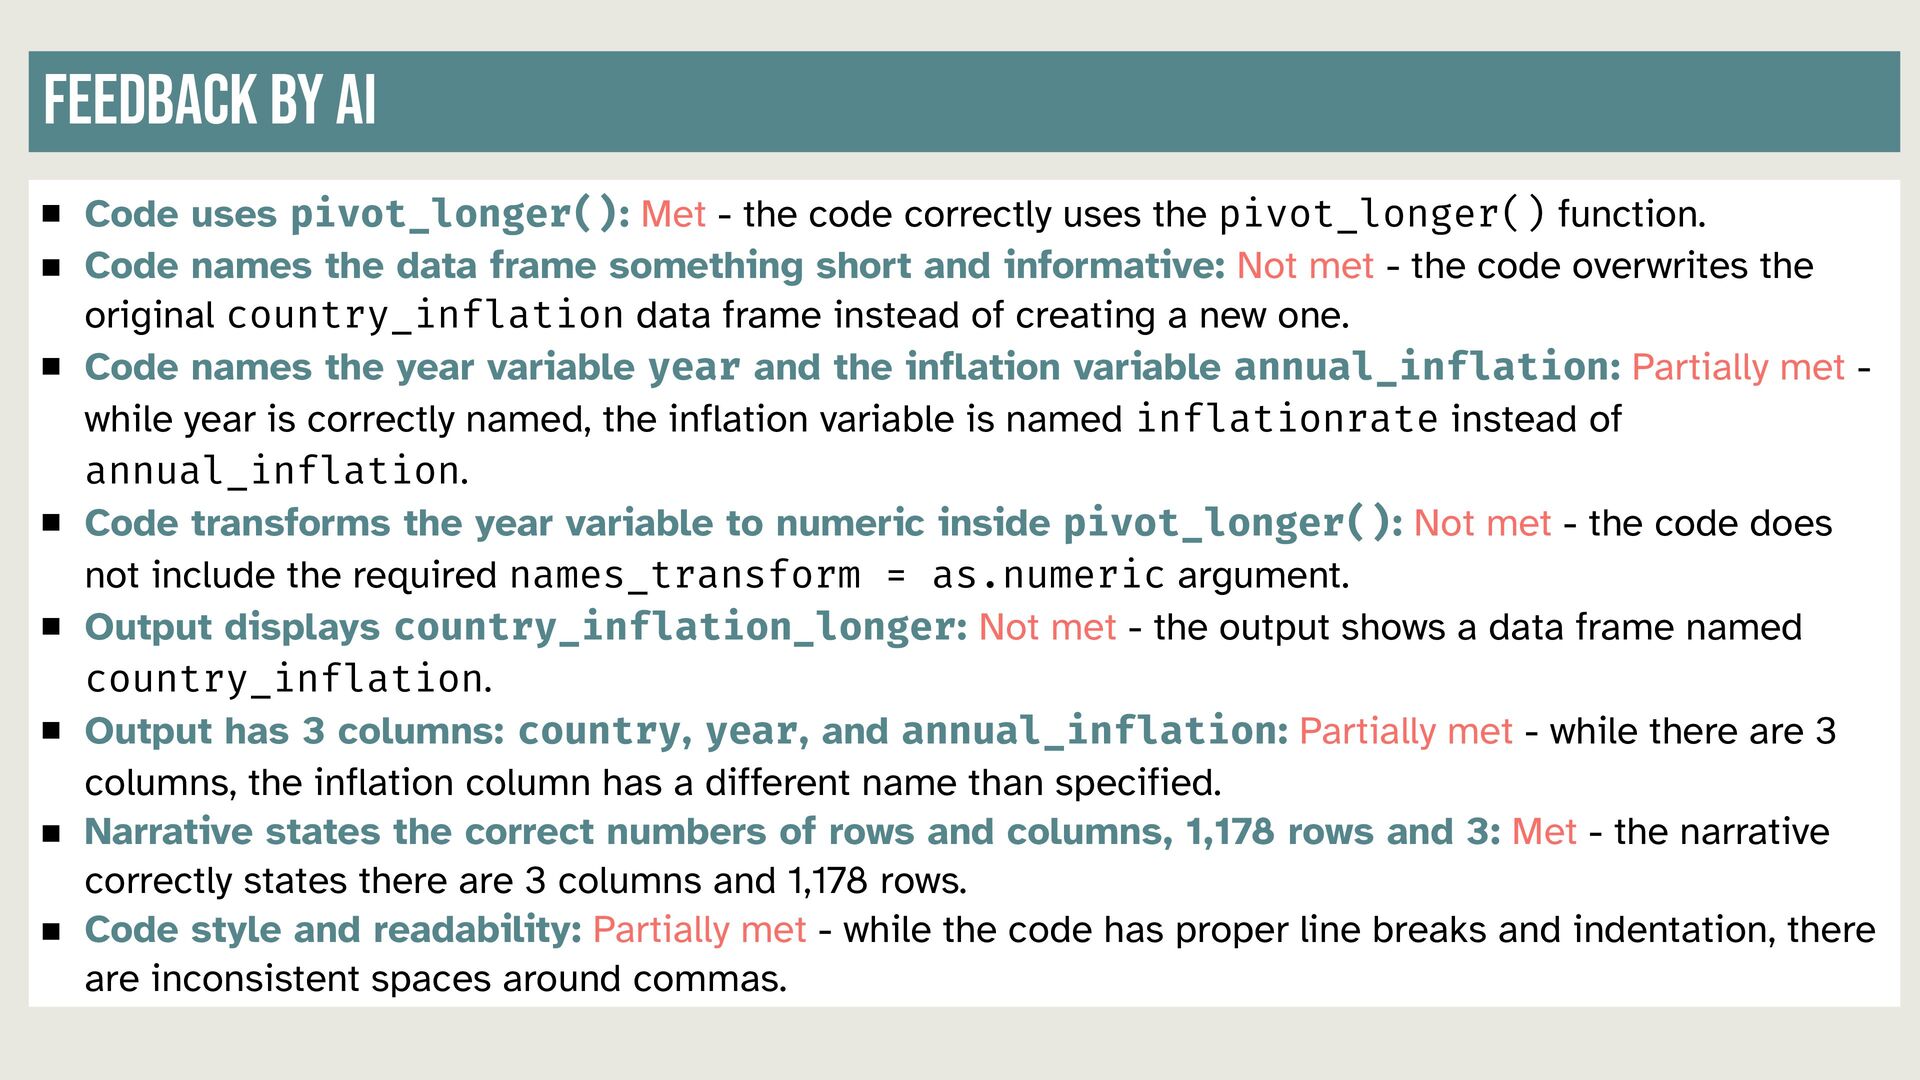
Statistics education stands at a critical juncture as we navigate the intersection of traditional statistical theory, modern computational approaches, and emerging AI technologies. This talk examines how statisticians can reimagine curricula by embracing computation as foundational elements rather than afterthoughts. While traditional statistics education has prioritized theoretical frameworks and applications, computation has emerged as the backbone of contemporary data analysis—from data acquisition and wrangling to visualization, modeling, and communication. Now, AI tools are further transforming this landscape, creating both opportunities and challenges for statistics and data science educators. The presentation will outline a forward-looking curriculum model for introductory courses that balances statistical thinking, data science methods, and explicit computational instruction.

Talk at UBC Statistics.

Avatar for Mine Cetinkaya-Rundel

Mine Cetinkaya-Rundel

May 13, 2025
Tweet

More Decks by Mine Cetinkaya-Rundel

Other Decks in Education

Transcript

  1. Pop Quiz You have been given a data set (poisson.csv)

    of count observations along with two features - one numerical and the other categorical. Fit a Poisson regression model to these data with R. Report the estimates for the regression coefficients you obtain and interpret them in the context of the data.
  2. Did do a “good job”? Would it get full credit?

    No. Would it get partial credit? No. Probably. Maybe it shouldn’t?
  3. Pop Quiz You have been given a data set (poisson.csv)

    of count observations along with two features - one numerical and the other categorical. Fit a Poisson regression model to these data with R. Report the estimates for the regression coefficients you obtain and interpret them in the context of the data.
  4. You have been given a data set (poisson.csv) of count

    observations along with two features - one numerical and the other categorical. Fit a Poisson regression model to these data with R. Report the estimates for the regression coefficients you obtain and interpret them in the context of the data.
  5. David Spiegelhalter Professor, University of Cambridge “There is no substitute

    for simply looking at data properly.” from “The Art of Statistics”
  6. Mine Çetinkaya-rundel Professor, Duke university Over-promiser “This talk examines how

    statisticians can reimagine curricula by embracing computation as foundational elements rather than afterthoughts.” from My abstract
  7. Data science modeling probability theory Elective Elective Case studies Elective

    More modeling Math Stat Statistical computing with computational labs
  8. Jiang, Yue. STA 440 - Fall 2024. www2.stat.duke.edu/courses/Fall24/sta440.001. Crickets Crickets

    are highly nutritious and provide a cost-effective source of dietary protein […] In the present study, we analyze the life history traits in order to compare productivity of these four species when reared in various conditions. […] Provide a high quality, careful exploratory analysis. Is there anything unusual about the data that might suggest issues with the experimental protocol? Which species is most suited to cultivation? Analyze the growth, reproductive trajectory, and mortality of the species. Are some more suited for cultivation for others with respect to reproduction and growth? Is there a particular time in their life cycle when you see premature mortality? […] Each project must be submitted as a GitHub repository with, at a minimum, a reproducible Quarto document.
  9. This observation is a joke made famous by the late

    comedian Mitch Hedberg. [There’s an old blog post that does this in Python…] Note that both websites have changed substantially in the last decade and the original approaches no longer work. Scraping the Denny's site involves the traversal of a hierarchical series of location and restaurant pages […] This data collection must be constructed in a reproducible fashion - all web pages being scraped should be cached locally and each analysis step should be self contained in a separate R script. You will also create a Makef i le that will run your R scripts and render your report. […] To make our lives even more complicated, La Quinta's website now makes use of Javascript which makes using tools like rvest more difficult. […] Using the results of your scraping you should analyze the veracity of Hedberg's claim. […] Like your previous assignments we have included a GitHub action which is designed to provide feedback on the reproducibility of your assignment. […] Rundel, Colin. STA 323 - Spring 2025. sta323-sp25.github.io. La Quinta is Spanish for next to Denny's
  10. In the twentieth century, avant-garde composers experimented with new techniques

    for composing music. […] He would write music by simulating random processes, either in the physical world or on a computer. To put it crudely, whatever the simulation spit out, that’s what he’d write on paper and hand to the musicians to play. The art of this approach lay in how the simulation was constructed. […] In this lab, we will write our own pieces of stochastic music. We will do this using the gm package by Renfei Mao. […] Your task here is simple: play. Play, and surprise yourself. Set up a simulation, and use the output to randomly determine the elements of a piece of music: the melody, harmony, rhythm, meter, pitch, articulation, instrumentation, etc. The sky is truly the limit. The goal is to generate music that contains surprising emergent properties that you would not have anticipated based on the rules of the system you designed. To complete this lab, please upload […]: an R script, an mp3 file, and a paragraph describing the thought process behind the simulation you set up […] and anything that surprised you. Zito, John. STA 240 - Spring 2025. sta240-s25.github.io. Rhapsody in R
  11. Program Import Tidy Communicate Understand Transform Model Visualize Wickham, H.,

    Çetinkaya-Rundel, M., & Grolemund, G. (2023). R for Data Science, 2nd Edition. DOING DATA SCIENCE
  12. LEARNING DATA SCIENCE hello world exploring data ethics rigorous conclusions

    looking further visualize import wrangle misrepre- sentaton data privacy algorith- mic bias model infer predict communicate
  13. Ethics exploring data visualize import wrangle ethics misrepre- sentaton data

    privacy algorith- mic bias + responsibility communicate hello world
  14. Rigorous conclusions exploring data visualize import wrangle hello world ethics

    misrepre- sentaton data privacy algorith- mic bias rigorous conclusions model infer predict communicate + complexity +
  15. Looking further exploring data visualize import wrangle hello world ethics

    misrepre- sentaton data privacy algorith- mic bias rigorous conclusions model infer predict looking further 🦪 communicate
  16. Communication communicate exploring data visualize import wrangle hello world ethics

    misrepre- sentaton data privacy algorith- mic bias rigorous conclusions model infer predict looking further
  17. population # A tibble: 217 × 3 country year population

    <chr> <dbl> <dbl> 1 Afghanistan 2022 41129. 2 Albania 2022 2778. 3 Algeria 2022 44903. 4 American Samoa 2022 44.3 5 Andorra 2022 79.8 6 Angola 2022 35589. 7 Antigua and Barbuda 2022 93.8 8 Argentina 2022 46235. 9 Armenia 2022 2780. 10 Aruba 2022 106. # ℹ 207 more rows continents # A tibble: 285 × 4 entity code year continent <chr> <chr> <dbl> <chr> 1 Abkhazia OWID_ABK 2015 Asia 2 Afghanistan AFG 2015 Asia 3 Akrotiri and Dhekelia OWID_AKD 2015 Asia 4 Aland Islands ALA 2015 Europe 5 Albania ALB 2015 Europe 6 Algeria DZA 2015 Africa 7 American Samoa ASM 2015 Oceania 8 Andorra AND 2015 Europe 9 Angola AGO 2015 Africa 10 Anguilla AIA 2015 North America # ℹ 275 more rows population_continents < - left_join(population, continents, join_by(country == entity)) ✓ data joins
  18. population_continents | > f i lter(is.na(continent)) # A tibble: 6

    × 6 country year.x population code year.y continent <chr> <dbl> <dbl> <chr> <dbl> <chr> 1 Congo, Dem. Rep. 2022 99010. NA NA NA 2 Congo, Rep. 2022 5970. NA NA NA 3 Hong Kong SAR, China 2022 7346. NA NA NA 4 Korea, Dem. People's Rep. 2022 26069. NA NA NA 5 Korea, Rep. 2022 51628. NA NA NA 6 Kyrgyz Republic 2022 6975. NA NA NA ✓ data joins ✓ data wrangling
  19. population_continent < - population | > mutate( country = case_when(

    country = = "Congo, Dem. Rep." ~ "Democratic Republic of Congo", country = = "Congo, Rep." ~ "Congo", country = = "Hong Kong SAR, China" ~ "Hong Kong", country = = "Korea, Dem. People's Rep." ~ "North Korea", country = = "Korea, Rep." ~ "South Korea", country = = "Kyrgyz Republic" ~ "Kyrgyzstan", .default = country ) ) | > left_join(continents, by = join_by(country = = entity)) ✓ data joins ✓ data wrangling ✓ data cleaning ✓ ethics
  20. ✓ data joins ✓ data wrangling ✓ data cleaning ✓

    ethics ✓ critique ✓ improving visualizations
  21. ✓ data joins ✓ data wrangling ✓ data cleaning ✓

    ethics ✓ critique ✓ improving visualizations ✓ mapping ✓ iteration
  22. # A tibble: 500 × 6 title author date abstract

    column url <chr> <chr> <date> <chr> <chr> <chr> 1 Community members share remembrances for Ian Hyun Kim Remem… 2025-05-06 "We wel… Campu… http… 2 The Chronicle is accepting remembrances for Ian Hyun Kim Remem… 2025-05-03 "If you… Campu… http… 3 The end Audre… 2025-05-01 "I wish… Opini… http… 4 Stop banning reporters from covering campus protests Robin… 2025-04-26 "Duke s… Opini… http… 5 Your voice is a currency — so use it thoughtfully Alice… 2025-04-23 "The tr… Opini… http… 6 A fortune cookie come true Abby … 2025-04-23 "With m… Opini… http… 7 Journalism is in crisis. We should look to student newspapers for answer… Zoe K… 2025-04-23 "Journa… Opini… http… 8 You can just do things Jules… 2025-04-23 "As I’m… Opini… http… 9 Oh, the places you’ll go Karen… 2025-04-23 "This j… Opini… http… 10 For the love of the game Ranja… 2025-04-23 "What I… Opini… http… # ℹ 490 more rows # ℹ Use `print(n = . . . )` to see more rows ✓ web scraping
  23. bow("https: / / w w w .dukechronicle.com") <polite session> https:

    / / w w w .dukechronicle.com User - agent: polite R package robots.txt: 4 rules are def i ned for 4 bots Crawl delay: 10 sec The path is scrapable for this user - agent ✓ web scraping ✓ terms of use ✓ ethics
  24. ✓ web scraping ✓ terms of use ✓ ethics ✓

    text analysis ✓ data wrangling ✓ data visualization
  25. ✓ web scraping ✓ terms of use ✓ ethics ✓

    text analysis ✓ data wrangling ✓ data visualization ✓ sentiment analysis
  26. and we could keep going on with examples… but let’s

    talk pedagogy, assessment, and challenges (in light of to AI)
  27. AI policy (that was all too optimistic) ✅ AI tools

    for code: You may use the technology for coding examples on assignments; if you do so, you must explicitly cite where you obtained the code. Any recycled code that is discovered and is not explicitly cited will be treated as plagiarism. The bare minimum citation must include the AI tool you’re using (e.g., ChatGPT) and your prompt. The prompt you use cannot be copied and pasted directly from the assignment; you must create a prompt yourself. ❌ AI tools for narrative: Unless instructed otherwise, you may not use generative AI to generate a narrative that you then copy-paste verbatim into an assignment or edit and then insert into your assignment. ✅ AI tools for learning: You’re welcomed to ask AI tools questions that might help your learning and understanding in this course.
  28. 1. Leveling the playing field with explicit “how best to

    ai” instruction 2. Providing targeted resources for relevant and unlimited answers 3. Shifting ai use to support learning from taking shortcuts. Maybe.
  29. Component Assessment Weight Twice weekly lectures Application exercises graded for

    engagement 5% Once weekly labs Lab assignments graded for accuracy 35% Midterm In-class conceptual exam followed by 2-day computational take home 20% Final In-class conceptual exam 20% Project Team-based, open-ended, culminating in presentation + report 20% Components + Assessment
  30. AI opportunity (that is soon to be tested) ❓ How

    can we motivate students to use AI tools to help their learning, instead of help them take shortcuts? A feedback-bot that (hopefully) generates good, helpful, and correct feedback based on an instructor designed rubric and suggests terminology, syntax, methodology, and workflows taught in the course.
  31. For this question you will work with inflation data from

    various countries in the world over the last 30 years. The dataset is called country - inflation.csv and it's in your data folder. Reshape (pivot) country_inflation such that each row represents a country/year combination, with columns country, year, and annual_inflation. Then, display the resulting data frame and state how many rows and columns it has. country_inflation < - country_inflation | > pivot_longer( cols = - country, names_to = "year", values_to = "inflationrate" ) print(country_inflation) Question Answer
  32. Mechanism Question bank: Questions + suggested solutions + detailed rubric

    items + + MODEL: LLM + fine tuning with R4DS, IMS, and course materials
  33. Code uses pivot_longer(): Met - the code correctly uses the

    pivot_longer() function. Code names the data frame something short and informative: Not met - the code overwrites the original country_inflation data frame instead of creating a new one. Code names the year variable year and the inflation variable annual_inflation: Partially met - while year is correctly named, the inflation variable is named inflationrate instead of annual_inflation. Code transforms the year variable to numeric inside pivot_longer(): Not met - the code does not include the required names_transform = as.numeric argument. Output displays country_inflation_longer: Not met - the output shows a data frame named country_inflation. Output has 3 columns: country, year, and annual_inflation: Partially met - while there are 3 columns, the inflation column has a different name than specified. Narrative states the correct numbers of rows and columns, 1,178 rows and 3: Met - the narrative correctly states there are 3 columns and 1,178 rows. Code style and readability: Partially met - while the code has proper line breaks and indentation, there are inconsistent spaces around commas. Feedback by ai