Upgrade to Pro
— share decks privately, control downloads, hide ads and more …
Speaker Deck
Features
Speaker Deck
PRO
Sign in
Sign up for free
Search
Search
SVG + D3.JS Course Slide
Search
tkirby
May 28, 2015
Education
290
0
Share
Embed
Copy iframe code
Copy JS code
Copy link
Start on current slide
SVG + D3.JS Course Slide
tkirby
May 28, 2015
More Decks by tkirby
See All by tkirby
前端網頁資料視覺化設計
tkirby
1
630
Theory of Graphical Perception
tkirby
0
670
Open Refine Course
tkirby
0
280
Language Reference
tkirby
0
140
新聞記者的程式設計第一課
tkirby
0
610
Visualization over Web
tkirby
0
170
迎戰壞資料 @ dbootcamp Taipei
tkirby
0
840
Rasterize D3.js
tkirby
7
1.8k
資料新聞學手冊導讀
tkirby
0
330
Other Decks in Education
See All in Education
AI-Based Speaking Assessment of a Short-Term Study Abroad Program
uranoken
0
370
生成AI時代のエンジニア育成について考えてみた
akasan
0
180
Implicit and Cross-Device Interaction - Lecture 10 - Next Generation User Interfaces (4018166FNR)
signer
PRO
2
2.3k
Examen de Selectividad. Geografía julio 2026 (Convocatoria Extraordinaria). UCLM
juanmartin2026
1
9.5k
[2026前期火5] 論理学(京都大学文学部 前期 第8回)「正規化定理の証明」
yatabe
0
240
【デザイナー就活講座】 デザイナー就活市場・企業探し・ポートフォリオのポイント
koheihasebe
0
290
2026年度春学期 統計学 第13回 不確かな測定の不確かさを測る ― 不偏分散とt分布 (2026. 6. 25)
akiraasano
PRO
1
130
輻射安全管理系統2.0暨輻防e++學園平台說明會
aecrp
0
1.8k
「答えを出す」より「わかる」をつくる
kzkmaeda
1
230
教育現場から見た Ruby on Rails
yasslab
PRO
0
210
コミュニティを通じた_キャリア設計のススメ_20260424.pdf
masakiokuda
0
360
「機械学習と因果推論」入門 ③ 漸近効率な推定量と二重機械学習
masakat0
0
770
Featured
See All Featured
Primal Persuasion: How to Engage the Brain for Learning That Lasts
tmiket
0
390
Avoiding the “Bad Training, Faster” Trap in the Age of AI
tmiket
0
190
Faster Mobile Websites
deanohume
310
32k
ラッコキーワード サービス紹介資料
rakko
1
4M
Between Models and Reality
mayunak
4
380
How to Create Impact in a Changing Tech Landscape [PerfNow 2023]
tammyeverts
55
3.4k
Measuring & Analyzing Core Web Vitals
bluesmoon
9
890
Become a Pro
speakerdeck
PRO
31
6k
HTML-Aware ERB: The Path to Reactive Rendering @ RubyCon 2026, Rimini, Italy
marcoroth
2
350
Agile that works and the tools we love
rasmusluckow
331
22k
Efficient Content Optimization with Google Search Console & Apps Script
katarinadahlin
PRO
1
730
Docker and Python
trallard
47
4k
Transcript
Visualization over Web
HTML <a href=“link”>content</a> <img src=“blah.png”> <br> <a href=“link”> this link
</a> links to a page <br> <p><a href=“link”> this link </a> links to a page </p>
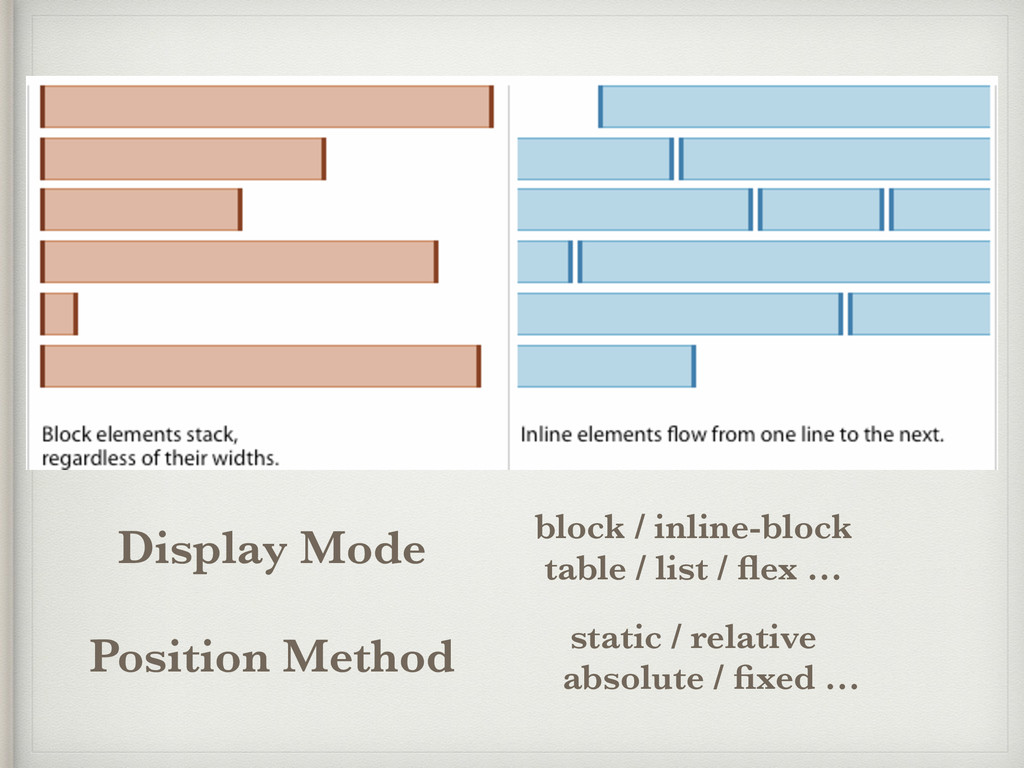
block / inline-block table / list / flex … static
/ relative absolute / fixed … Display Mode Position Method
None
Scalable Vector Graphics SVG
<p> <svg> … </svg> </p>
<svg> <rect x=“10” y=“10” width=“20” height=“20”> </svg>
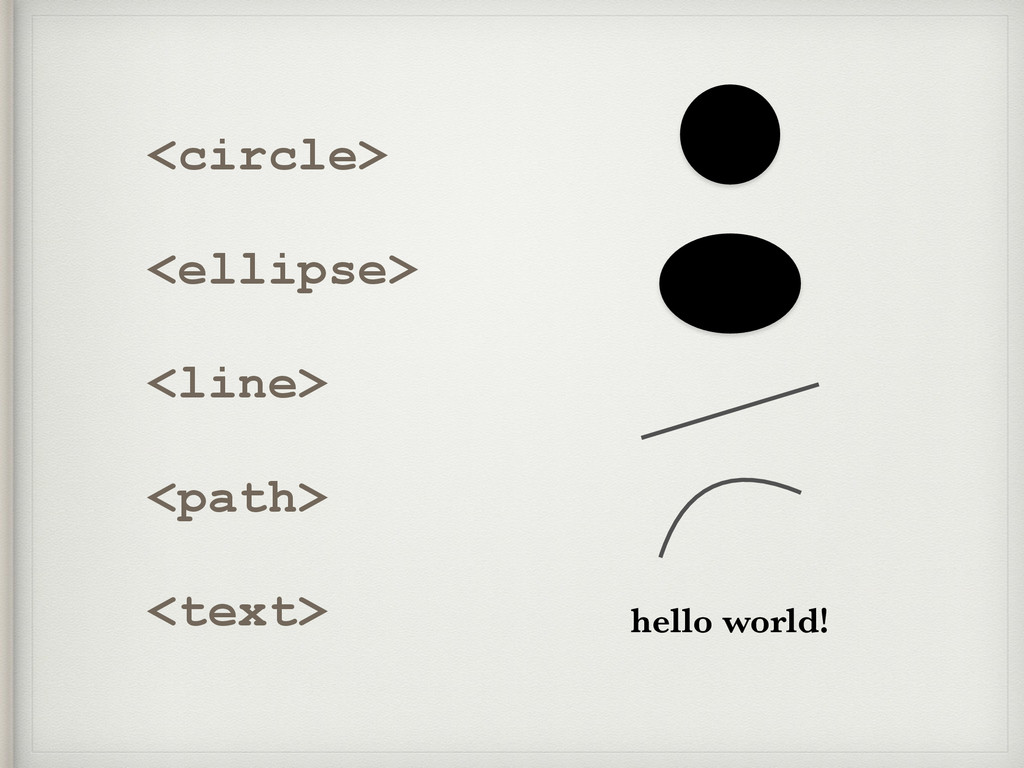
<circle> <ellipse> <line> <path> <text> hello world!
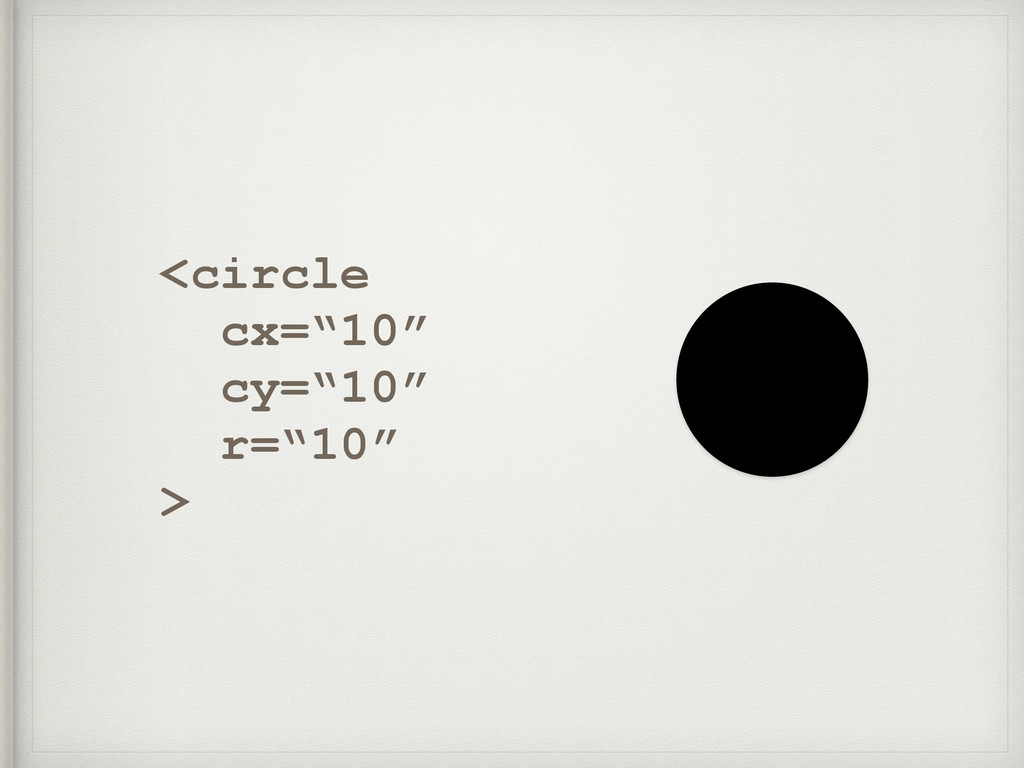
<circle cx=“10” cy=“10” r=“10” >
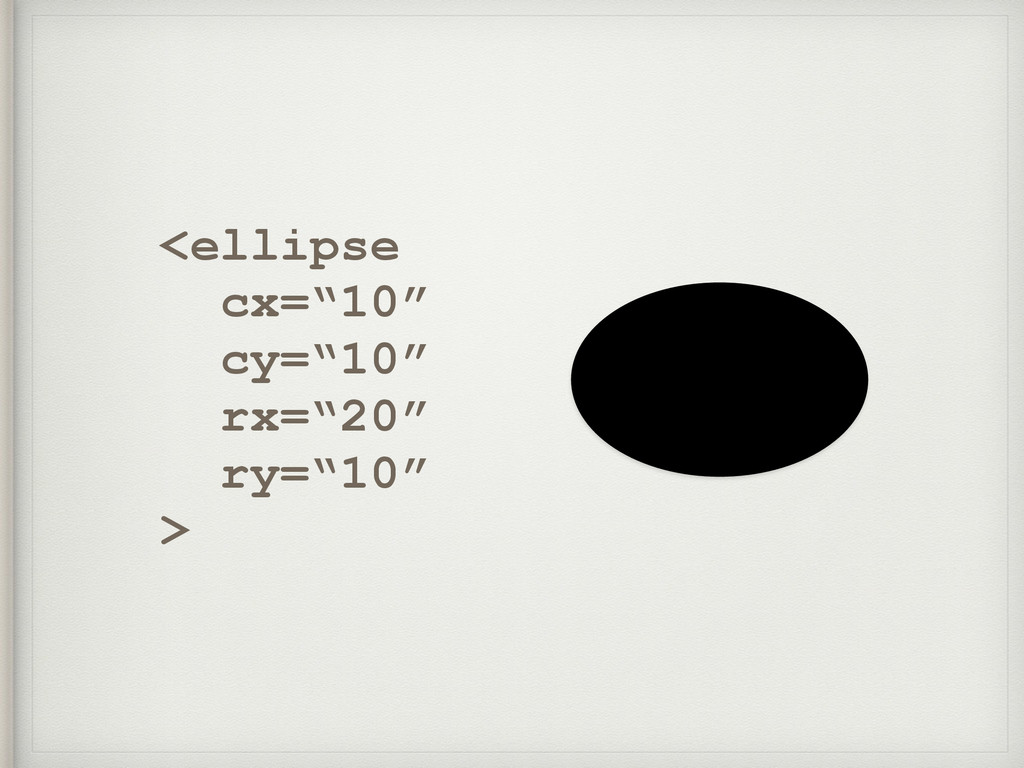
<ellipse cx=“10” cy=“10” rx=“20” ry=“10” >
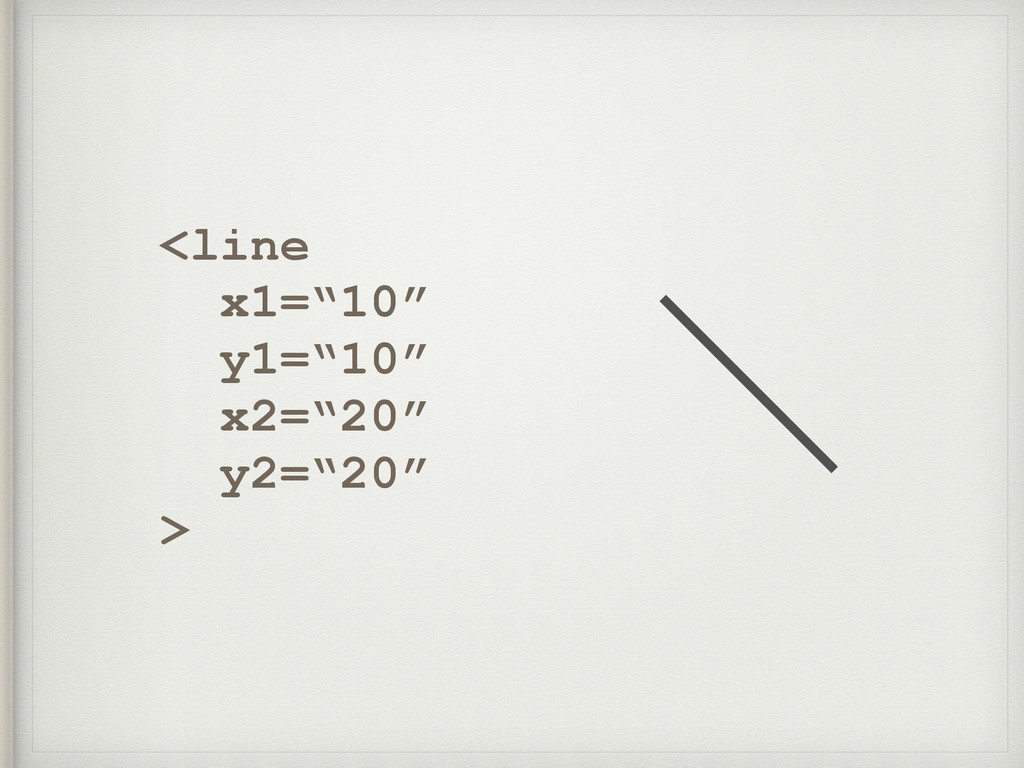
<line x1=“10” y1=“10” x2=“20” y2=“20” >
<circle cx=“10” cy=“10” r=“10” stroke=“color” fill=“color” stroke-width=“size” >
None
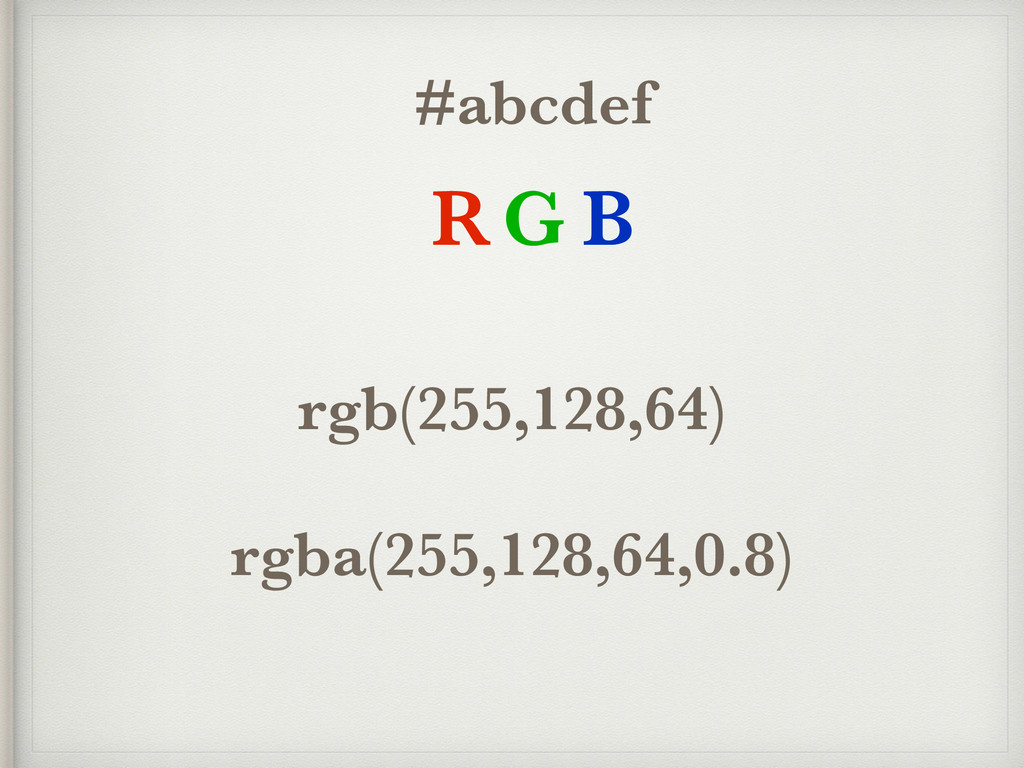
#abcdef RG B 0 ~ 255 = 0 ~ ff
#adf = #aaddff
#abcdef RG B rgb(255,128,64) rgba(255,128,64,0.8)
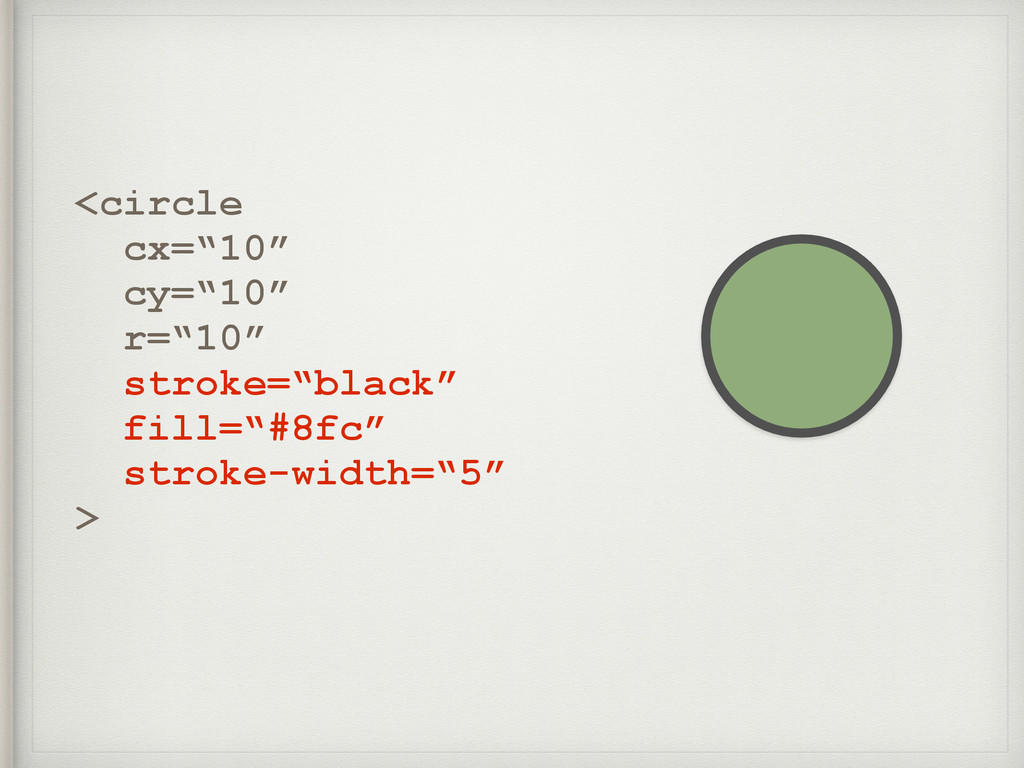
<circle cx=“10” cy=“10” r=“10” stroke=“black” fill=“#8fc” stroke-width=“5” >
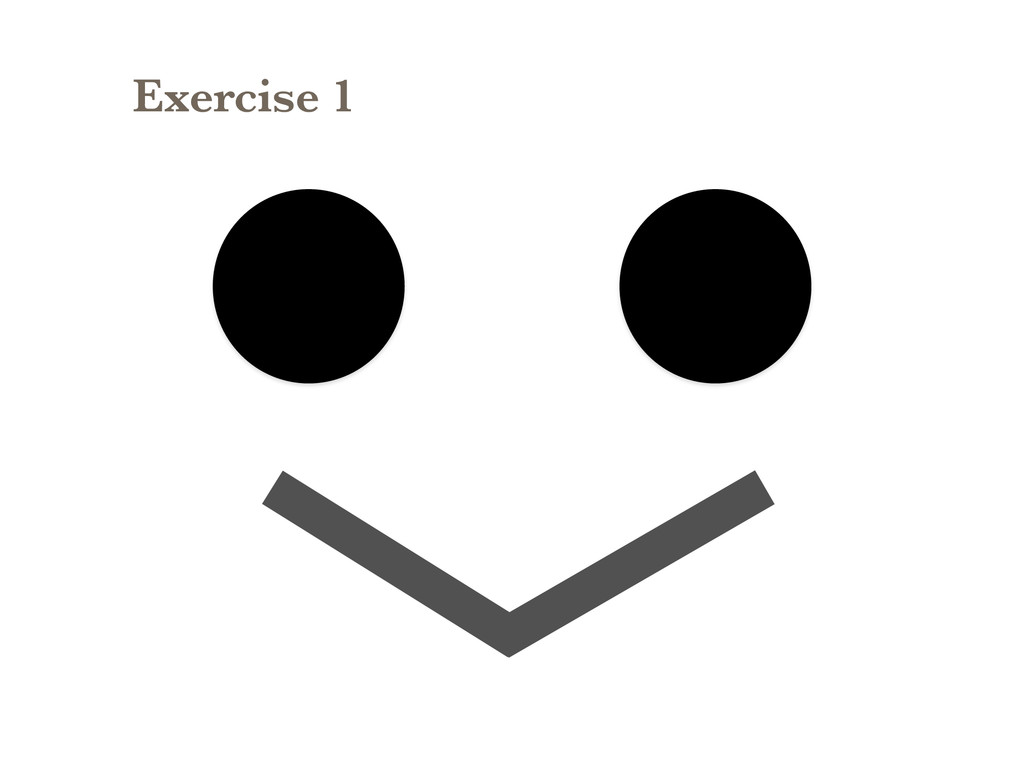
Exercise 1
?
None
None
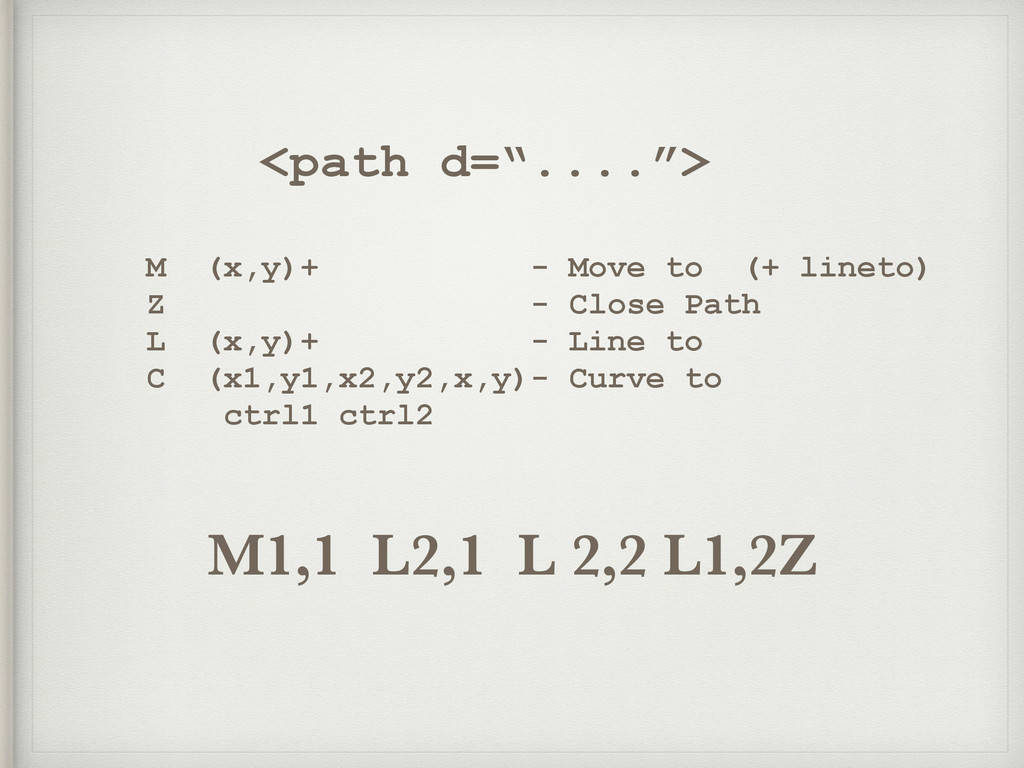
<path d=“....”> M (x,y)+ - Move to (+ lineto) Z
- Close Path L (x,y)+ - Line to C (x1,y1,x2,y2,x,y)- Curve to ctrl1 ctrl2 M1,1 L2,1 L 2,2 L1,2Z
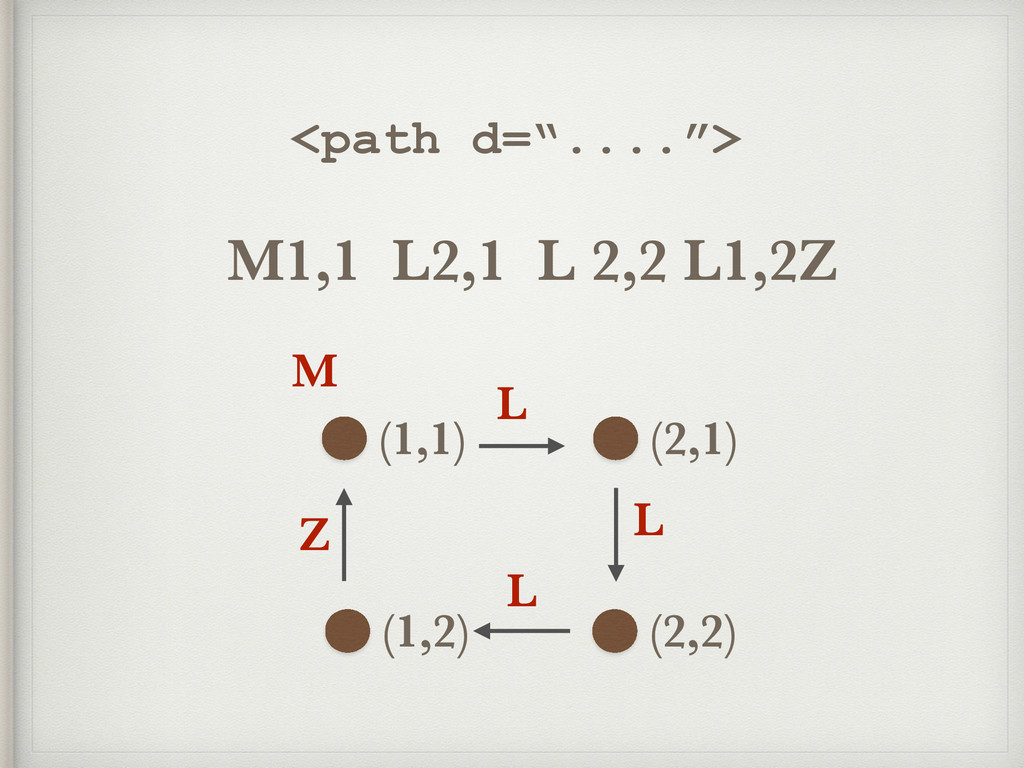
<path d=“....”> M1,1 L2,1 L 2,2 L1,2Z (1,1) (2,1) (2,2)
(1,2) M L L L Z
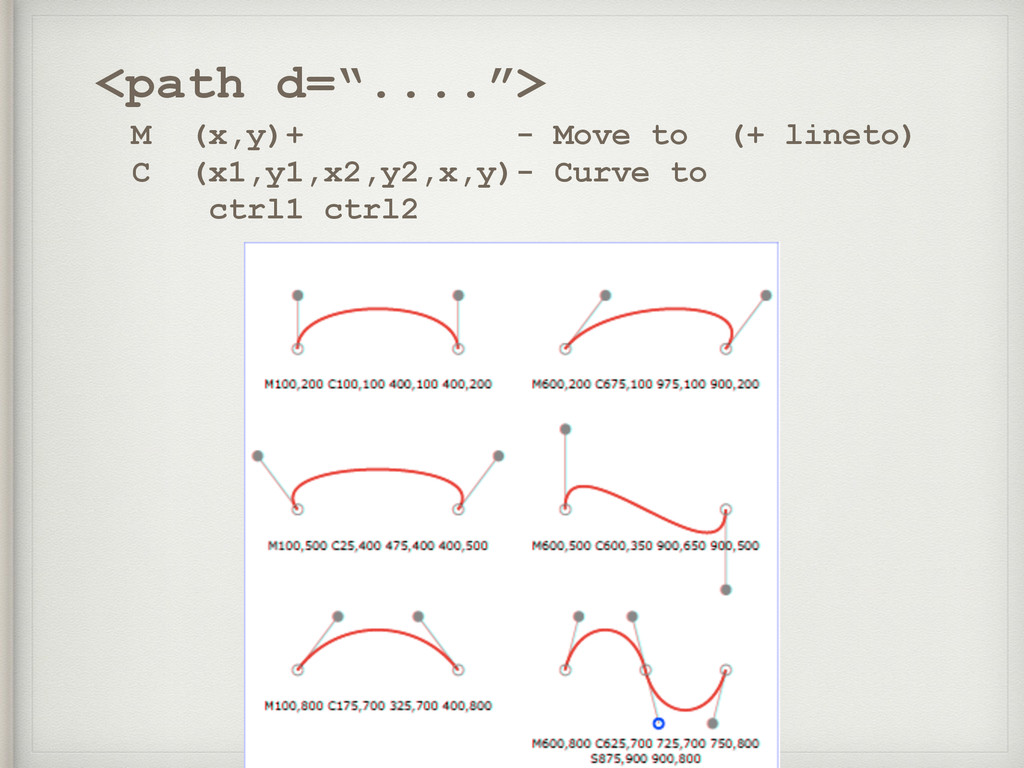
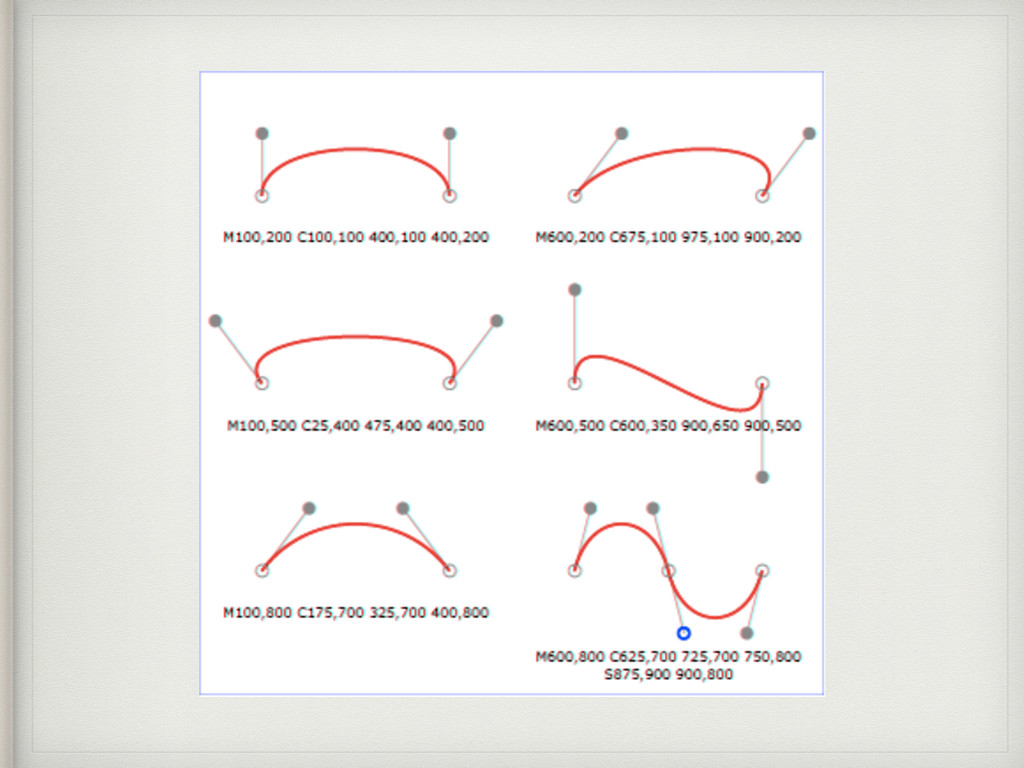
<path d=“....”> M (x,y)+ - Move to (+ lineto) C
(x1,y1,x2,y2,x,y)- Curve to ctrl1 ctrl2
None
<path d=“....”> Q (x1,y1,x,y)+ - Quadratic Bezier T (x,y)+ -
Quadratic Bezier
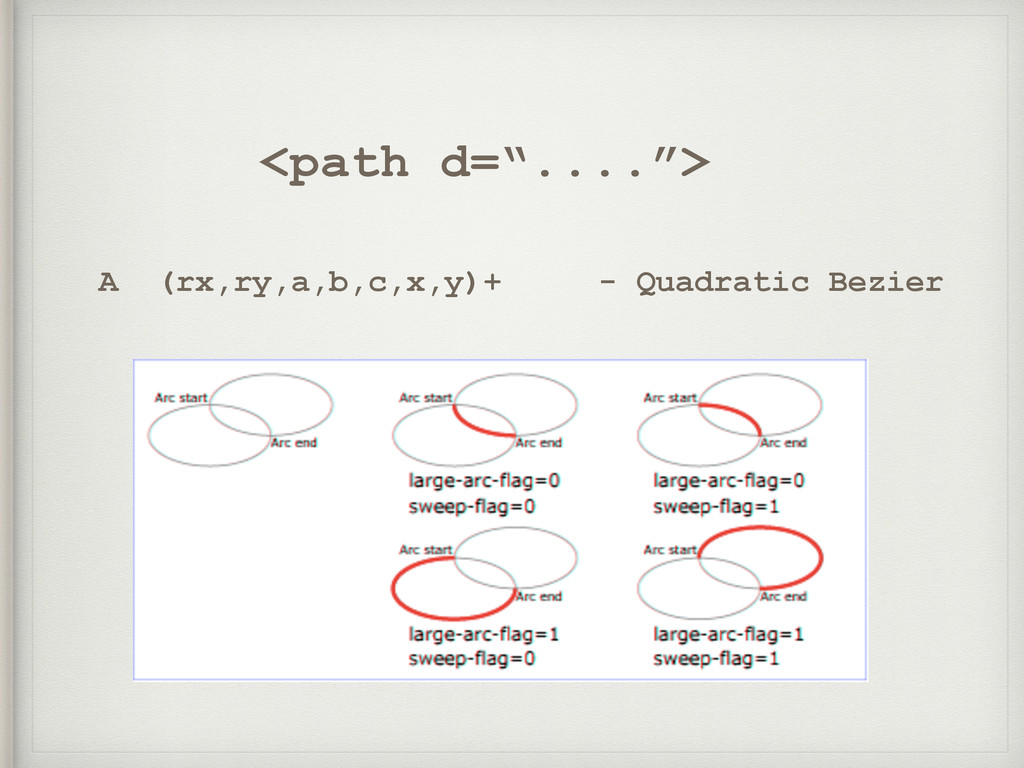
<path d=“....”> A (rx,ry,a,b,c,x,y)+ - Quadratic Bezier
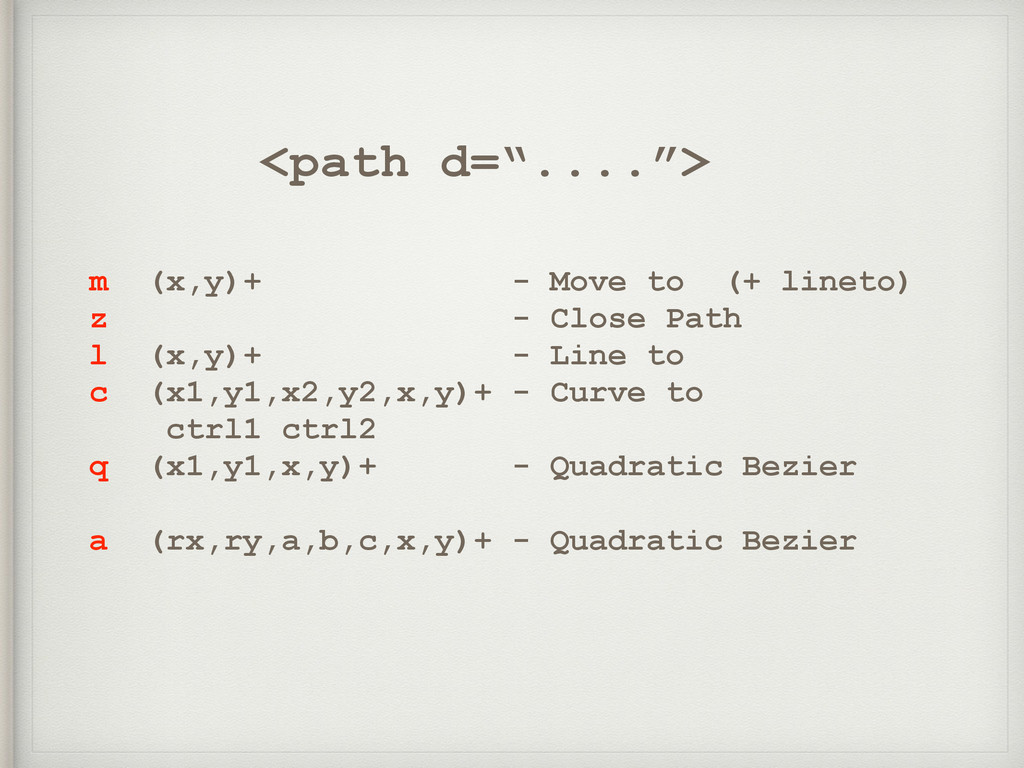
<path d=“....”> m (x,y)+ - Move to (+ lineto) z
- Close Path l (x,y)+ - Line to c (x1,y1,x2,y2,x,y)+ - Curve to ctrl1 ctrl2 q (x1,y1,x,y)+ - Quadratic Bezier a (rx,ry,a,b,c,x,y)+ - Quadratic Bezier
M75,50.5l5-1.5c-0.1-2.2-0.4-4.3-0.9-6.3l-5.2-0.1c-0.2-0.6-0.4-1.1-0. 6-1.7l4-3.3c-0.9-1.9-2-3.8-3.2-5.5L69.2,34c-0.4-0.5-0.8-0.9-1.2-1.3l 2.4-4.6c-1.6-1.4-3.3-2.7-5.1-3.8l-3.7,3.6c-0.5-0.3-1.1-0.5-1.6-0.8l0.5 -5.2c-2-0.7-4-1.3-6.2-1.6l-2.1,4.8c-0.6-0.1-1.2-0.1-1.8-0.1l-1.5-5c-2. 2,0.1-4.3,0.4-6.3,0.9l-0.1,5.2c-0.6,0.2-1.1,0.4-1.7,0.6l-3.3-4c-1.9,0.9 -3.8,2-5.5,3.2l1.9,4.9c-0.5,0.4-0.9,0.8-1.3,1.2l-4.6-2.4c-1.4,1.6-2.7,3 .3-3.8,5.1l3.6,3.7c-0.3,0.5-0.5,1.1-0.8,1.6l-5.2-0.5c-0.7,2-1.3,4-1.6,6 .2l4.8,2.1c-0.1,0.6-0.1,1.2-0.1,1.8l-5,1.5c0.1,2.2,0.4,4.3,0.9,6.3l5.2, 0.1c0.2,0.6,0.4,1.1,0.6,1.7l-4,3.3c0.9,1.9,2,3.8,3.2,5.5l4.9-1.9c0.4,0. 5,0.8,0.9,1.2,1.3l-2.4,4.6c1.6,1.4,3.3,2.7,5.1,3.8l3.7-3.6c0.5,0.3,1.1,
0.5,1.6,0.8l-0.5,5.2c2,0.7,4,1.3,6.2,1.6l2.1-4.8c0.6,0.1,1.2,0.1,1.8,0. 1l1.5,5c2.2-0.1,4.3-0.4,6.3-0.9l0.1-5.2c0.6-0.2,1.1-0.4,1.7-0.6l3.3,4c 1.9-0.9,3.8-2,5.5-3.2L66,69.2c0.5-0.4,0.9-0.8,1.3-1.2l4.6,2.4c1.4-1.6 ,2.7-3.3,3.8-5.1l-3.6-3.7c0.3-0.5,0.5-1.1,0.8-1.6l5.2,0.5c0.7-2,1.3-4, 1.6-6.2l-4.8-2.1C74.9,51.7,75,51.1,75,50.5zM50,65c-8.3,0-15-6.7-1 5-15c0-8.3,6.7-15,15-15s15,6.7,15,15 C65,58.3,58.3,65,50,65z d=“ ”
http://goo.gl/fPUFgv SVG Editor
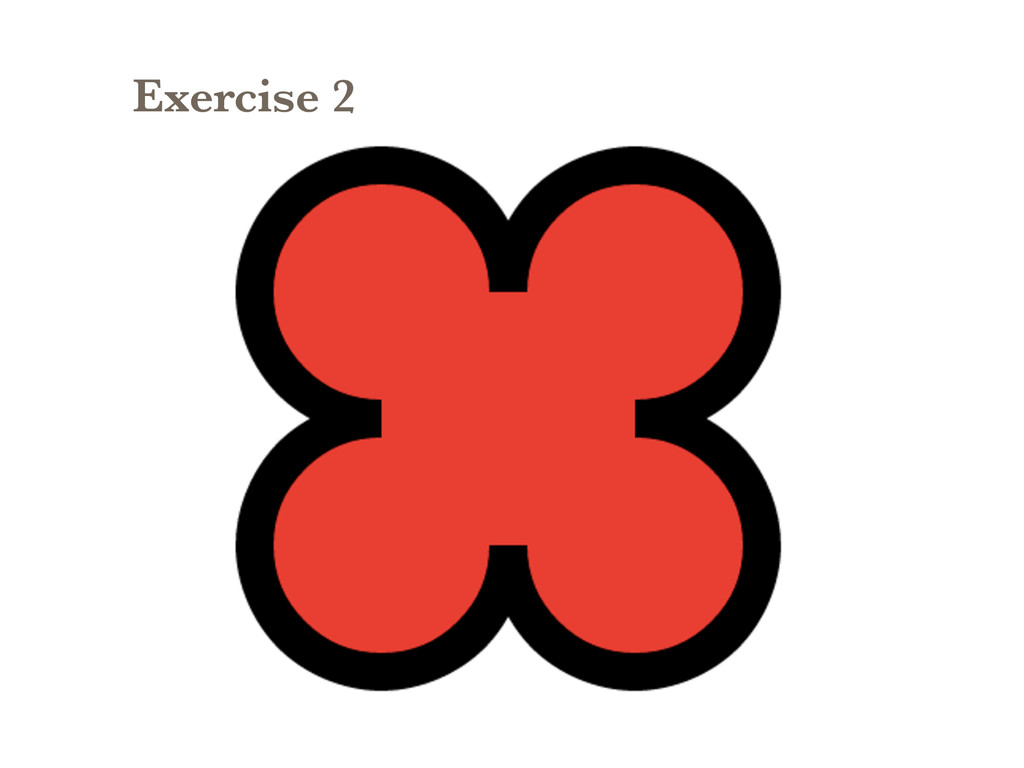
Exercise 2
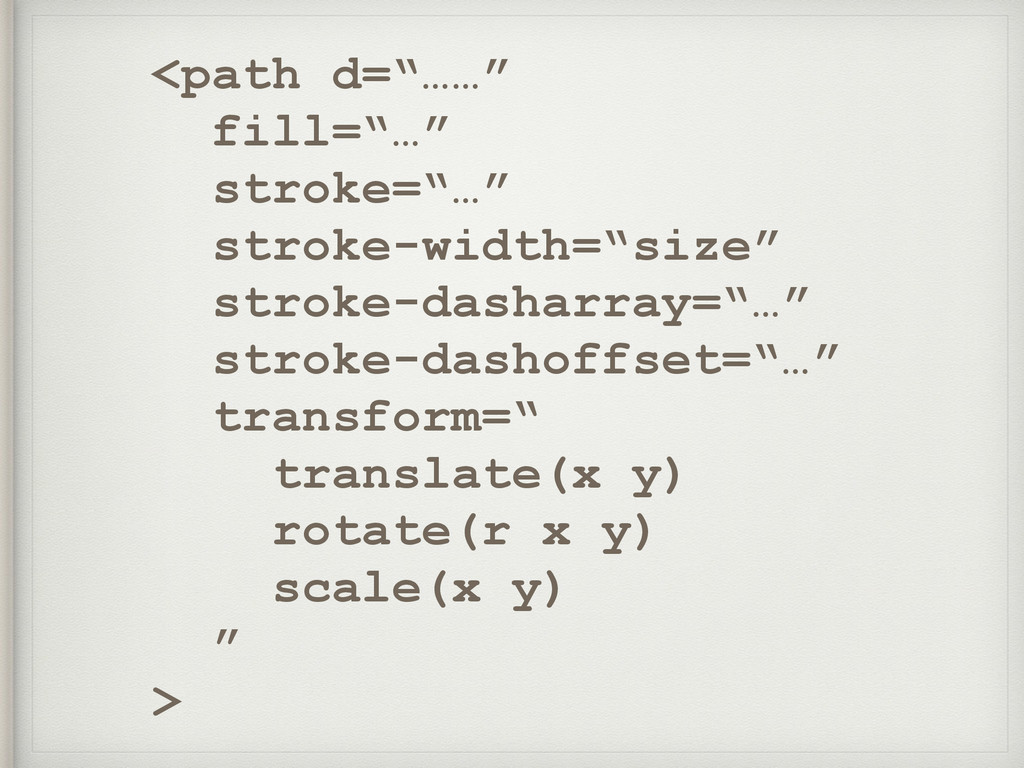
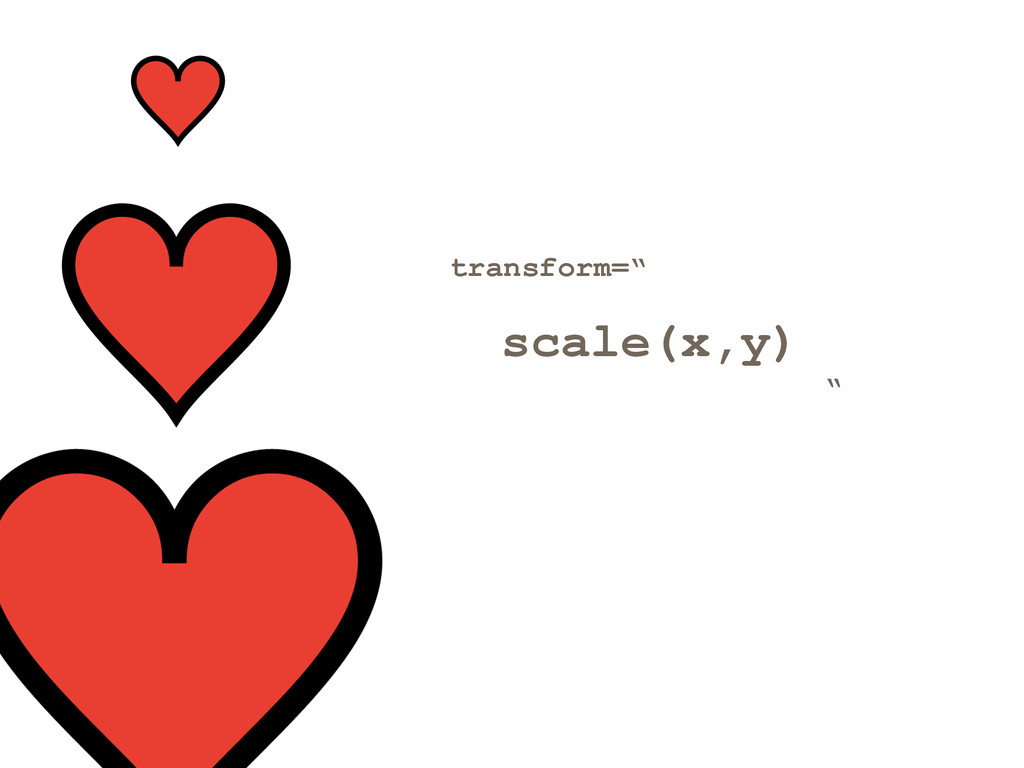
<path d=“……” fill=“…” stroke=“…” stroke-width=“size” stroke-dasharray=“…” stroke-dashoffset=“…” transform=“ translate(x y)
rotate(r x y) scale(x y) ” >
None
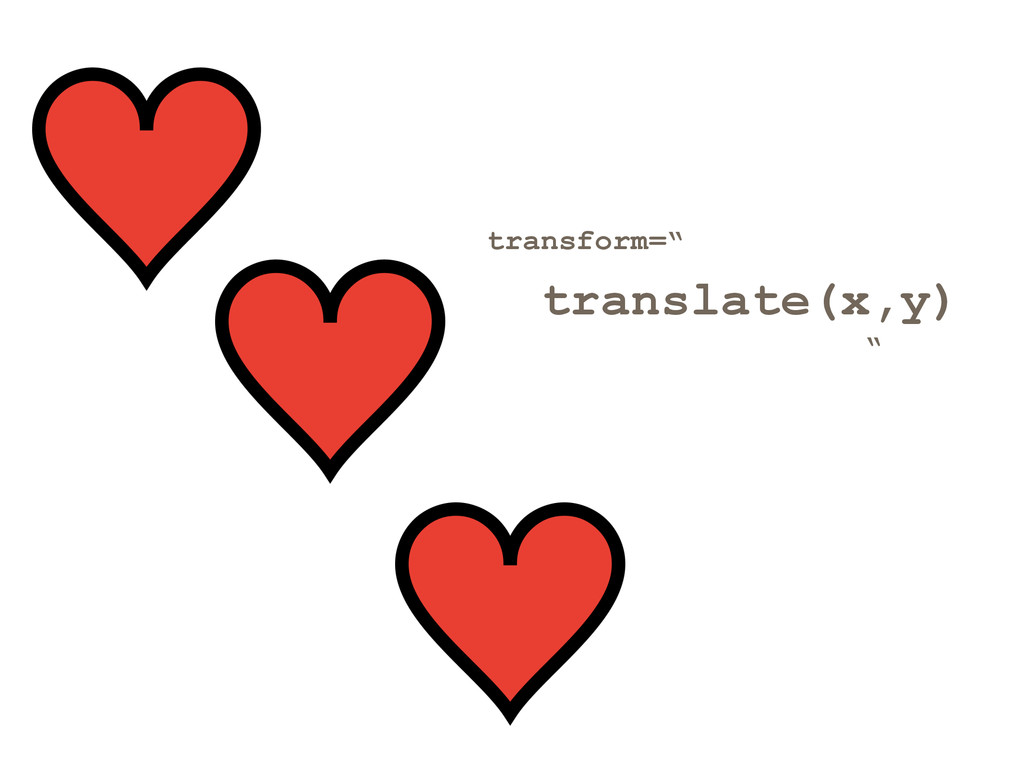
transform=“ translate(x,y) “
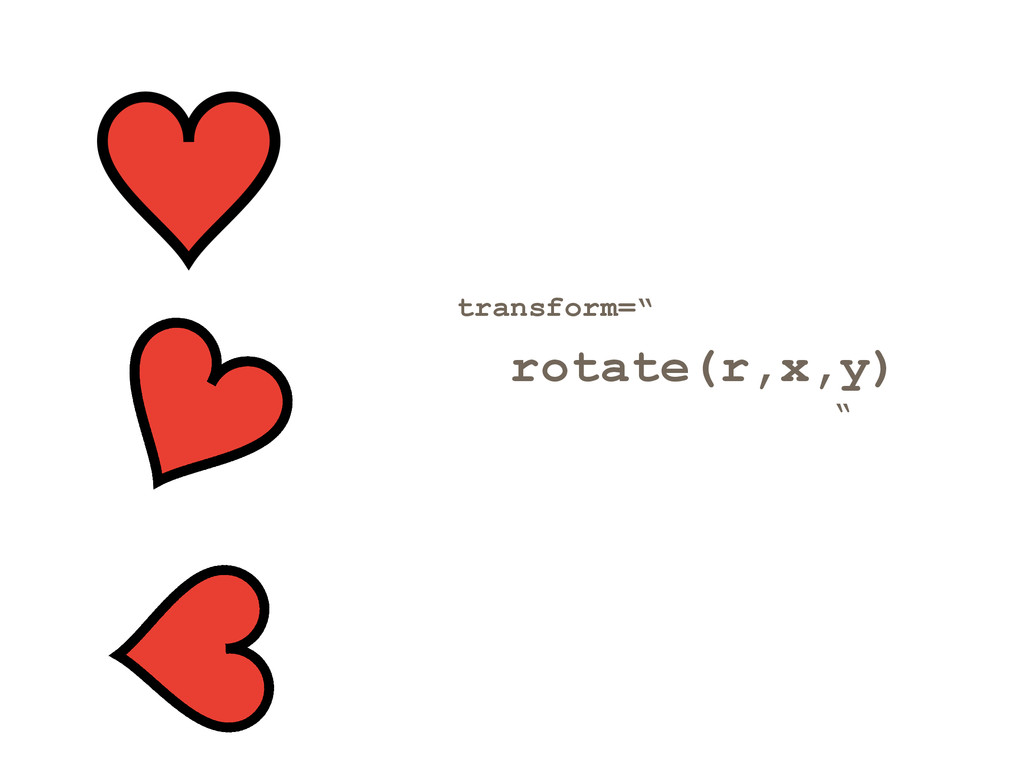
transform=“ rotate(r,x,y) “
transform=“ scale(x,y) “
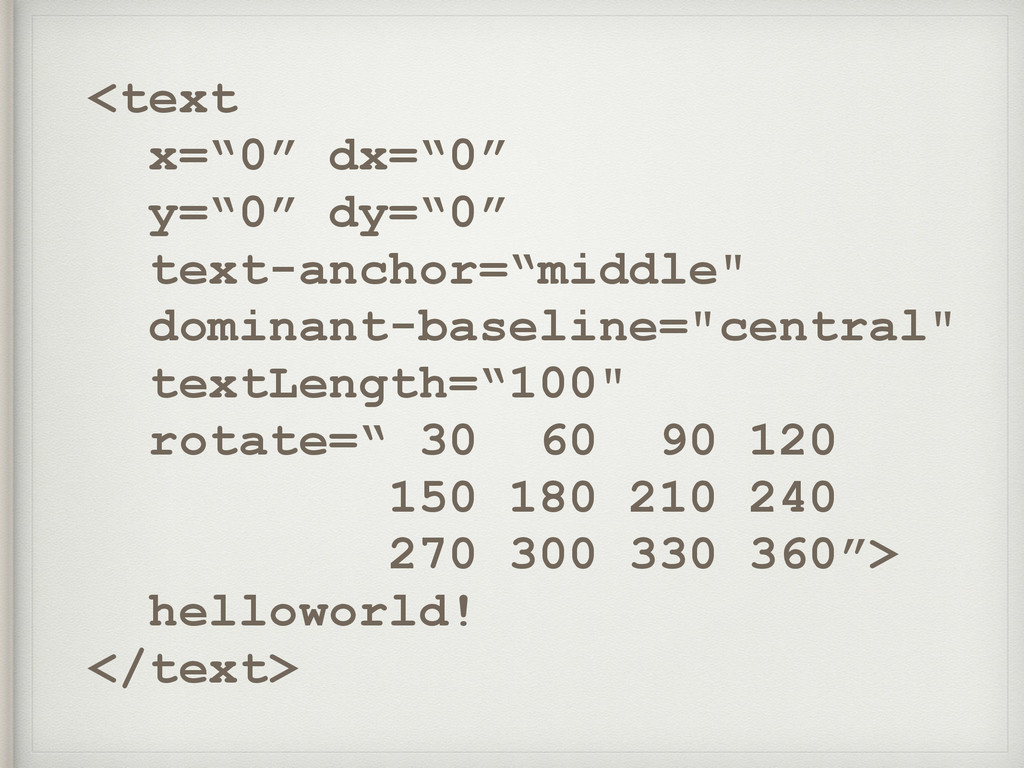
<text x=“0” dx=“0” y=“0” dy=“0” text-anchor=“middle" dominant-baseline="central" textLength=“100" rotate=“ 30
60 90 120 150 180 210 240 270 300 330 360”> helloworld! </text>
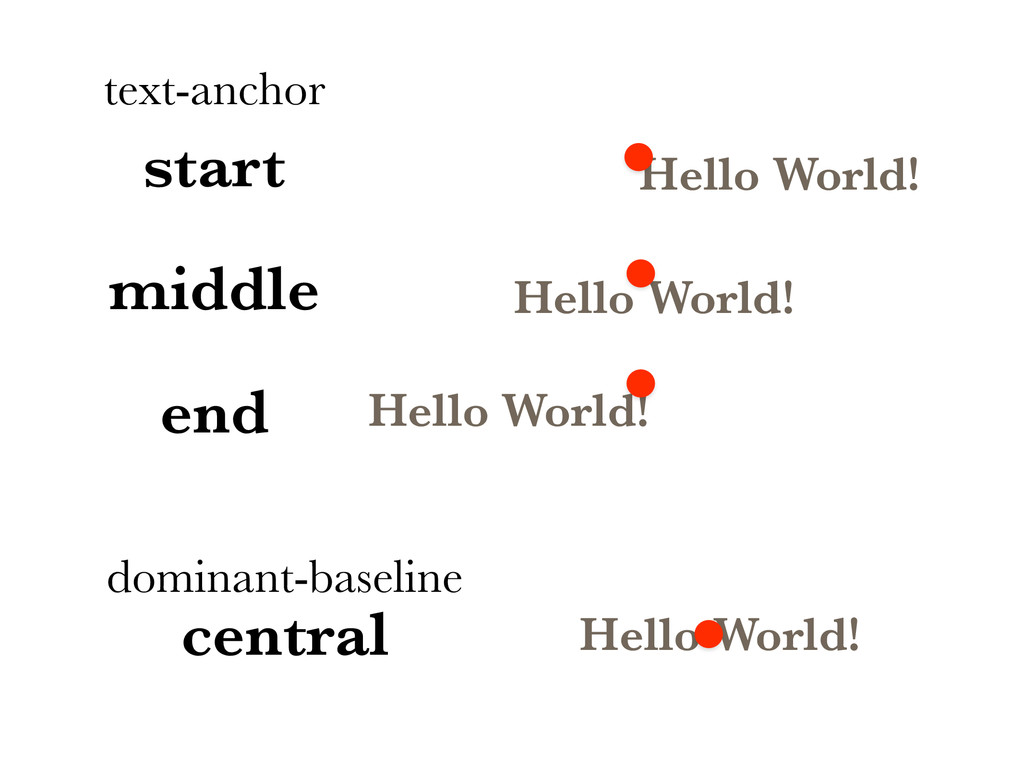
Hello World! Hello World! Hello World! start middle end Hello
World! dominant-baseline text-anchor central
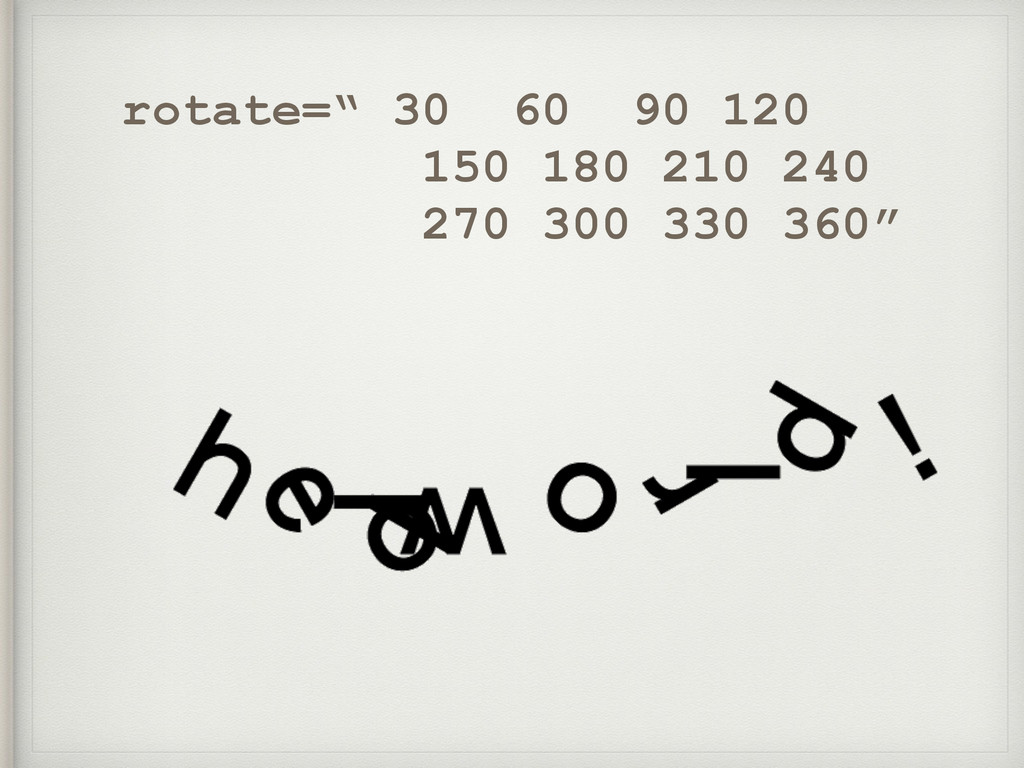
rotate=“ 30 60 90 120 150 180 210 240 270
300 330 360”
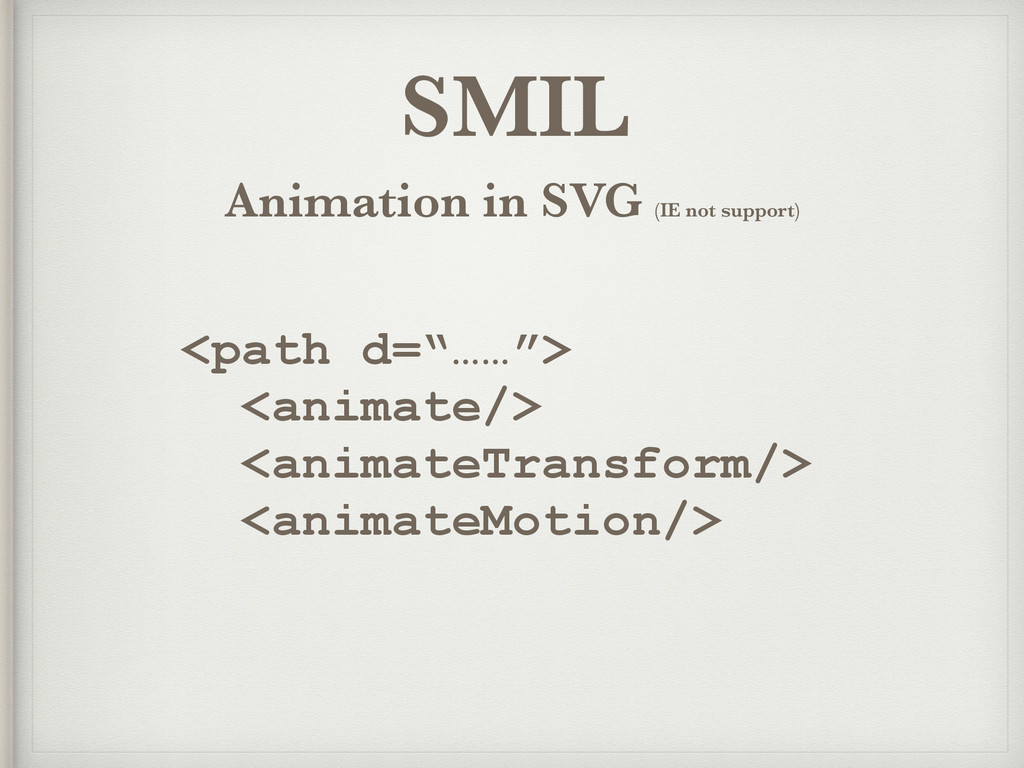
SMIL <path d=“……”> <animate/> <animateTransform/> <animateMotion/> Animation in SVG (IE
not support)
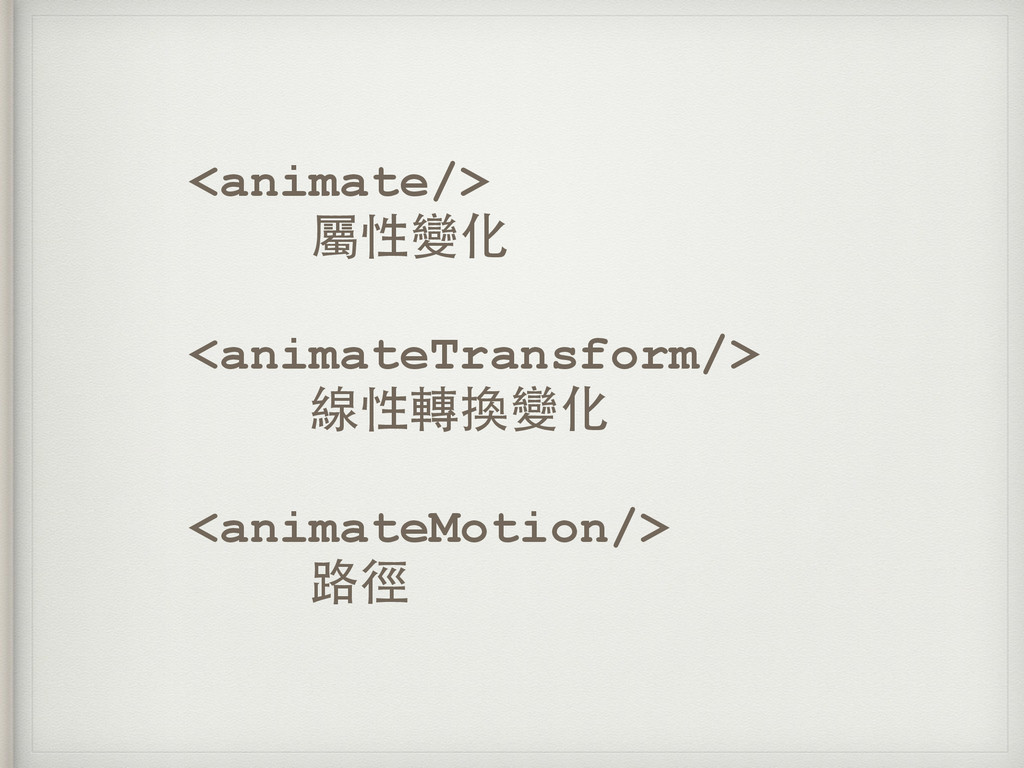
<animate/> 屬性變化 <animateTransform/> 線性轉換變化 <animateMotion/> 路徑
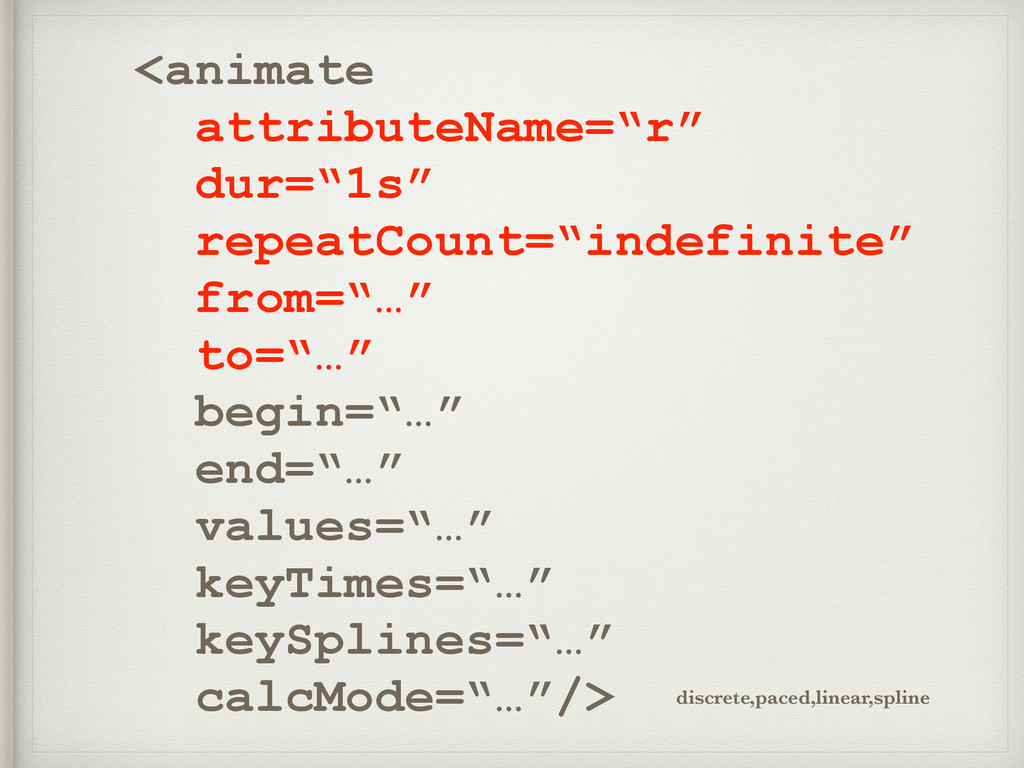
<animate attributeName=“r” dur=“1s” repeatCount=“indefinite” from=“…” to=“…” begin=“…” end=“…” values=“…” keyTimes=“…”
keySplines=“…” calcMode=“…”/> discrete,paced,linear,spline
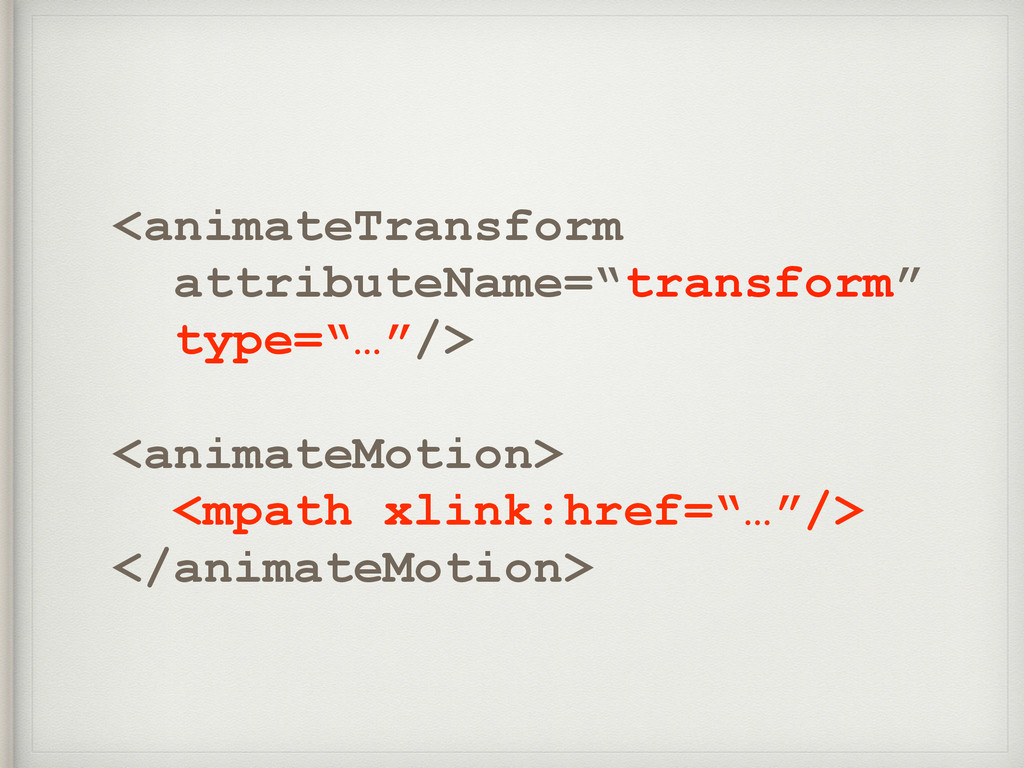
<animateTransform attributeName=“transform” type=“…”/> <animateMotion> <mpath xlink:href=“…”/> </animateMotion>
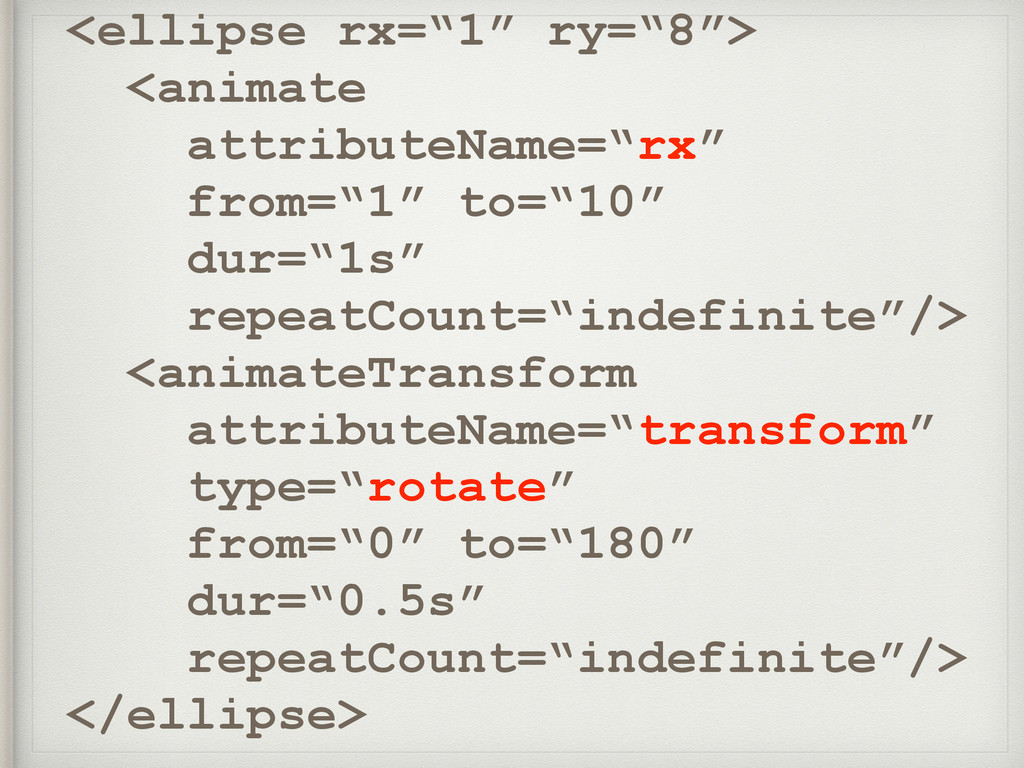
<ellipse rx=“1” ry=“8”> <animate attributeName=“rx” from=“1” to=“10” dur=“1s” repeatCount=“indefinite”/>
<animateTransform attributeName=“transform” type=“rotate” from=“0” to=“180” dur=“0.5s” repeatCount=“indefinite”/> </ellipse>
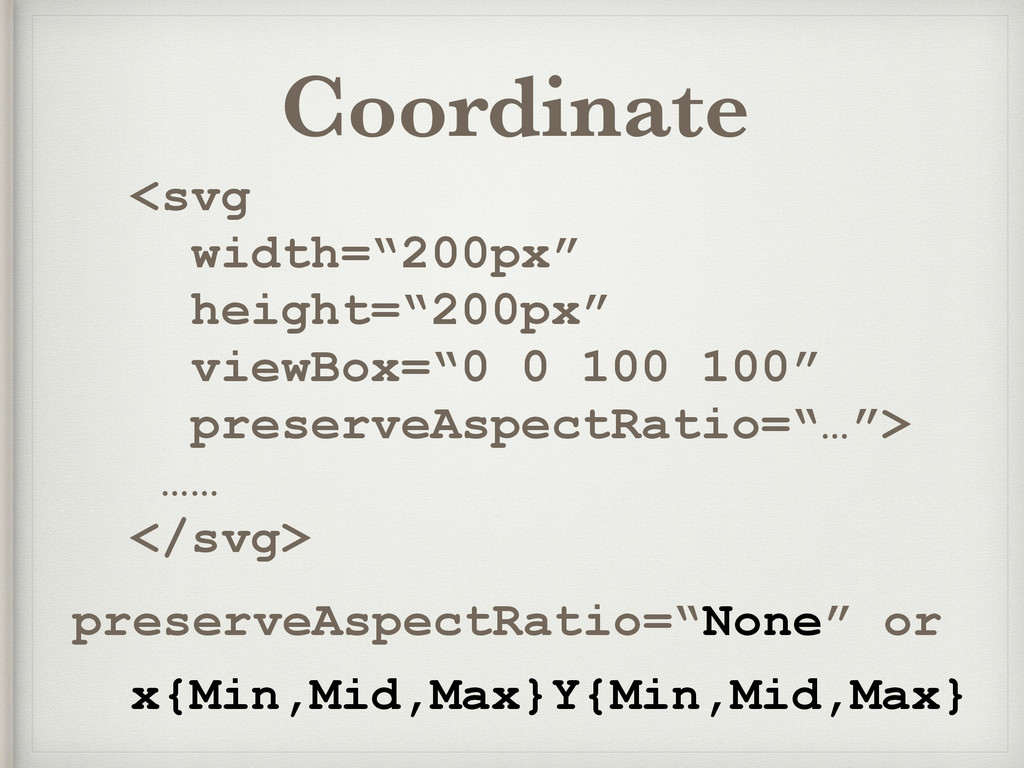
Coordinate <svg width=“200px” height=“200px” viewBox=“0 0 100 100” preserveAspectRatio=“…”> ……
</svg> preserveAspectRatio=“None” or x{Min,Mid,Max}Y{Min,Mid,Max}
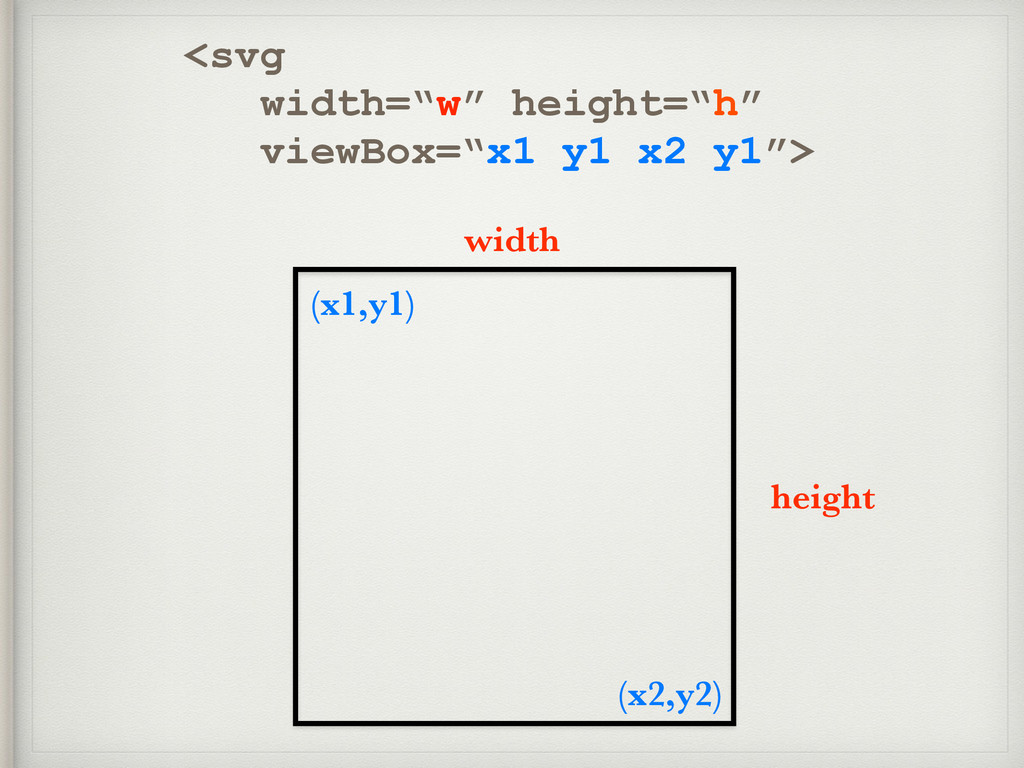
width height (x1,y1) (x2,y2) <svg width=“w” height=“h” viewBox=“x1 y1 x2
y1”>
None
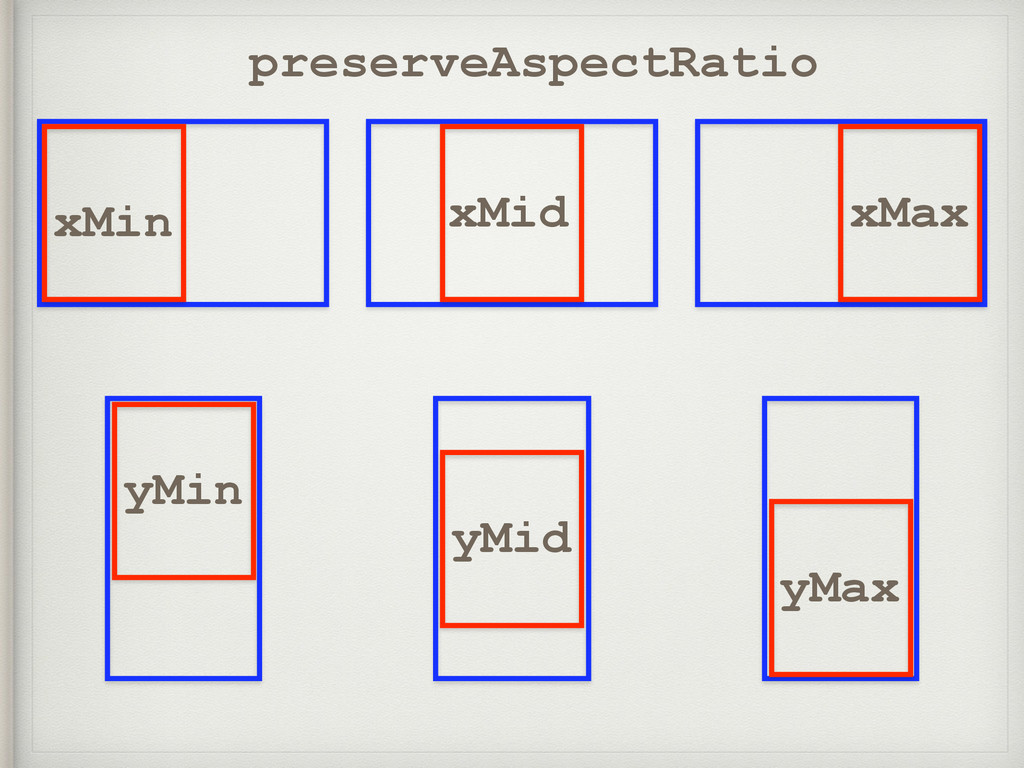
preserveAspectRatio xMin xMid xMax yMin yMid yMax
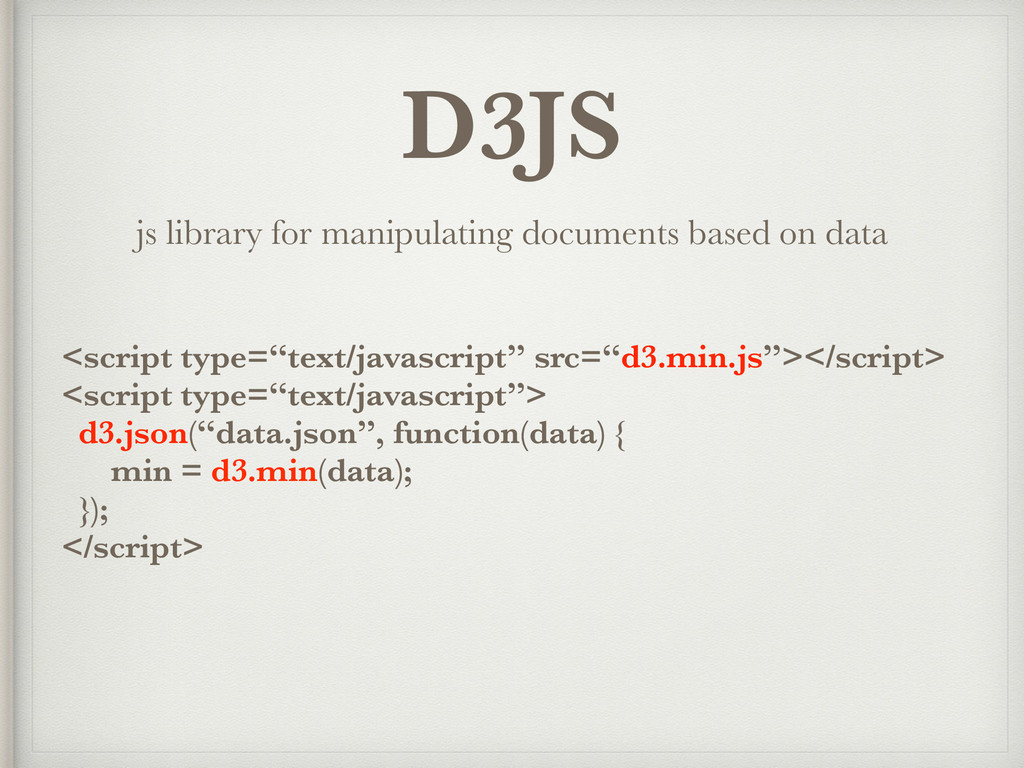
D3JS js library for manipulating documents based on data <script
type=“text/javascript” src=“d3.min.js”></script> <script type=“text/javascript”> d3.json(“data.json”, function(data) { min = d3.min(data); }); </script>
Data Driven Document Model Powerful Visualizing Lib d3js d3js d3js
d3js d3js d3js d3js d3js d3js d3js
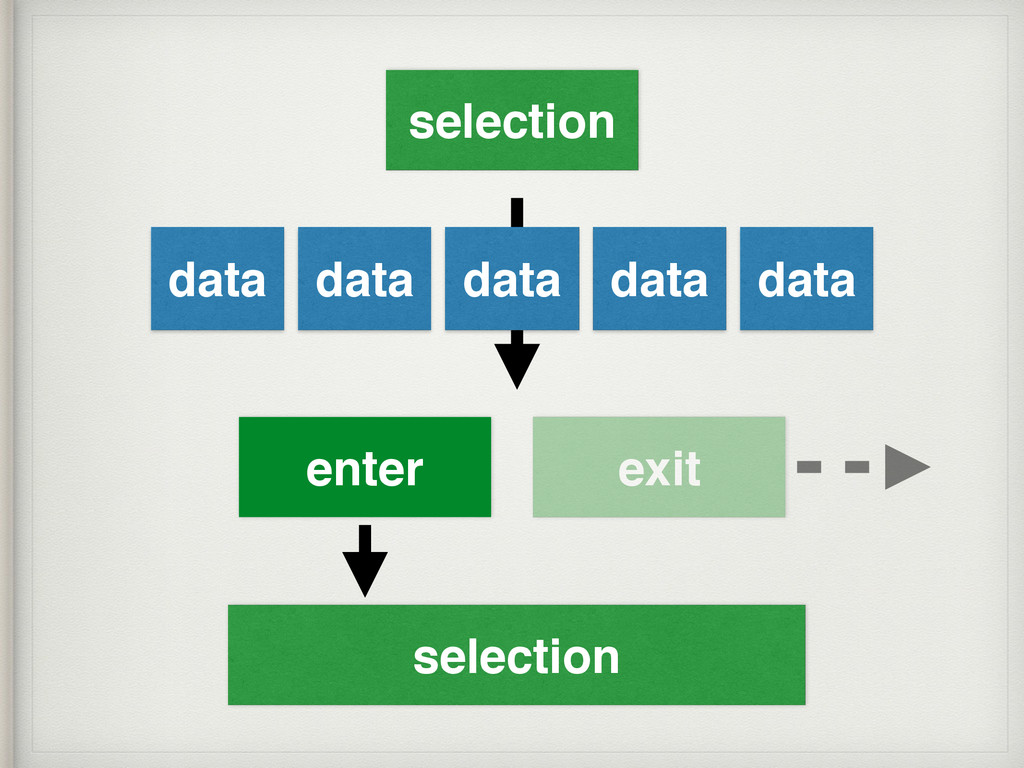
data data data data data selection enter exit selection
data data data data selection enter exit selection d3.selectAll(“div”) .data(data)
.enter().append(“div”) .exit().remove() d3.selectAll(“div”)
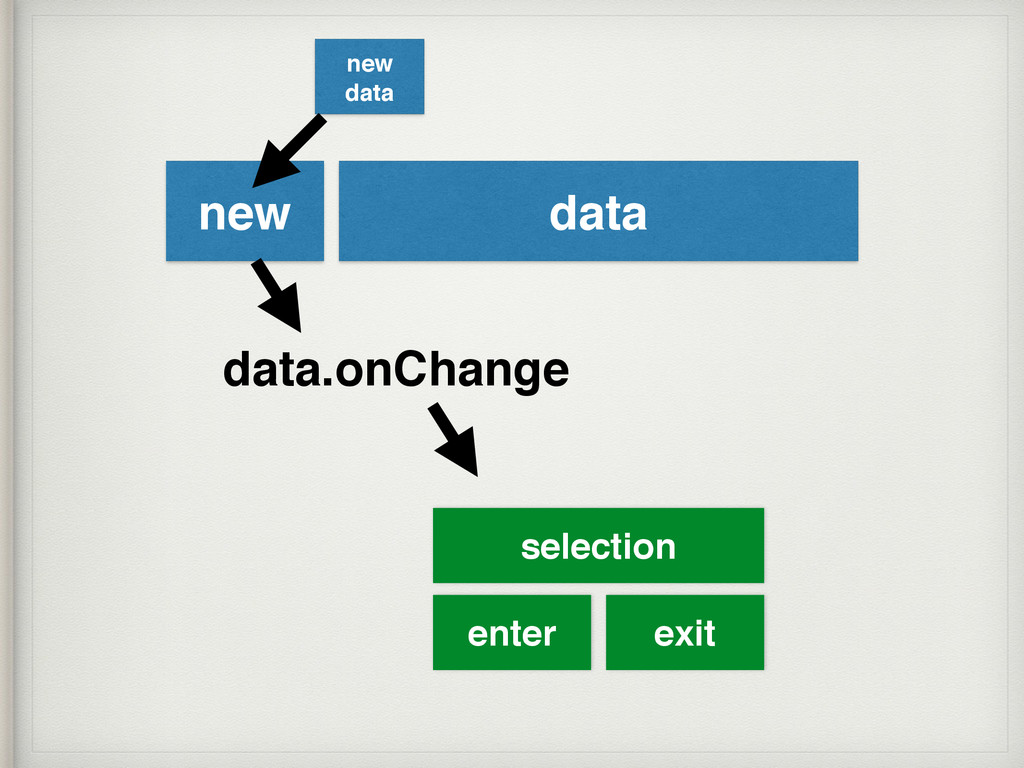
new data data new data.onChange enter exit selection
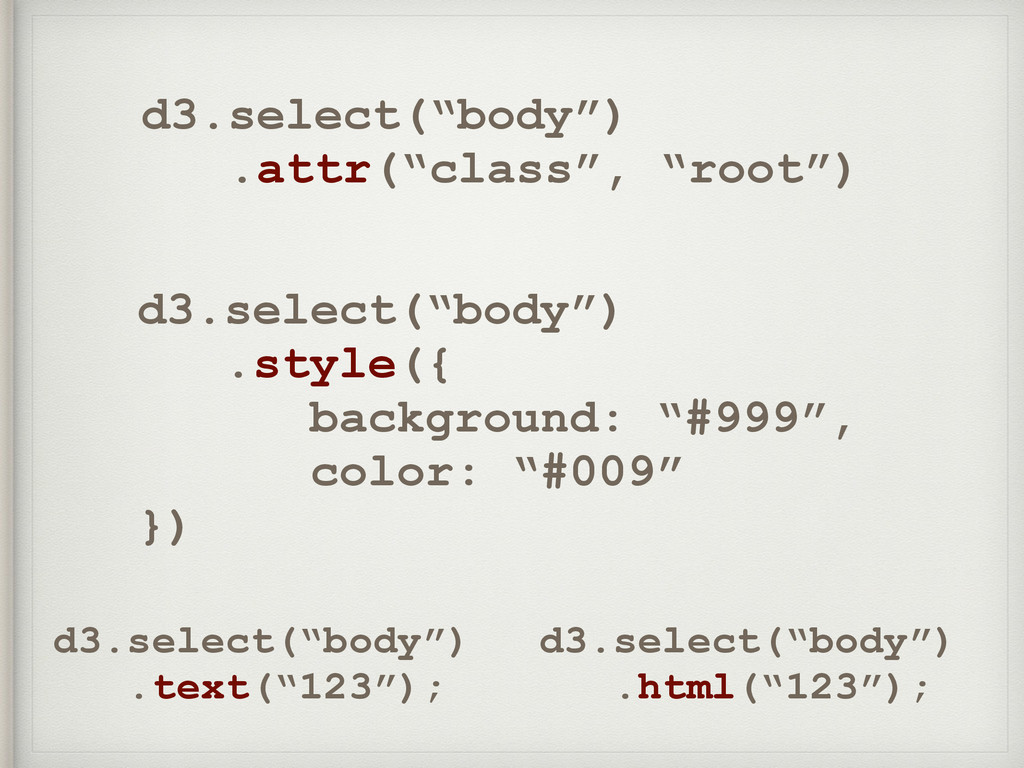
Topic 1 - Selections
d3.select(“body”) .attr(“class”, “root”) d3.select(“body”) .style({ background: “#999”, color: “#009” })
d3.select(“body”) .text(“123”); d3.select(“body”) .html(“123”);
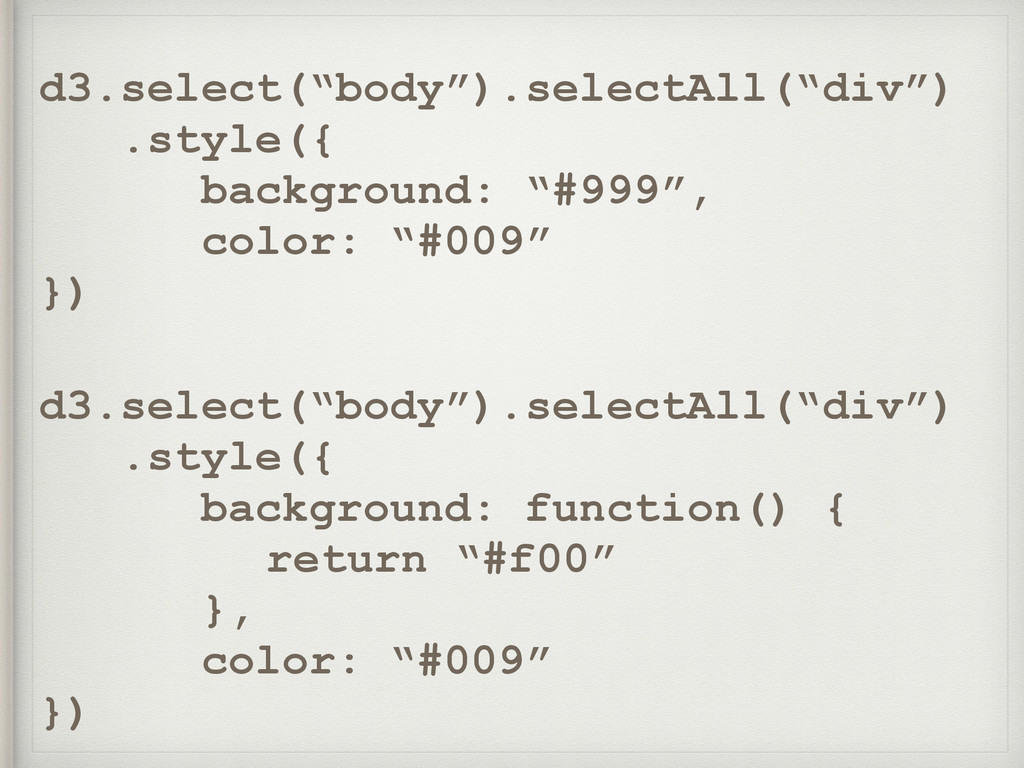
d3.select(“body”).selectAll(“div”) .style({ background: “#999”, color: “#009” }) d3.select(“body”).selectAll(“div”) .style({ background:
function() { return “#f00” }, color: “#009” })
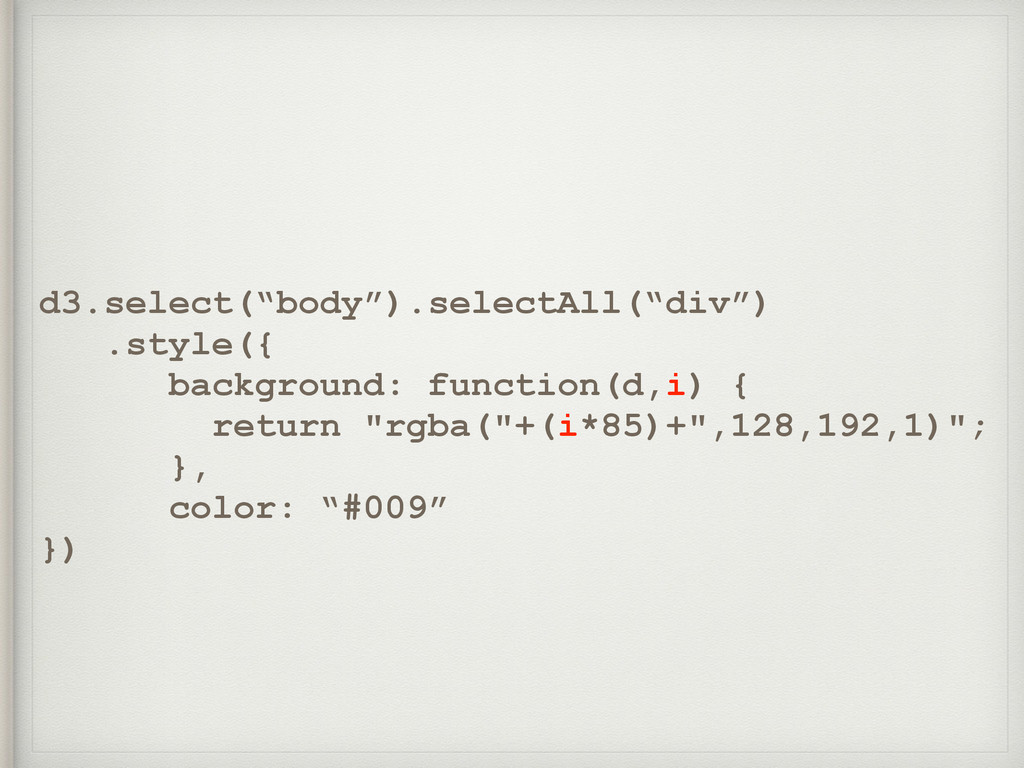
d3.select(“body”).selectAll(“div”) .style({ background: function(d,i) { return "rgba("+(i*85)+",128,192,1)"; }, color: “#009”
})
d3.select(“body”).selectAll(“div”) .data([“#f00”,”#f90”,”#ff0”]) .style({ background: function(d,i){ return d; }, color: “#009”
})
v = d3.select(“body”).selectAll(“div”) .data([“#f00”,”#f90”,”#ff0”]) v.exit().remove(); v.enter().append(“div”); d3.select(“body”).selectAll(“div”) .style({ background: function(d,i){
return d; }, color: “#009” }) .text(function(d) { return d; });
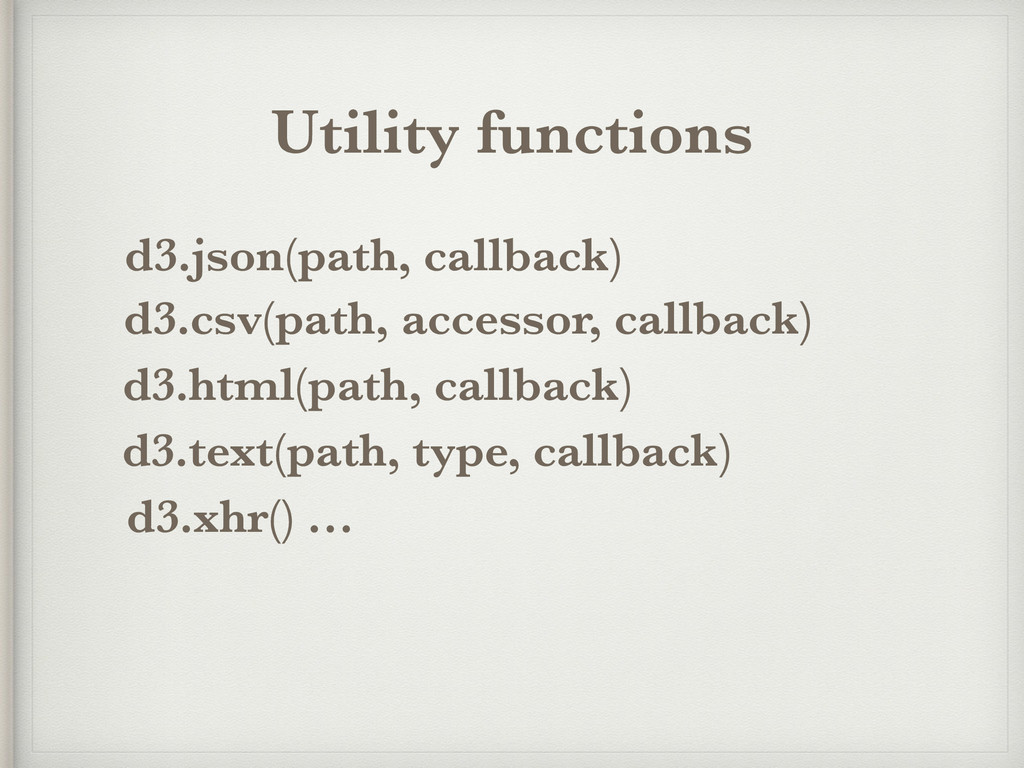
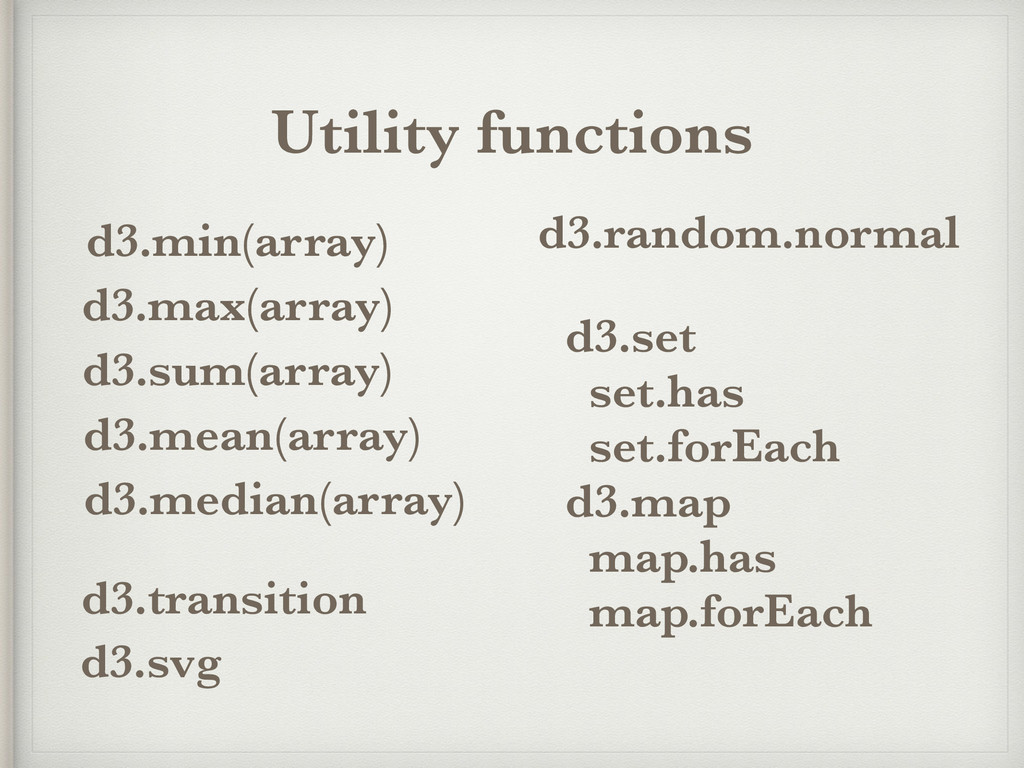
Topic 2 - Utilities
Utility functions d3.json(path, callback) d3.csv(path, accessor, callback) d3.html(path, callback) d3.text(path,
type, callback) d3.xhr() …
Utility functions d3.min(array) d3.max(array) d3.sum(array) d3.mean(array) d3.median(array) d3.random.normal d3.set set.has
set.forEach d3.map map.has map.forEach d3.transition d3.svg
Scale functions d3.scale.linear().domain(array).range(array) radius = d3.scale.linear() .domain([d3.min(data), d3.max(data)]) .range([“#f00”,”#00f”]) ticks
= radius.ticks(20); d3.scale.pow().exponent(3).domain(array).range(array) d3.scale.log().domain(array).range(array)
Scale functions d3.scale.linear() .domain([0,100]) .range([“#000”,”#f00”]) d3.scale.category10() d3.scale.category20() d3.scale.category20b() d3.scale.category20c()
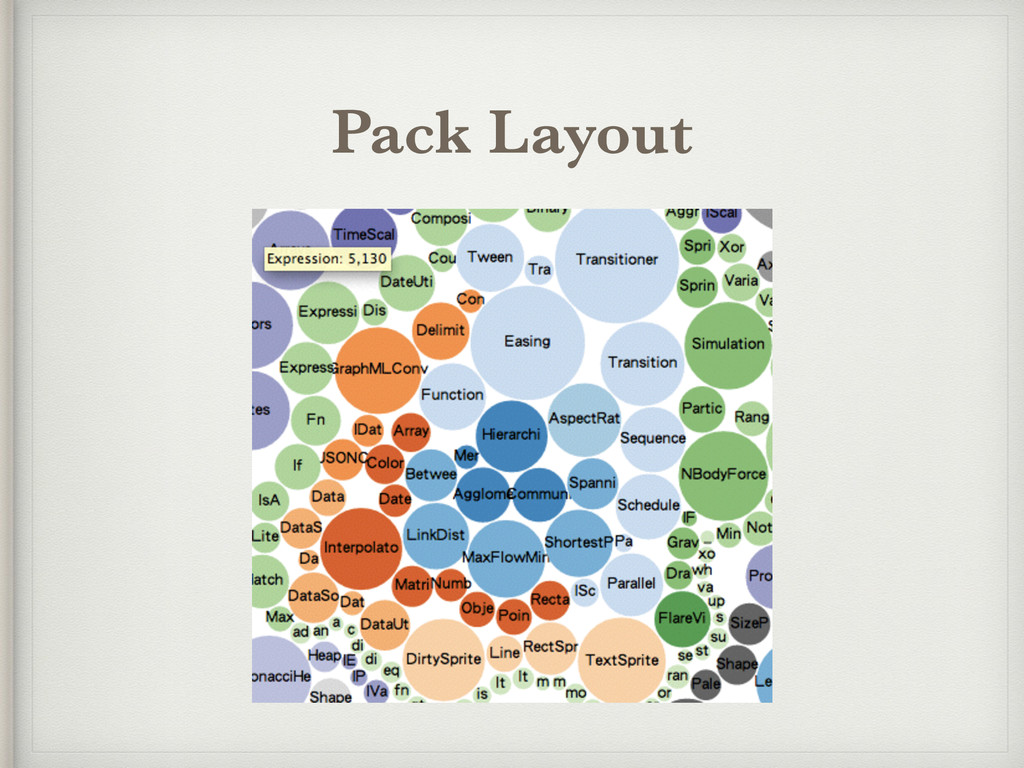
Topic 3 - Layout
Pack Layout
Pack Layout nodes = d3.layout.pack().size([w,h]) .nodes(data) structure of data: {
value: ?, children: [ ] } { value: ?, children: [ ], parent, depth, x, y, r }
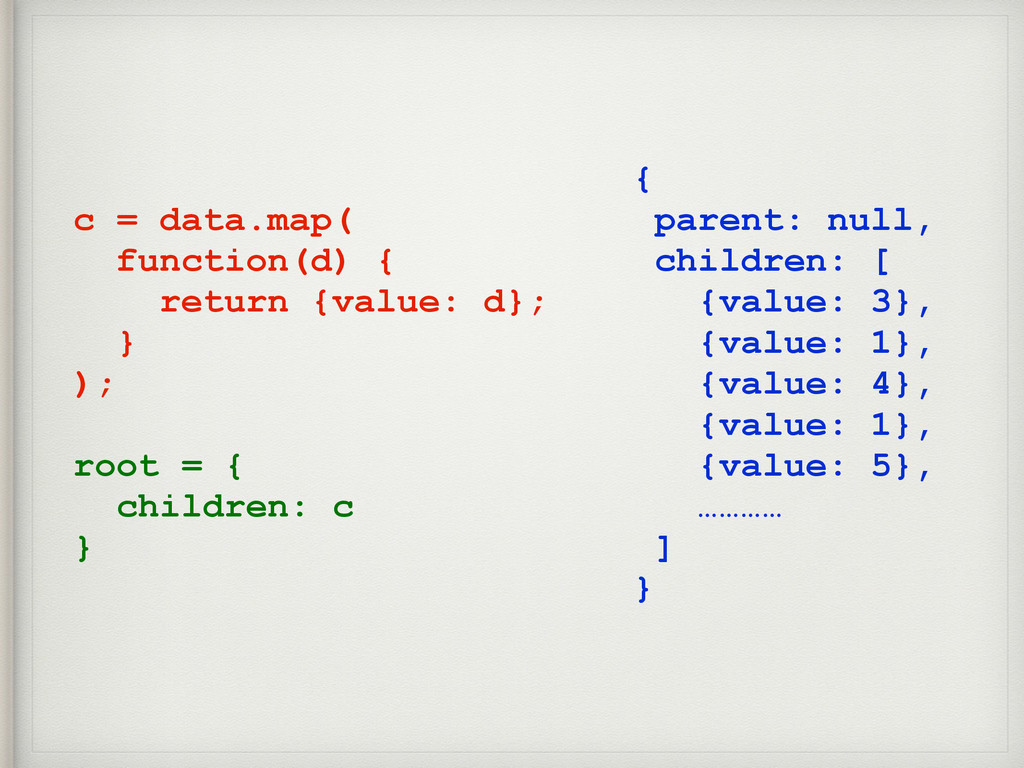
{ parent: null, children: [ {value: 3}, {value: 1}, {value:
4}, {value: 1}, {value: 5}, ………… ] } c = data.map( function(d) { return {value: d}; } ); root = { children: c }
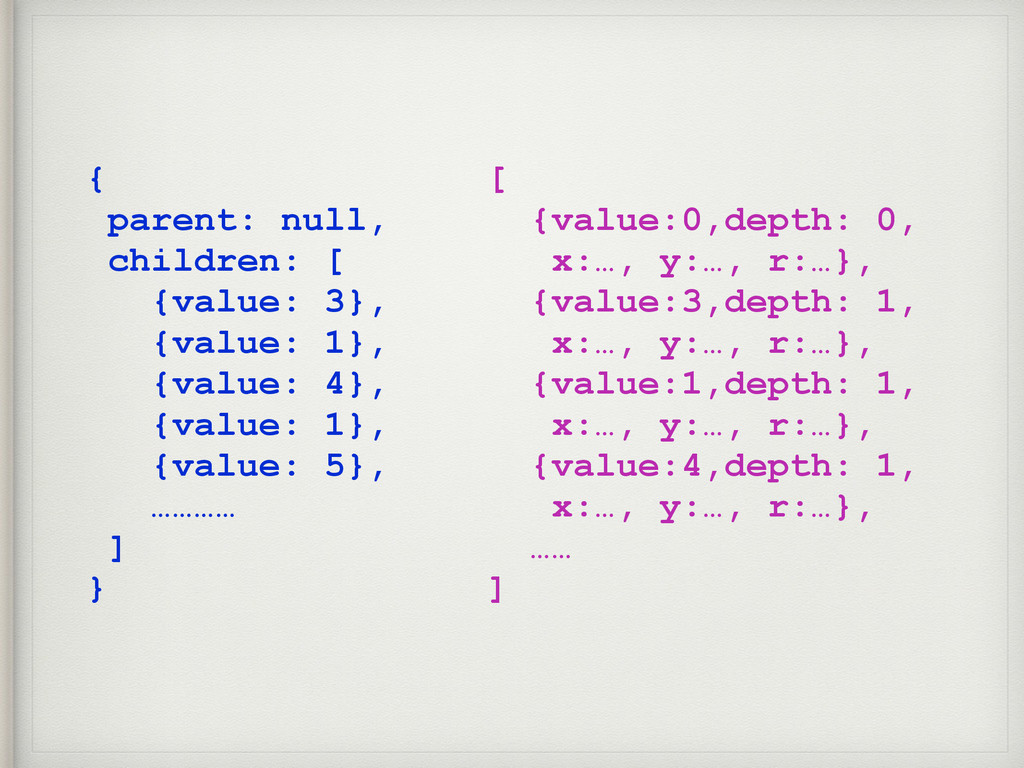
{ parent: null, children: [ {value: 3}, {value: 1}, {value:
4}, {value: 1}, {value: 5}, ………… ] } [ {value:0,depth: 0, x:…, y:…, r:…}, {value:3,depth: 1, x:…, y:…, r:…}, {value:1,depth: 1, x:…, y:…, r:…}, {value:4,depth: 1, x:…, y:…, r:…}, …… ]
Pack Layout d3.layout.pack() .sort(function(a,b) {…}) .padding(5) .size([w,h]) .nodes(data) d3.layout.pack().links(nodes) {
source: <node>, target: <node> }
Partition Layout d3.layout.partition() .sort(function(a,b) {…}) .size([w,h]) .nodes(data) d3.layout.partition().links(data) { value:
?, children: [], parent, depth, x, y, r, dx, dy }
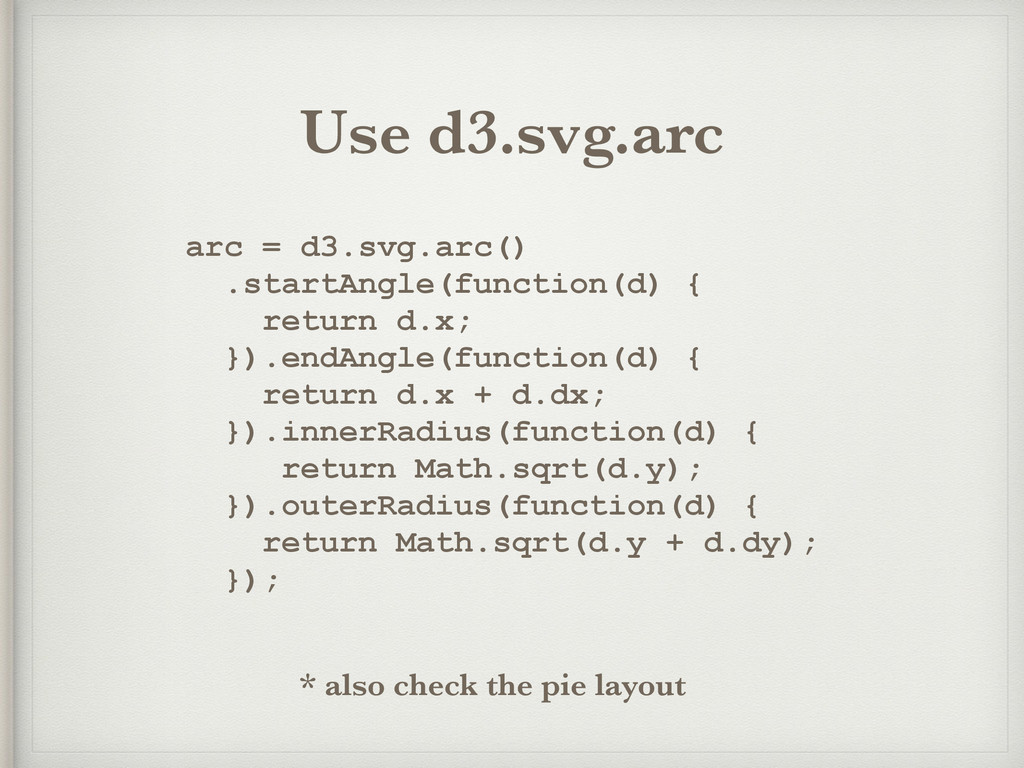
arc = d3.svg.arc() .startAngle(function(d) { return d.x; }).endAngle(function(d) { return
d.x + d.dx; }).innerRadius(function(d) { return Math.sqrt(d.y); }).outerRadius(function(d) { return Math.sqrt(d.y + d.dy); }); Use d3.svg.arc * also check the pie layout
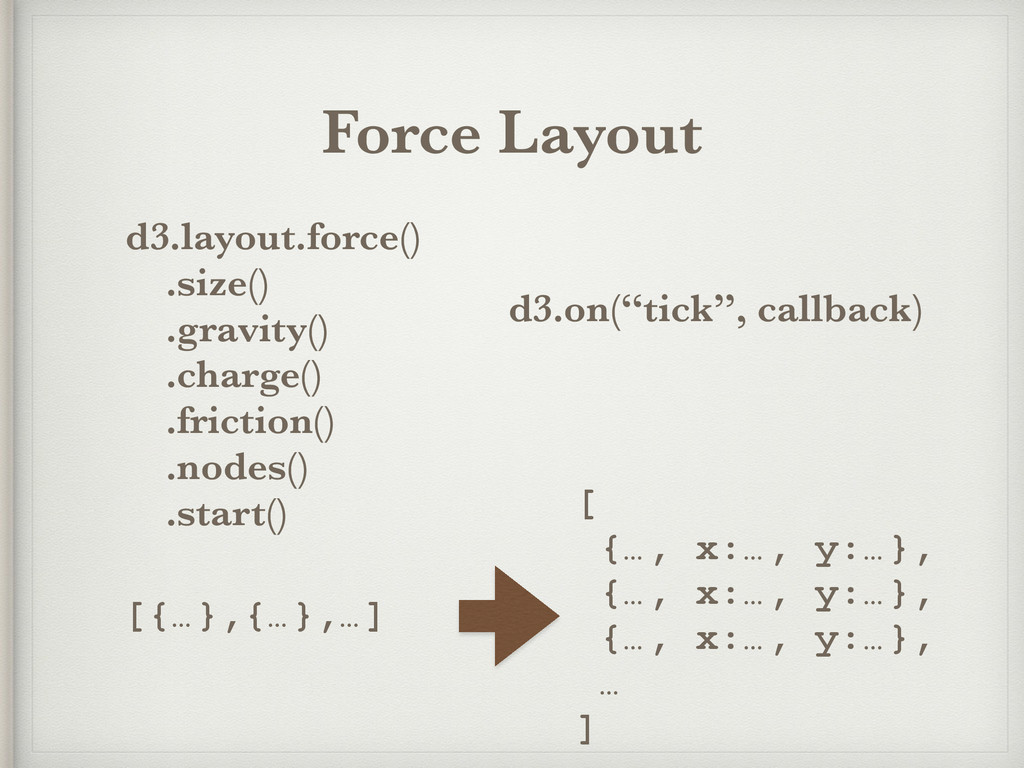
Force Layout d3.layout.force() .size() .gravity() .charge() .friction() .nodes() .start() d3.on(“tick”,
callback) [{…},{…},…] [ {…, x:…, y:…}, {…, x:…, y:…}, {…, x:…, y:…}, … ]
data = [1,2,3,4].map(function(d) { return {v:d}; }); force = d3.layout.force().nodes(data);
force.on(“tick”, function() { d3.selectAll(“…”).attr({ x: function(d) { return d.x; }, y: function(d) { return d.y; }, … }); force.start();
Cluster Layout d3.layout.cluster() .sort(function(a,b) {…}) .size([w,h]) .nodes(data) d3.layout.cluster().links(data) { value:
?, children: [], parent, depth, x, y }
![d3.select(“body”).selectAll(“div”) .data([“#f00”,”#f90”,”#ff0”]) .style({ background: function(d,i){ return d; }, color: “#009”](https://files.speakerdeck.com/presentations/fa20bc0b6a30435383d3110a31e80c78/slide_56.jpg)
![v = d3.select(“body”).selectAll(“div”) .data([“#f00”,”#f90”,”#ff0”]) v.exit().remove(); v.enter().append(“div”); d3.select(“body”).selectAll(“div”) .style({ background: function(d,i){](https://files.speakerdeck.com/presentations/fa20bc0b6a30435383d3110a31e80c78/slide_57.jpg)
![Scale functions d3.scale.linear().domain(array).range(array) radius = d3.scale.linear() .domain([d3.min(data), d3.max(data)]) .range([“#f00”,”#00f”]) ticks](https://files.speakerdeck.com/presentations/fa20bc0b6a30435383d3110a31e80c78/slide_61.jpg)
![Scale functions d3.scale.linear() .domain([0,100]) .range([“#000”,”#f00”]) d3.scale.category10() d3.scale.category20() d3.scale.category20b() d3.scale.category20c()](https://files.speakerdeck.com/presentations/fa20bc0b6a30435383d3110a31e80c78/slide_62.jpg)
![Pack Layout nodes = d3.layout.pack().size([w,h]) .nodes(data) structure of data: {](https://files.speakerdeck.com/presentations/fa20bc0b6a30435383d3110a31e80c78/slide_65.jpg)
![Pack Layout d3.layout.pack() .sort(function(a,b) {…}) .padding(5) .size([w,h]) .nodes(data) d3.layout.pack().links(nodes) {](https://files.speakerdeck.com/presentations/fa20bc0b6a30435383d3110a31e80c78/slide_68.jpg)
![Partition Layout d3.layout.partition() .sort(function(a,b) {…}) .size([w,h]) .nodes(data) d3.layout.partition().links(data) { value:](https://files.speakerdeck.com/presentations/fa20bc0b6a30435383d3110a31e80c78/slide_69.jpg)
![data = [1,2,3,4].map(function(d) { return {v:d}; }); force = d3.layout.force().nodes(data);](https://files.speakerdeck.com/presentations/fa20bc0b6a30435383d3110a31e80c78/slide_72.jpg)
![Cluster Layout d3.layout.cluster() .sort(function(a,b) {…}) .size([w,h]) .nodes(data) d3.layout.cluster().links(data) { value:](https://files.speakerdeck.com/presentations/fa20bc0b6a30435383d3110a31e80c78/slide_73.jpg)