Systems. TRACKING KEY CAADP INDICATORS AND IMPLEMENTATION PROCESSES Wondwosen Tefera, Tsitsi Makombe, Paul Guthiga, and Julia Collins AKADEMIYA2063 January 22, 2026
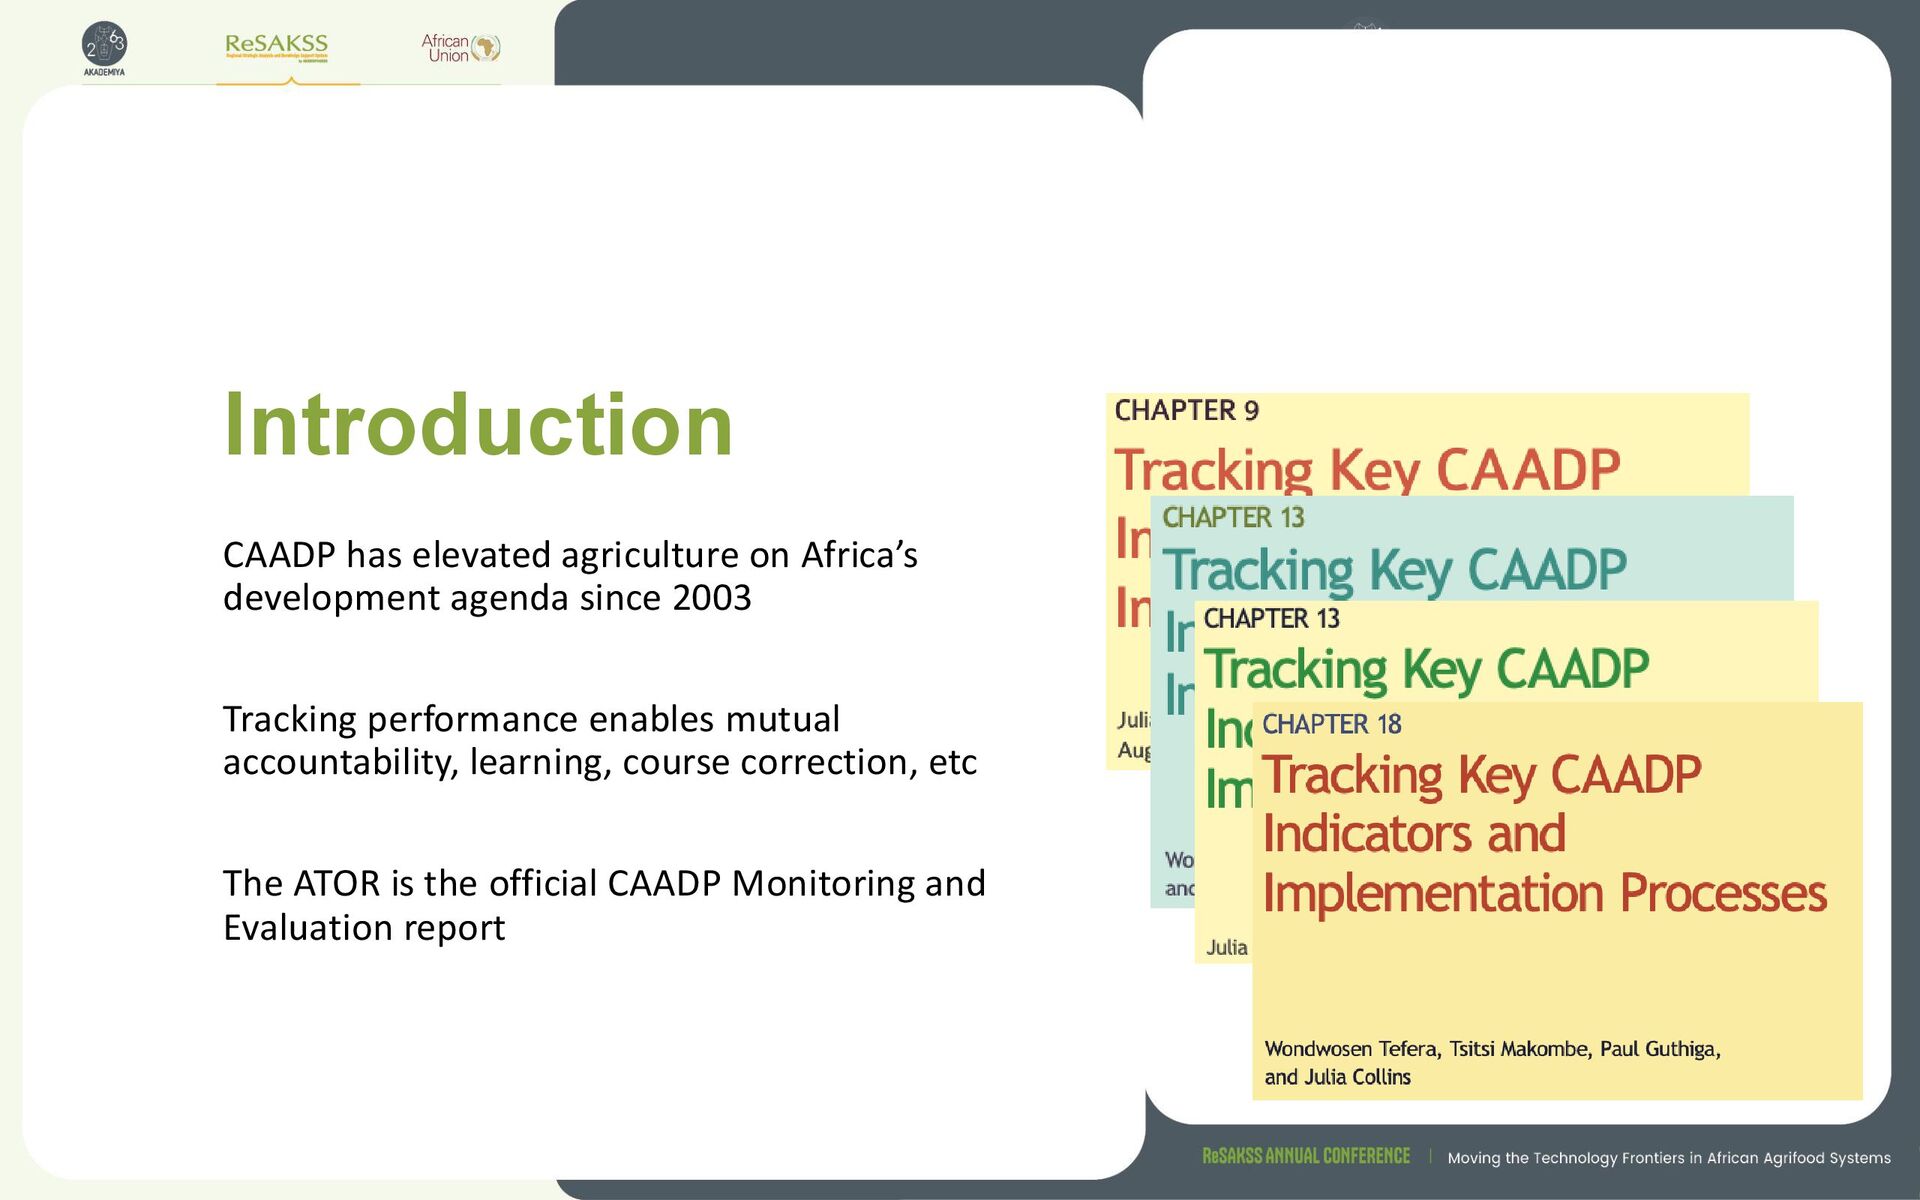
2003 Tracking performance enables mutual accountability, learning, course correction, etc The ATOR is the official CAADP Monitoring and Evaluation report
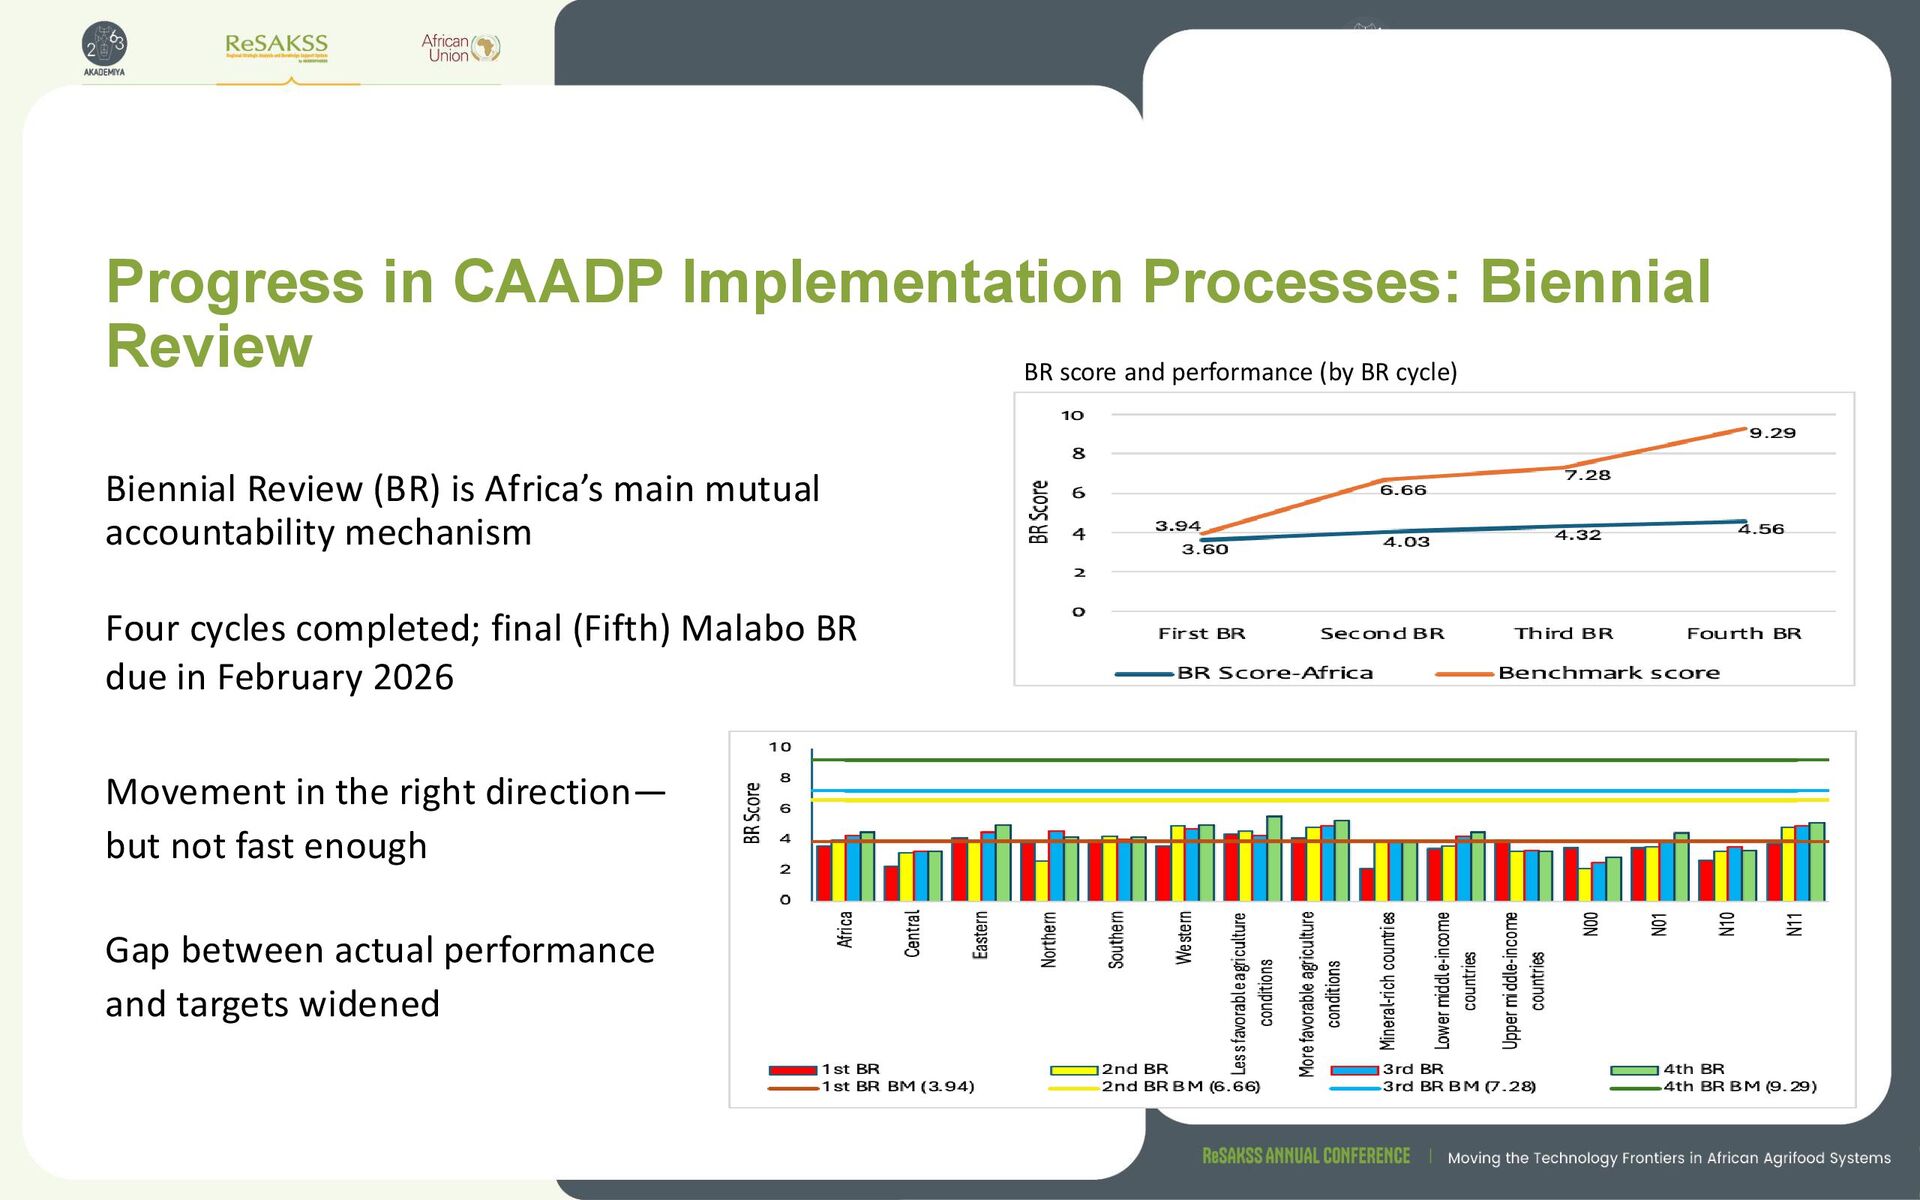
is Africa’s main mutual accountability mechanism Four cycles completed; final (Fifth) Malabo BR due in February 2026 Movement in the right direction— but not fast enough Gap between actual performance and targets widened BR score and performance (by BR cycle)
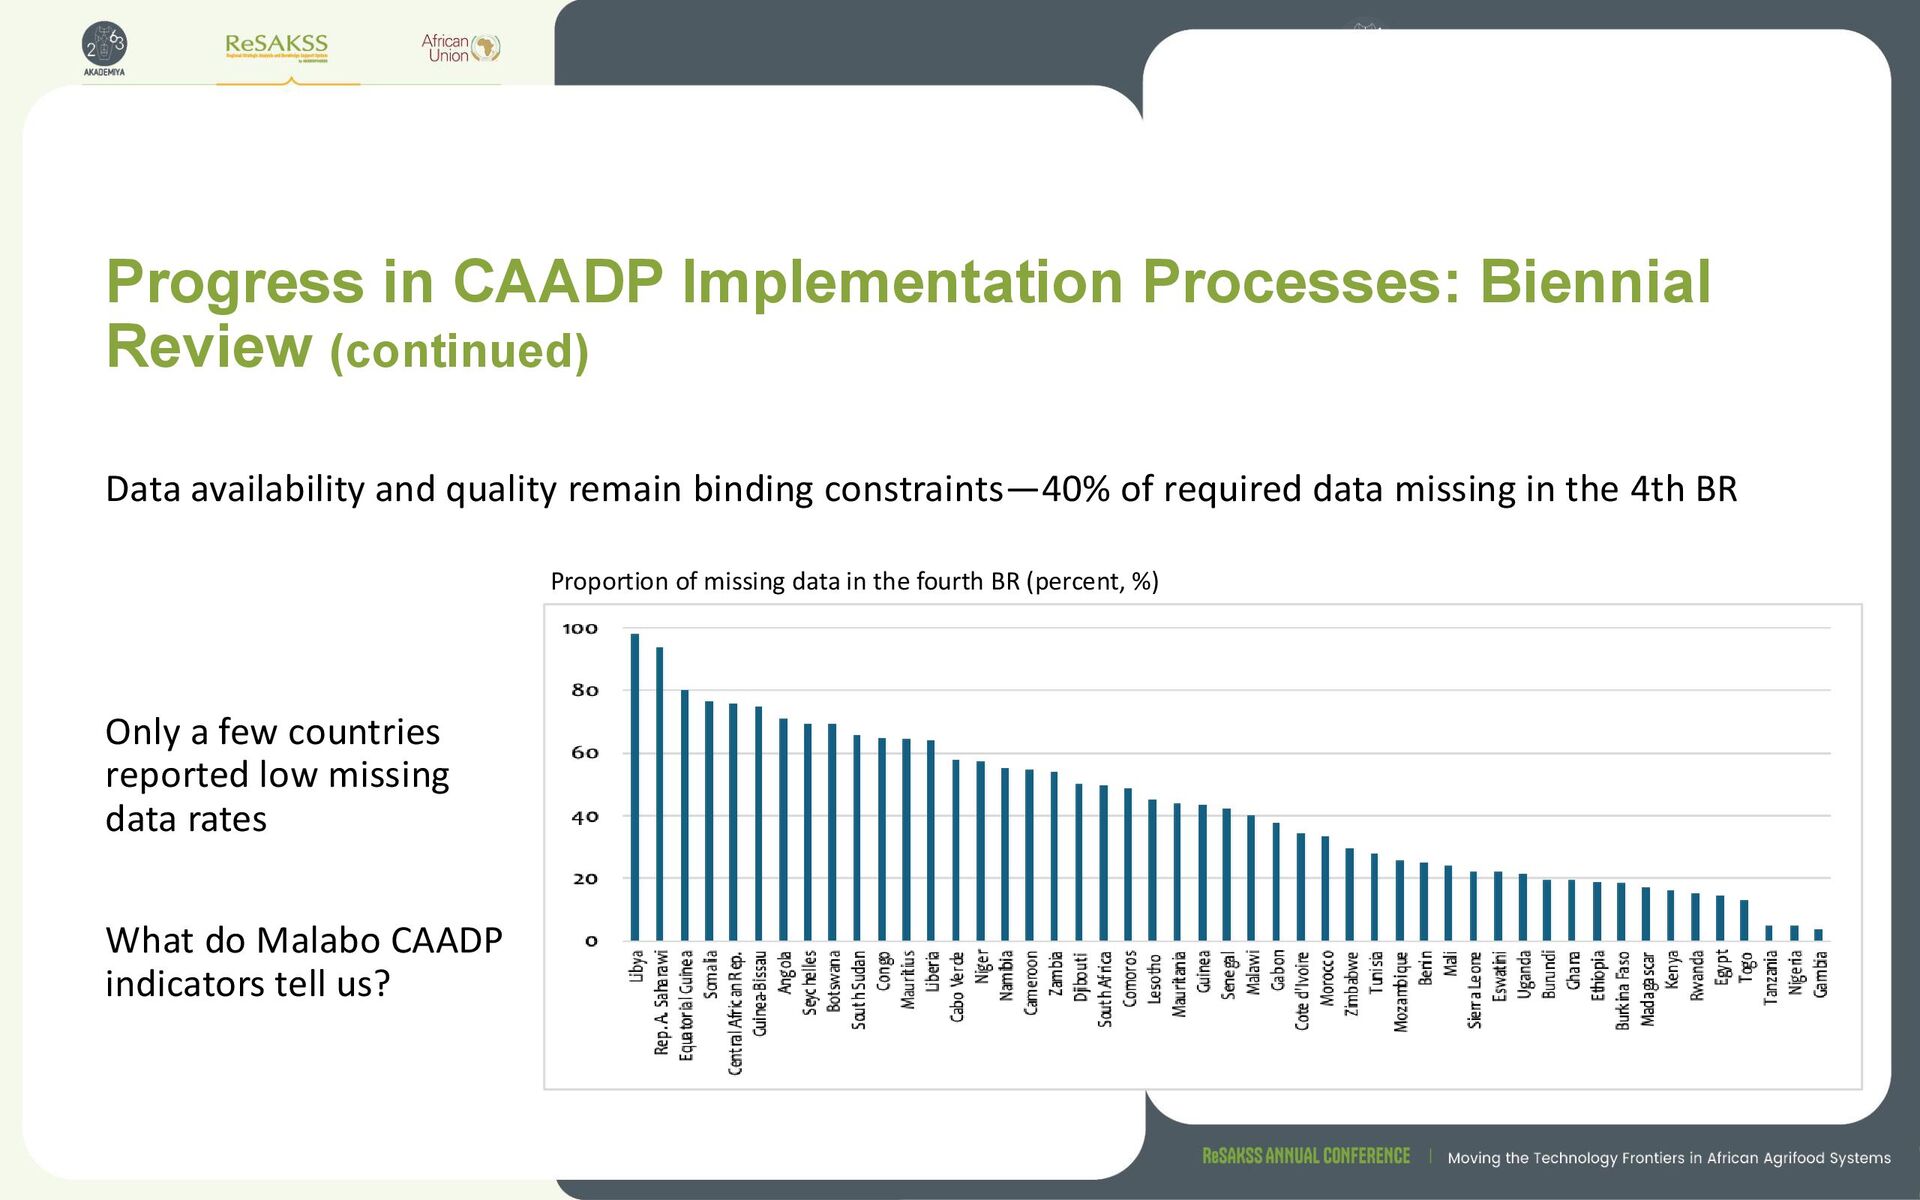
and quality remain binding constraints—40% of required data missing in the 4th BR Proportion of missing data in the fourth BR (percent, %) Only a few countries reported low missing data rates What do Malabo CAADP indicators tell us?
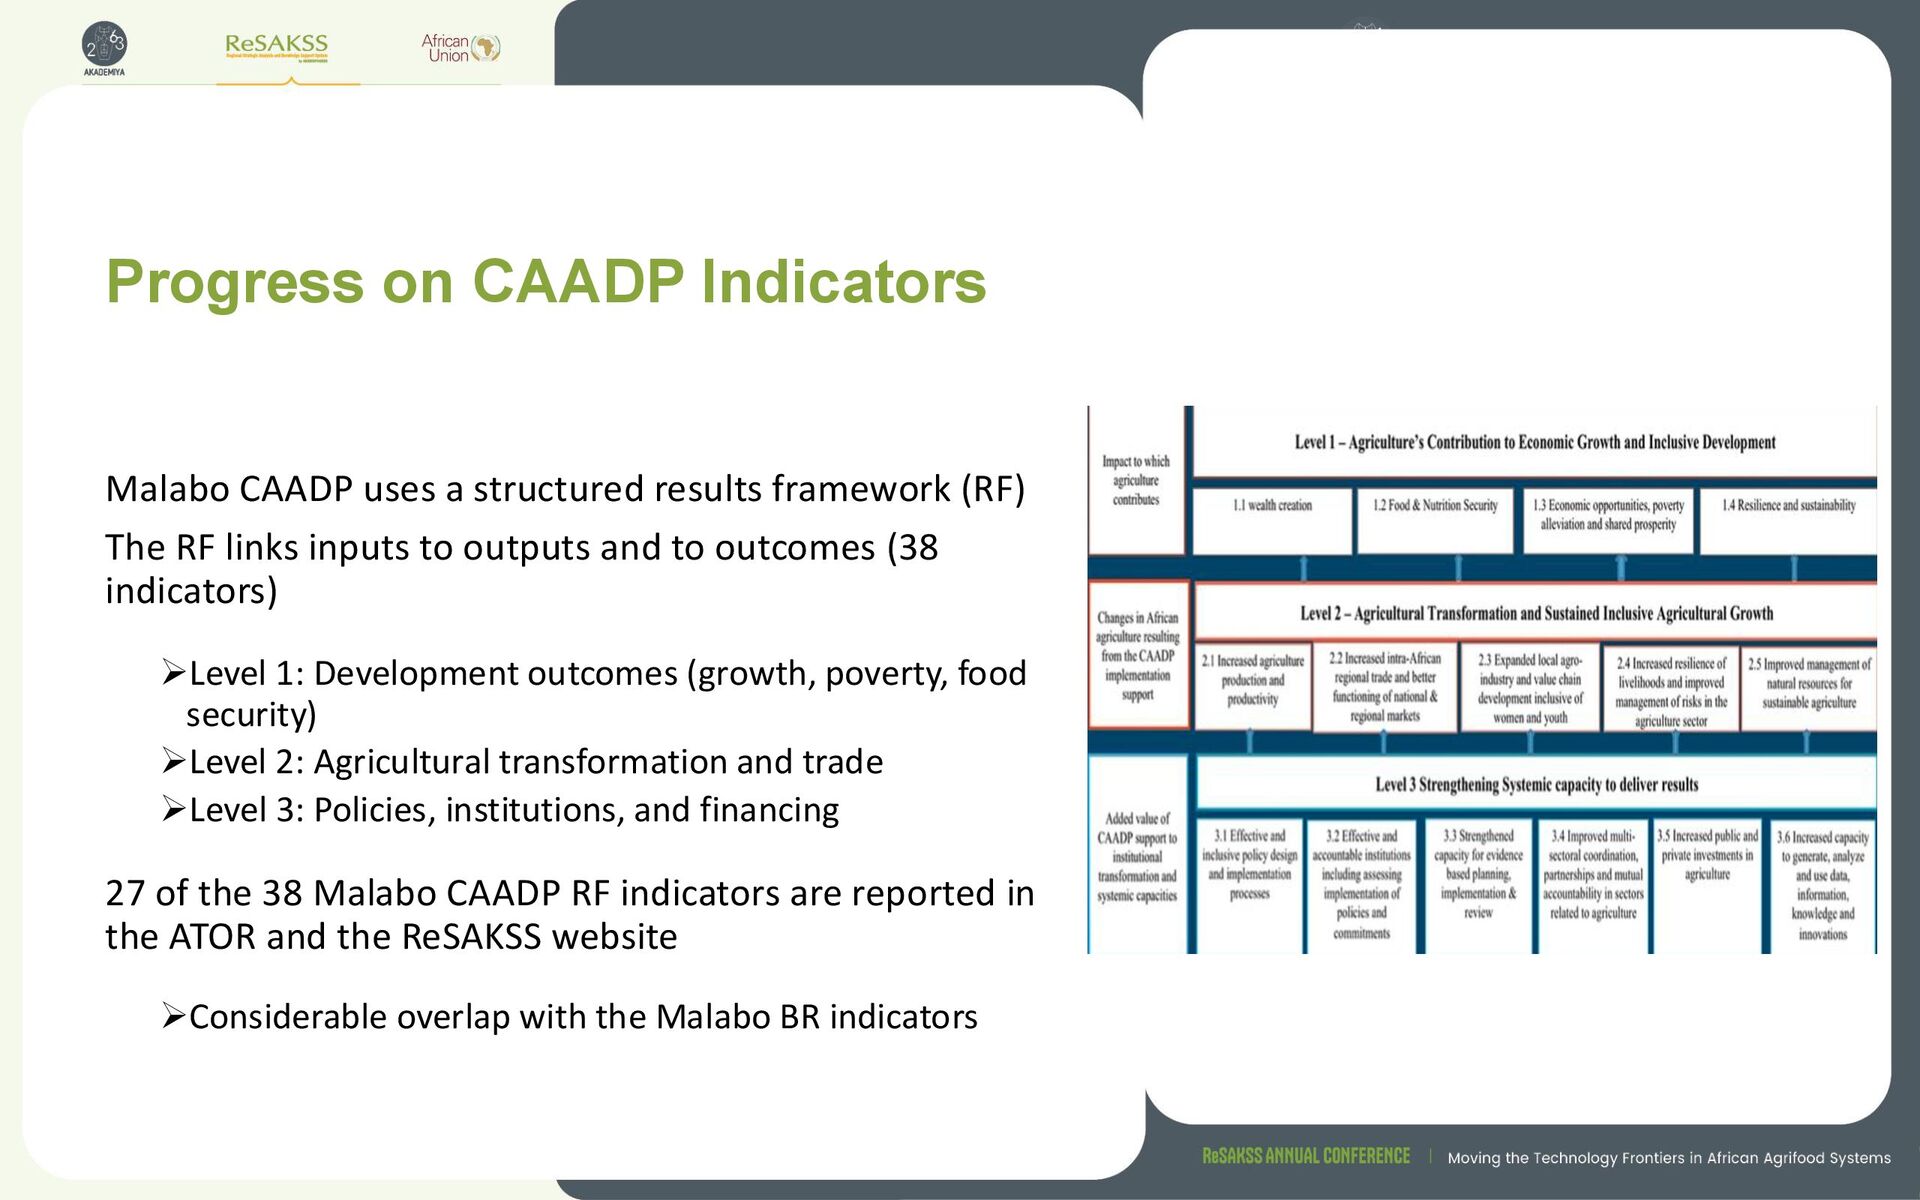
framework (RF) The RF links inputs to outputs and to outcomes (38 indicators) ➢Level 1: Development outcomes (growth, poverty, food security) ➢Level 2: Agricultural transformation and trade ➢Level 3: Policies, institutions, and financing 27 of the 38 Malabo CAADP RF indicators are reported in the ATOR and the ReSAKSS website ➢Considerable overlap with the Malabo BR indicators
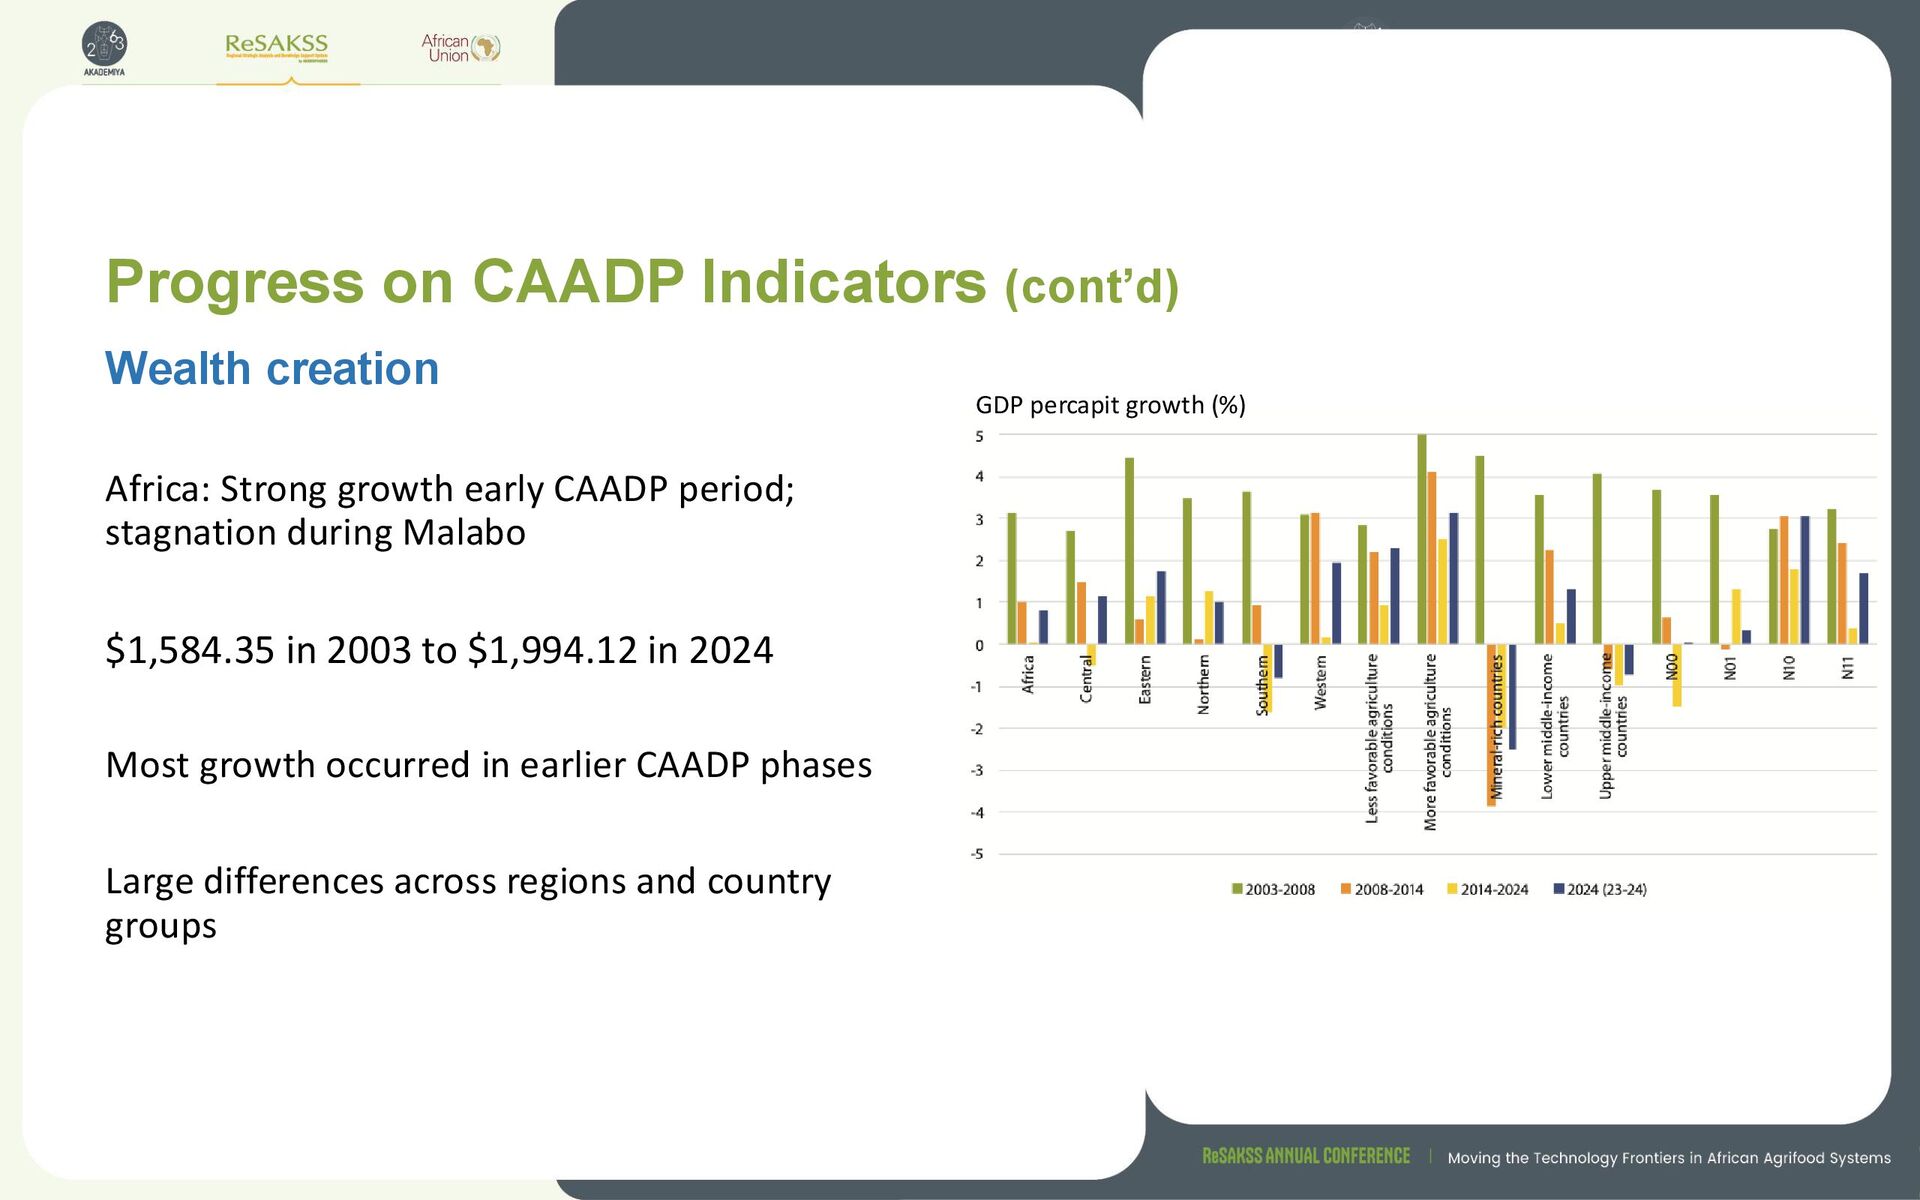
period; stagnation during Malabo $1,584.35 in 2003 to $1,994.12 in 2024 Most growth occurred in earlier CAADP phases Large differences across regions and country groups Wealth creation GDP percapit growth (%)
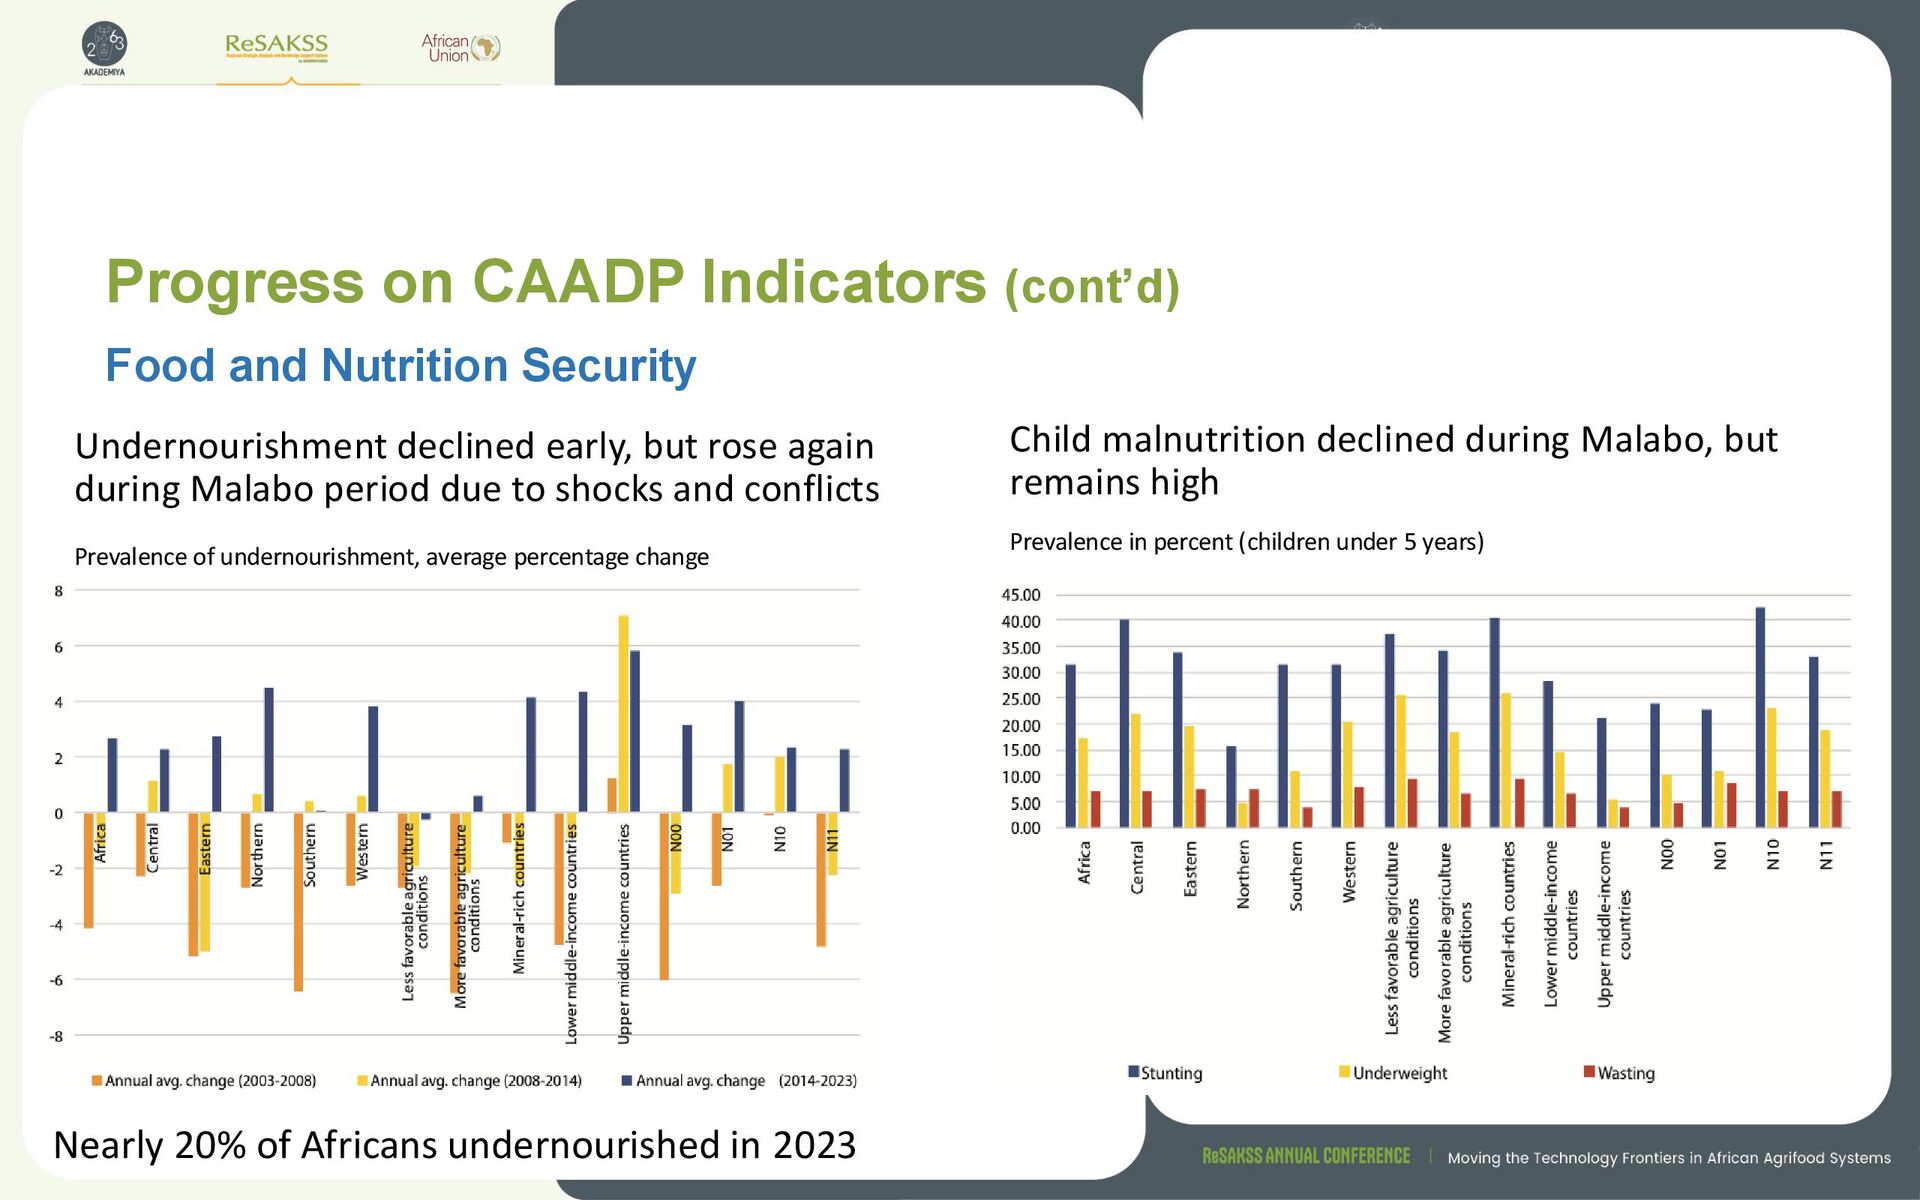
again during Malabo period due to shocks and conflicts Food and Nutrition Security Child malnutrition declined during Malabo, but remains high Prevalence of undernourishment, average percentage change Prevalence in percent (children under 5 years) Nearly 20% of Africans undernourished in 2023
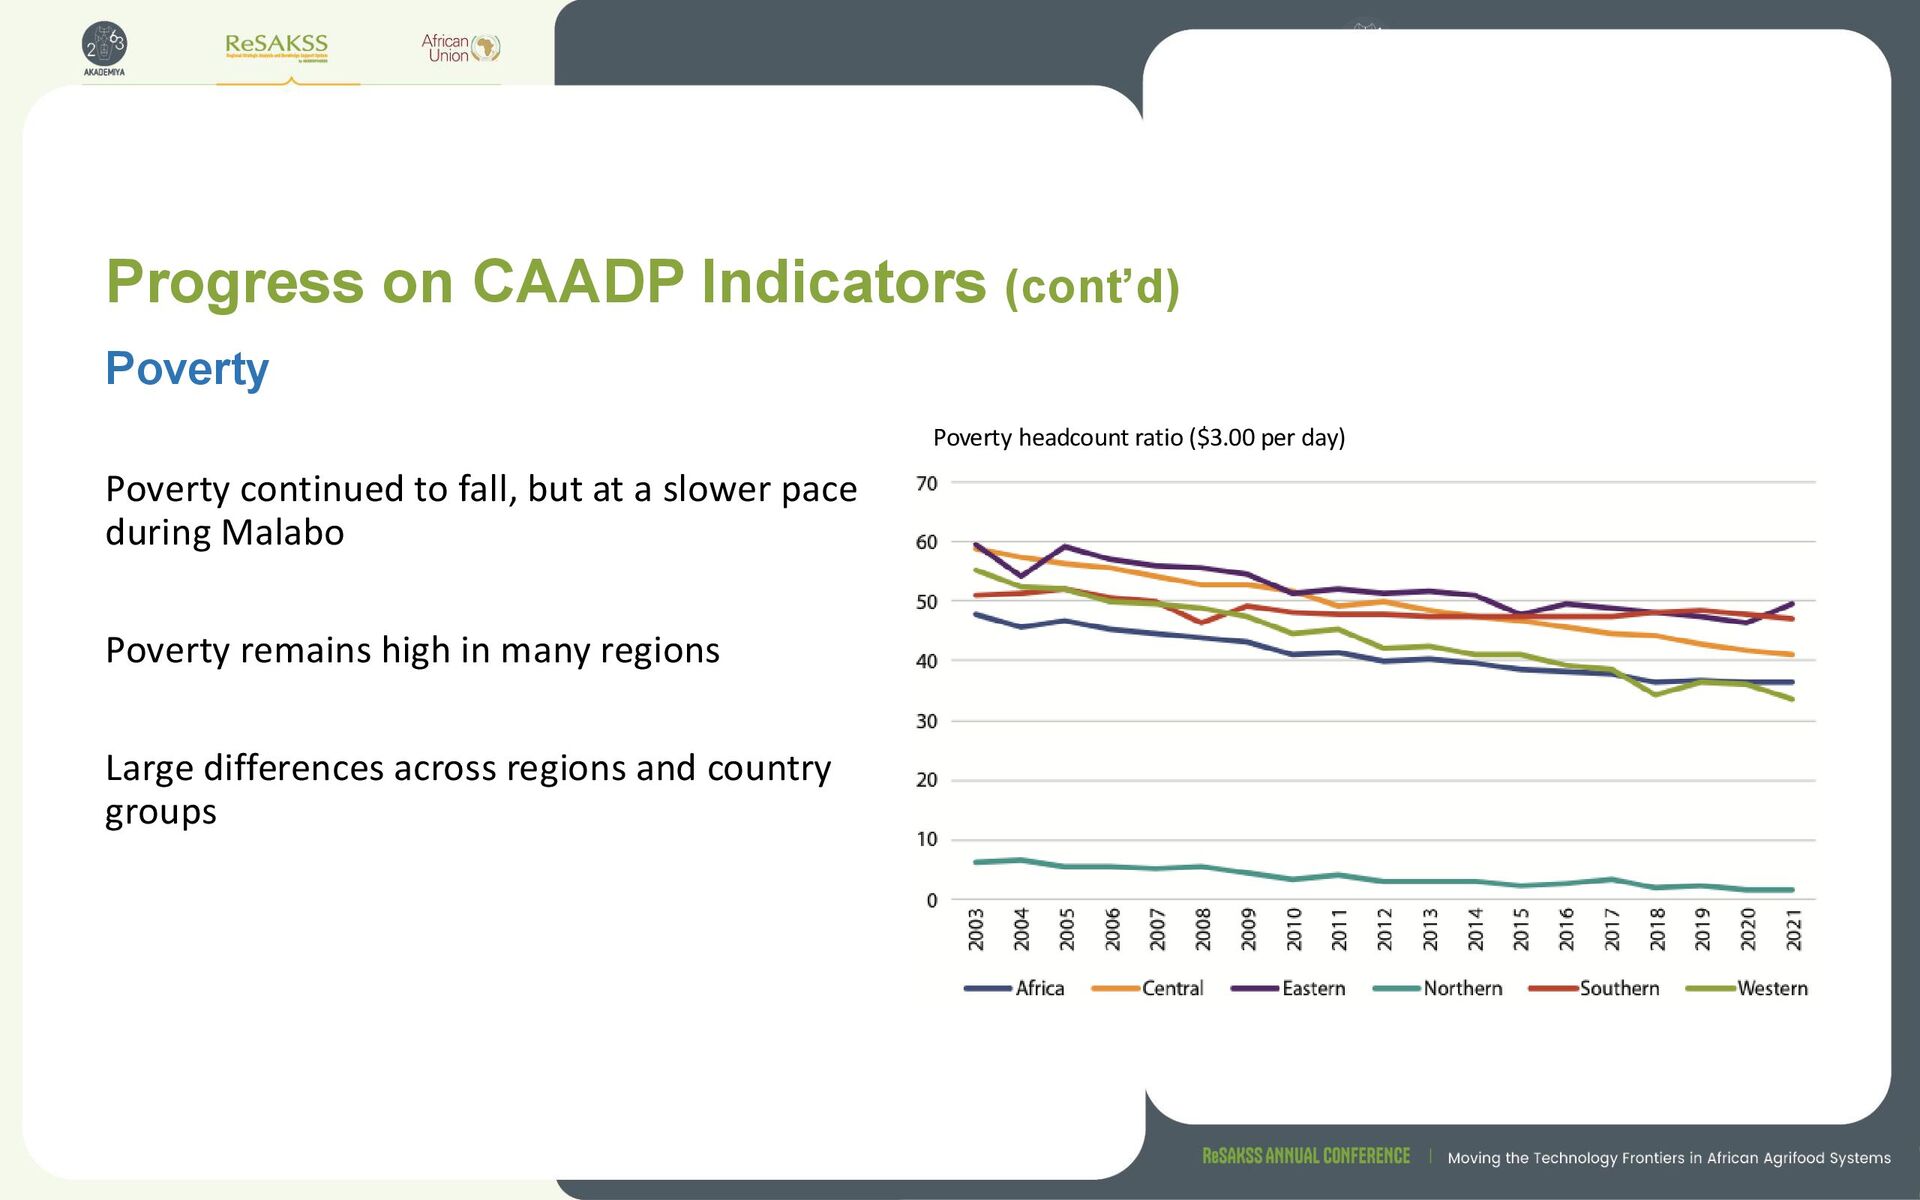
at a slower pace during Malabo Poverty remains high in many regions Large differences across regions and country groups Poverty Poverty headcount ratio ($3.00 per day)
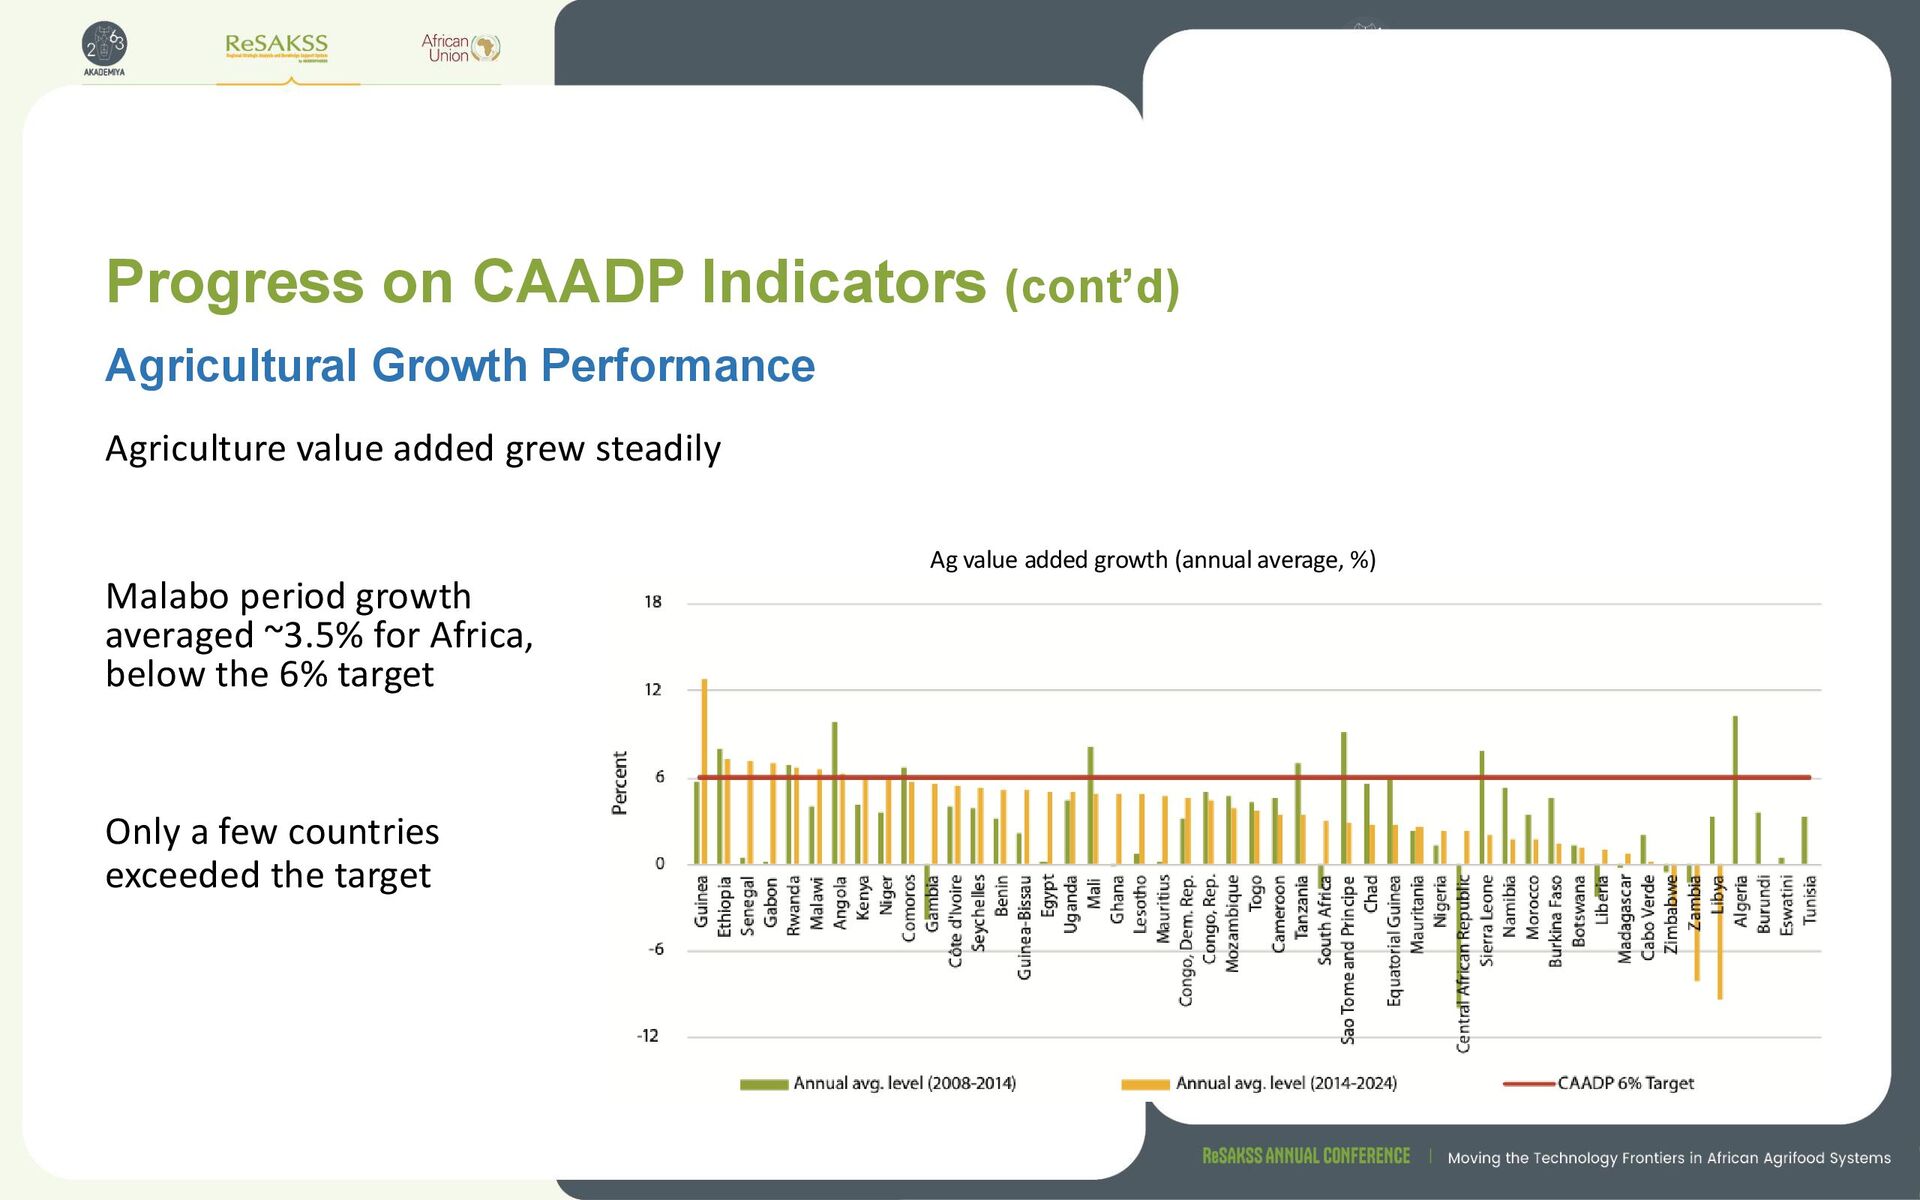
Agricultural Growth Performance Ag value added growth (annual average, %) Malabo period growth averaged ~3.5% for Africa, below the 6% target Only a few countries exceeded the target
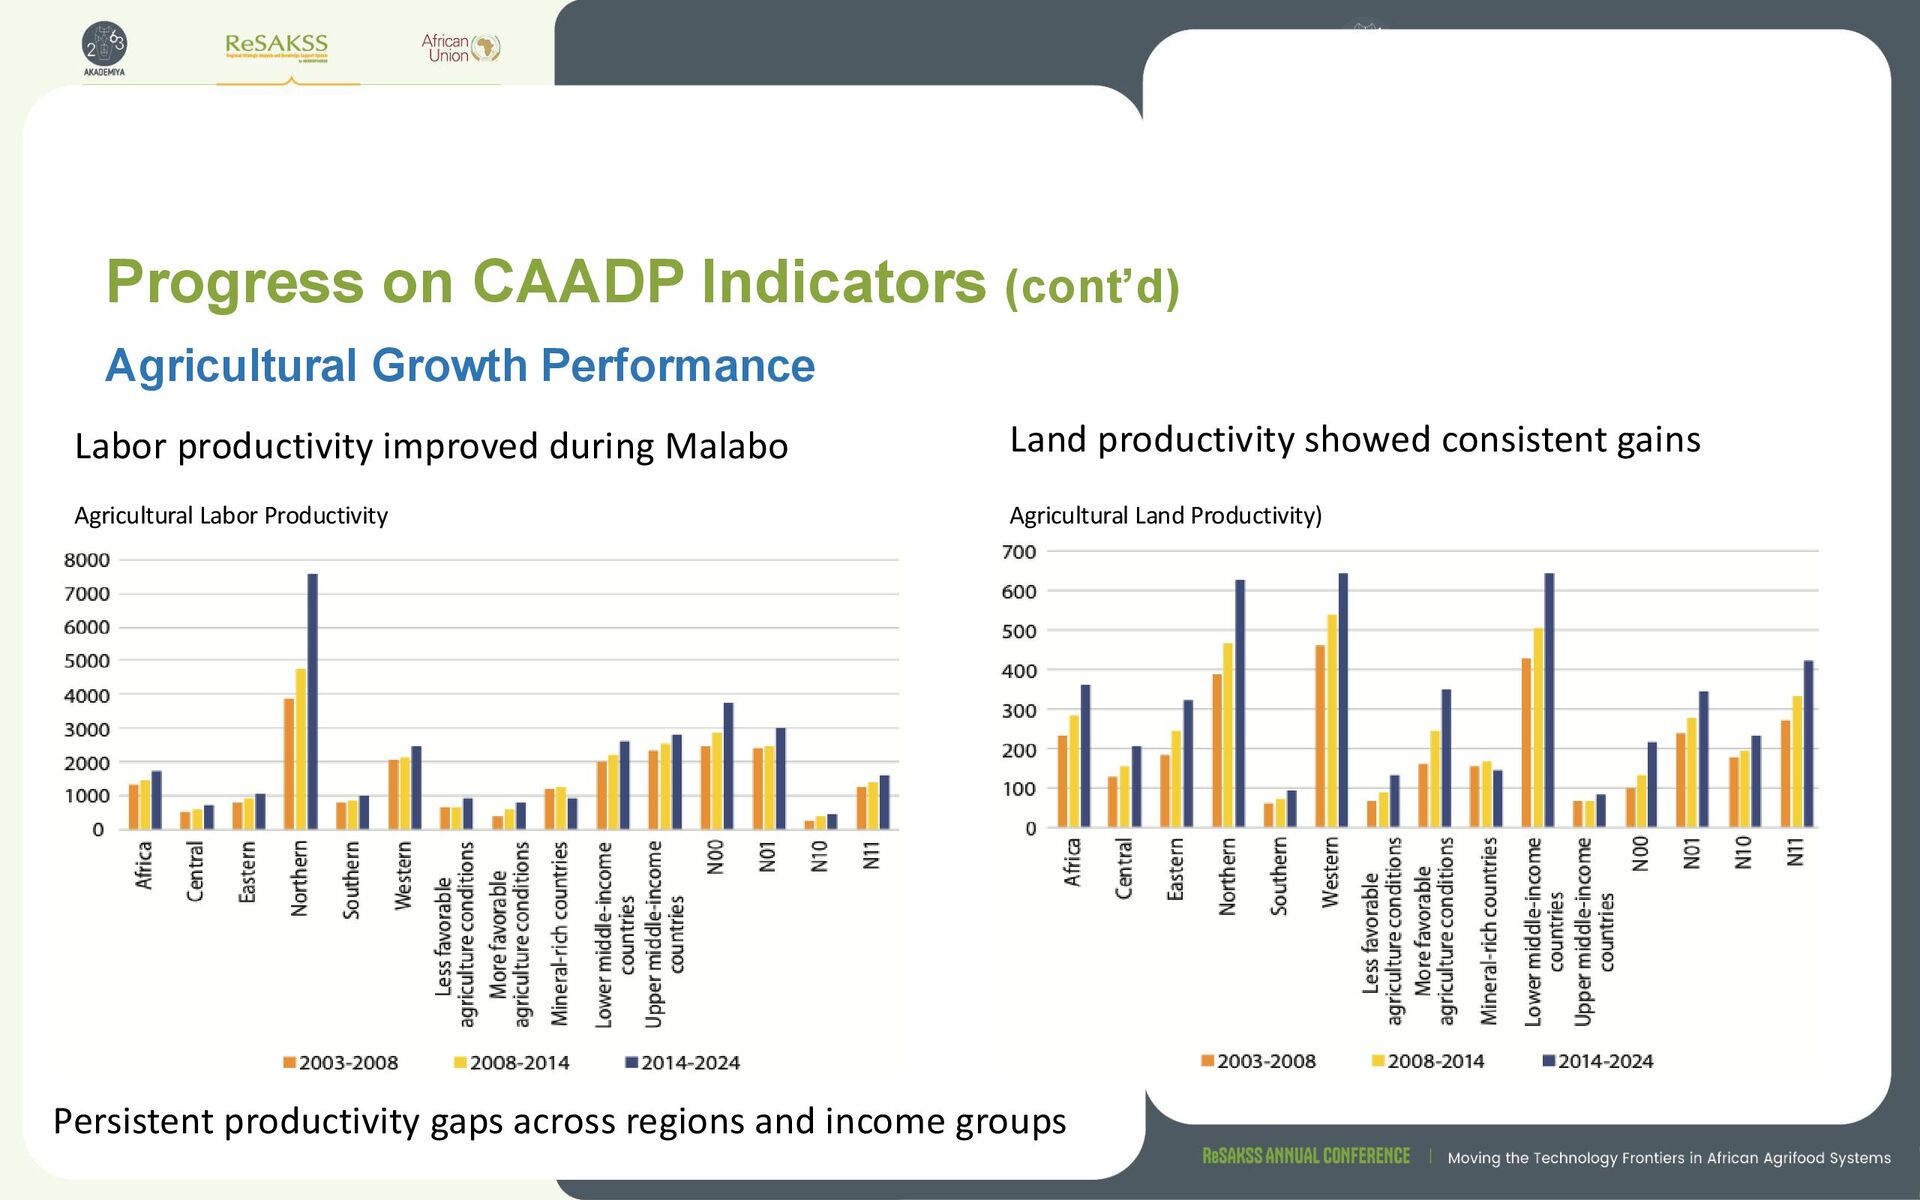
Agricultural Growth Performance Land productivity showed consistent gains Agricultural Labor Productivity Agricultural Land Productivity) Persistent productivity gaps across regions and income groups
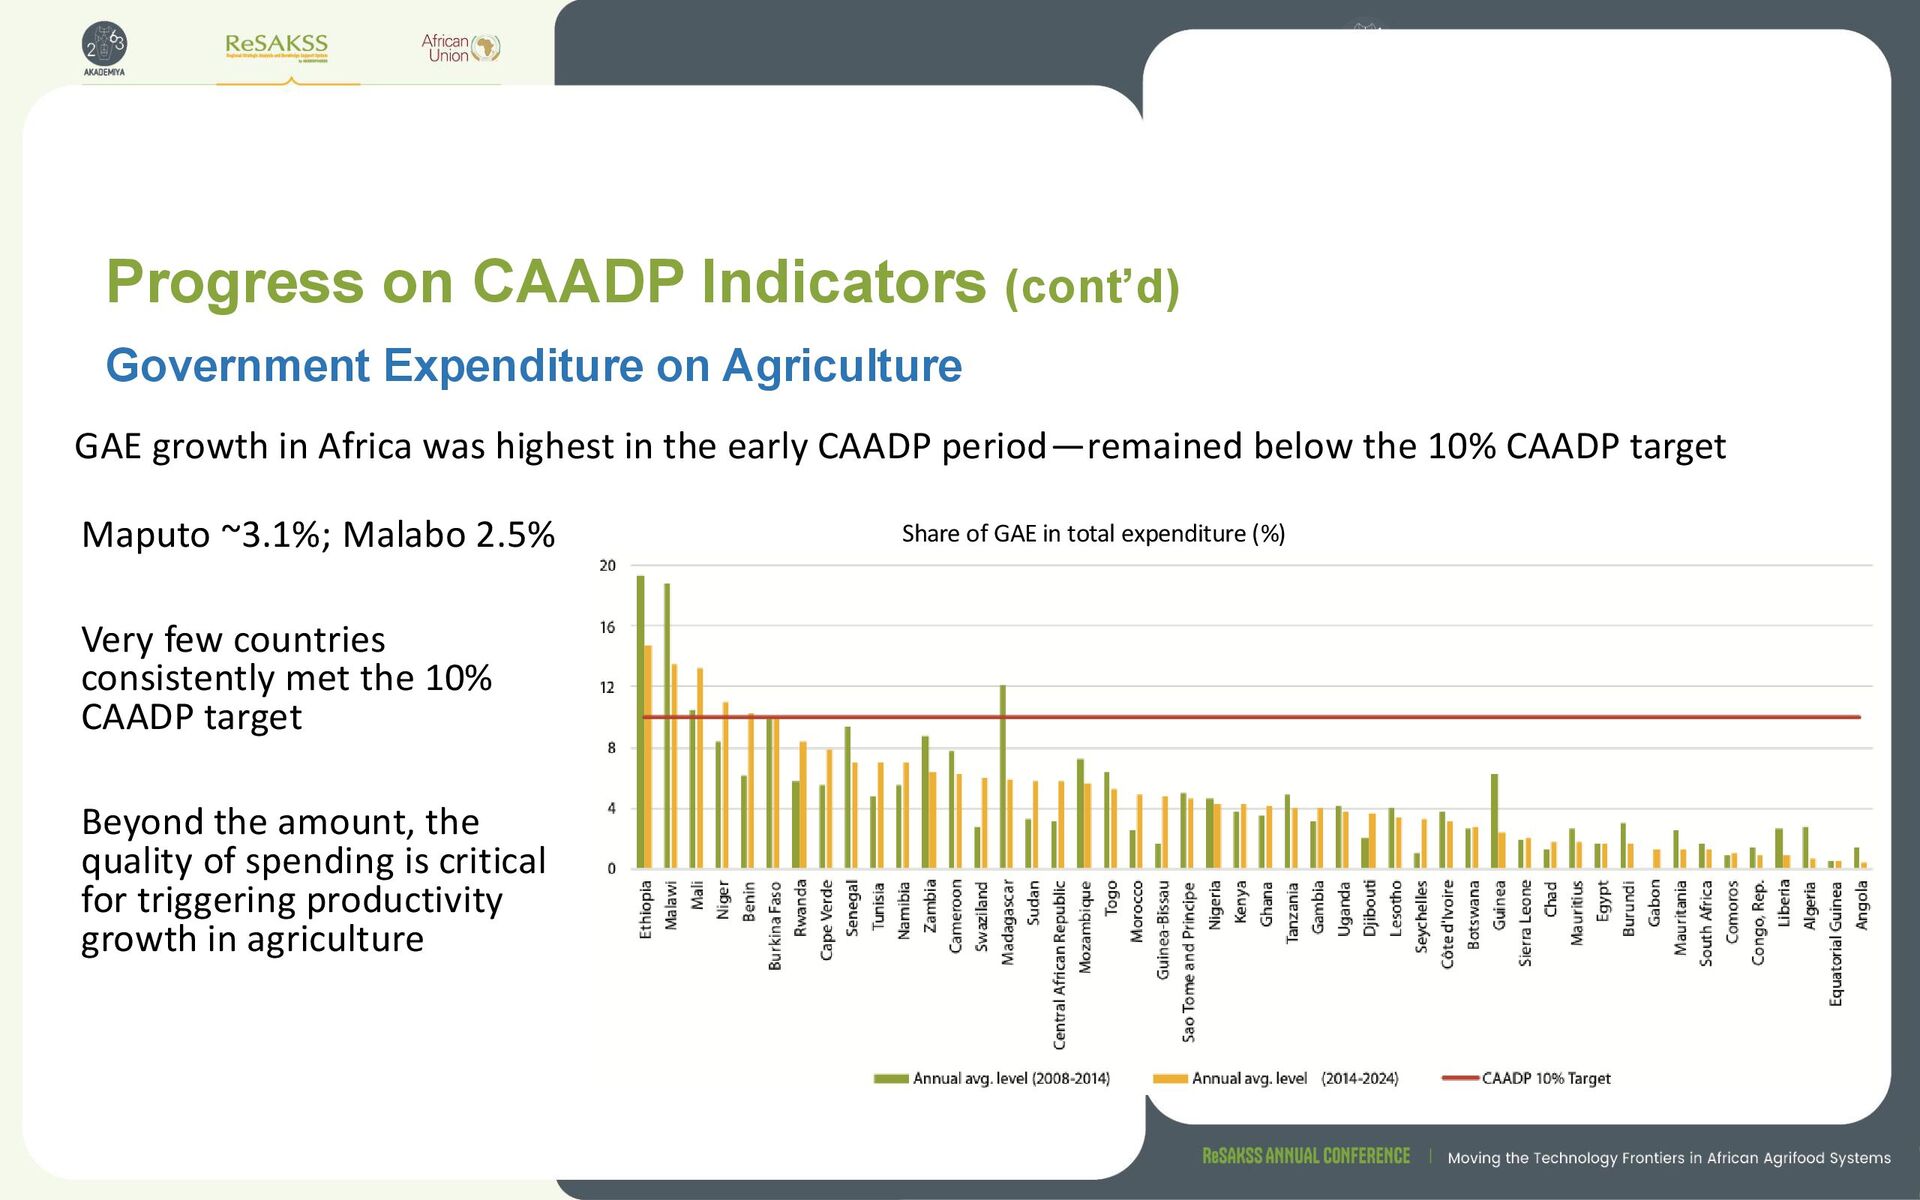
highest in the early CAADP period—remained below the 10% CAADP target Government Expenditure on Agriculture Maputo ~3.1%; Malabo 2.5% Very few countries consistently met the 10% CAADP target Beyond the amount, the quality of spending is critical for triggering productivity growth in agriculture Share of GAE in total expenditure (%)
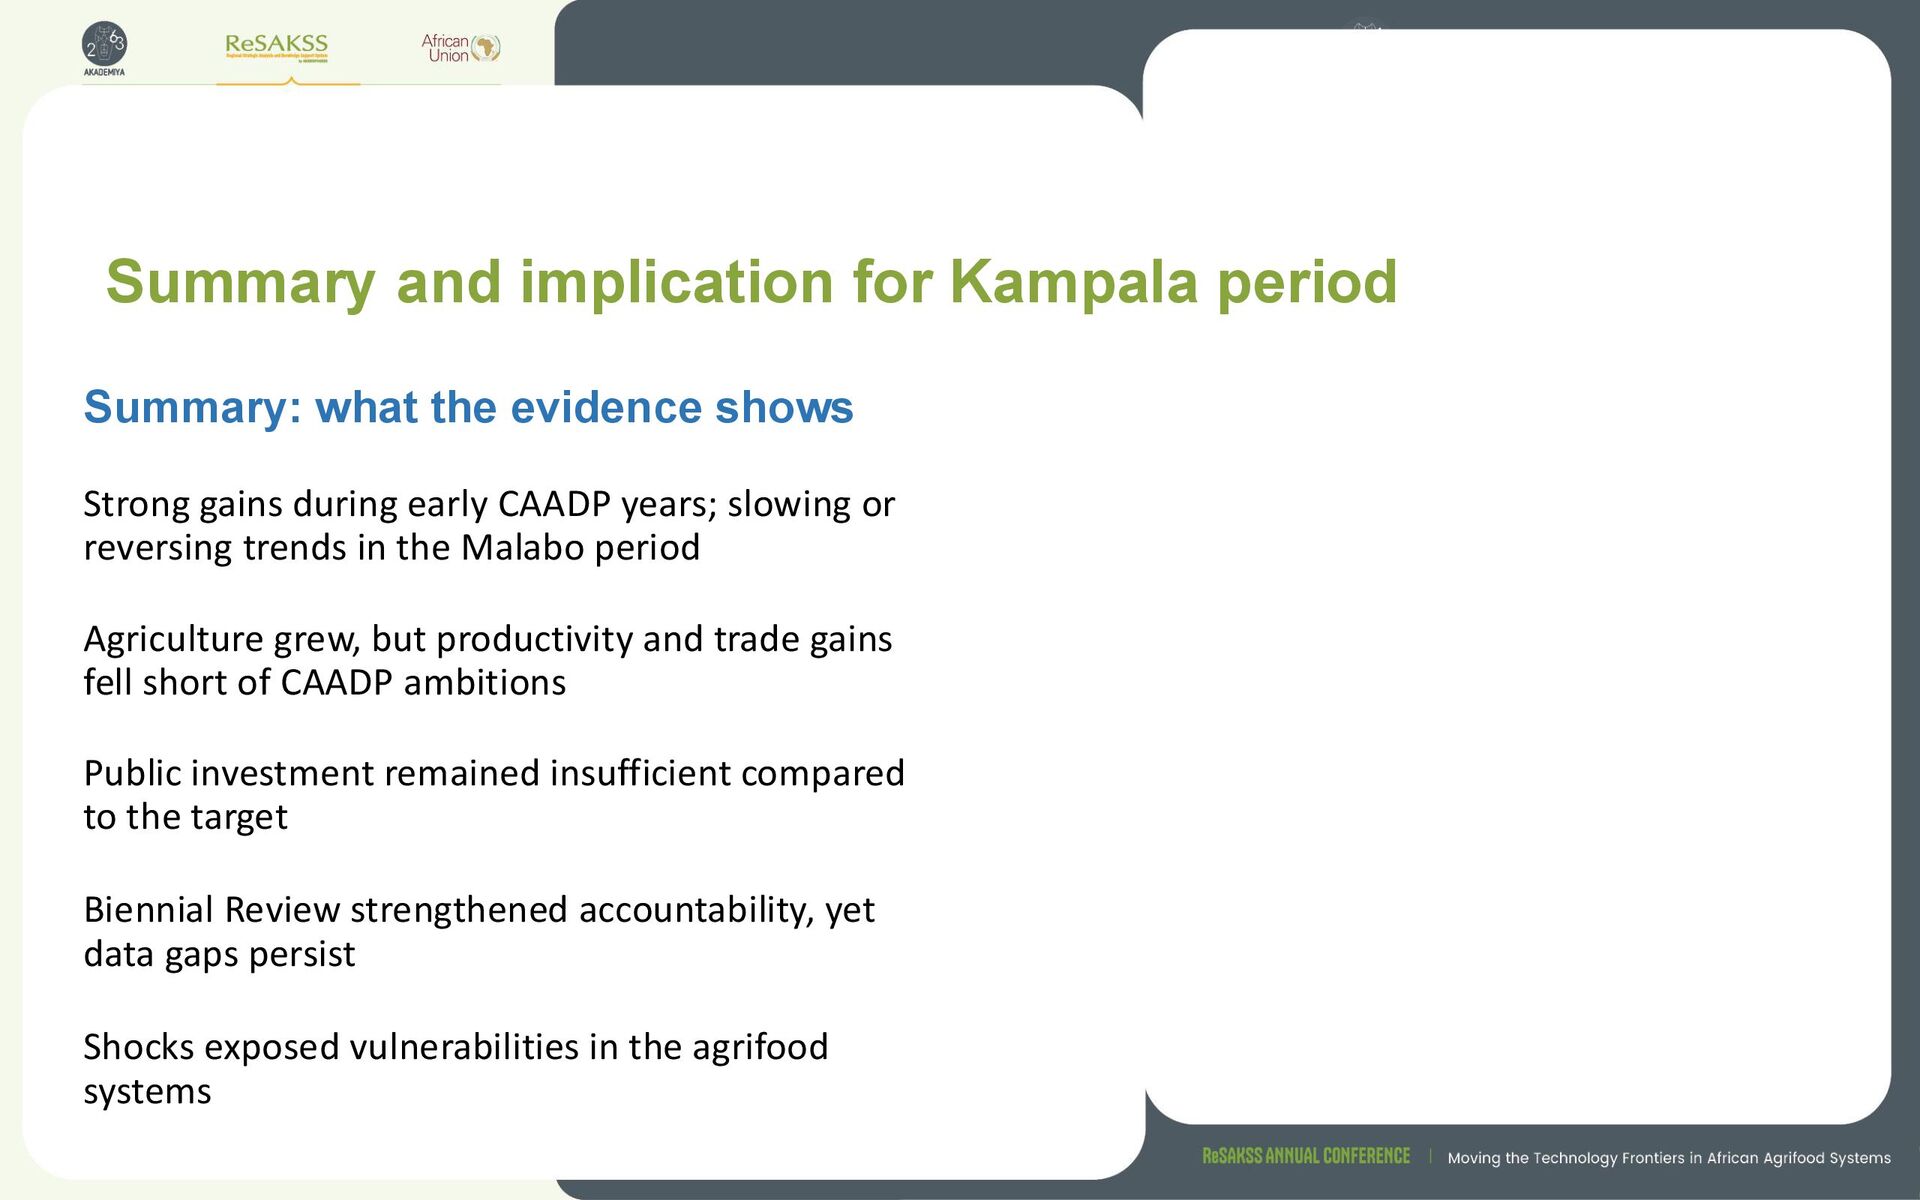
CAADP years; slowing or reversing trends in the Malabo period Agriculture grew, but productivity and trade gains fell short of CAADP ambitions Public investment remained insufficient compared to the target Biennial Review strengthened accountability, yet data gaps persist Shocks exposed vulnerabilities in the agrifood systems Summary: what the evidence shows
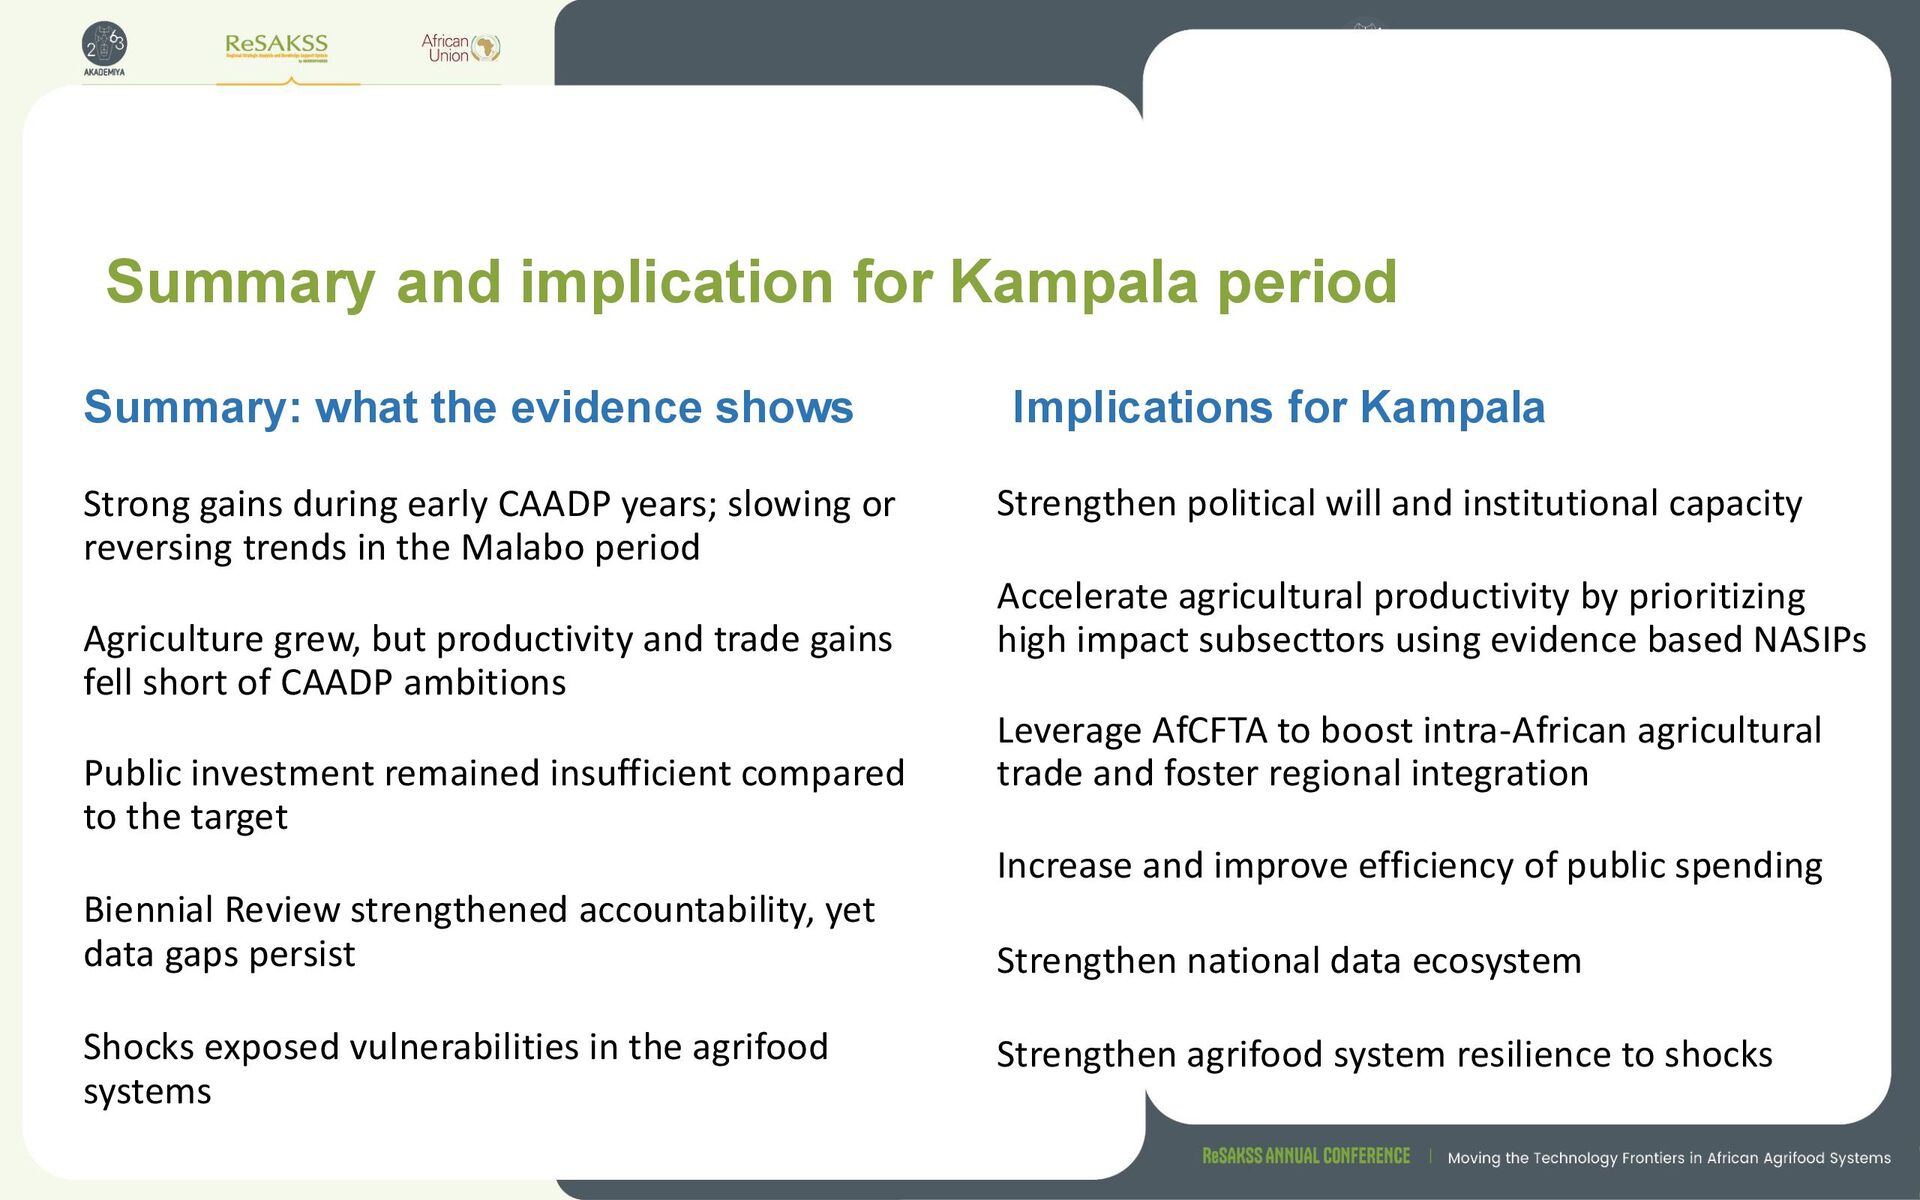
CAADP years; slowing or reversing trends in the Malabo period Agriculture grew, but productivity and trade gains fell short of CAADP ambitions Public investment remained insufficient compared to the target Biennial Review strengthened accountability, yet data gaps persist Shocks exposed vulnerabilities in the agrifood systems Summary: what the evidence shows Implications for Kampala Strengthen political will and institutional capacity Accelerate agricultural productivity by prioritizing high impact subsecttors using evidence based NASIPs Leverage AfCFTA to boost intra-African agricultural trade and foster regional integration Increase and improve efficiency of public spending Strengthen national data ecosystem Strengthen agrifood system resilience to shocks