Share
Embed
Transcript
20 slides
-
$who am i • ID : bananaapple • 學校科系 :
交通大學網工所 • 年級 : 一年級 • Email: [email protected] 2 -
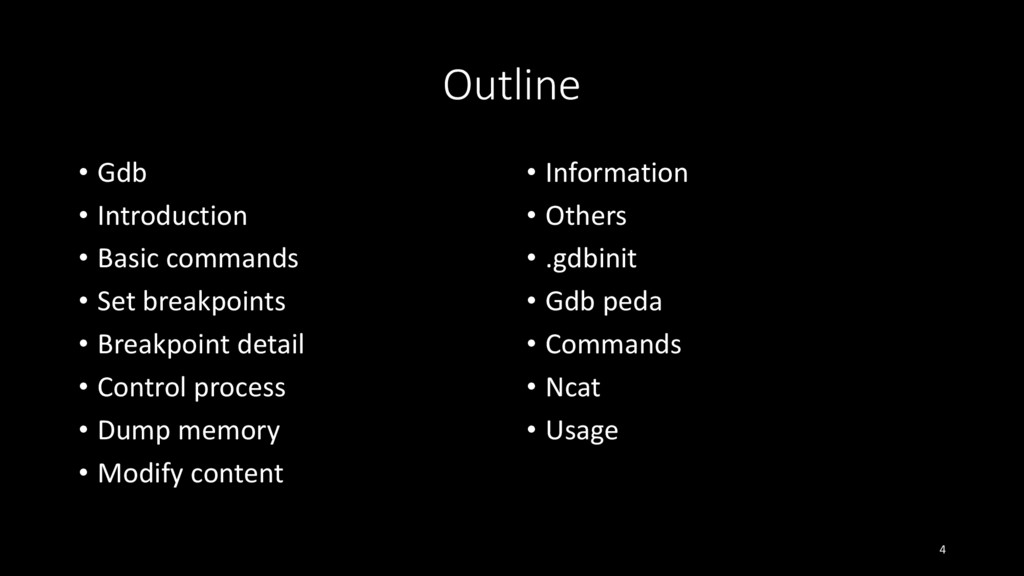
Outline • Gdb • Introduction • Basic commands • Set
breakpoints • Breakpoint detail • Control process • Dump memory • Modify content • Information • Others • .gdbinit • Gdb peda • Commands • Ncat • Usage 4 -
Gdb • Official website: https://www.gnu.org/software/gdb/ • GDB: The GNU Project
Debugger • Command-line based debugger 5 -
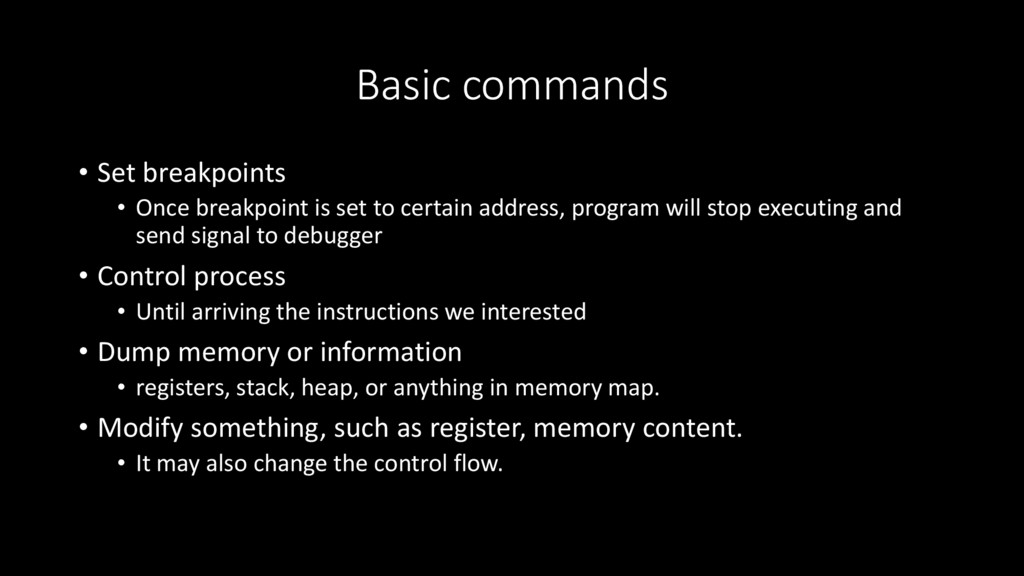
Basic commands • Set breakpoints • Once breakpoint is set
to certain address, program will stop executing and send signal to debugger • Control process • Until arriving the instructions we interested • Dump memory or information • registers, stack, heap, or anything in memory map. • Modify something, such as register, memory content. • It may also change the control flow. -
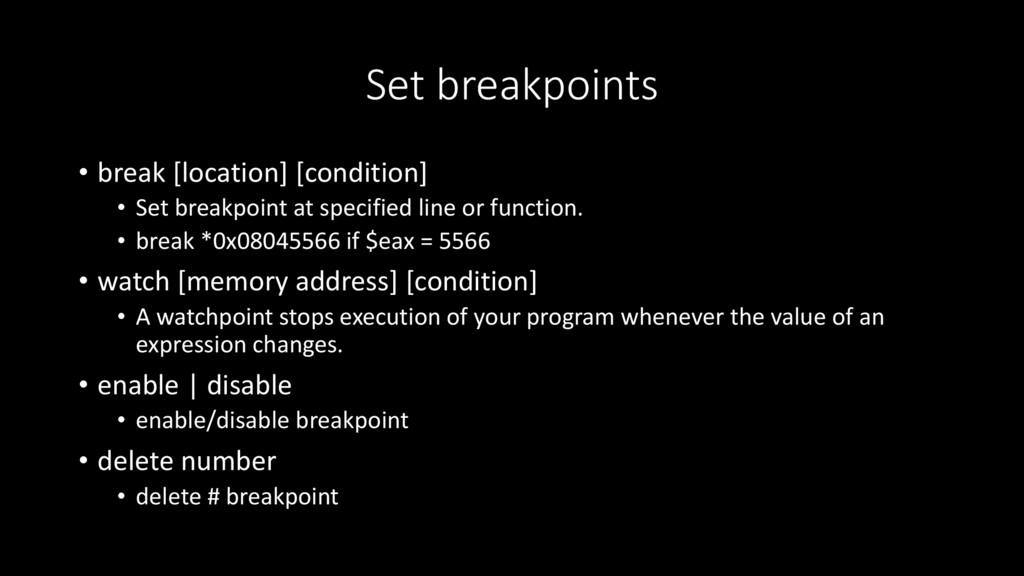
Set breakpoints • break [location] [condition] • Set breakpoint at
specified line or function. • break *0x08045566 if $eax = 5566 • watch [memory address] [condition] • A watchpoint stops execution of your program whenever the value of an expression changes. • enable | disable • enable/disable breakpoint • delete number • delete # breakpoint -
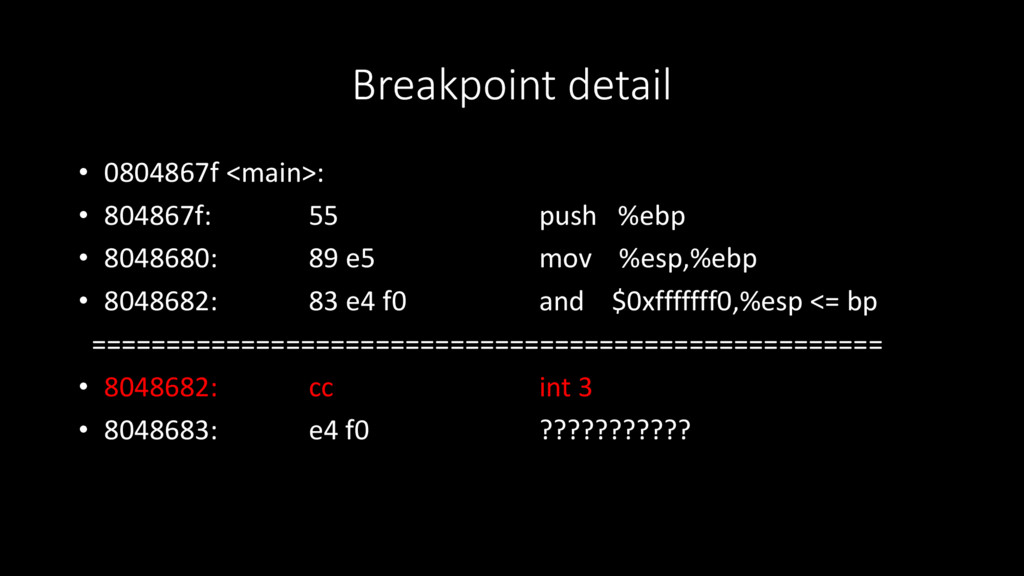
Breakpoint detail • 0804867f <main>: • 804867f: 55 push %ebp
• 8048680: 89 e5 mov %esp,%ebp • 8048682: 83 e4 f0 and $0xfffffff0,%esp <= bp ===================================================== • 8048682: cc int 3 • 8048683: e4 f0 ??????????? -
Control process • run • Start debugged program. • continue
• Continue program being debugged, after signal or breakpoint. • nexti • Next instruction. • stepi • Next instruction, but step into the function. • finish • run until return -
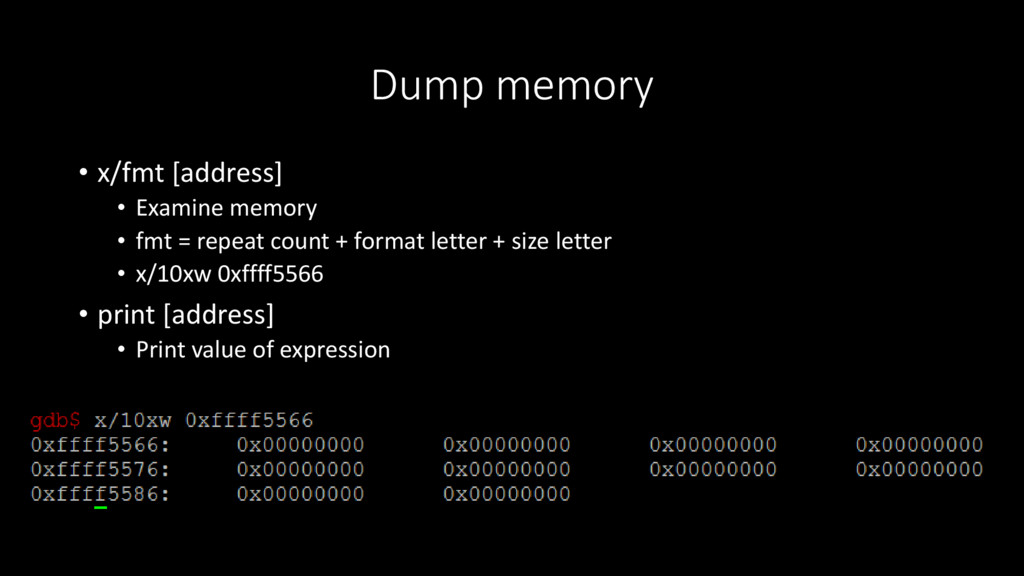
Dump memory • x/fmt [address] • Examine memory • fmt
= repeat count + format letter + size letter • x/10xw 0xffff5566 • print [address] • Print value of expression -
Modify content • set [address]=[value] • Evaluate expression EXP and
assign result to variable VAR, using assignment syntax appropriate for the current language • set $eax=5566 • set *0xffff5566 = 5566 • set can be used to configure some gdb options. • set follow-fork-mode parent|child • set disassembly-flavor att|intel -
Information • info registers – register information • info stack
– call flow • info breakpoint – breakpoint information • info args/local – display variable (with debug info) • info proc map – display memory region -
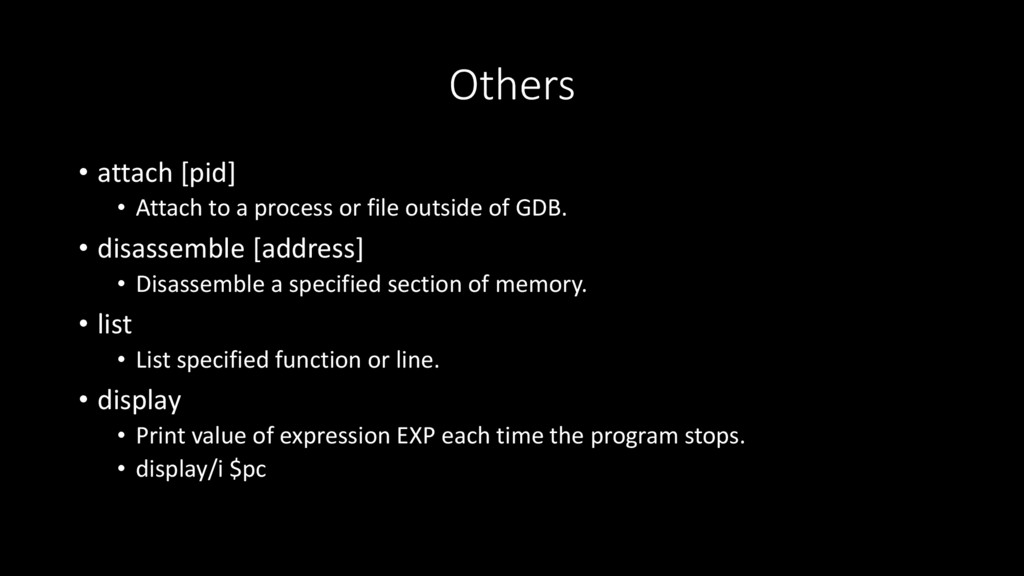
Others • attach [pid] • Attach to a process or
file outside of GDB. • disassemble [address] • Disassemble a specified section of memory. • list • List specified function or line. • display • Print value of expression EXP each time the program stops. • display/i $pc -
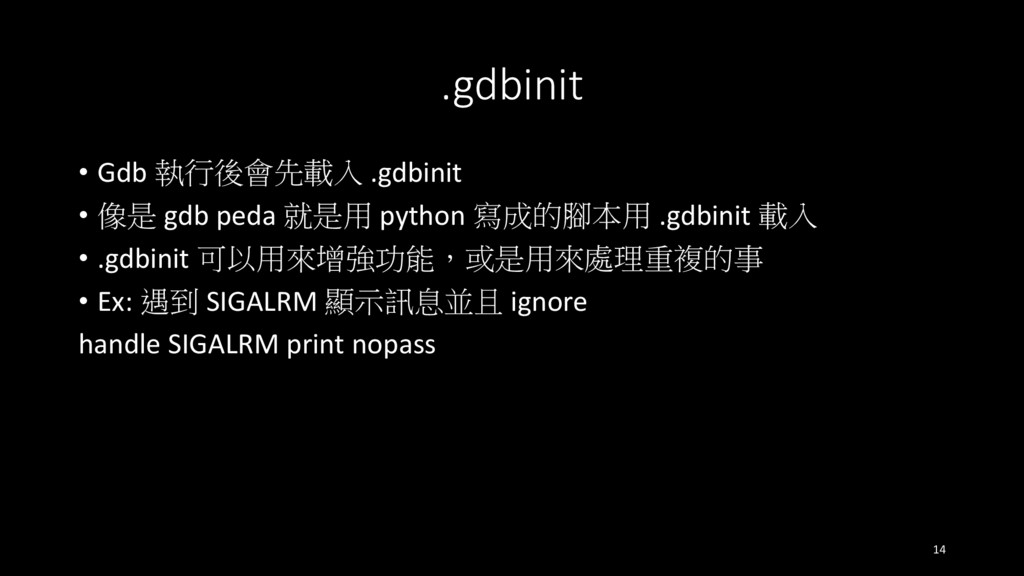
.gdbinit • Gdb 執行後會先載入 .gdbinit • 像是 gdb peda 就是用
python 寫成的腳本用 .gdbinit 載入 • .gdbinit 可以用來增強功能,或是用來處理重複的事 • Ex: 遇到 SIGALRM 顯示訊息並且 ignore handle SIGALRM print nopass 14 -
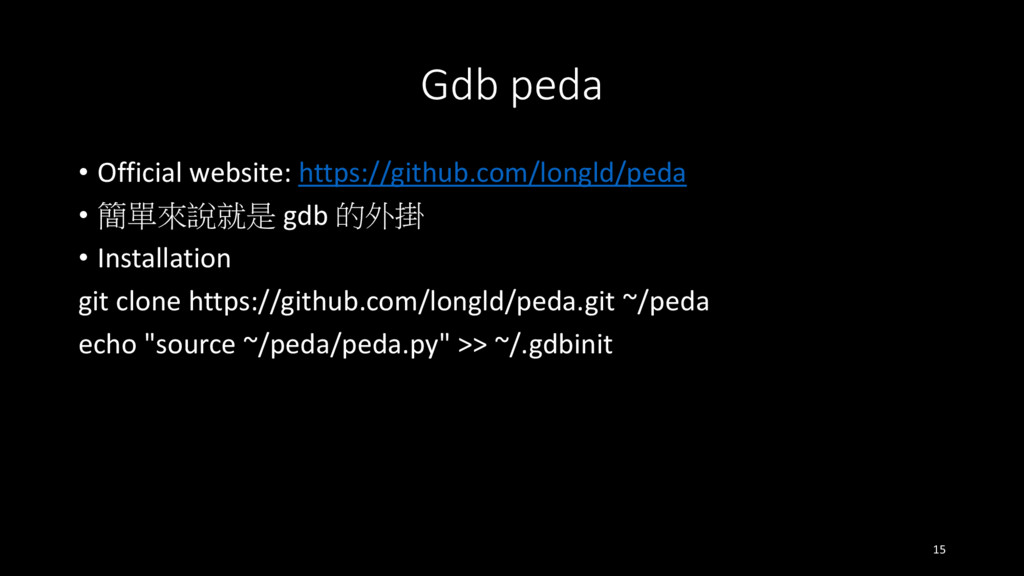
Gdb peda • Official website: https://github.com/longld/peda • 簡單來說就是 gdb 的外掛
• Installation git clone https://github.com/longld/peda.git ~/peda echo "source ~/peda/peda.py" >> ~/.gdbinit 15 -
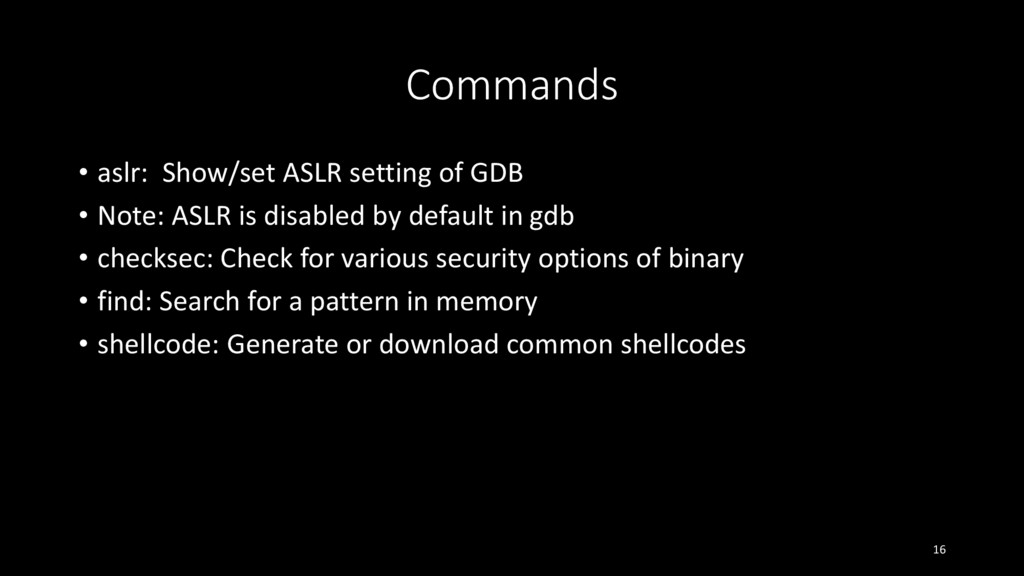
Commands • aslr: Show/set ASLR setting of GDB • Note:
ASLR is disabled by default in gdb • checksec: Check for various security options of binary • find: Search for a pattern in memory • shellcode: Generate or download common shellcodes 16 -
Ncat • Official website: https://nmap.org/ncat/ • Ncat is a feature-packed
networking utility • Installation sudo apt-get install nmap 17 -
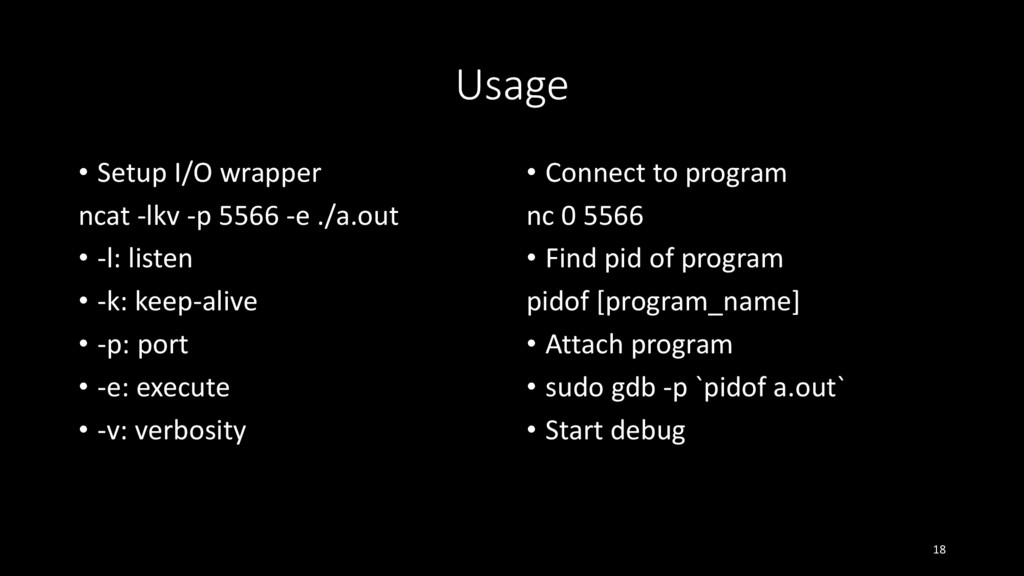
Usage • Setup I/O wrapper ncat -lkv -p 5566 -e
./a.out • -l: listen • -k: keep-alive • -p: port • -e: execute • -v: verbosity • Connect to program nc 0 5566 • Find pid of program pidof [program_name] • Attach program • sudo gdb -p `pidof a.out` • Start debug 18 -
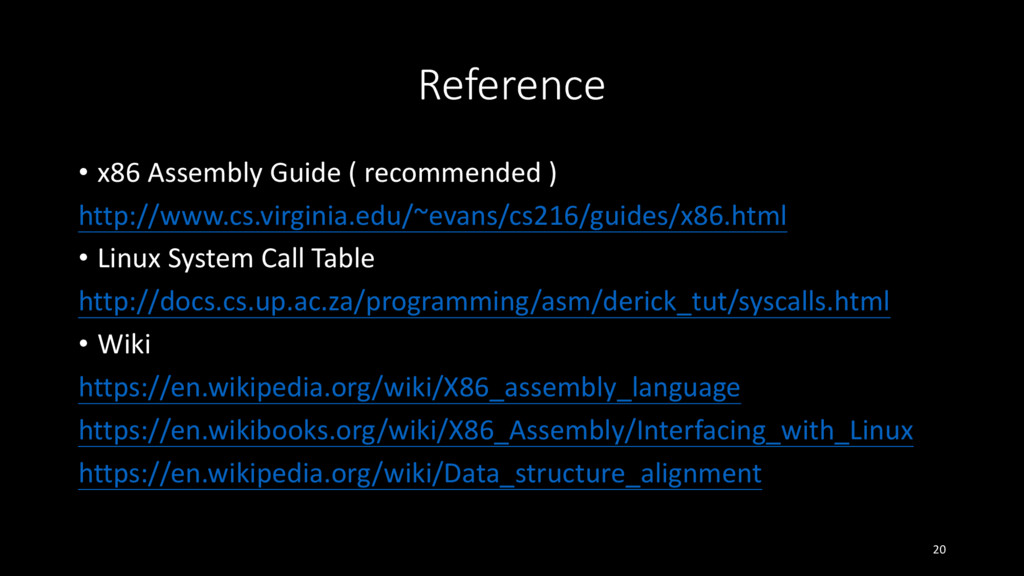
Reference • x86 Assembly Guide ( recommended ) http://www.cs.virginia.edu/~evans/cs216/guides/x86.html •
Linux System Call Table http://docs.cs.up.ac.za/programming/asm/derick_tut/syscalls.html • Wiki https://en.wikipedia.org/wiki/X86_assembly_language https://en.wikibooks.org/wiki/X86_Assembly/Interfacing_with_Linux https://en.wikipedia.org/wiki/Data_structure_alignment 20