Share
Embed
How to operationalize large-scale aerial biodiversity monitoring?
Talk at TDWG 2026 in Oslo, Norway - September 24, 2026.
Peter Desmet
September 24, 2026
Transcript
14 slides
-
How to operationalize large-scale aerial biodiversity monitoring? Photo by Daniele
Franchi - Unsplash license Peter Desmet (INBO, Belgium) Pieter Huybrechts, Bart Kranstauber, Cecilia Nilsson -
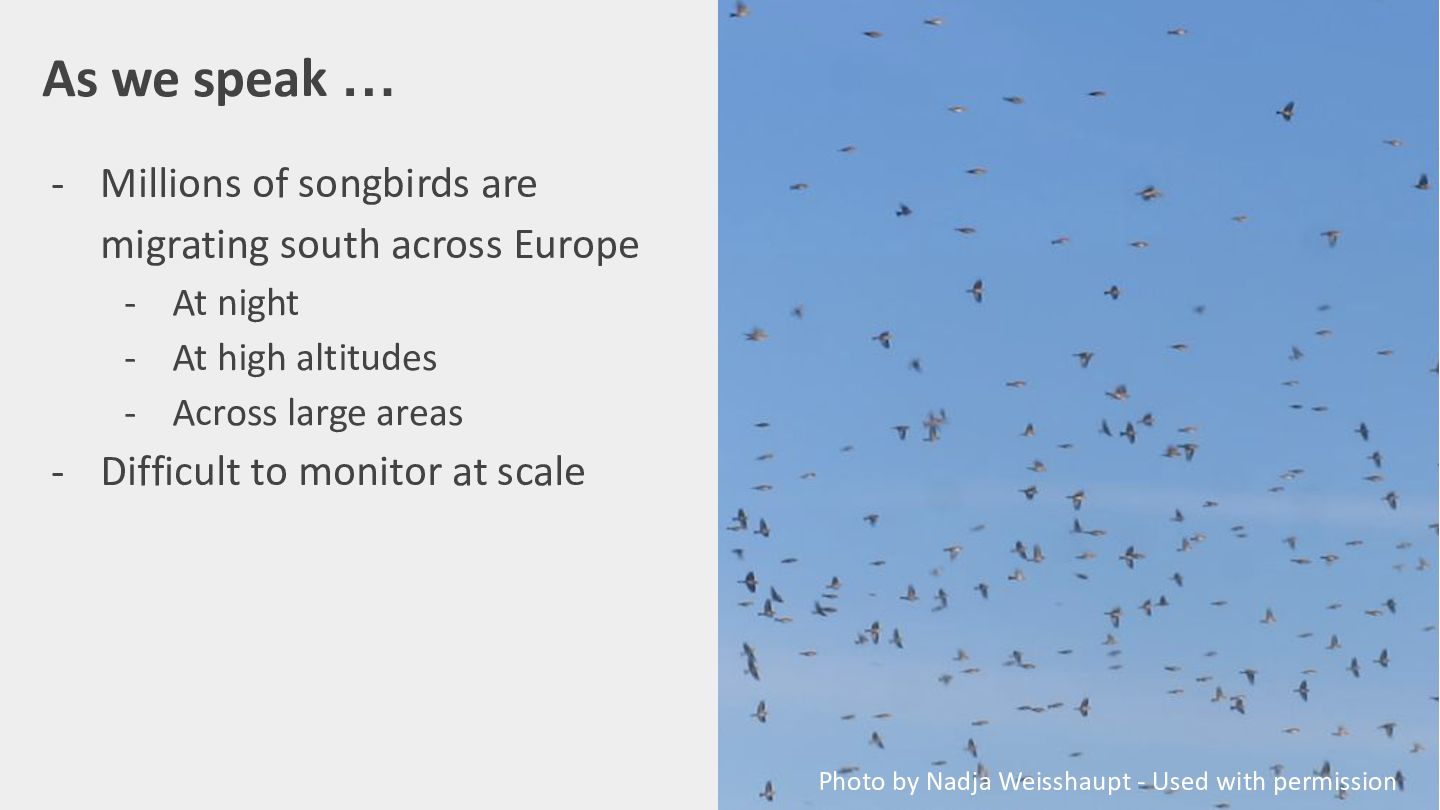
As we speak … - Millions of songbirds are migrating
south across Europe - At night - At high altitudes - Across large areas - Difficult to monitor at scale Photo by Nadja Weisshaupt - Used with permission -
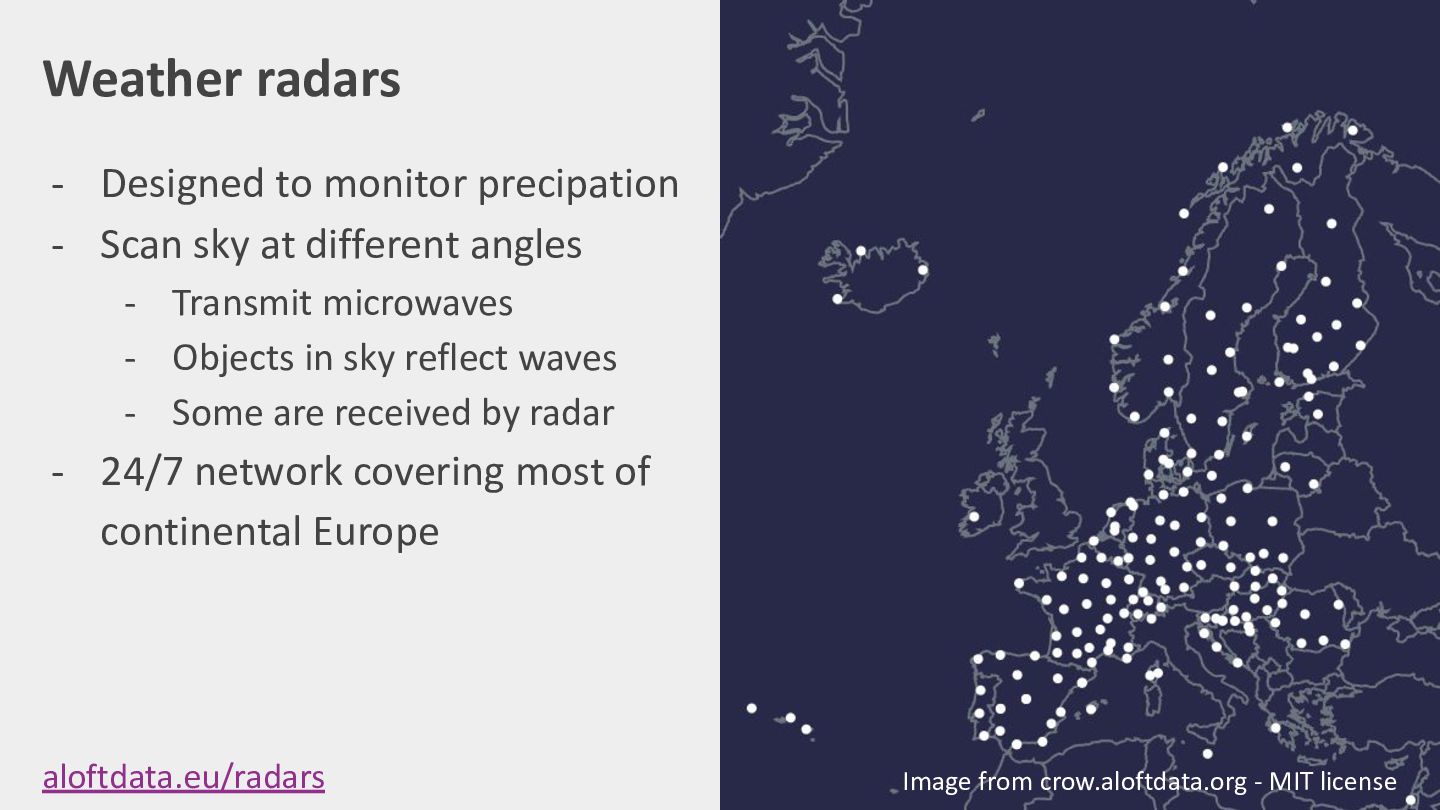
Weather radars - Designed to monitor precipation - Scan sky
at different angles - Transmit microwaves - Objects in sky reflect waves - Some are received by radar - 24/7 network covering most of continental Europe aloftdata.eu/radars Image from crow.aloftdata.org - MIT license -
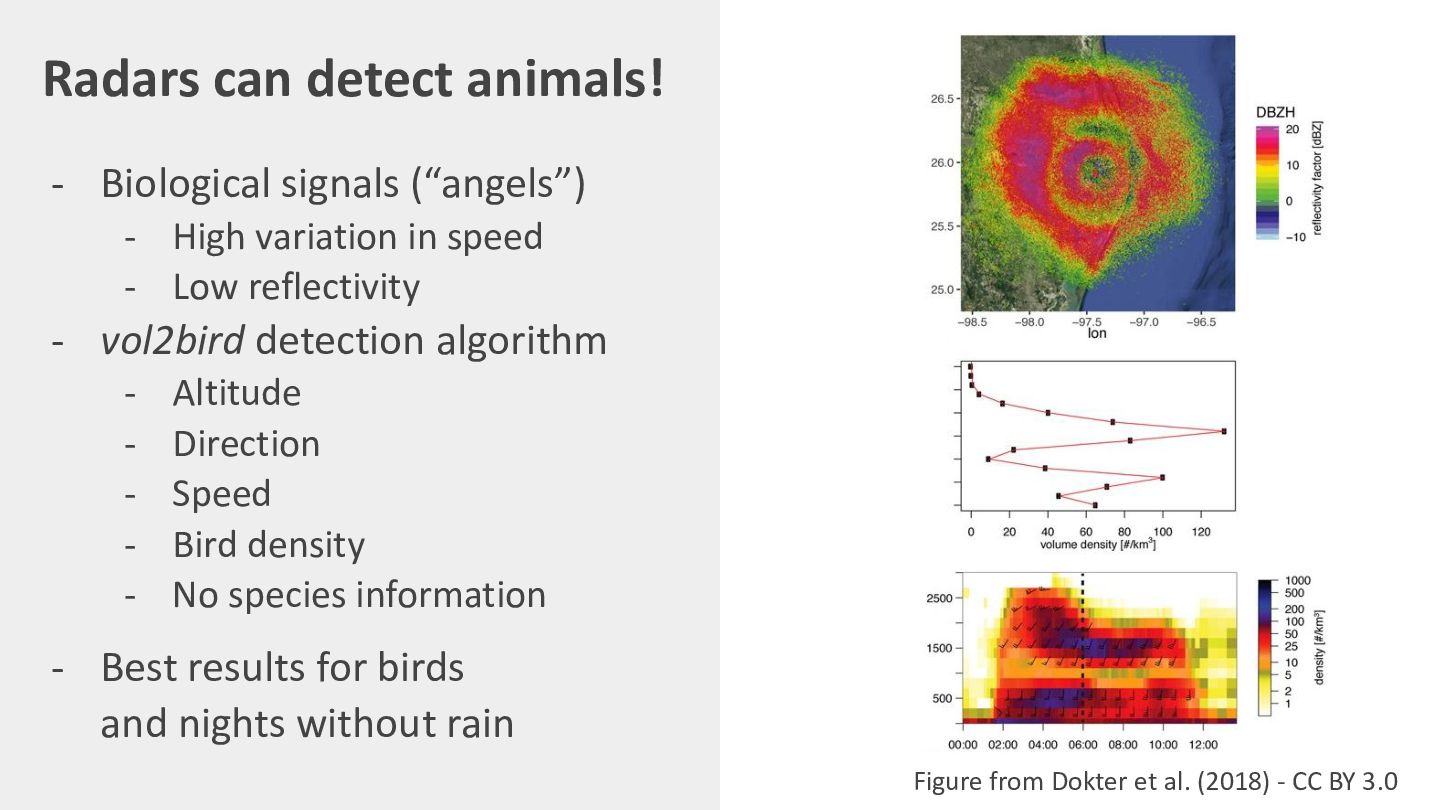
Radars can detect animals! - Biological signals (“angels”) - High
variation in speed - Low reflectivity - vol2bird detection algorithm - Altitude Direction Speed Bird density No species information - Best results for birds and nights without rain Figure from Dokter et al. (2018) - CC BY 3.0 -
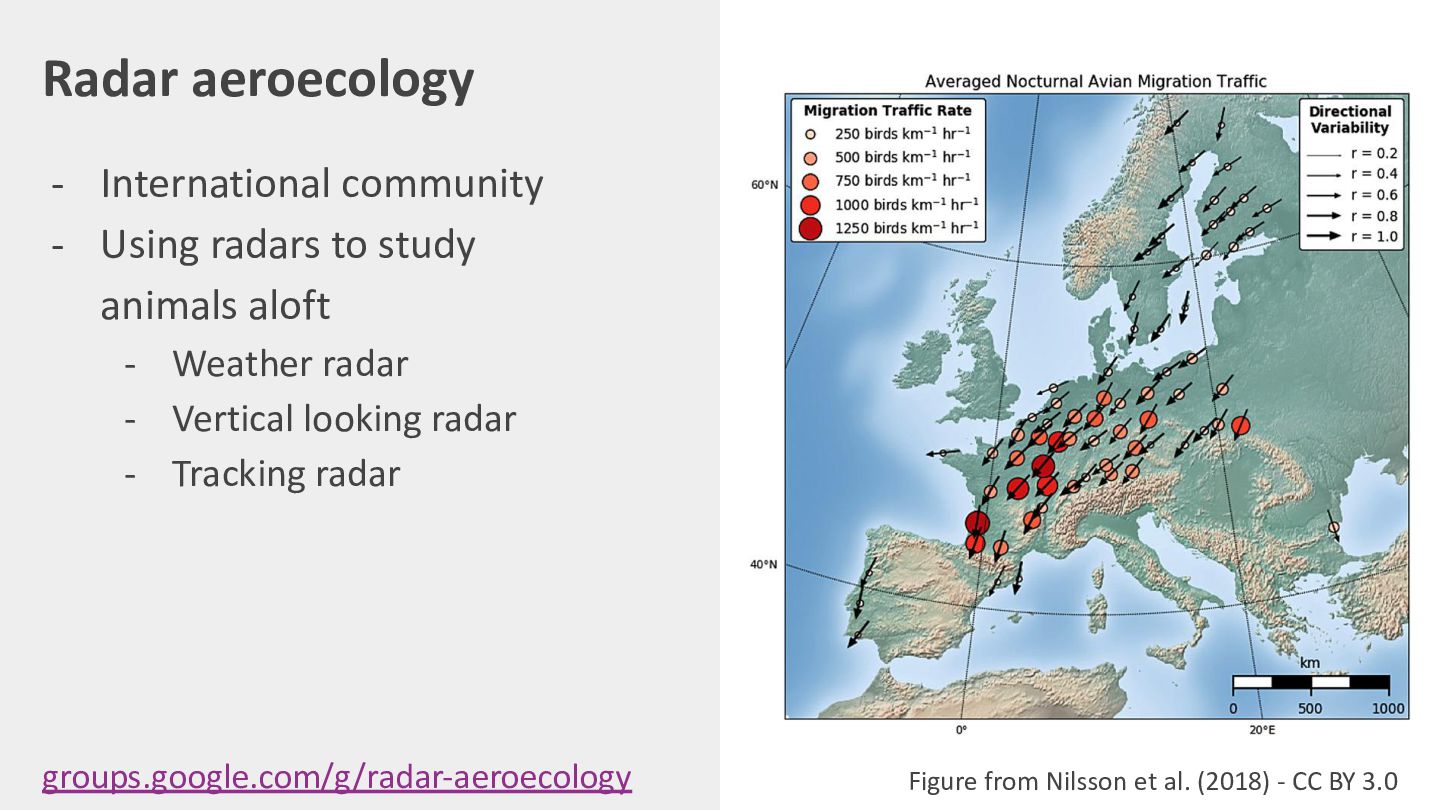
Radar aeroecology - International community - Using radars to study
animals aloft - Weather radar - Vertical looking radar - Tracking radar groups.google.com/g/radar-aeroecology Photo by Bart Hoekstra - Used with permission -
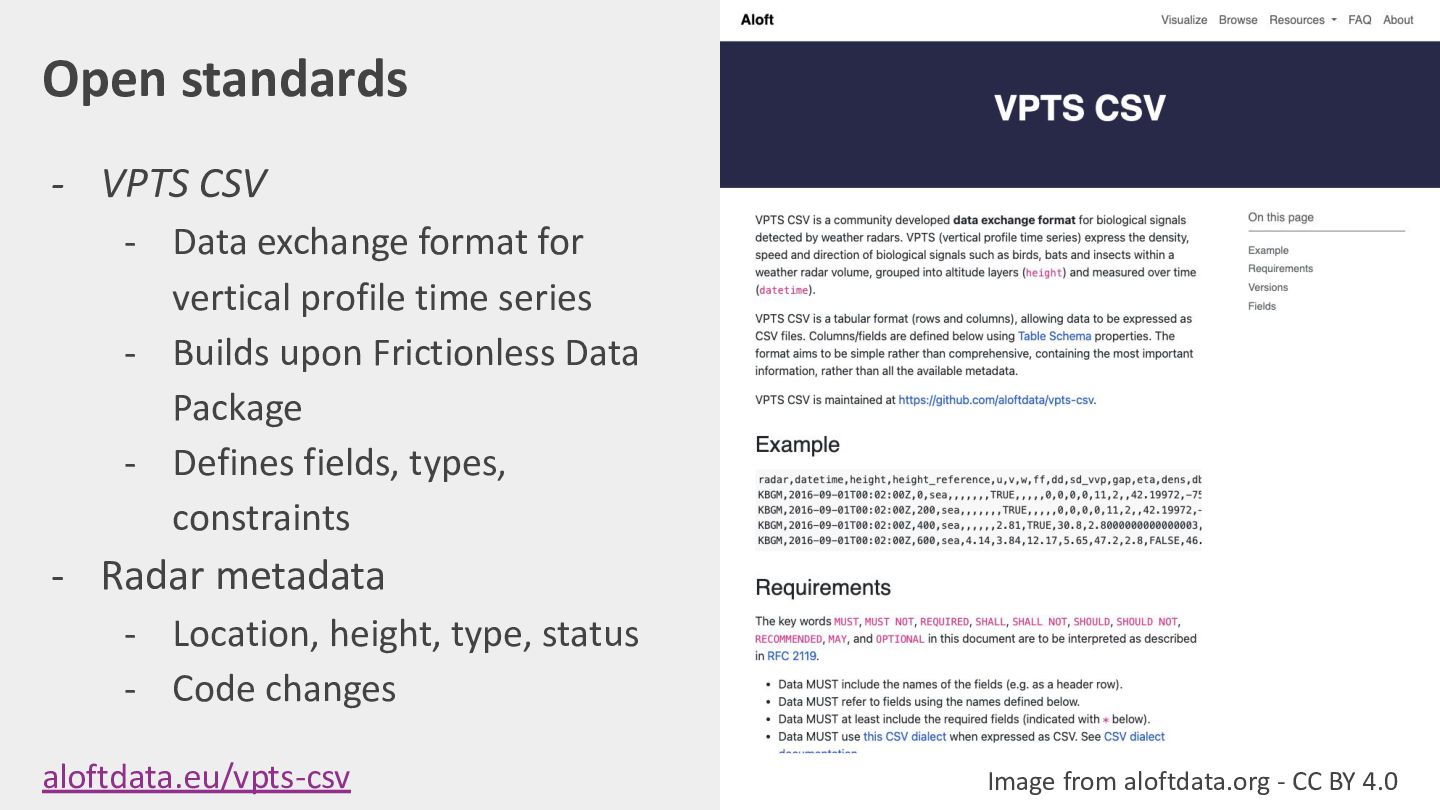
Open standards - VPTS CSV - Data exchange format for
vertical profile time series - Builds upon Frictionless Data Package - Defines fields, types, constraints - Radar metadata - Location, height, type, status - Code changes aloftdata.eu/vpts-csv Image from aloftdata.org - CC BY 4.0 -
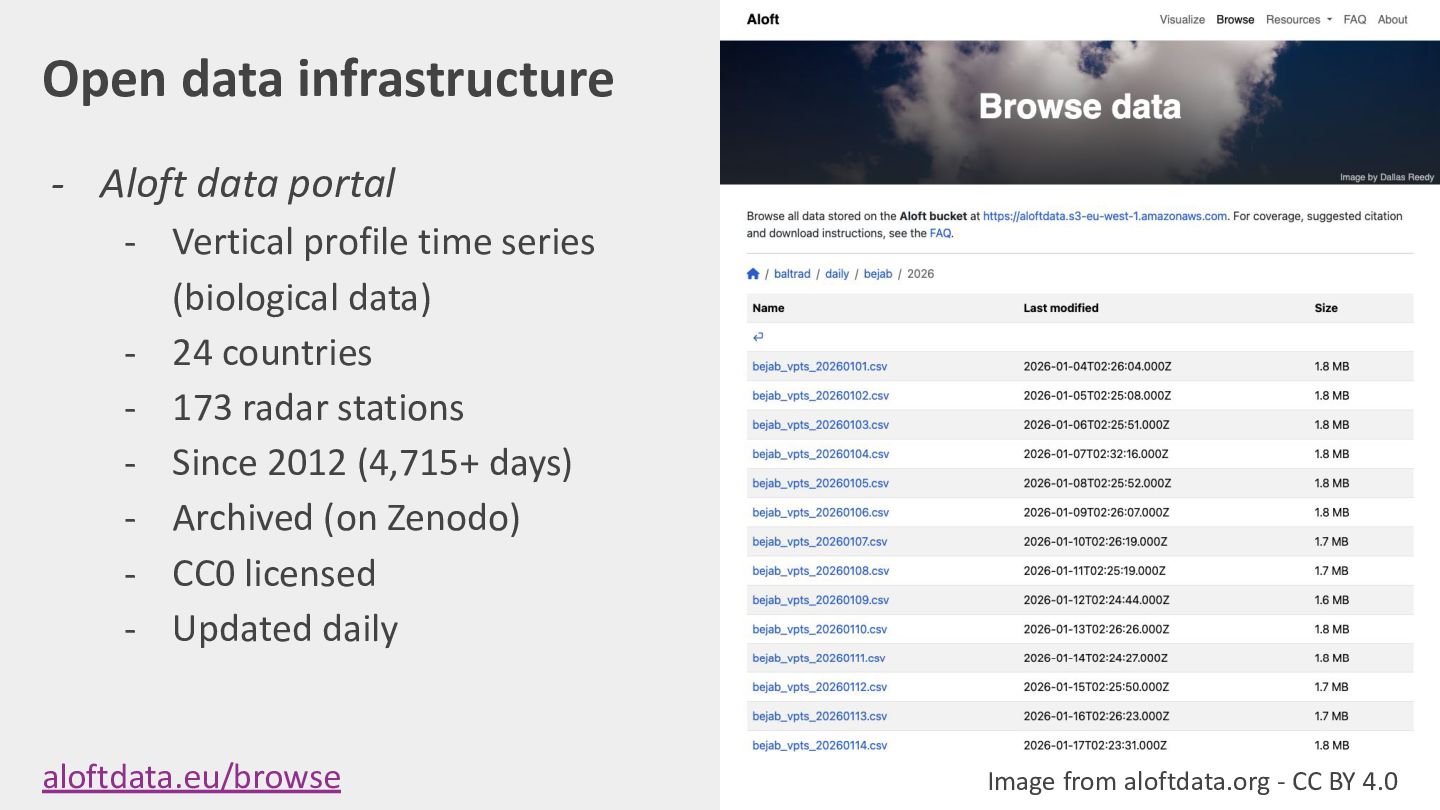
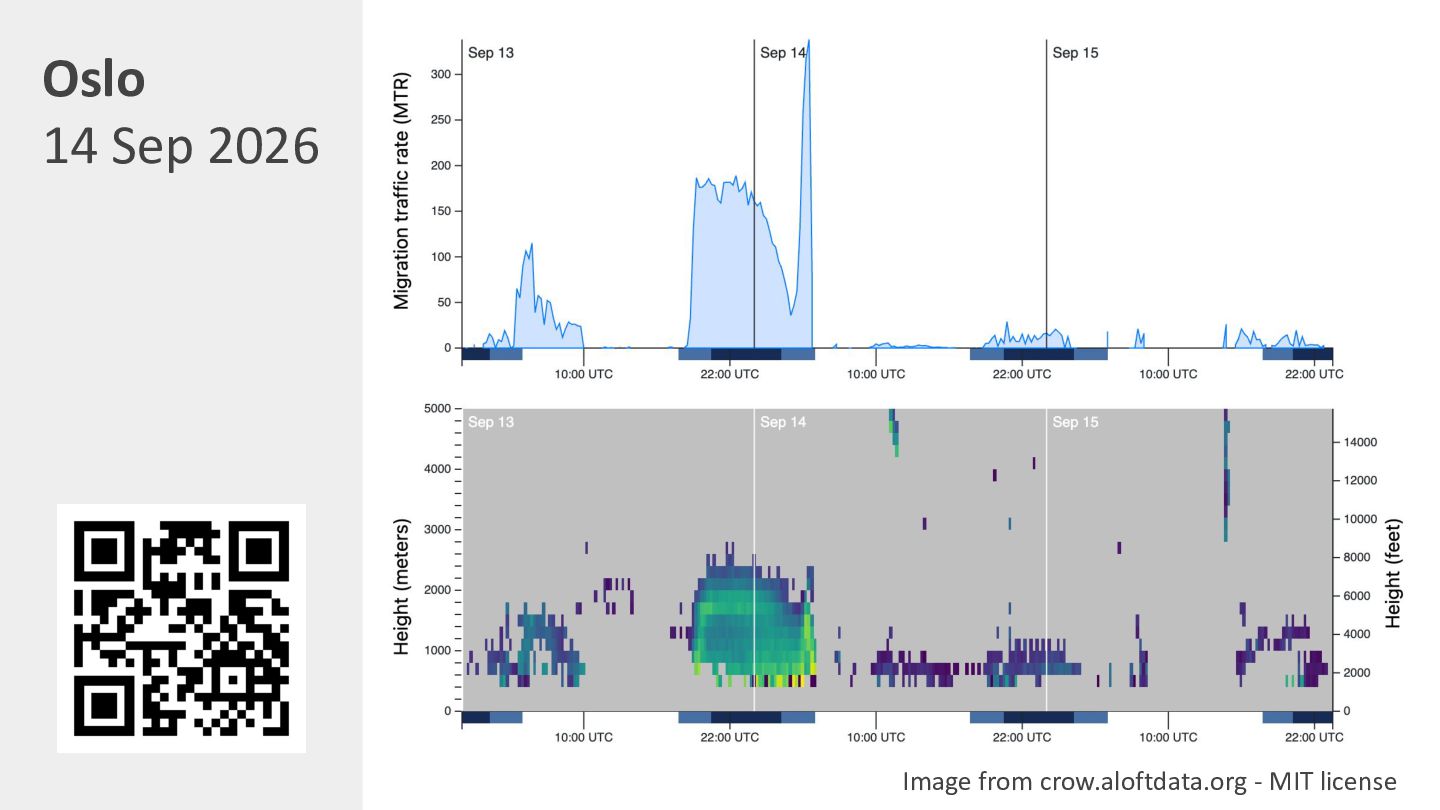
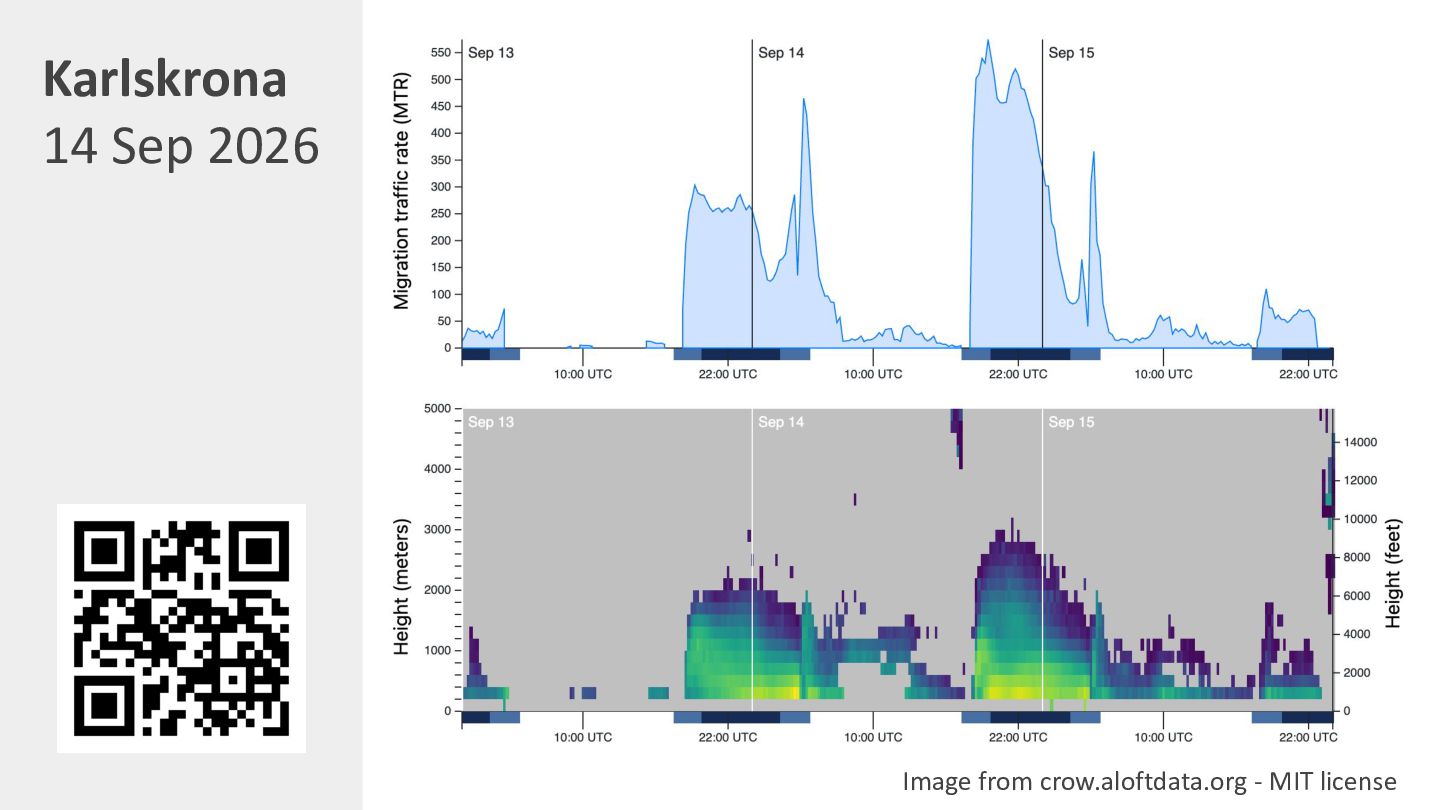
Open data infrastructure - Aloft data portal - Vertical profile
time series (biological data) - 24 countries - 173 radar stations - Since 2012 (4,715+ days) - Archived on Zenodo - CC0 licensed - Updated daily aloftdata.eu/browse / Desmet et al. (2025) Image from aloftdata.org - CC BY 4.0 -
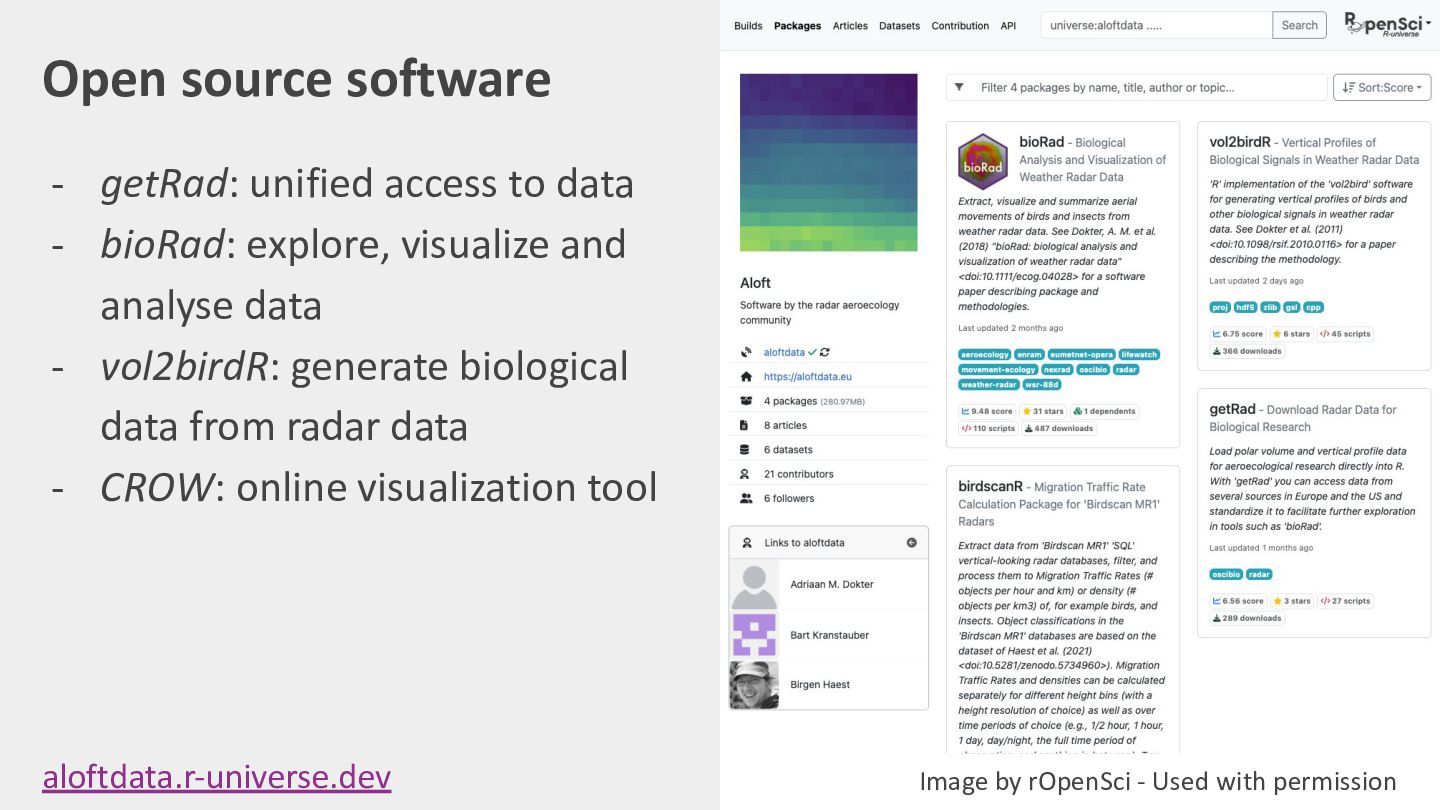
Open source software - getRad: unified access to data -
bioRad: explore, visualize and analyse data - vol2birdR: generate biological data from radar data - CROW: online visualization tool aloftdata.r-universe.dev Image by rOpenSci - Used with permission -
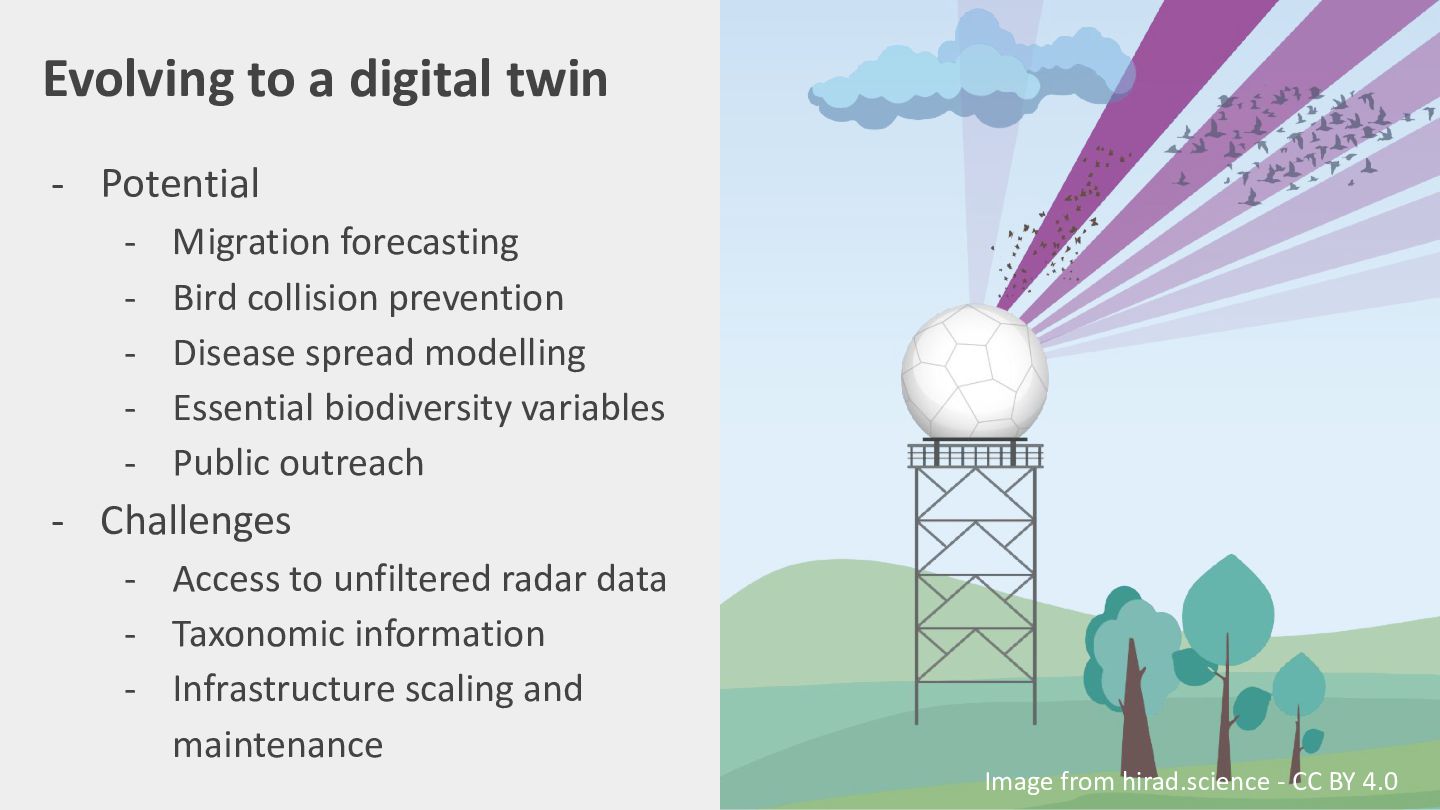
Evolving to a digital twin - Potential - Migration forecasting
Bird collision prevention Disease spread modelling Essential biodiversity variables Public outreach - Challenges - Access to unfiltered radar data - Taxonomic information - Infrastructure scaling and maintenance Image from hirad.science - CC BY 4.0 -
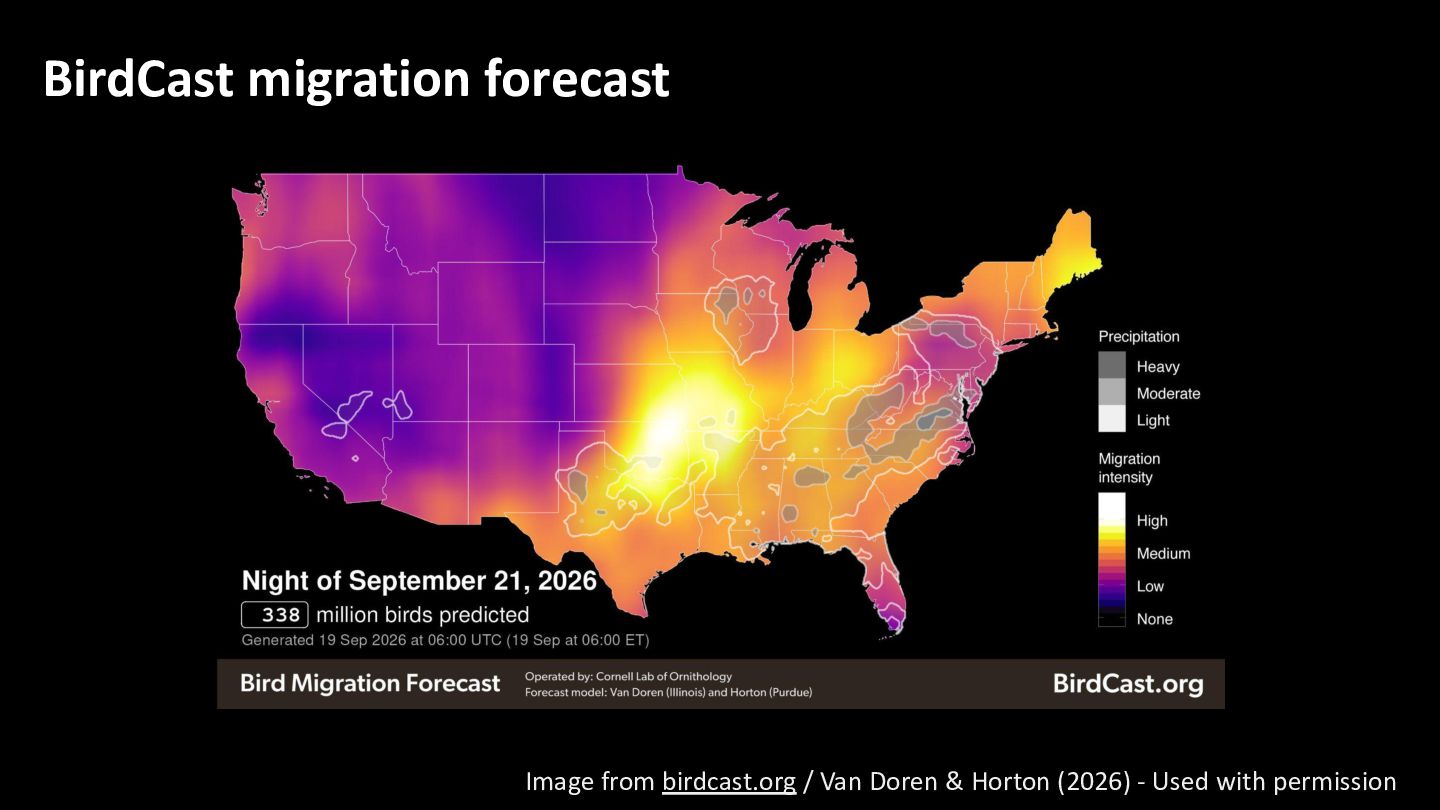
BirdCast migration forecast Image from birdcast.org / Van Doren &
Horton (2026) - Used with permission -
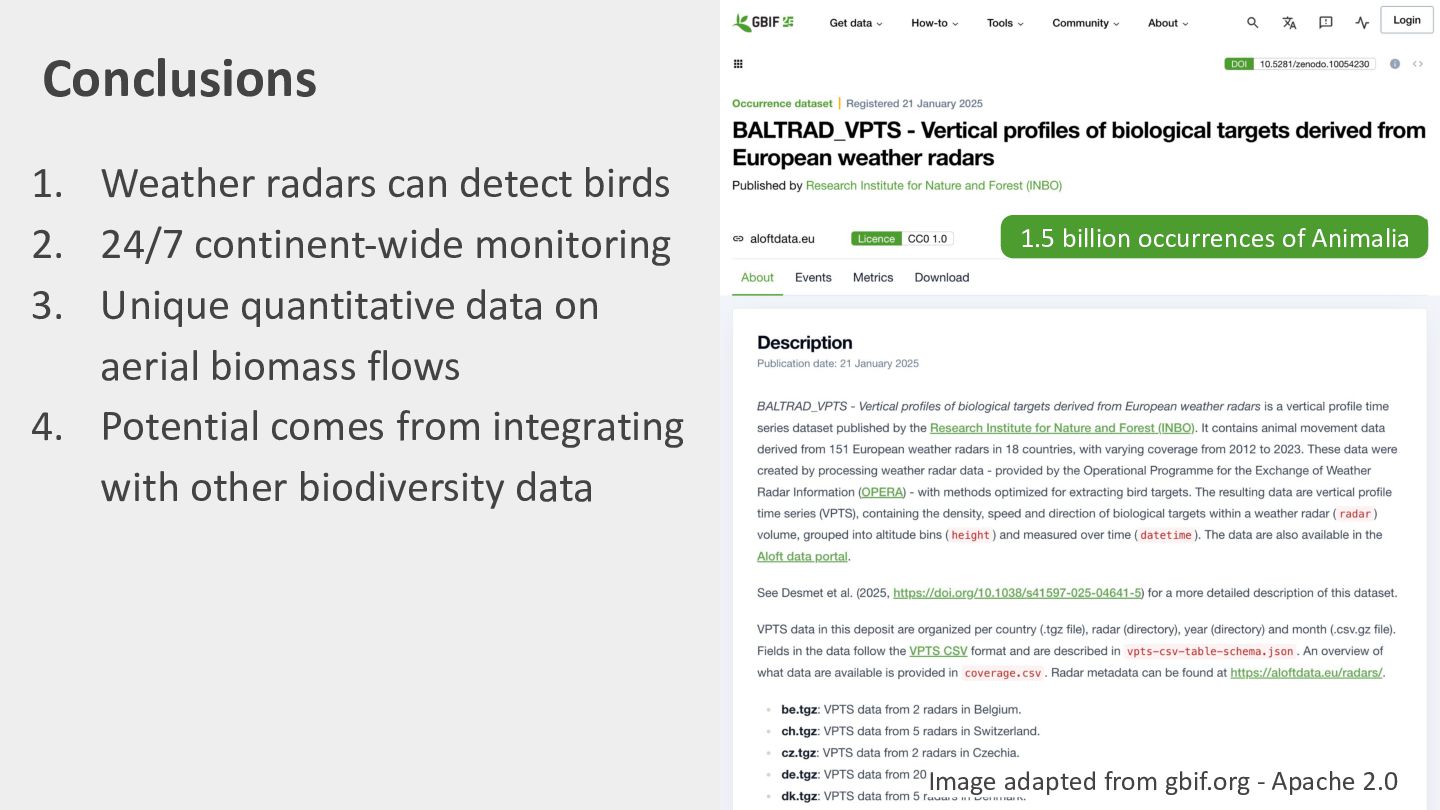
Conclusions 1. Weather radars can detect birds 2. 24/7 continent-wide
monitoring 3. Unique quantitative data on aerial biomass flows 4. Potential comes from integrating with other biodiversity data 1.5 billion occurrences of Animalia? Image adapted from gbif.org - Apache 2.0 -
Thank you! - More at aloftdata.eu - Presentation bit.ly/tdwg-aloft -
This work is funded through the 2022-2023 Biodiversa+ BiodivMon call and BELSPO as part of the HiRAD project (hirad.science). Photo by Daniele Franchi - Unsplash license