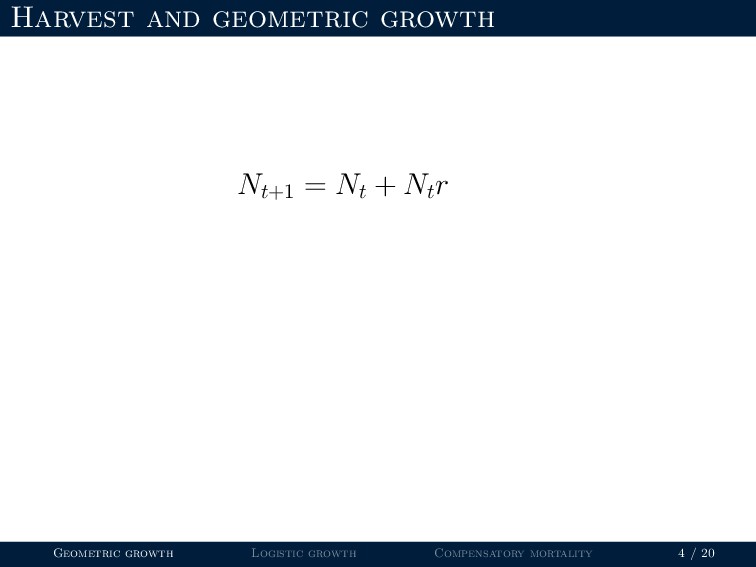
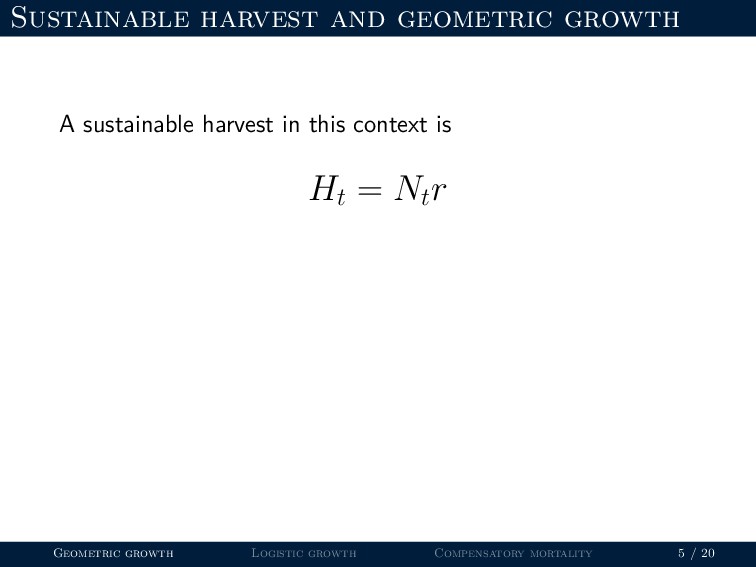
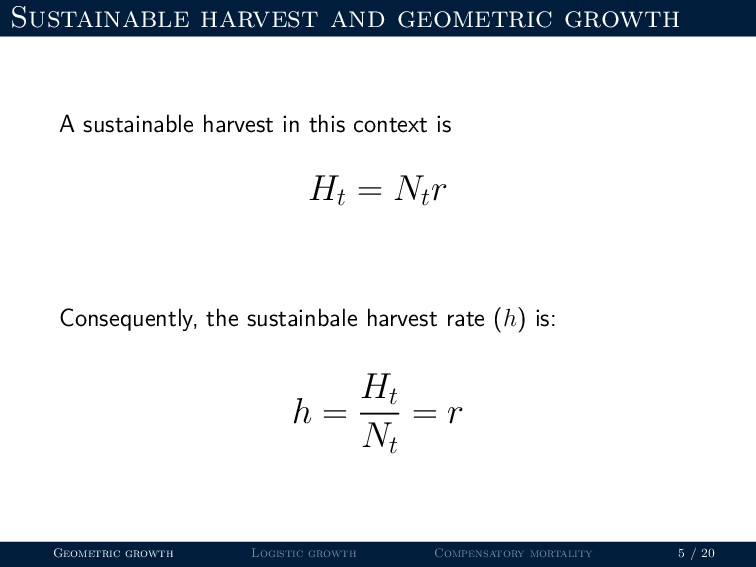
objective in game management Sustainable harvest: A harvest that is balanced by population growth such that Nt+1 = Nt Geometric growth Logistic growth Compensatory mortality 3 / 20
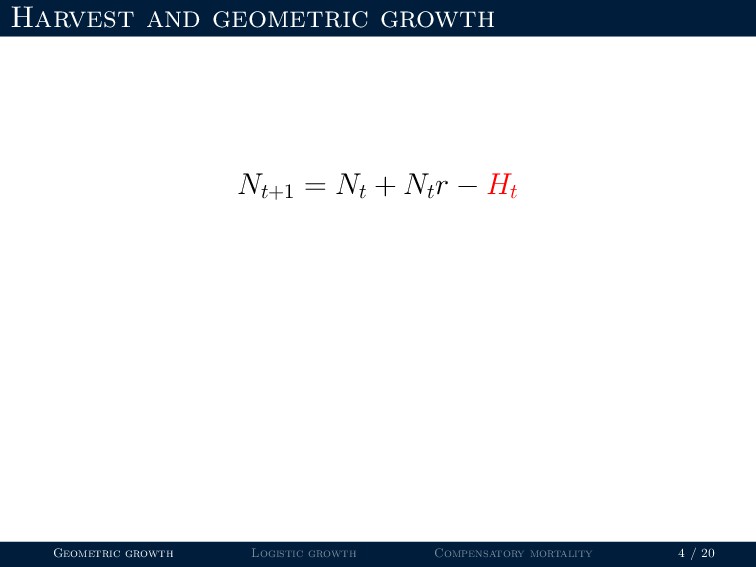
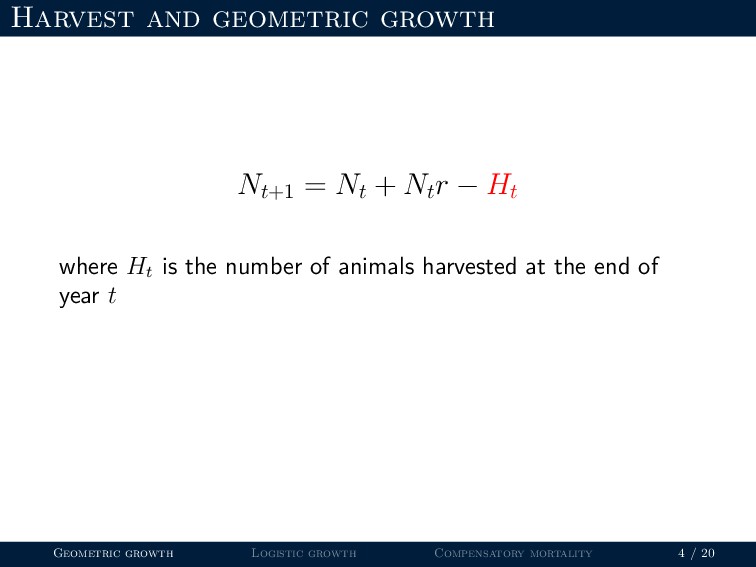
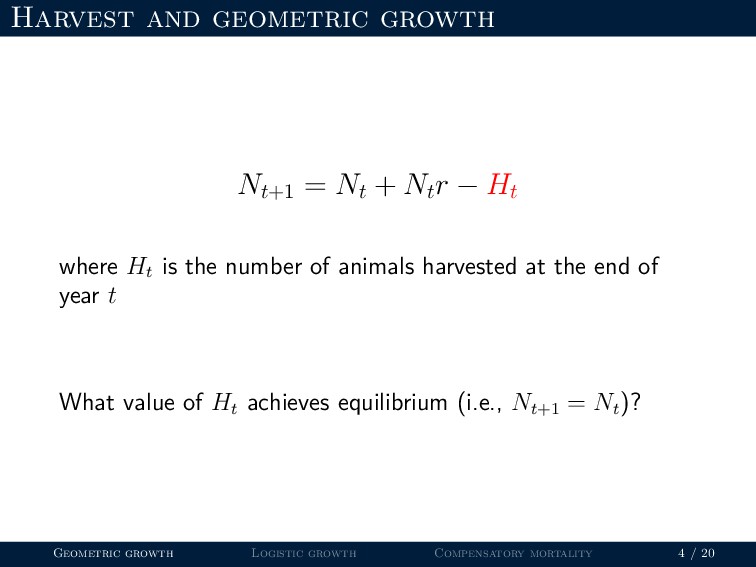
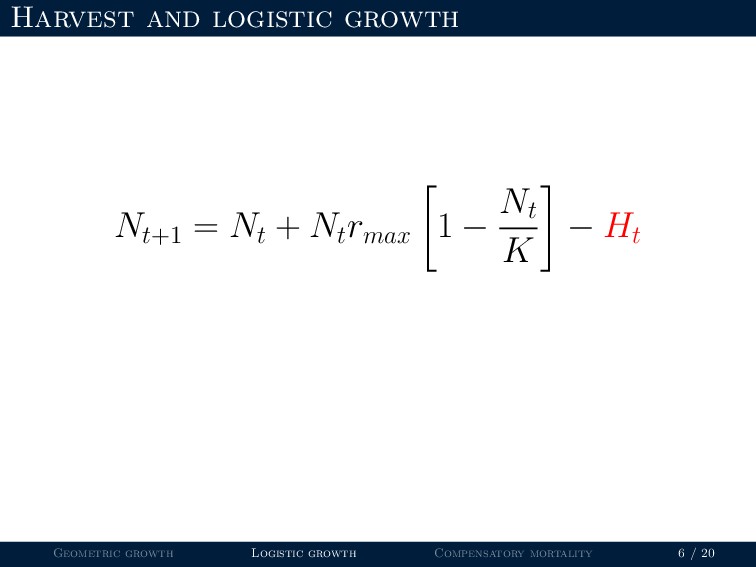
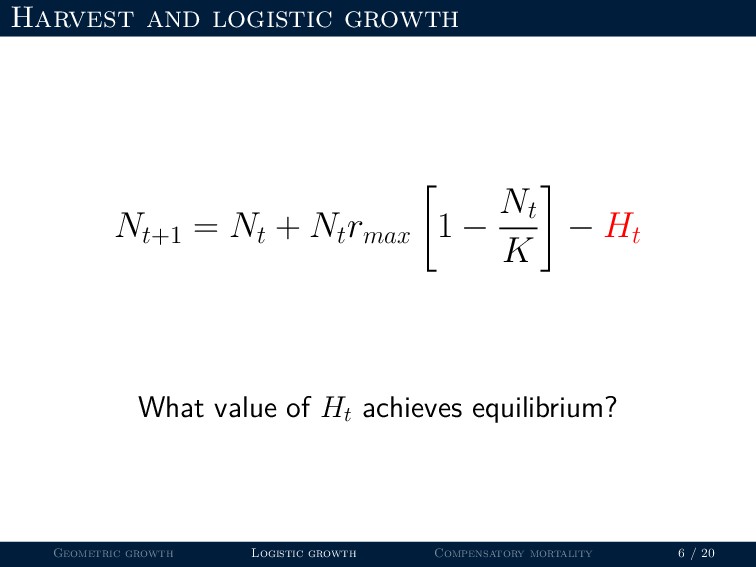
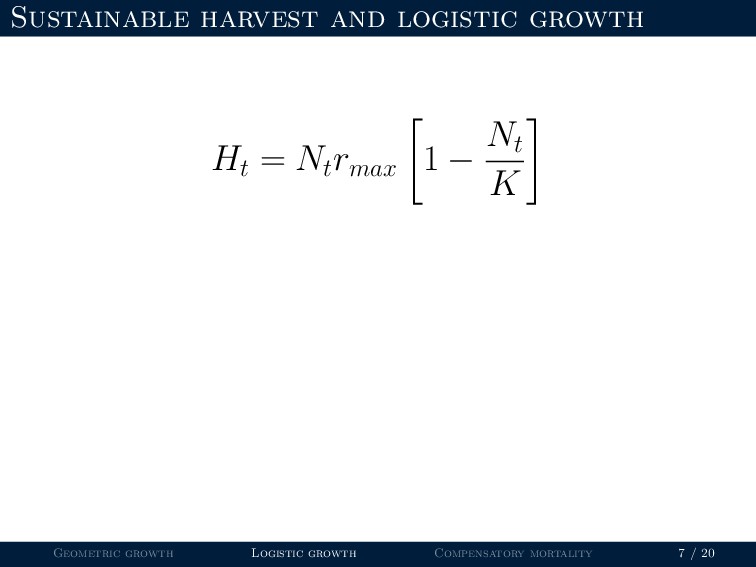
− Ht where Ht is the number of animals harvested at the end of year t What value of Ht achieves equilibrium (i.e., Nt+1 = Nt )? Geometric growth Logistic growth Compensatory mortality 4 / 20
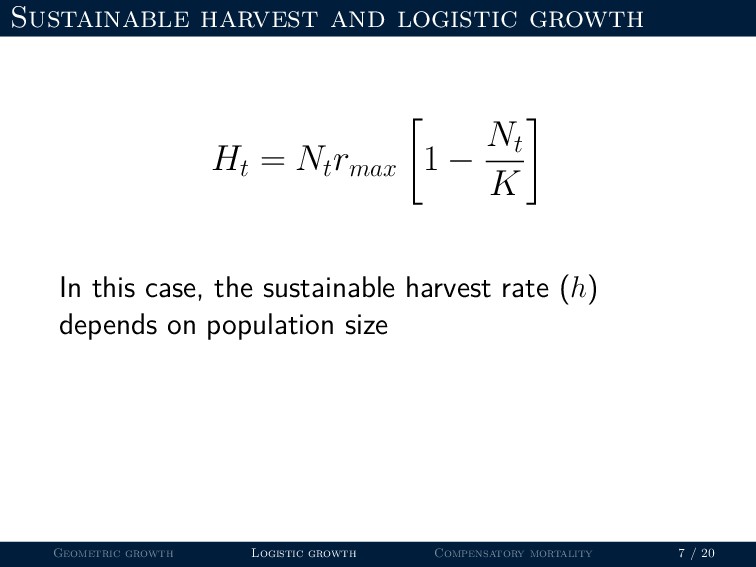
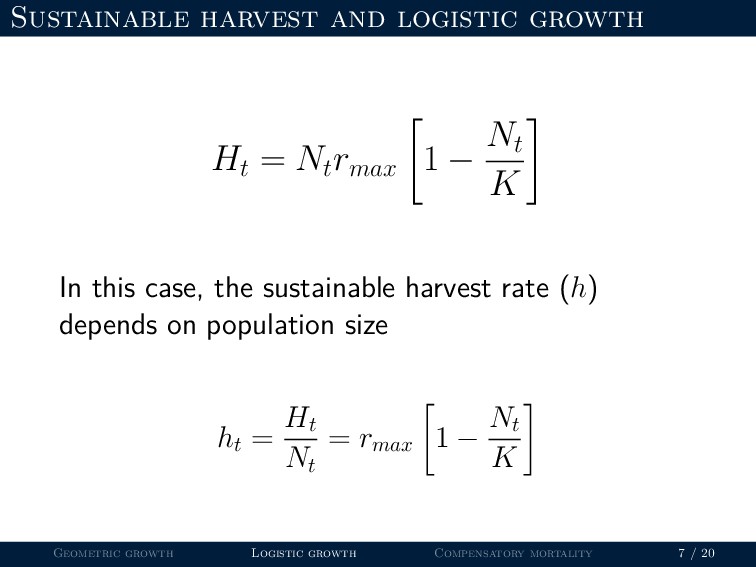
− Nt K In this case, the sustainable harvest rate (h) depends on population size ht = Ht Nt = rmax 1 − Nt K Geometric growth Logistic growth Compensatory mortality 7 / 20
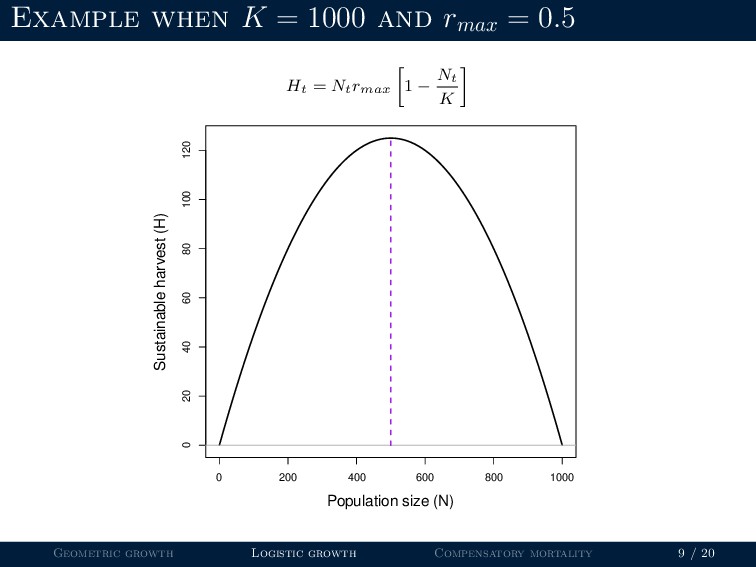
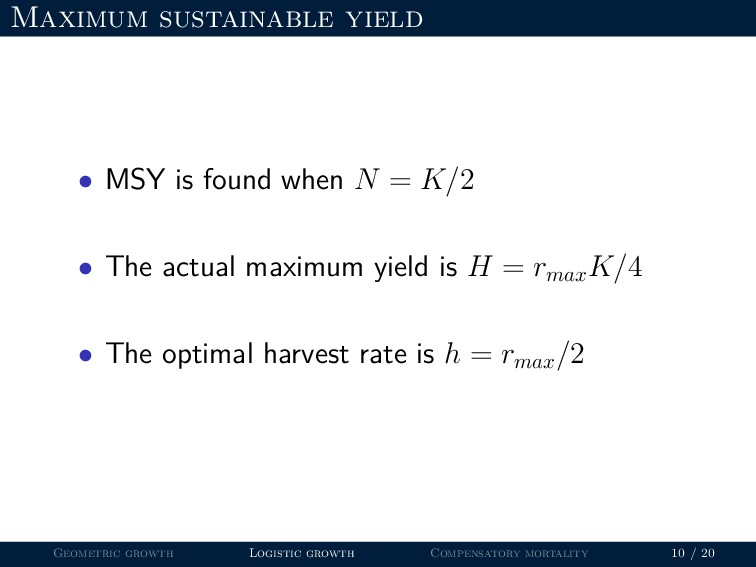
K/2 • The actual maximum yield is H = rmax K/4 • The optimal harvest rate is h = rmax /2 Geometric growth Logistic growth Compensatory mortality 10 / 20
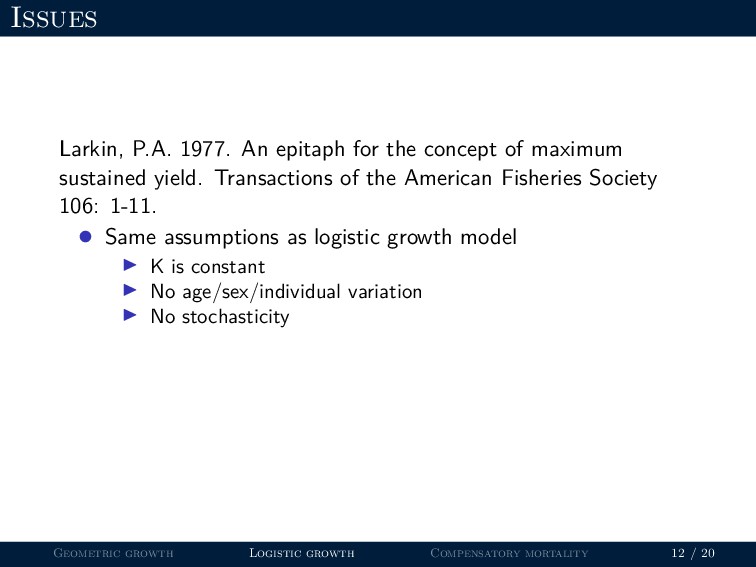
maximum sustained yield. Transactions of the American Fisheries Society 106: 1-11. • Same assumptions as logistic growth model Geometric growth Logistic growth Compensatory mortality 12 / 20
maximum sustained yield. Transactions of the American Fisheries Society 106: 1-11. • Same assumptions as logistic growth model K is constant No age/sex/individual variation No stochasticity Geometric growth Logistic growth Compensatory mortality 12 / 20
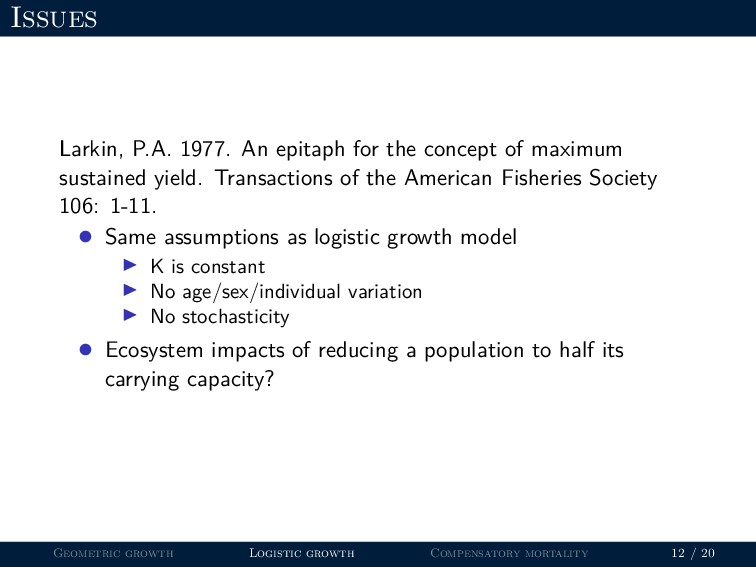
maximum sustained yield. Transactions of the American Fisheries Society 106: 1-11. • Same assumptions as logistic growth model K is constant No age/sex/individual variation No stochasticity • Ecosystem impacts of reducing a population to half its carrying capacity? Geometric growth Logistic growth Compensatory mortality 12 / 20
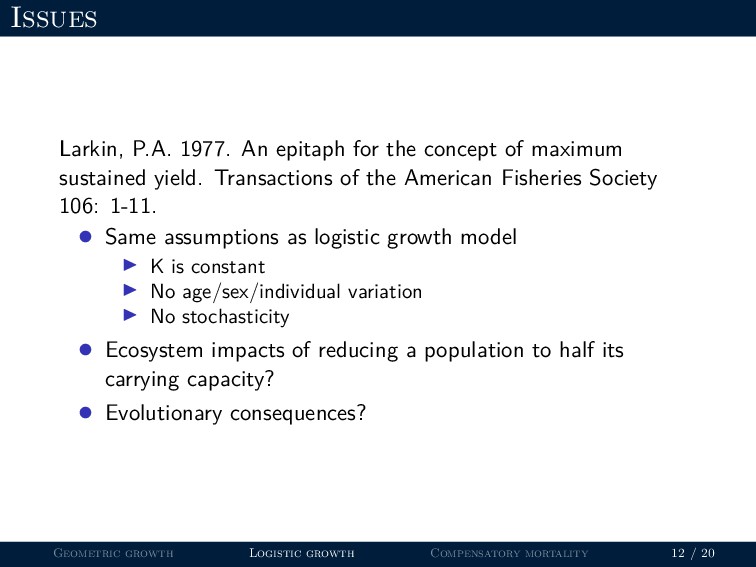
maximum sustained yield. Transactions of the American Fisheries Society 106: 1-11. • Same assumptions as logistic growth model K is constant No age/sex/individual variation No stochasticity • Ecosystem impacts of reducing a population to half its carrying capacity? • Evolutionary consequences? Geometric growth Logistic growth Compensatory mortality 12 / 20
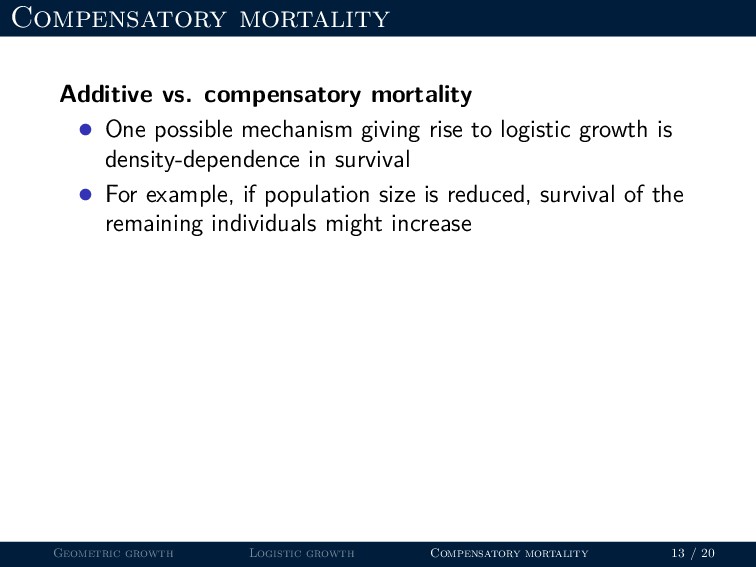
giving rise to logistic growth is density-dependence in survival • For example, if population size is reduced, survival of the remaining individuals might increase Geometric growth Logistic growth Compensatory mortality 13 / 20
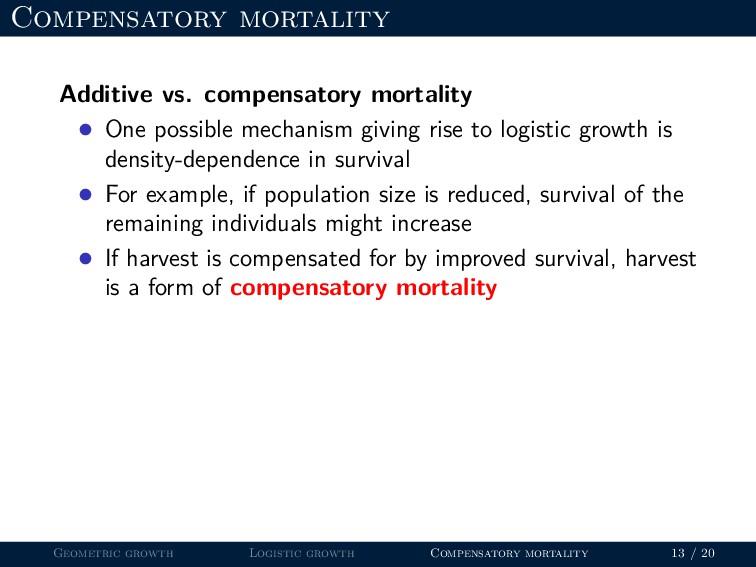
giving rise to logistic growth is density-dependence in survival • For example, if population size is reduced, survival of the remaining individuals might increase • If harvest is compensated for by improved survival, harvest is a form of compensatory mortality Geometric growth Logistic growth Compensatory mortality 13 / 20
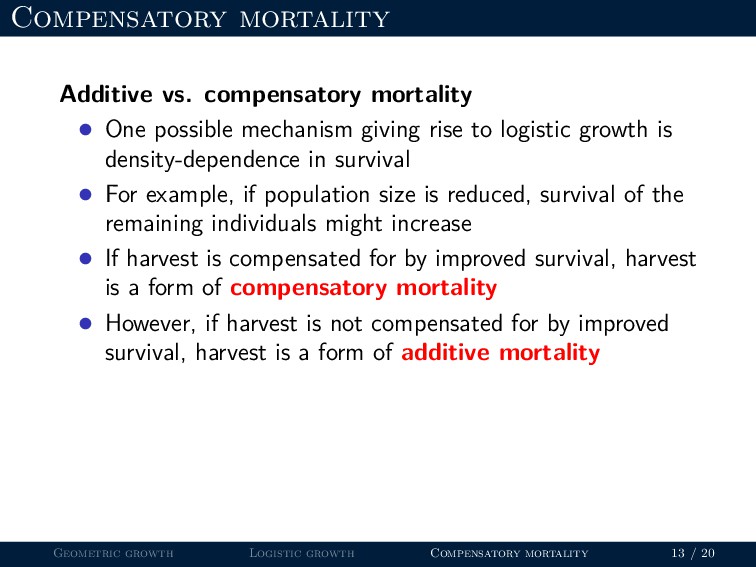
giving rise to logistic growth is density-dependence in survival • For example, if population size is reduced, survival of the remaining individuals might increase • If harvest is compensated for by improved survival, harvest is a form of compensatory mortality • However, if harvest is not compensated for by improved survival, harvest is a form of additive mortality Geometric growth Logistic growth Compensatory mortality 13 / 20
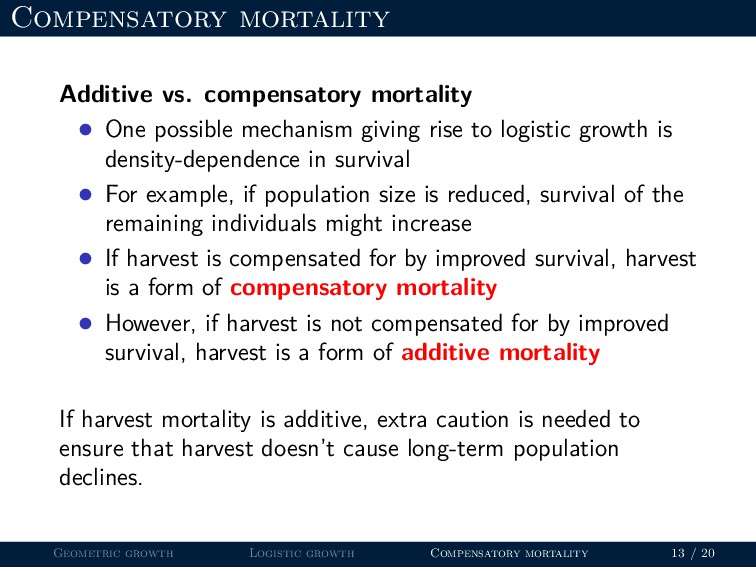
giving rise to logistic growth is density-dependence in survival • For example, if population size is reduced, survival of the remaining individuals might increase • If harvest is compensated for by improved survival, harvest is a form of compensatory mortality • However, if harvest is not compensated for by improved survival, harvest is a form of additive mortality If harvest mortality is additive, extra caution is needed to ensure that harvest doesn’t cause long-term population declines. Geometric growth Logistic growth Compensatory mortality 13 / 20
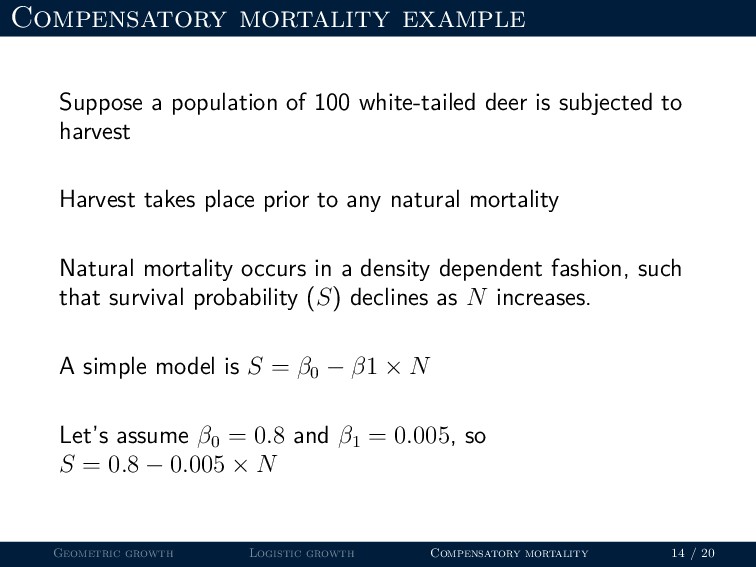
is subjected to harvest Harvest takes place prior to any natural mortality Natural mortality occurs in a density dependent fashion, such that survival probability (S) declines as N increases. Geometric growth Logistic growth Compensatory mortality 14 / 20
is subjected to harvest Harvest takes place prior to any natural mortality Natural mortality occurs in a density dependent fashion, such that survival probability (S) declines as N increases. A simple model is S = β0 − β1 × N Geometric growth Logistic growth Compensatory mortality 14 / 20
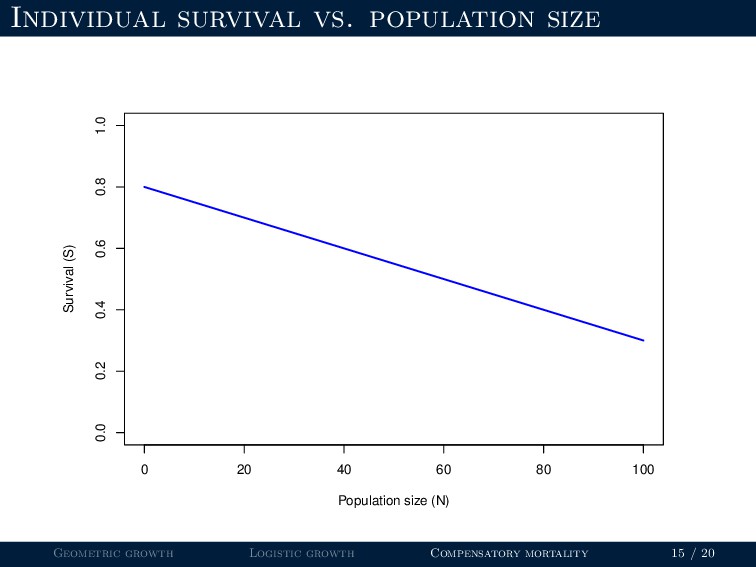
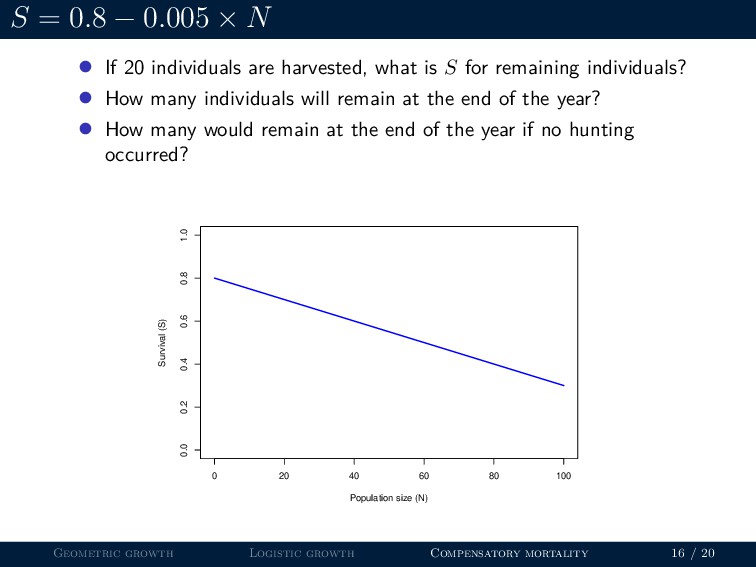
is subjected to harvest Harvest takes place prior to any natural mortality Natural mortality occurs in a density dependent fashion, such that survival probability (S) declines as N increases. A simple model is S = β0 − β1 × N Let’s assume β0 = 0.8 and β1 = 0.005, so S = 0.8 − 0.005 × N Geometric growth Logistic growth Compensatory mortality 14 / 20
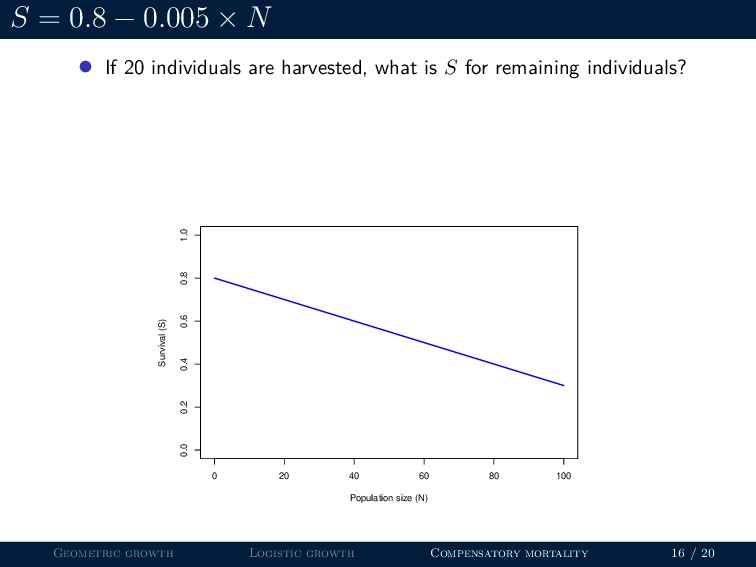
individuals are harvested, what is S for remaining individuals? 0 20 40 60 80 100 0.0 0.2 0.4 0.6 0.8 1.0 Population size (N) Survival (S) Geometric growth Logistic growth Compensatory mortality 16 / 20
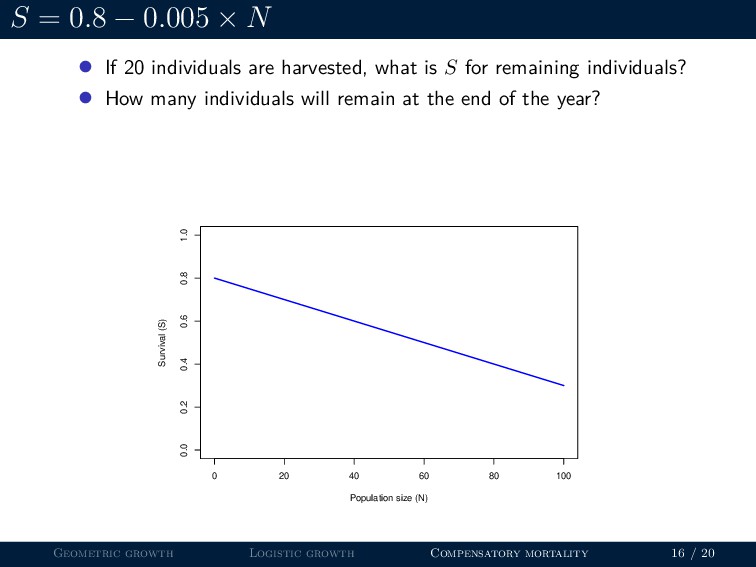
individuals are harvested, what is S for remaining individuals? • How many individuals will remain at the end of the year? 0 20 40 60 80 100 0.0 0.2 0.4 0.6 0.8 1.0 Population size (N) Survival (S) Geometric growth Logistic growth Compensatory mortality 16 / 20
individuals are harvested, what is S for remaining individuals? • How many individuals will remain at the end of the year? • How many would remain at the end of the year if no hunting occurred? 0 20 40 60 80 100 0.0 0.2 0.4 0.6 0.8 1.0 Population size (N) Survival (S) Geometric growth Logistic growth Compensatory mortality 16 / 20
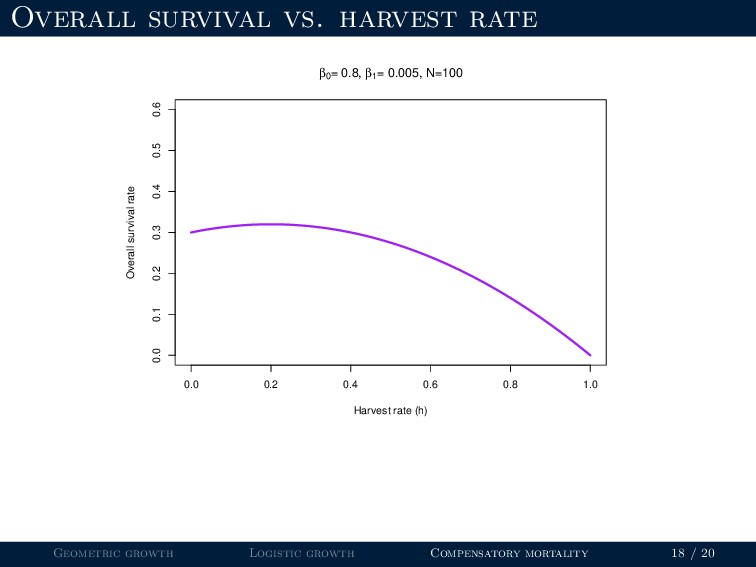
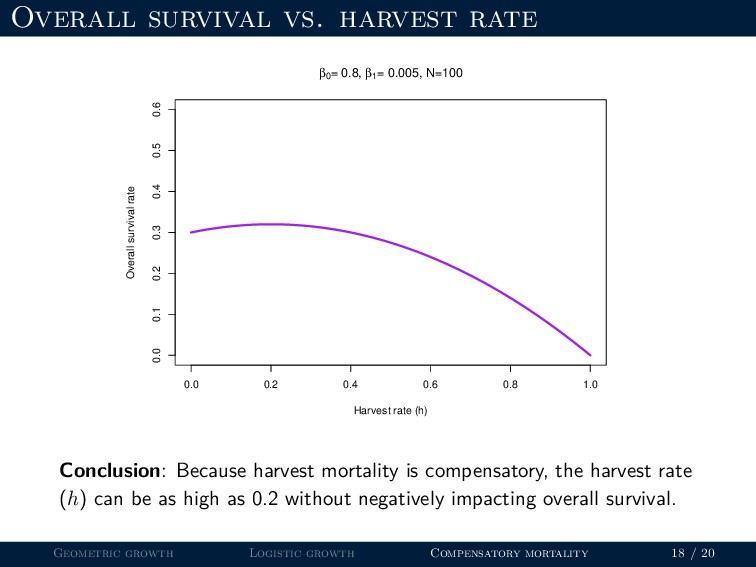
¯ S) is product of survival throughout the hunting season (1 − h) and survial after the hunting season ¯ S = (1 − h)(β0 − β1 (N − Nh)) Geometric growth Logistic growth Compensatory mortality 17 / 20
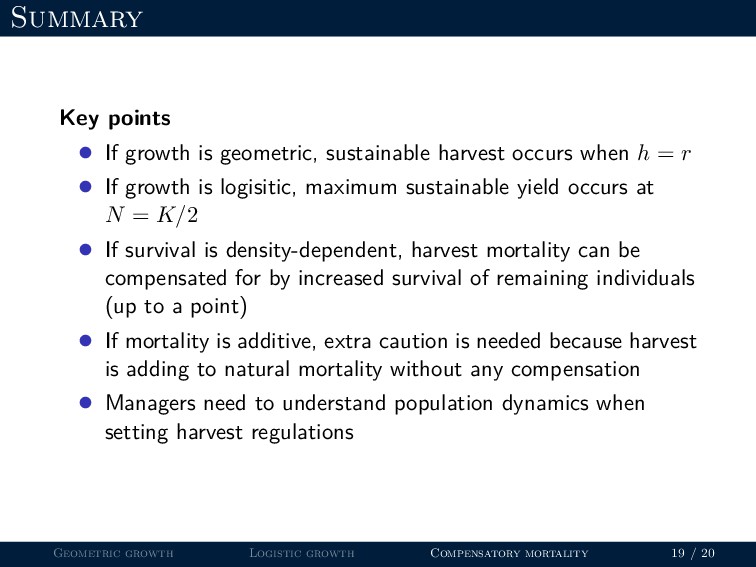
occurs when h = r • If growth is logisitic, maximum sustainable yield occurs at N = K/2 • If survival is density-dependent, harvest mortality can be compensated for by increased survival of remaining individuals (up to a point) • If mortality is additive, extra caution is needed because harvest is adding to natural mortality without any compensation • Managers need to understand population dynamics when setting harvest regulations Geometric growth Logistic growth Compensatory mortality 19 / 20