Share
Embed
Transcript
77 slides
-
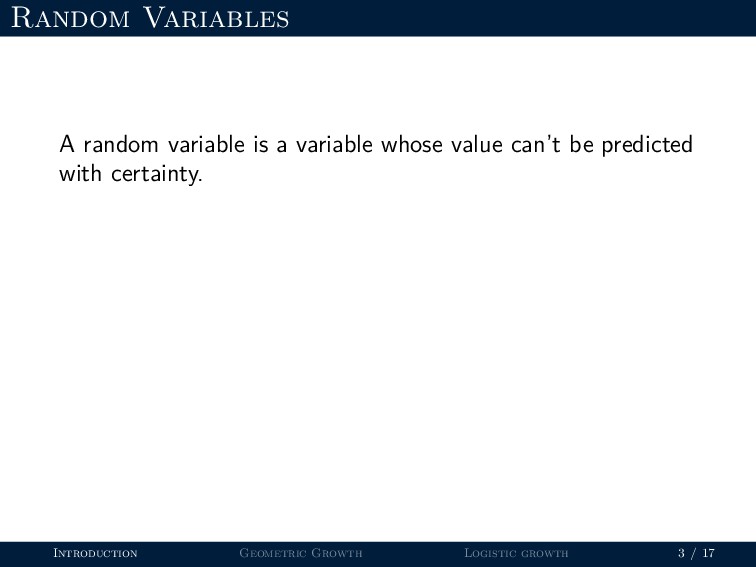
Random Variables A random variable is a variable whose value
can’t be predicted with certainty. Introduction Geometric Growth Logistic growth 3 / 17 -
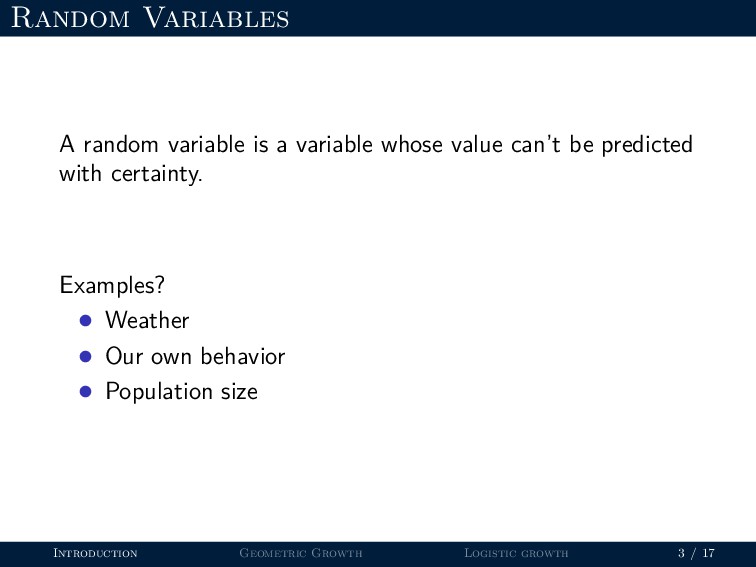
Random Variables A random variable is a variable whose value
can’t be predicted with certainty. Examples? • Weather • Our own behavior • Population size Introduction Geometric Growth Logistic growth 3 / 17 -
Probability distributions A random variable (X) can be described by
a probability distribution. Introduction Geometric Growth Logistic growth 4 / 17 -
Probability distributions A random variable (X) can be described by
a probability distribution. There are many types of probability distributions • Normal (or Gaussian) • Poisson • Binomial • Multinomial • etc. . . Introduction Geometric Growth Logistic growth 4 / 17 -
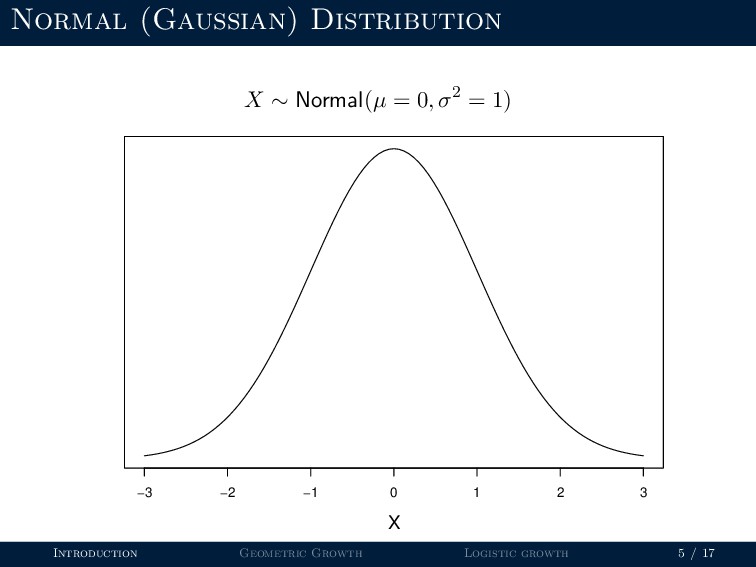
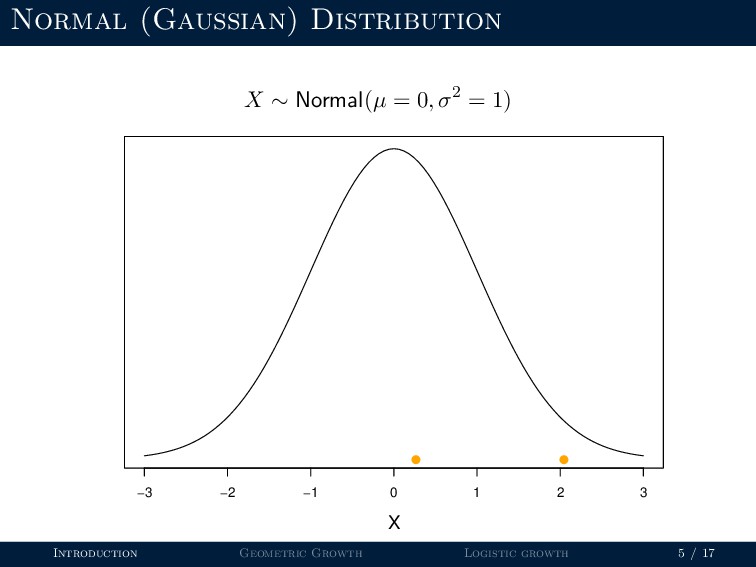
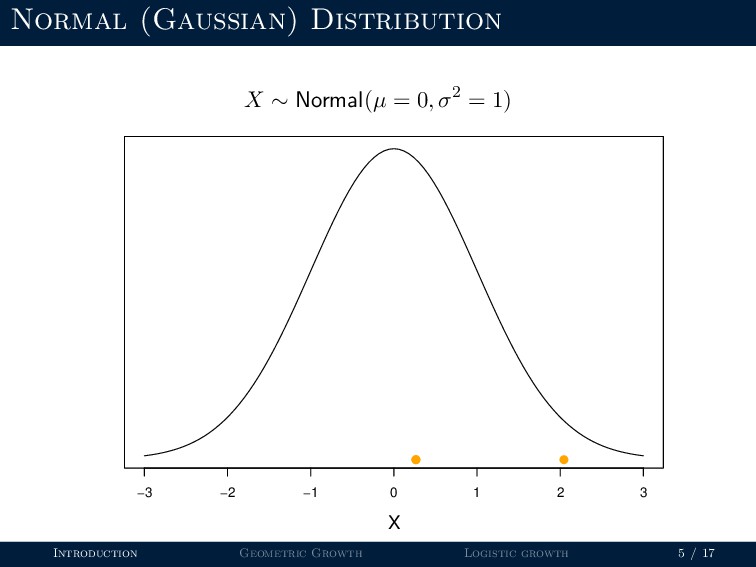
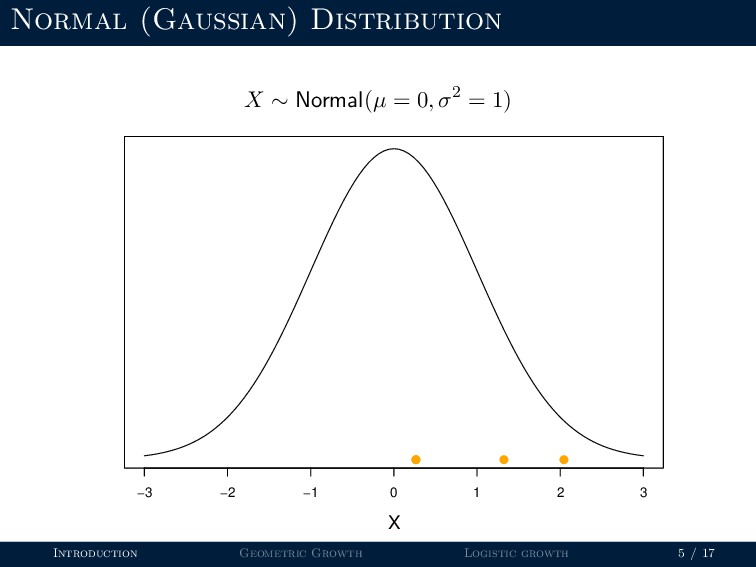
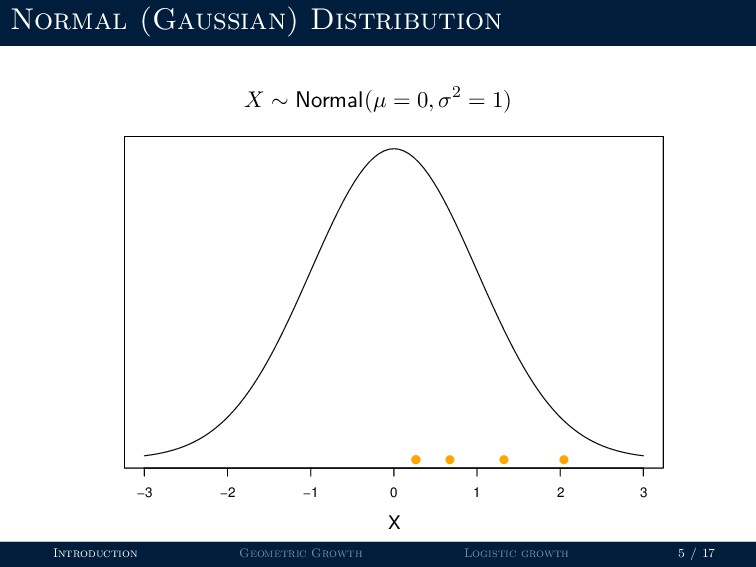
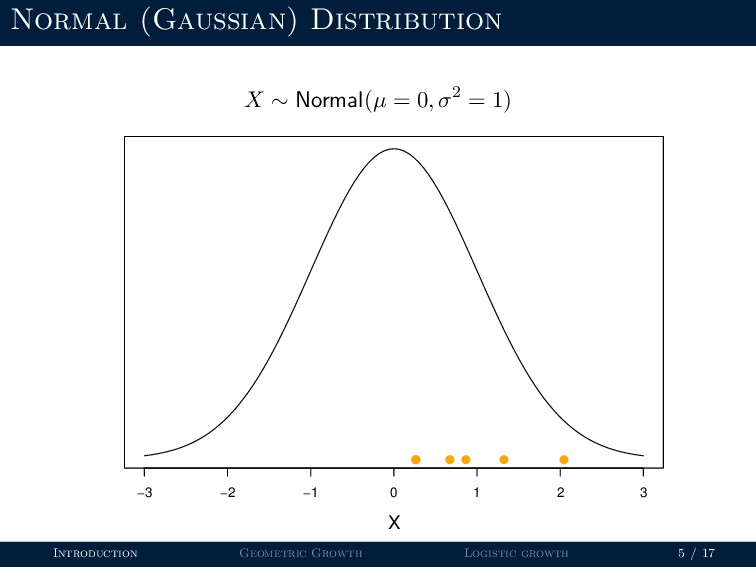
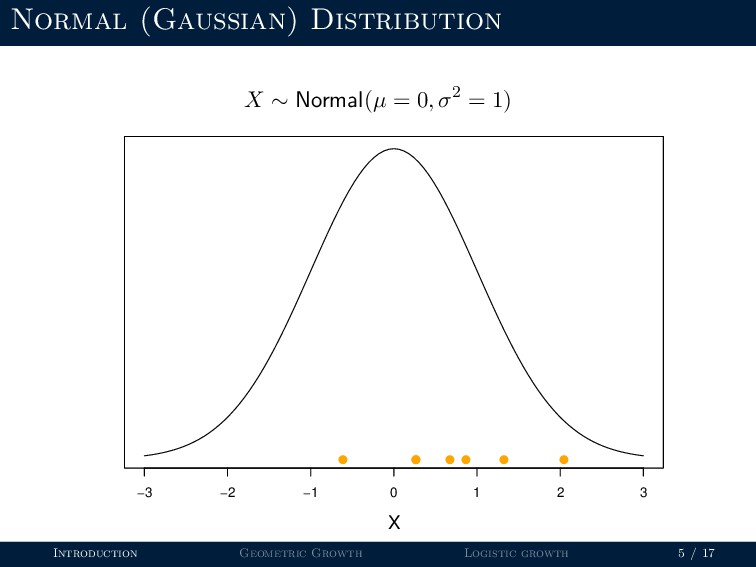
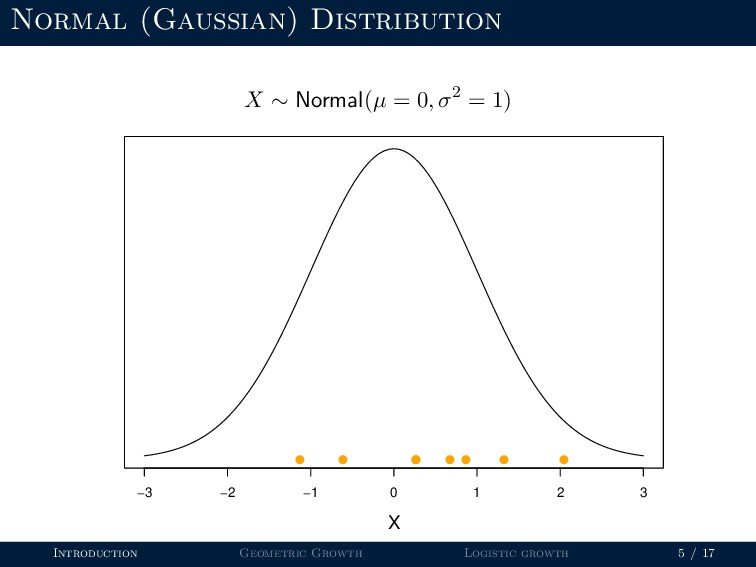
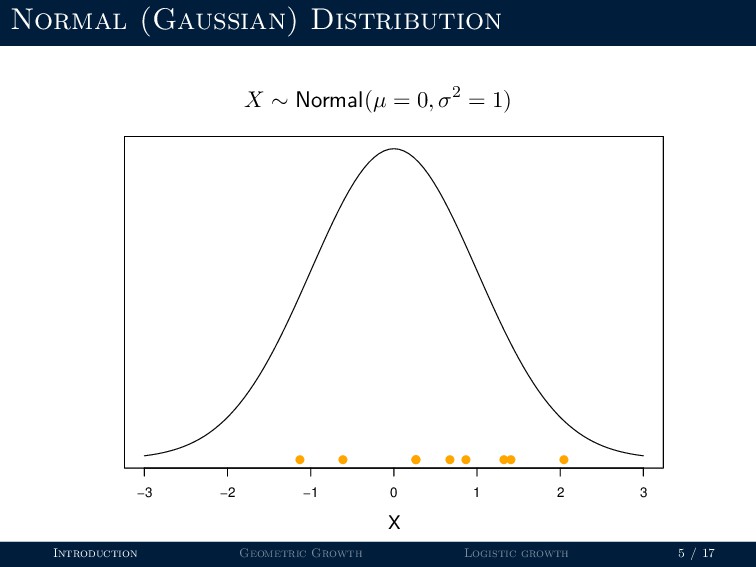
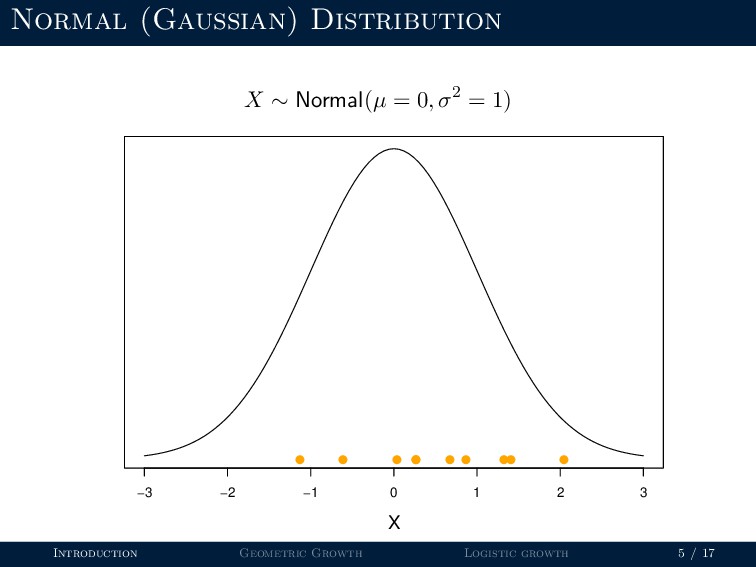
Normal (Gaussian) Distribution X ∼ Normal(µ = 0, σ2 =
1) −3 −2 −1 0 1 2 3 X Introduction Geometric Growth Logistic growth 5 / 17 -
Normal (Gaussian) Distribution X ∼ Normal(µ = 0, σ2 =
1) −3 −2 −1 0 1 2 3 X q Introduction Geometric Growth Logistic growth 5 / 17 -
Normal (Gaussian) Distribution X ∼ Normal(µ = 0, σ2 =
1) −3 −2 −1 0 1 2 3 X q q Introduction Geometric Growth Logistic growth 5 / 17 -
Normal (Gaussian) Distribution X ∼ Normal(µ = 0, σ2 =
1) −3 −2 −1 0 1 2 3 X q q q Introduction Geometric Growth Logistic growth 5 / 17 -
Normal (Gaussian) Distribution X ∼ Normal(µ = 0, σ2 =
1) −3 −2 −1 0 1 2 3 X q q q q Introduction Geometric Growth Logistic growth 5 / 17 -
Normal (Gaussian) Distribution X ∼ Normal(µ = 0, σ2 =
1) −3 −2 −1 0 1 2 3 X q q q q q Introduction Geometric Growth Logistic growth 5 / 17 -
Normal (Gaussian) Distribution X ∼ Normal(µ = 0, σ2 =
1) −3 −2 −1 0 1 2 3 X q q q q q q Introduction Geometric Growth Logistic growth 5 / 17 -
Normal (Gaussian) Distribution X ∼ Normal(µ = 0, σ2 =
1) −3 −2 −1 0 1 2 3 X q q q q q q q Introduction Geometric Growth Logistic growth 5 / 17 -
Normal (Gaussian) Distribution X ∼ Normal(µ = 0, σ2 =
1) −3 −2 −1 0 1 2 3 X q q q q q q q q Introduction Geometric Growth Logistic growth 5 / 17 -
Normal (Gaussian) Distribution X ∼ Normal(µ = 0, σ2 =
1) −3 −2 −1 0 1 2 3 X q q q q q q q q q Introduction Geometric Growth Logistic growth 5 / 17 -
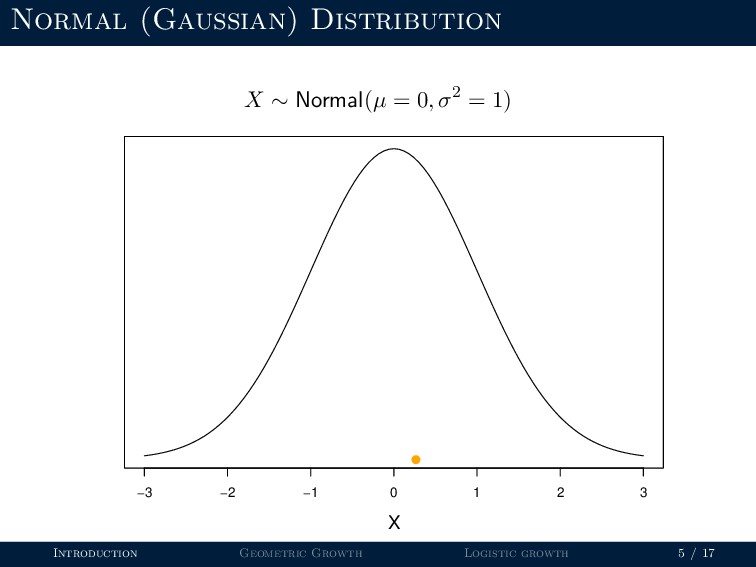
Normal (Gaussian) Distribution X ∼ Normal(µ = 0, σ2 =
1) −3 −2 −1 0 1 2 3 X q q q q q q q q q q Introduction Geometric Growth Logistic growth 5 / 17 -
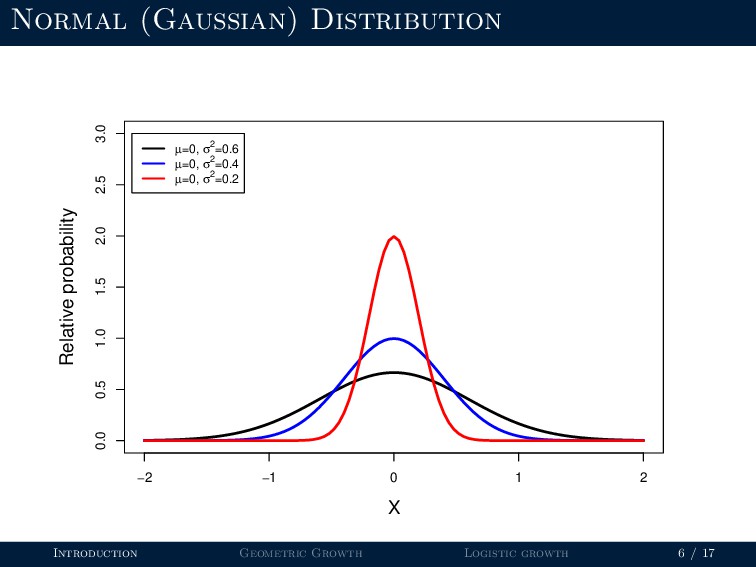
Normal (Gaussian) Distribution −2 −1 0 1 2 0.0 0.5
1.0 1.5 2.0 2.5 3.0 X Relative probability µ=0, σ2=0.6 µ=0, σ2=0.4 µ=0, σ2=0.2 Introduction Geometric Growth Logistic growth 6 / 17 -
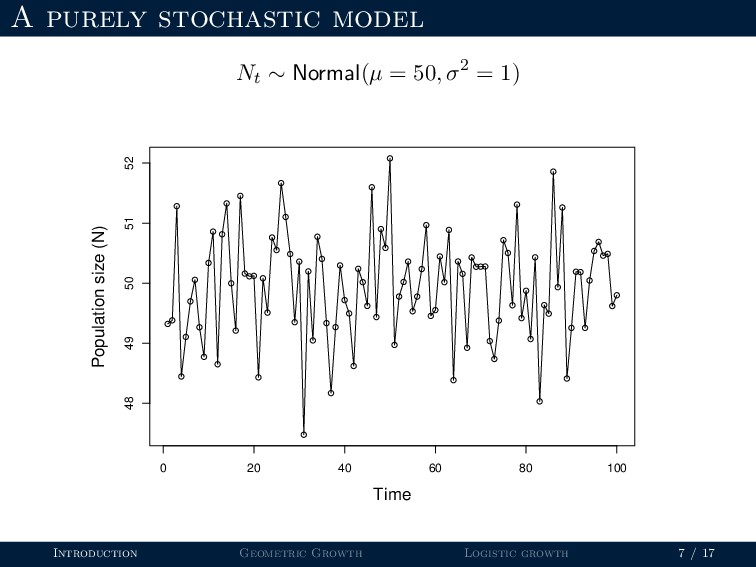
A purely stochastic model Nt ∼ Normal(µ = 50, σ2
= 1) qq q q q q q q q q q q q q q q q qqq q q q q q q q q q q q q q q q q q q q q q q q q q q q q q q q q q q q q q q q q q q q q q q q q qqq q q q q q q q q q q q q q q q q q q q qq q q q q qq q q 0 20 40 60 80 100 48 49 50 51 52 Time Population size (N) Introduction Geometric Growth Logistic growth 7 / 17 -
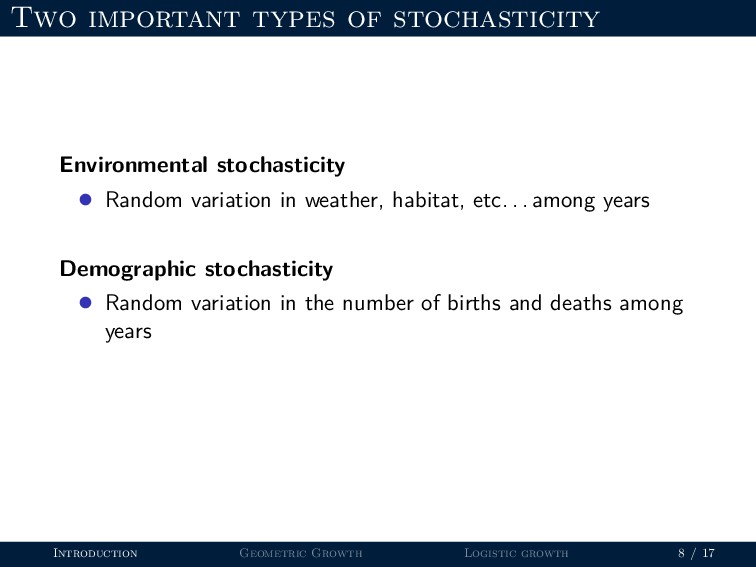
Two important types of stochasticity Environmental stochasticity • Random variation
in weather, habitat, etc. . . among years Introduction Geometric Growth Logistic growth 8 / 17 -
Two important types of stochasticity Environmental stochasticity • Random variation
in weather, habitat, etc. . . among years Demographic stochasticity • Random variation in the number of births and deaths among years Introduction Geometric Growth Logistic growth 8 / 17 -
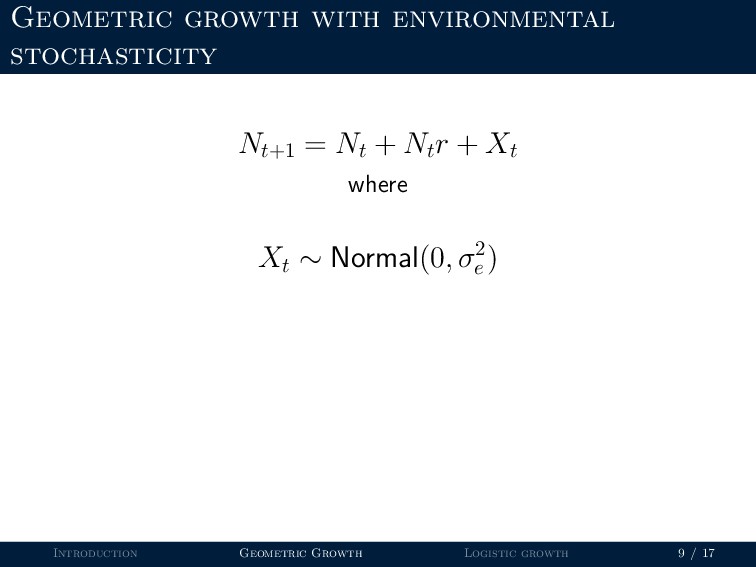
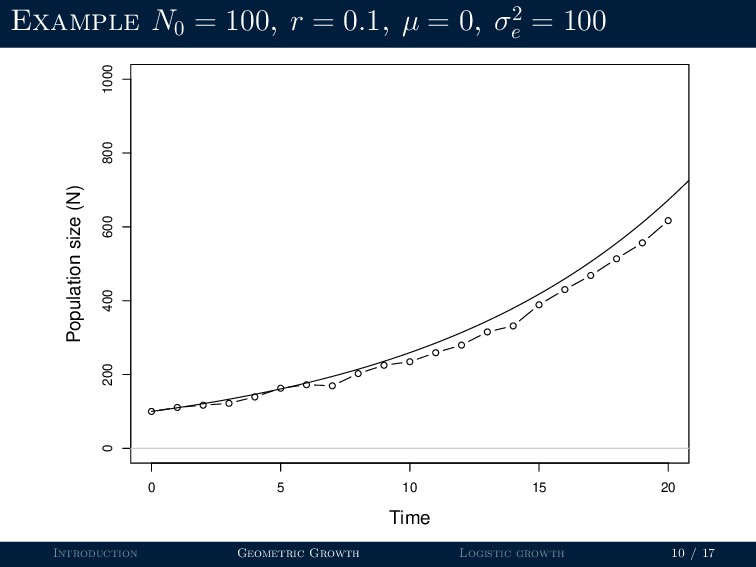
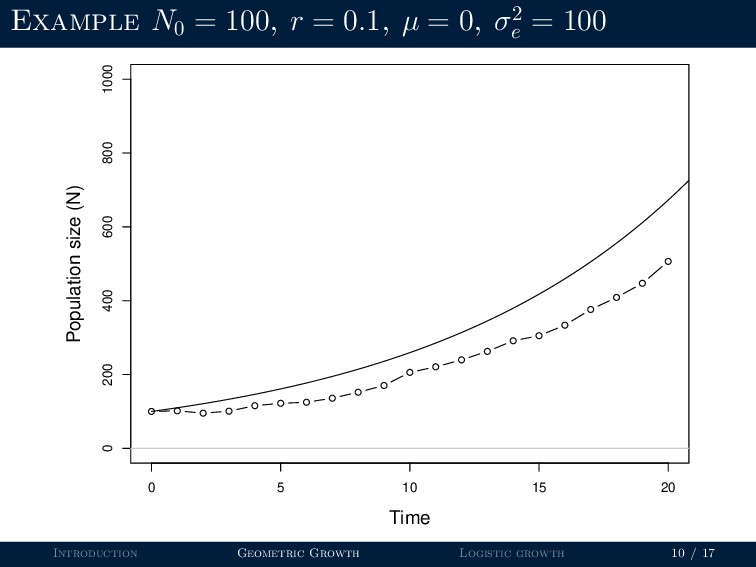
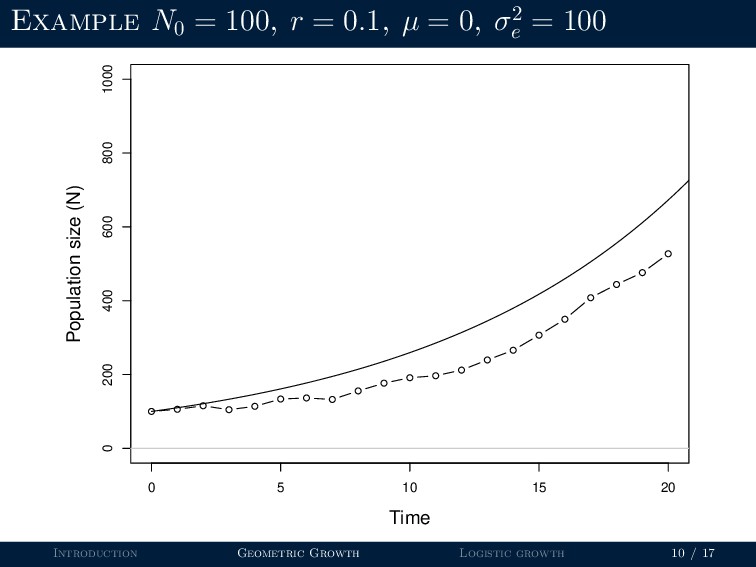
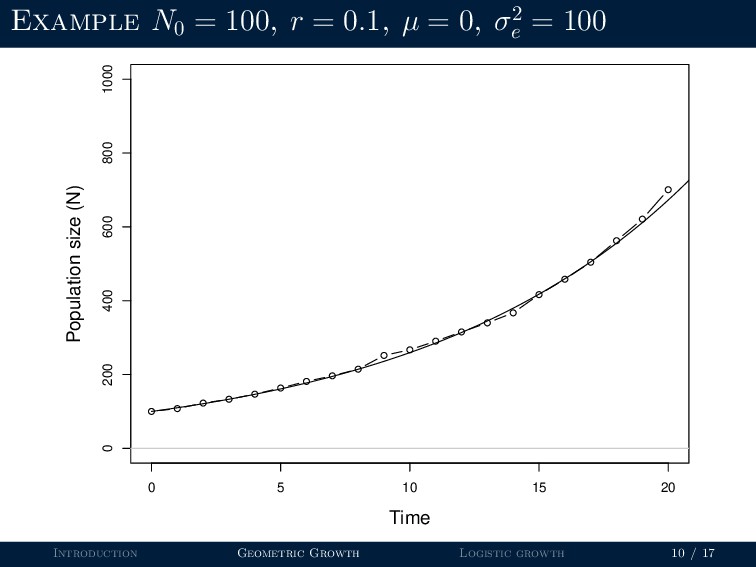
Geometric growth with environmental stochasticity Nt+1 = Nt + Nt
r + Xt where Xt ∼ Normal(0, σ2 e ) Introduction Geometric Growth Logistic growth 9 / 17 -
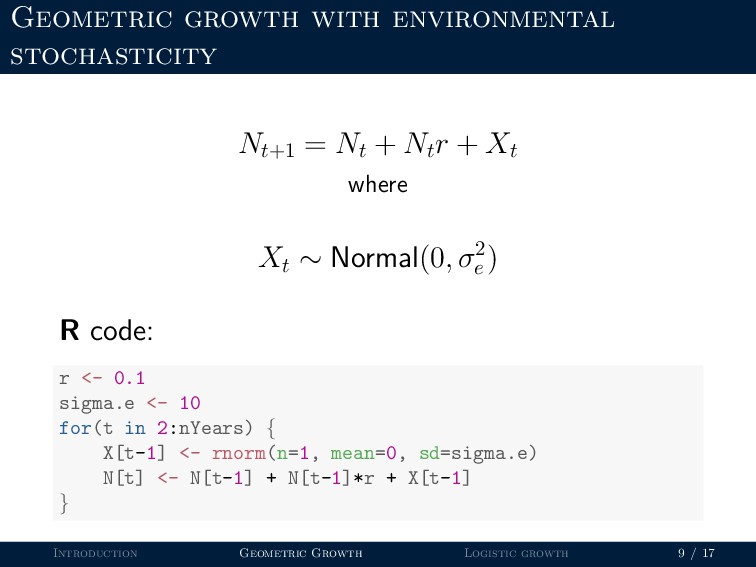
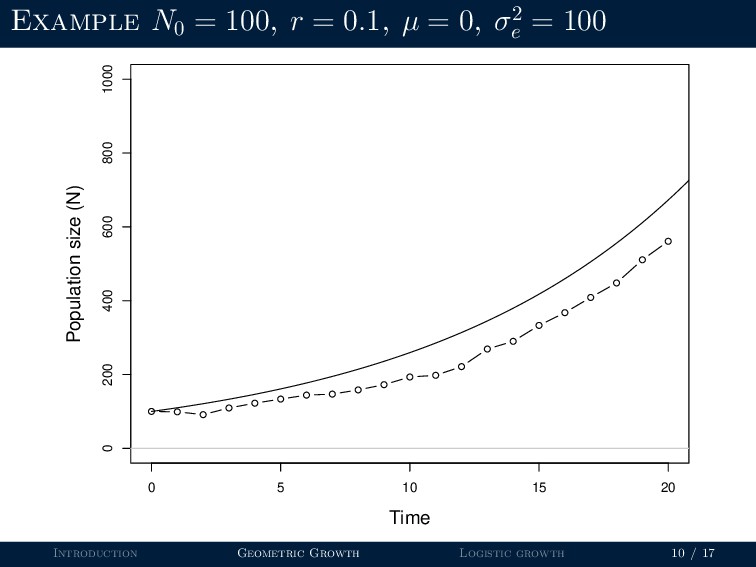
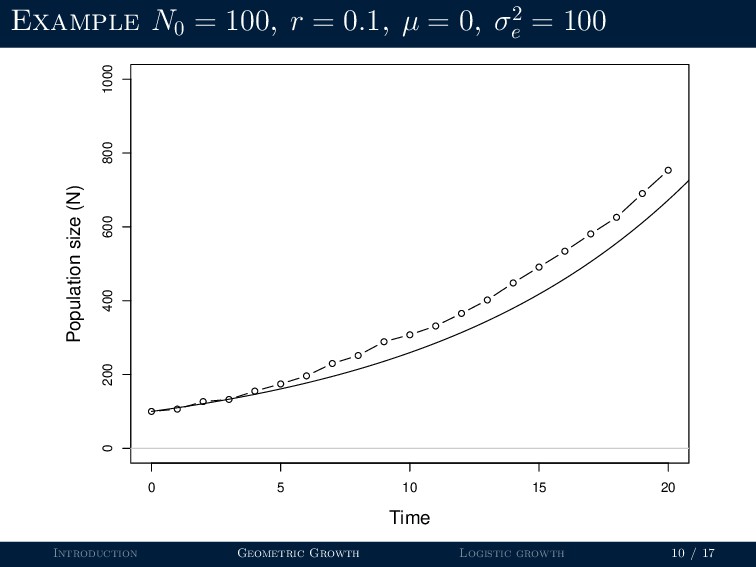
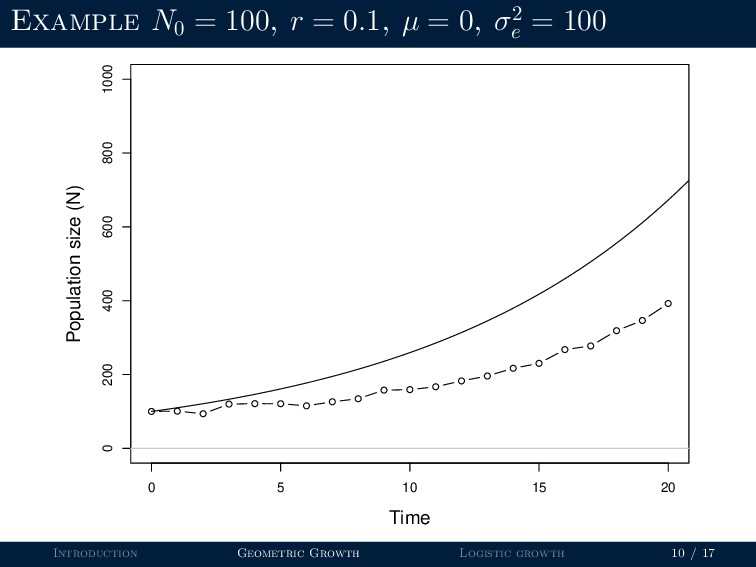
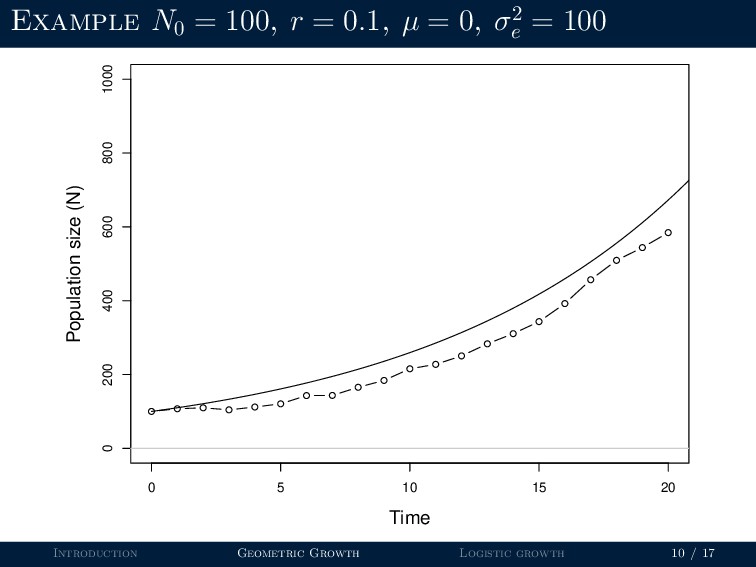
Geometric growth with environmental stochasticity Nt+1 = Nt + Nt
r + Xt where Xt ∼ Normal(0, σ2 e ) R code: r <- 0.1 sigma.e <- 10 for(t in 2:nYears) { X[t-1] <- rnorm(n=1, mean=0, sd=sigma.e) N[t] <- N[t-1] + N[t-1]*r + X[t-1] } Introduction Geometric Growth Logistic growth 9 / 17 -
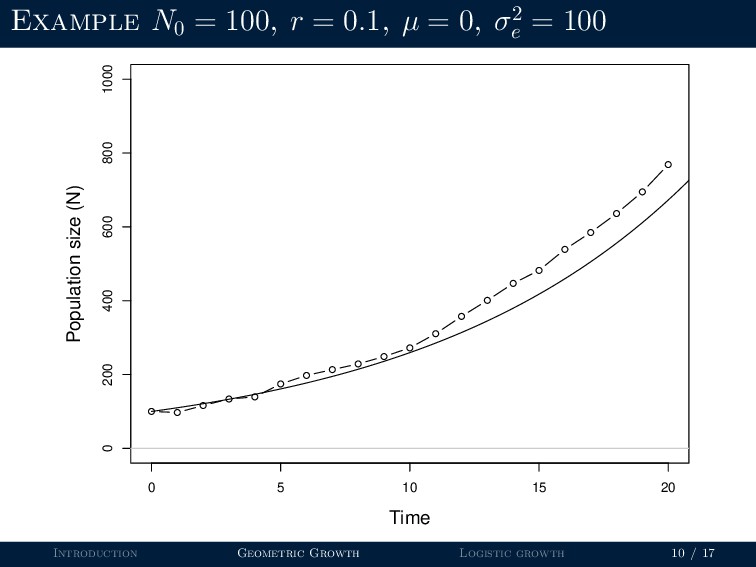
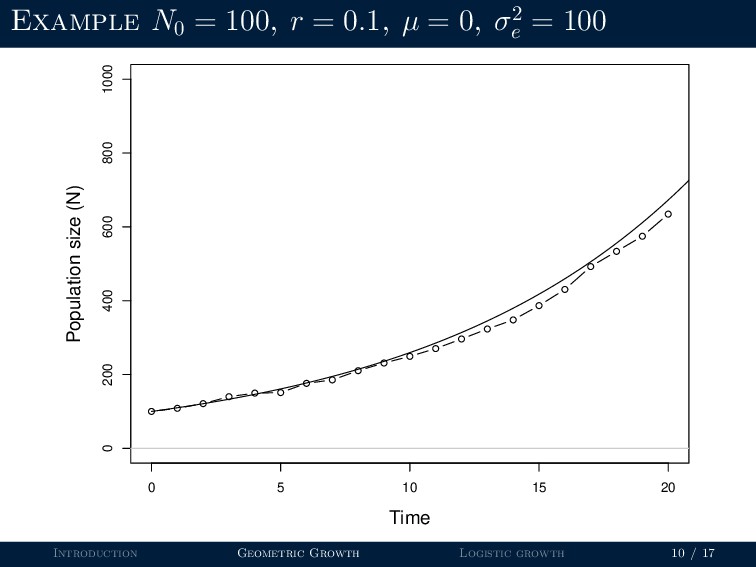
Example N0 = 100, r = 0.1, µ = 0,
σ2 e = 100 q q q q q q q q q q q q q q q q q q q q q 0 5 10 15 20 0 200 400 600 800 1000 Time Population size (N) Introduction Geometric Growth Logistic growth 10 / 17 -
Example N0 = 100, r = 0.1, µ = 0,
σ2 e = 100 q q q q q q q q q q q q q q q q q q q q q 0 5 10 15 20 0 200 400 600 800 1000 Time Population size (N) Introduction Geometric Growth Logistic growth 10 / 17 -
Example N0 = 100, r = 0.1, µ = 0,
σ2 e = 100 q q q q q q q q q q q q q q q q q q q q q 0 5 10 15 20 0 200 400 600 800 1000 Time Population size (N) Introduction Geometric Growth Logistic growth 10 / 17 -
Example N0 = 100, r = 0.1, µ = 0,
σ2 e = 100 q q q q q q q q q q q q q q q q q q q q q 0 5 10 15 20 0 200 400 600 800 1000 Time Population size (N) Introduction Geometric Growth Logistic growth 10 / 17 -
Example N0 = 100, r = 0.1, µ = 0,
σ2 e = 100 q q q q q q q q q q q q q q q q q q q q q 0 5 10 15 20 0 200 400 600 800 1000 Time Population size (N) Introduction Geometric Growth Logistic growth 10 / 17 -
Example N0 = 100, r = 0.1, µ = 0,
σ2 e = 100 q q q q q q q q q q q q q q q q q q q q q 0 5 10 15 20 0 200 400 600 800 1000 Time Population size (N) Introduction Geometric Growth Logistic growth 10 / 17 -
Example N0 = 100, r = 0.1, µ = 0,
σ2 e = 100 q q q q q q q q q q q q q q q q q q q q q 0 5 10 15 20 0 200 400 600 800 1000 Time Population size (N) Introduction Geometric Growth Logistic growth 10 / 17 -
Example N0 = 100, r = 0.1, µ = 0,
σ2 e = 100 q q q q q q q q q q q q q q q q q q q q q 0 5 10 15 20 0 200 400 600 800 1000 Time Population size (N) Introduction Geometric Growth Logistic growth 10 / 17 -
Example N0 = 100, r = 0.1, µ = 0,
σ2 e = 100 q q q q q q q q q q q q q q q q q q q q q 0 5 10 15 20 0 200 400 600 800 1000 Time Population size (N) Introduction Geometric Growth Logistic growth 10 / 17 -
Example N0 = 100, r = 0.1, µ = 0,
σ2 e = 100 q q q q q q q q q q q q q q q q q q q q q 0 5 10 15 20 0 200 400 600 800 1000 Time Population size (N) Introduction Geometric Growth Logistic growth 10 / 17 -
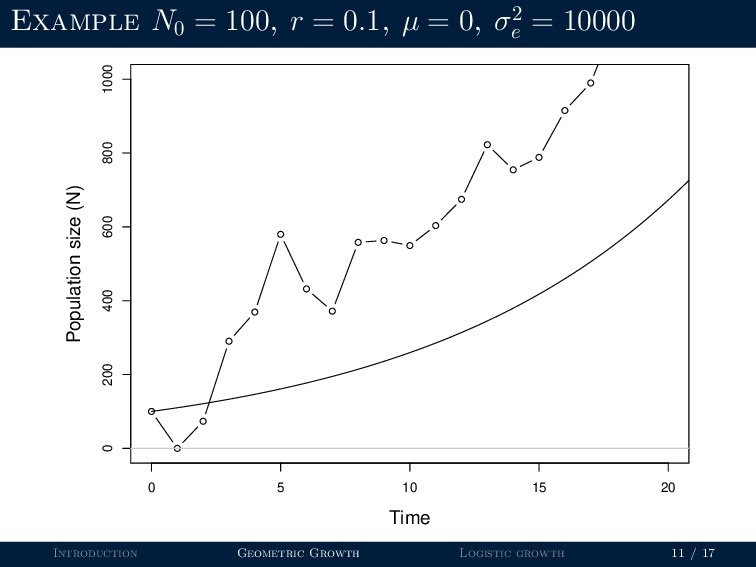
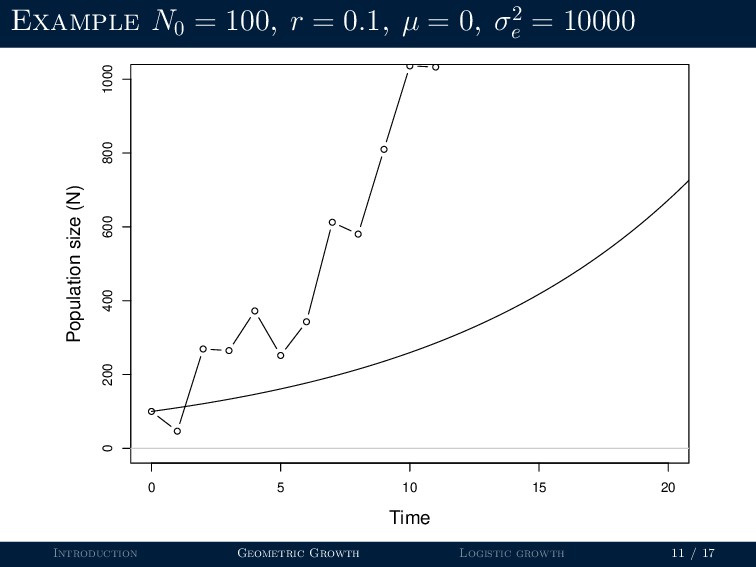
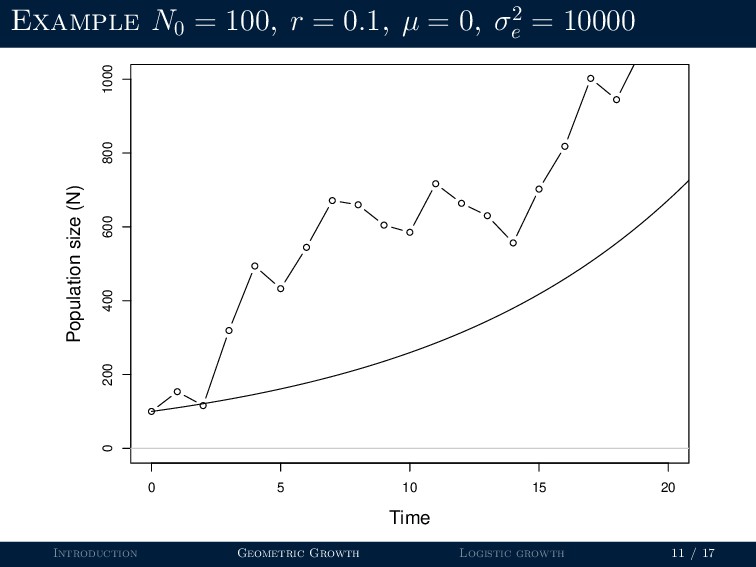
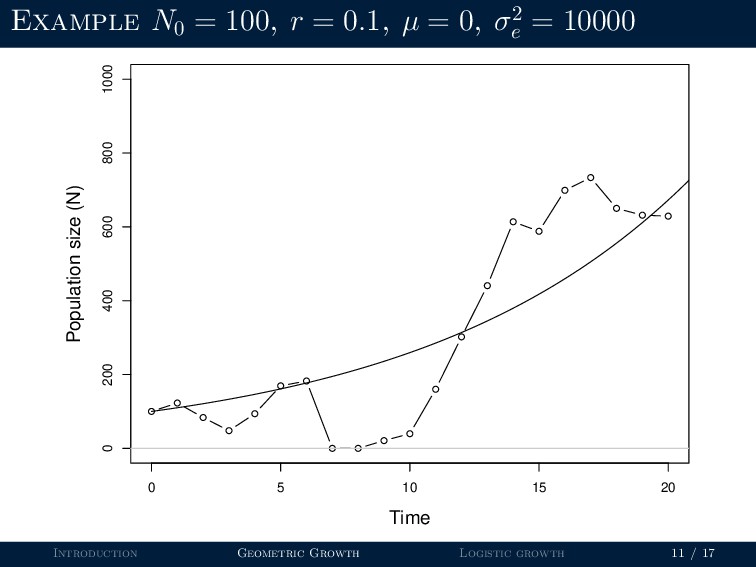
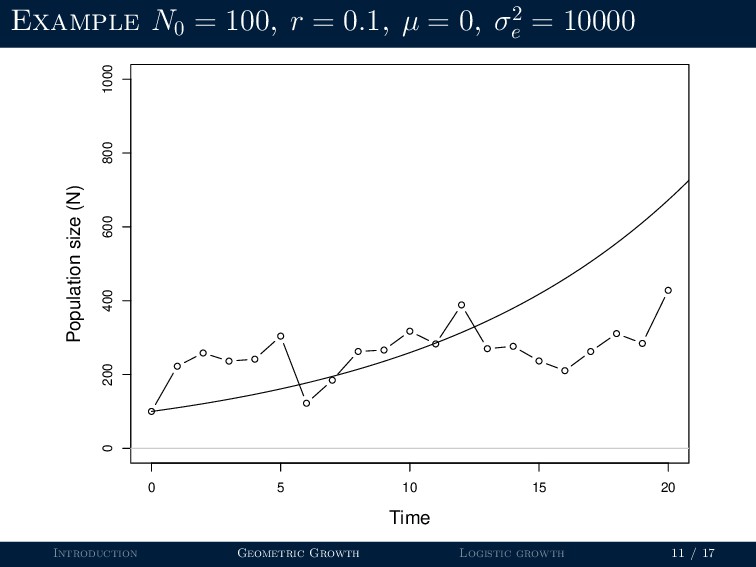
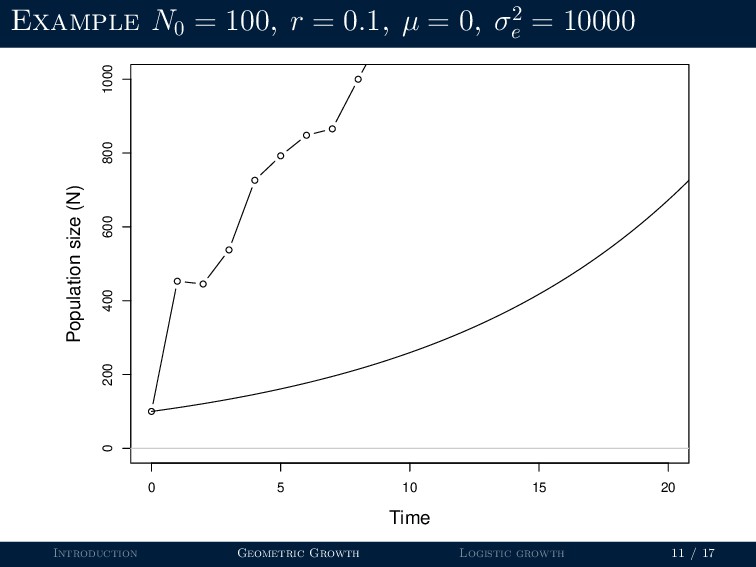
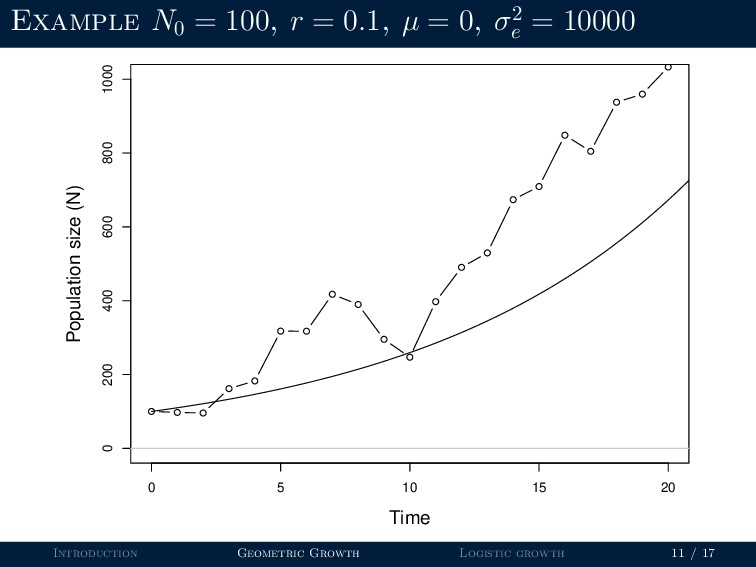
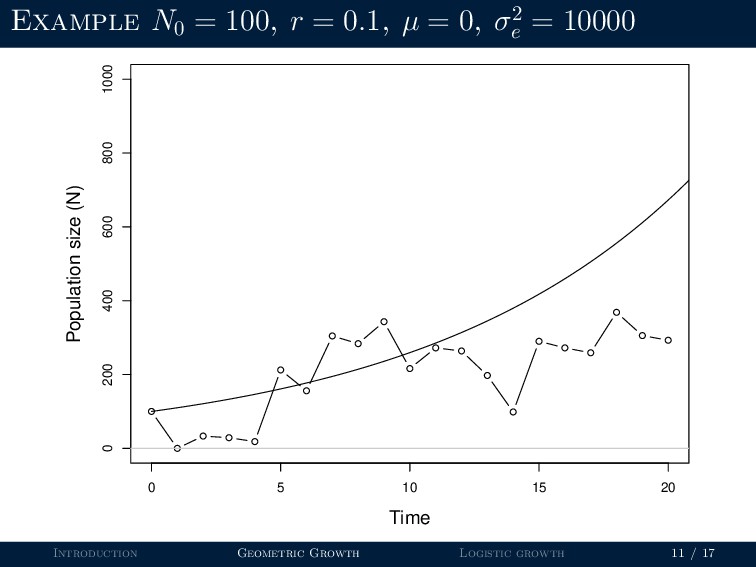
Example N0 = 100, r = 0.1, µ = 0,
σ2 e = 10000 q q q q q q q q q q q q q q q q q q 0 5 10 15 20 0 200 400 600 800 1000 Time Population size (N) Introduction Geometric Growth Logistic growth 11 / 17 -
Example N0 = 100, r = 0.1, µ = 0,
σ2 e = 10000 q q q q q q q q q q q q q q q q q q q q q 0 5 10 15 20 0 200 400 600 800 1000 Time Population size (N) Introduction Geometric Growth Logistic growth 11 / 17 -
Example N0 = 100, r = 0.1, µ = 0,
σ2 e = 10000 q q q q q q q q q q q q q q q q q q q q q 0 5 10 15 20 0 200 400 600 800 1000 Time Population size (N) Introduction Geometric Growth Logistic growth 11 / 17 -
Example N0 = 100, r = 0.1, µ = 0,
σ2 e = 10000 q q q q q q q q q q q q 0 5 10 15 20 0 200 400 600 800 1000 Time Population size (N) Introduction Geometric Growth Logistic growth 11 / 17 -
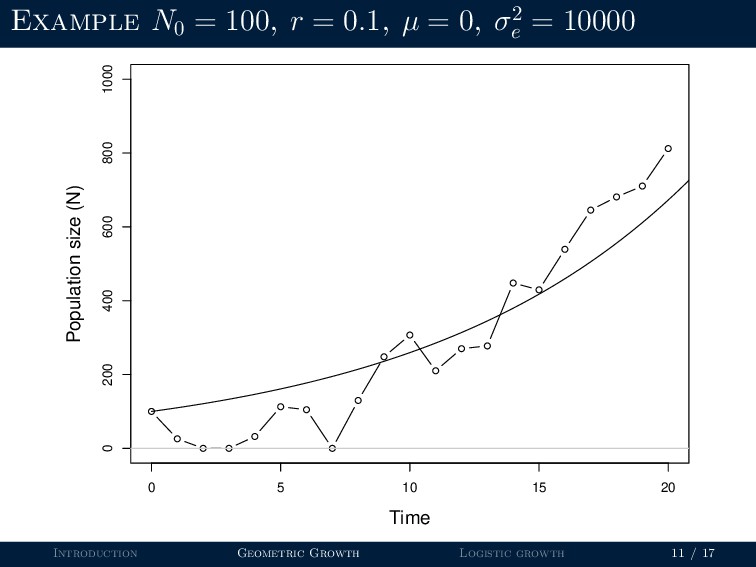
Example N0 = 100, r = 0.1, µ = 0,
σ2 e = 10000 q q q q q q q q q q q q q q q q q q q q q 0 5 10 15 20 0 200 400 600 800 1000 Time Population size (N) Introduction Geometric Growth Logistic growth 11 / 17 -
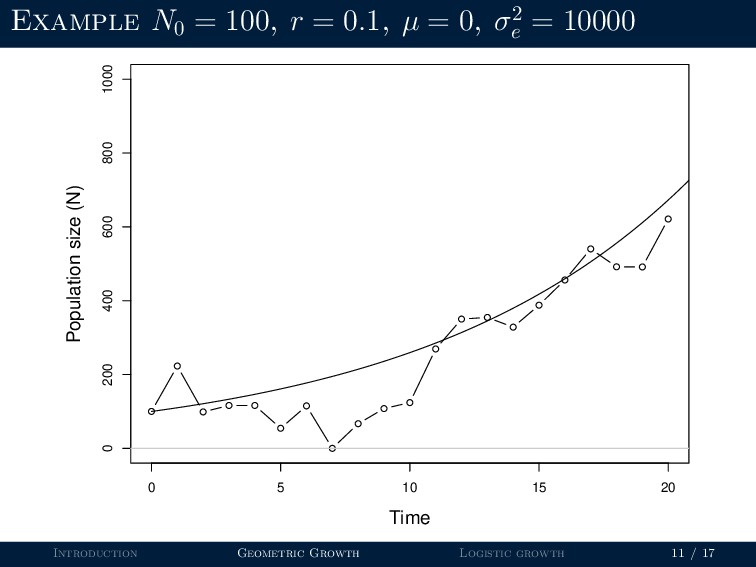
Example N0 = 100, r = 0.1, µ = 0,
σ2 e = 10000 q q q q q q q q q q q q q q q q q q q q q 0 5 10 15 20 0 200 400 600 800 1000 Time Population size (N) Introduction Geometric Growth Logistic growth 11 / 17 -
Example N0 = 100, r = 0.1, µ = 0,
σ2 e = 10000 q q q q q q q q q q q q q q q q q q q 0 5 10 15 20 0 200 400 600 800 1000 Time Population size (N) Introduction Geometric Growth Logistic growth 11 / 17 -
Example N0 = 100, r = 0.1, µ = 0,
σ2 e = 10000 q q q q q q q q q q q q q q q q q q q q q 0 5 10 15 20 0 200 400 600 800 1000 Time Population size (N) Introduction Geometric Growth Logistic growth 11 / 17 -
Example N0 = 100, r = 0.1, µ = 0,
σ2 e = 10000 q q q q q q q q q q q q q q q q q q q q q 0 5 10 15 20 0 200 400 600 800 1000 Time Population size (N) Introduction Geometric Growth Logistic growth 11 / 17 -
Example N0 = 100, r = 0.1, µ = 0,
σ2 e = 10000 q q q q q q q q q 0 5 10 15 20 0 200 400 600 800 1000 Time Population size (N) Introduction Geometric Growth Logistic growth 11 / 17 -
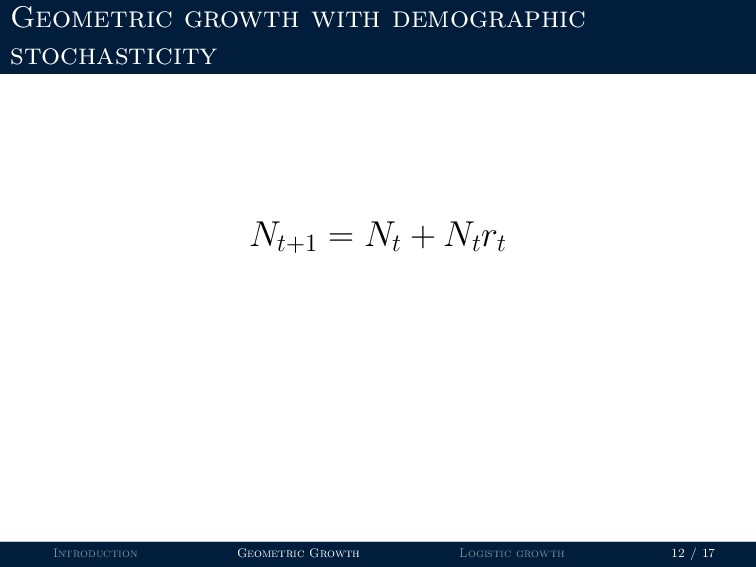
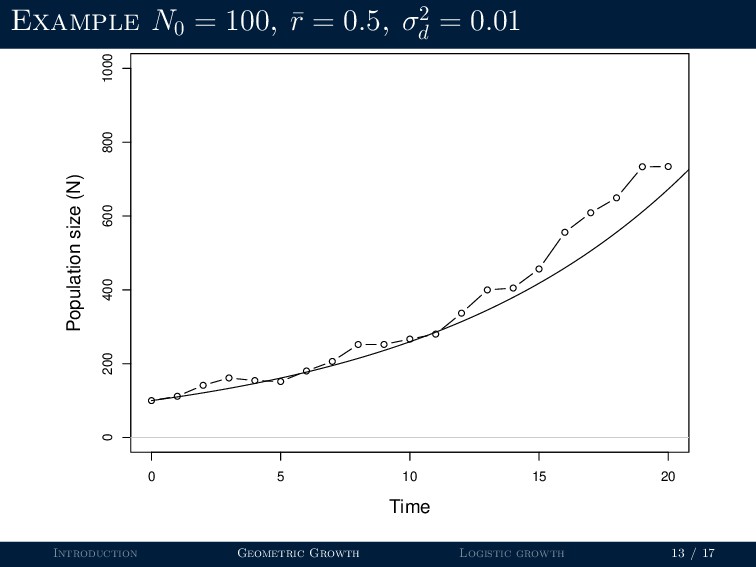
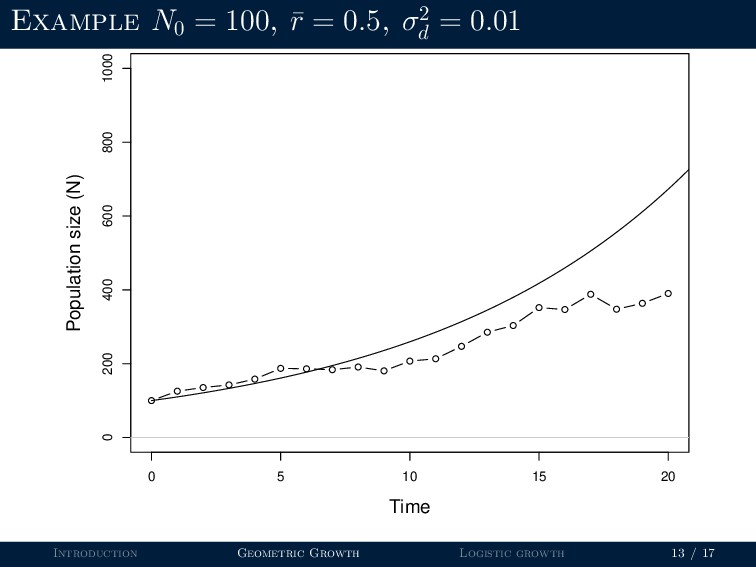
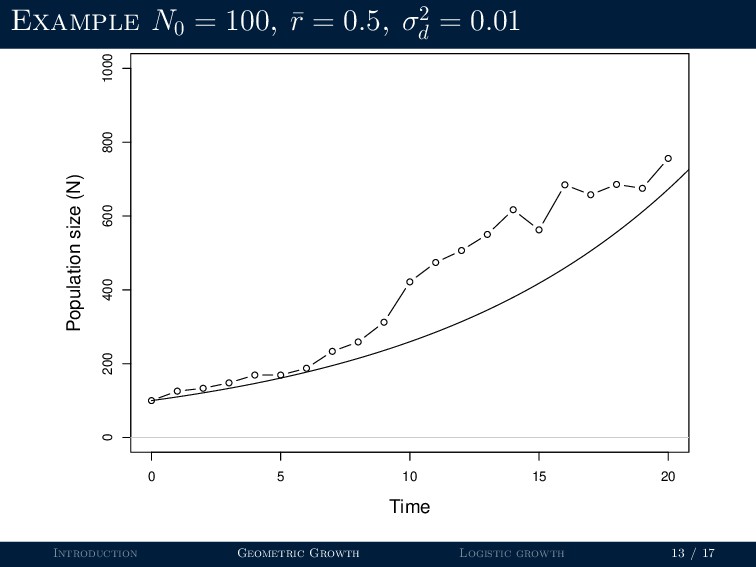
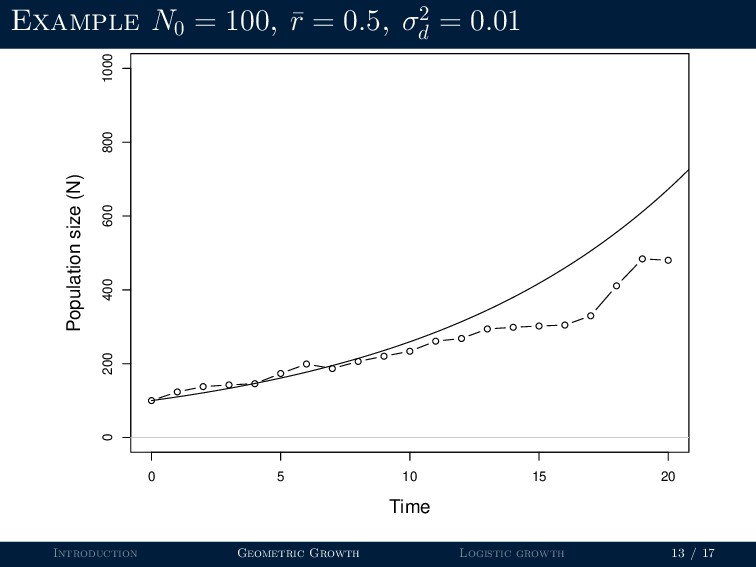
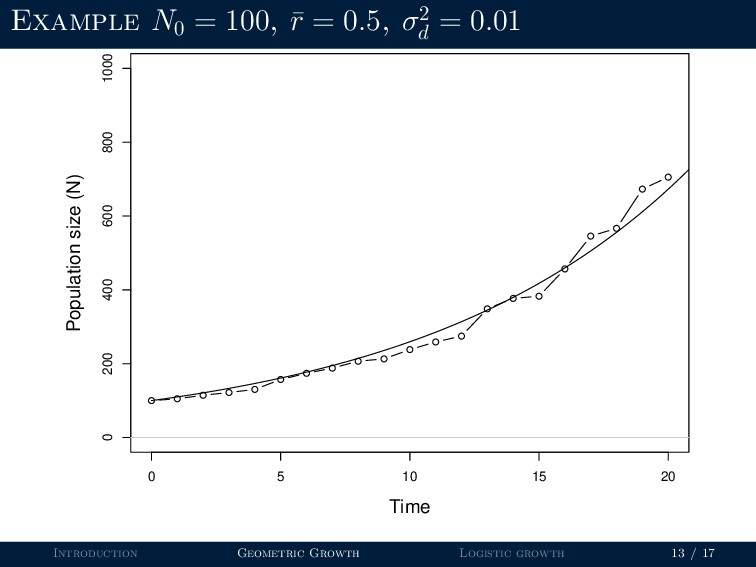
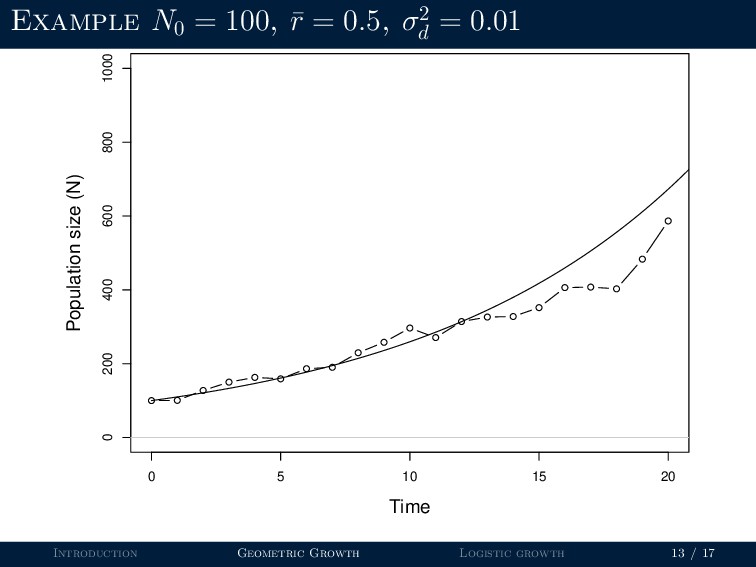
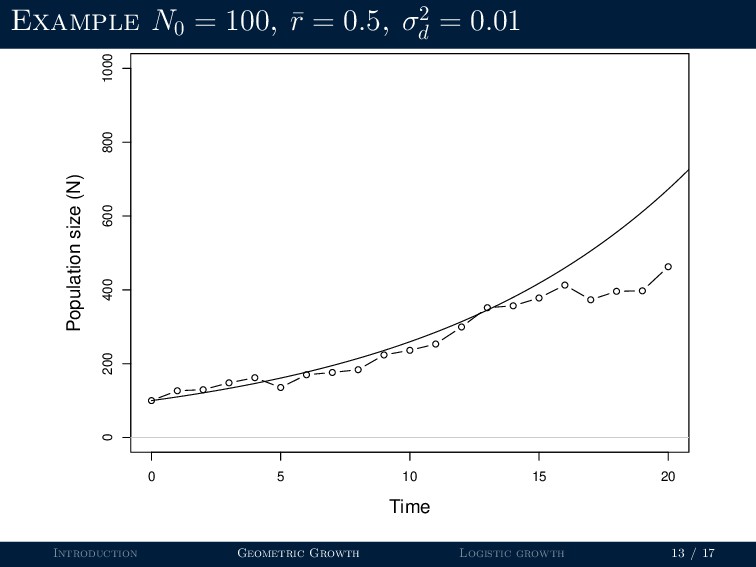
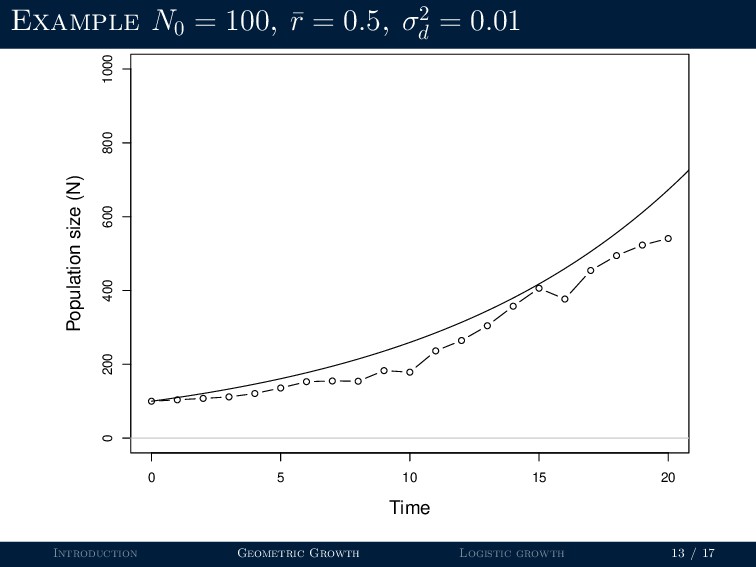
Geometric growth with demographic stochasticity Nt+1 = Nt + Nt
rt Introduction Geometric Growth Logistic growth 12 / 17 -
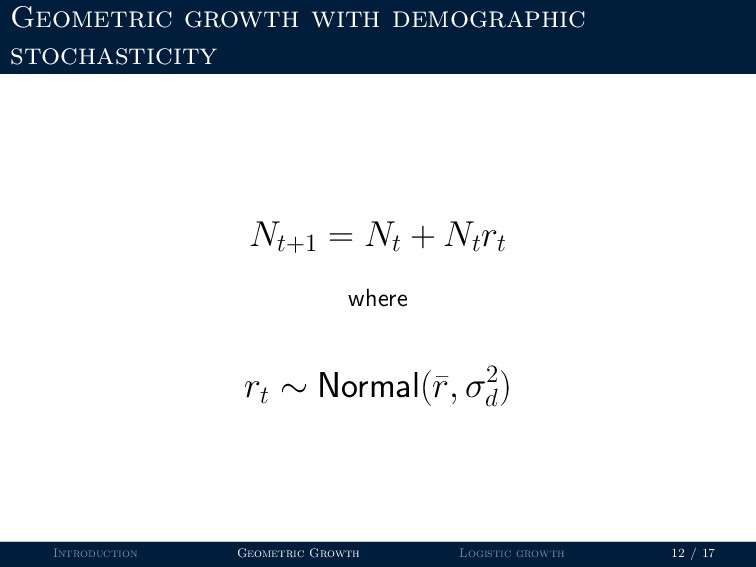
Geometric growth with demographic stochasticity Nt+1 = Nt + Nt
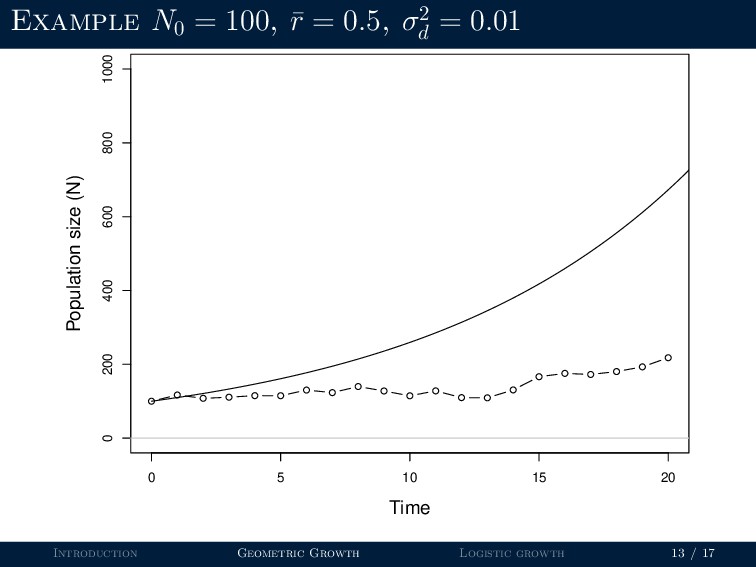
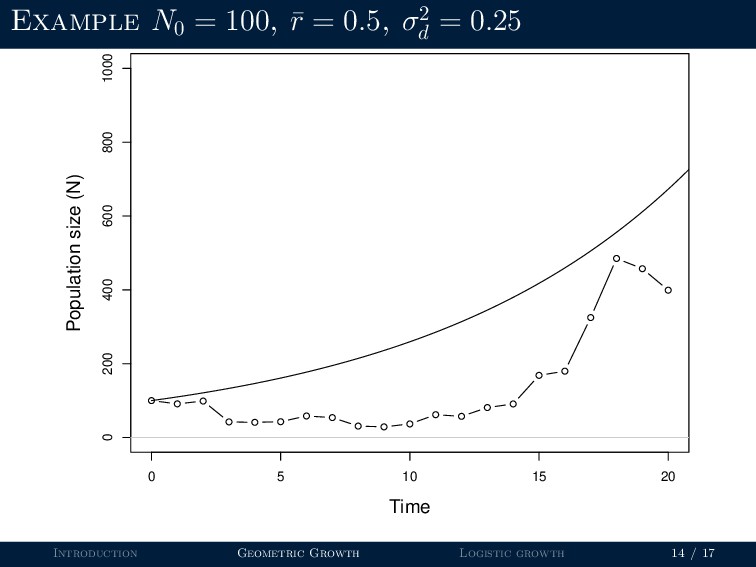
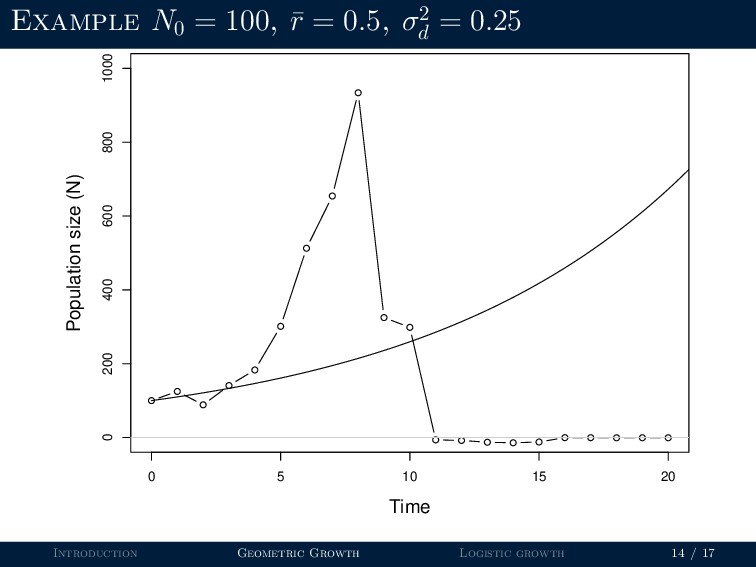
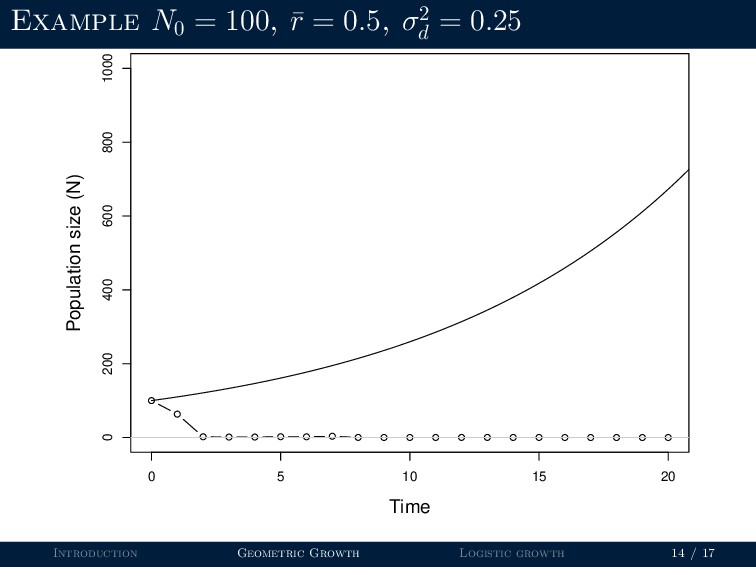
rt where rt ∼ Normal(¯ r, σ2 d ) Introduction Geometric Growth Logistic growth 12 / 17 -
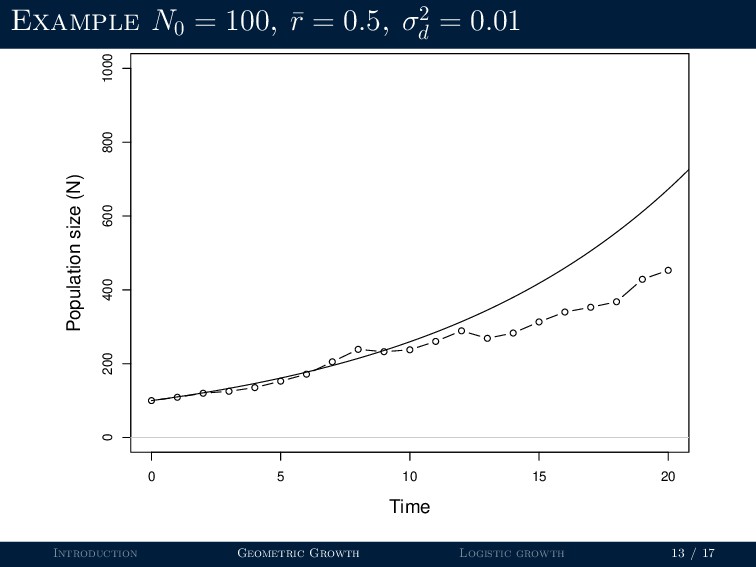
Example N0 = 100, ¯ r = 0.5, σ2 d
= 0.01 q q q q q q q q q q q q q q q q q q q q q 0 5 10 15 20 0 200 400 600 800 1000 Time Population size (N) Introduction Geometric Growth Logistic growth 13 / 17 -
Example N0 = 100, ¯ r = 0.5, σ2 d
= 0.01 q q q q q q q q q q q q q q q q q q q q q 0 5 10 15 20 0 200 400 600 800 1000 Time Population size (N) Introduction Geometric Growth Logistic growth 13 / 17 -
Example N0 = 100, ¯ r = 0.5, σ2 d
= 0.01 q q q q q q q q q q q q q q q q q q q q q 0 5 10 15 20 0 200 400 600 800 1000 Time Population size (N) Introduction Geometric Growth Logistic growth 13 / 17 -
Example N0 = 100, ¯ r = 0.5, σ2 d
= 0.01 q q q q q q q q q q q q q q q q q q q q q 0 5 10 15 20 0 200 400 600 800 1000 Time Population size (N) Introduction Geometric Growth Logistic growth 13 / 17 -
Example N0 = 100, ¯ r = 0.5, σ2 d
= 0.01 q q q q q q q q q q q q q q q q q q q q q 0 5 10 15 20 0 200 400 600 800 1000 Time Population size (N) Introduction Geometric Growth Logistic growth 13 / 17 -
Example N0 = 100, ¯ r = 0.5, σ2 d
= 0.01 q q q q q q q q q q q q q q q q q q q q q 0 5 10 15 20 0 200 400 600 800 1000 Time Population size (N) Introduction Geometric Growth Logistic growth 13 / 17 -
Example N0 = 100, ¯ r = 0.5, σ2 d
= 0.01 q q q q q q q q q q q q q q q q q q q q q 0 5 10 15 20 0 200 400 600 800 1000 Time Population size (N) Introduction Geometric Growth Logistic growth 13 / 17 -
Example N0 = 100, ¯ r = 0.5, σ2 d
= 0.01 q q q q q q q q q q q q q q q q q q q q q 0 5 10 15 20 0 200 400 600 800 1000 Time Population size (N) Introduction Geometric Growth Logistic growth 13 / 17 -
Example N0 = 100, ¯ r = 0.5, σ2 d
= 0.01 q q q q q q q q q q q q q q q q q q q q q 0 5 10 15 20 0 200 400 600 800 1000 Time Population size (N) Introduction Geometric Growth Logistic growth 13 / 17 -
Example N0 = 100, ¯ r = 0.5, σ2 d
= 0.01 q q q q q q q q q q q q q q q q q q q q q 0 5 10 15 20 0 200 400 600 800 1000 Time Population size (N) Introduction Geometric Growth Logistic growth 13 / 17 -
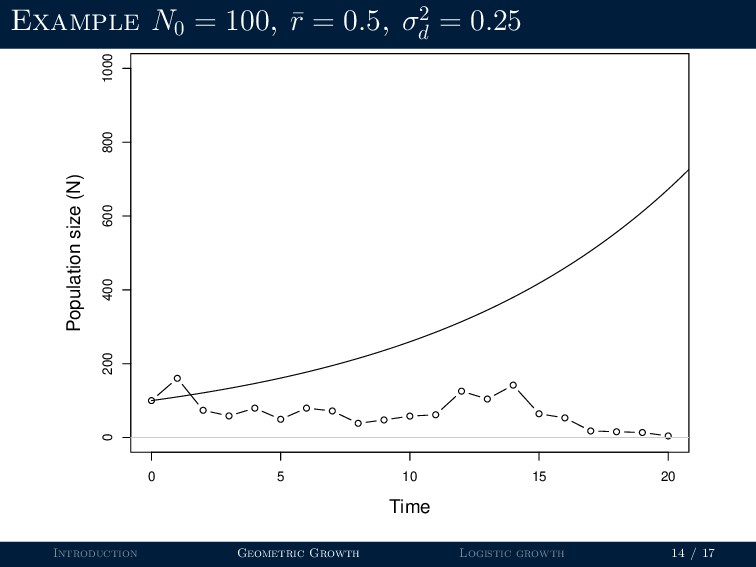
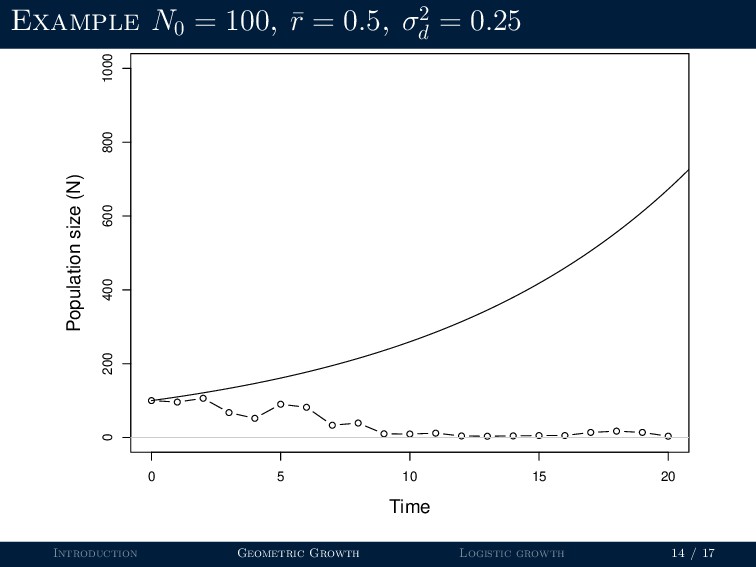
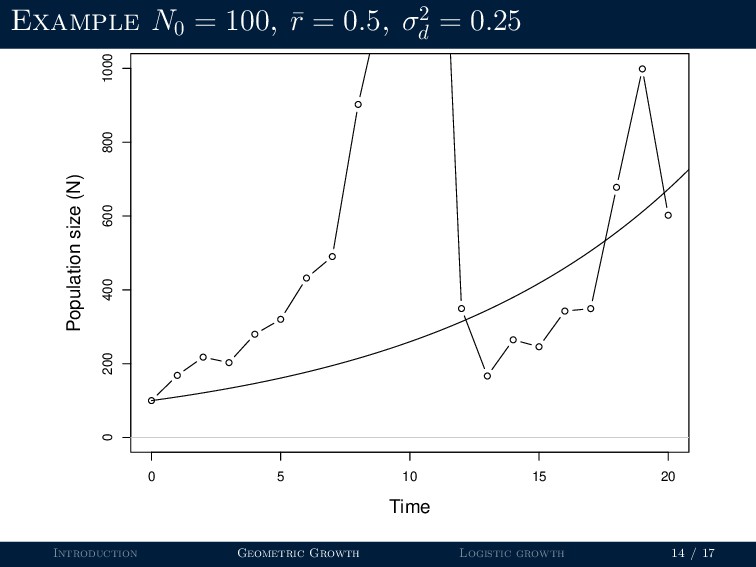
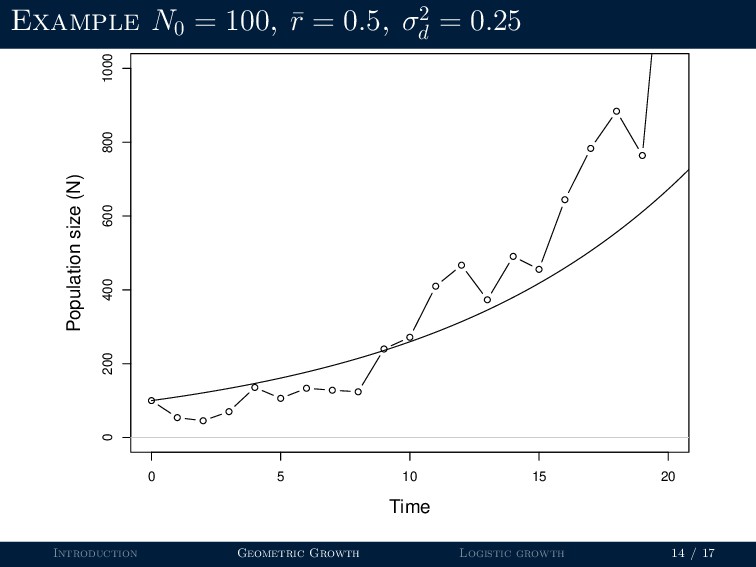
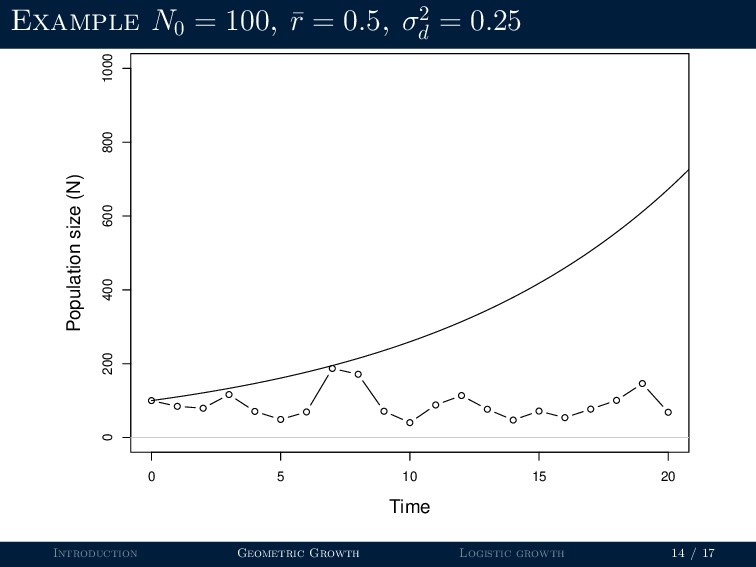
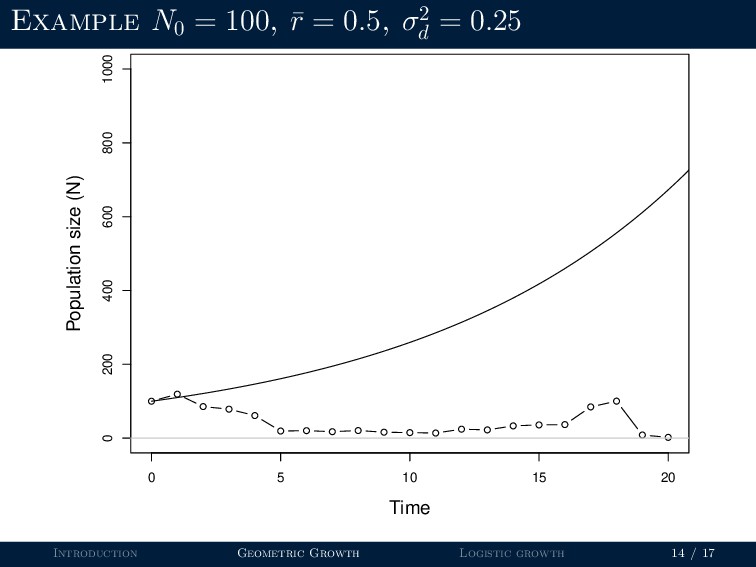
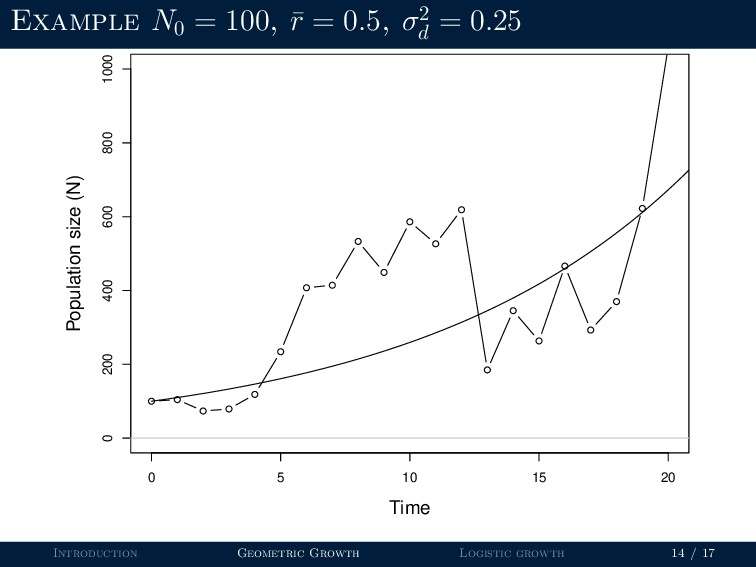
Example N0 = 100, ¯ r = 0.5, σ2 d
= 0.25 q q q q q q q q q q q q q q q q q q q q q 0 5 10 15 20 0 200 400 600 800 1000 Time Population size (N) Introduction Geometric Growth Logistic growth 14 / 17 -
Example N0 = 100, ¯ r = 0.5, σ2 d
= 0.25 q q q q q q q q q q q q q q q q q q q q q 0 5 10 15 20 0 200 400 600 800 1000 Time Population size (N) Introduction Geometric Growth Logistic growth 14 / 17 -
Example N0 = 100, ¯ r = 0.5, σ2 d
= 0.25 q q q q q q q q q q q q q q q q q q q q q 0 5 10 15 20 0 200 400 600 800 1000 Time Population size (N) Introduction Geometric Growth Logistic growth 14 / 17 -
Example N0 = 100, ¯ r = 0.5, σ2 d
= 0.25 q q q q q q q q q q q q q q q q q q q q q 0 5 10 15 20 0 200 400 600 800 1000 Time Population size (N) Introduction Geometric Growth Logistic growth 14 / 17 -
Example N0 = 100, ¯ r = 0.5, σ2 d
= 0.25 q q q q q q q q q q q q q q q q q q q q q 0 5 10 15 20 0 200 400 600 800 1000 Time Population size (N) Introduction Geometric Growth Logistic growth 14 / 17 -
Example N0 = 100, ¯ r = 0.5, σ2 d
= 0.25 q q q q q q q q q q q q q q q q q q 0 5 10 15 20 0 200 400 600 800 1000 Time Population size (N) Introduction Geometric Growth Logistic growth 14 / 17 -
Example N0 = 100, ¯ r = 0.5, σ2 d
= 0.25 q q q q q q q q q q q q q q q q q q q q 0 5 10 15 20 0 200 400 600 800 1000 Time Population size (N) Introduction Geometric Growth Logistic growth 14 / 17 -
Example N0 = 100, ¯ r = 0.5, σ2 d
= 0.25 q q q q q q q q q q q q q q q q q q q q q 0 5 10 15 20 0 200 400 600 800 1000 Time Population size (N) Introduction Geometric Growth Logistic growth 14 / 17 -
Example N0 = 100, ¯ r = 0.5, σ2 d
= 0.25 q q q q q q q q q q q q q q q q q q q q q 0 5 10 15 20 0 200 400 600 800 1000 Time Population size (N) Introduction Geometric Growth Logistic growth 14 / 17 -
Example N0 = 100, ¯ r = 0.5, σ2 d
= 0.25 q q q q q q q q q q q q q q q q q q q q q 0 5 10 15 20 0 200 400 600 800 1000 Time Population size (N) Introduction Geometric Growth Logistic growth 14 / 17 -
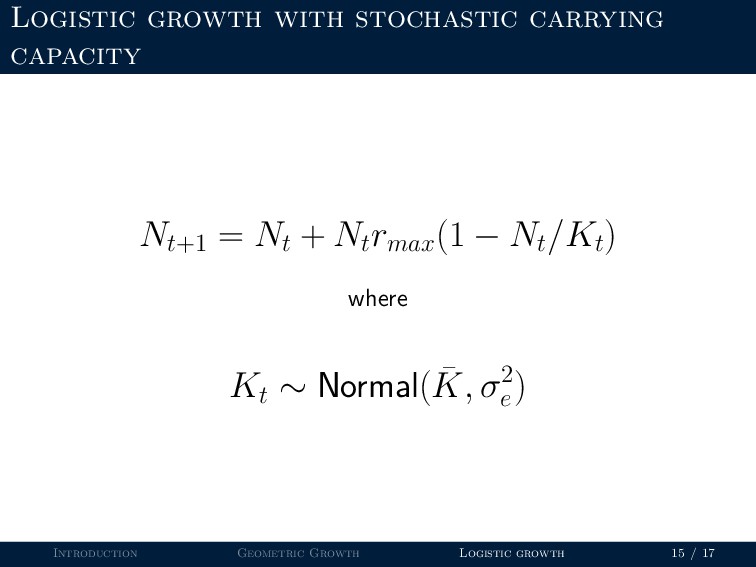
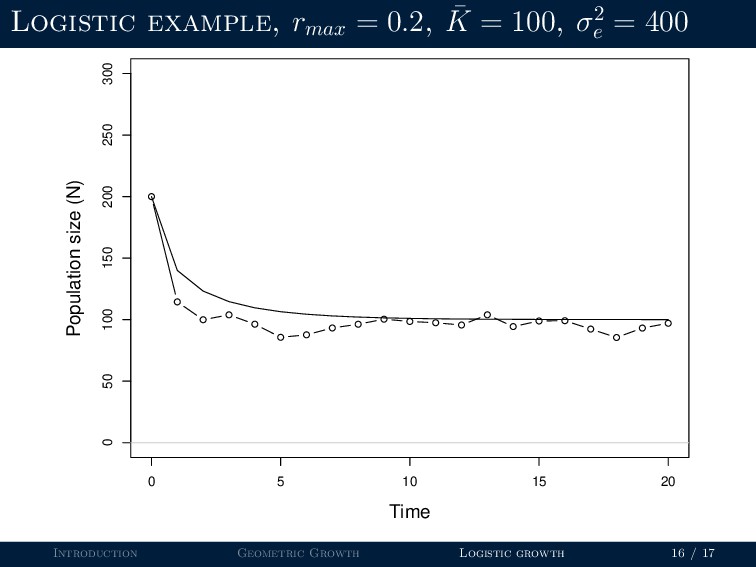
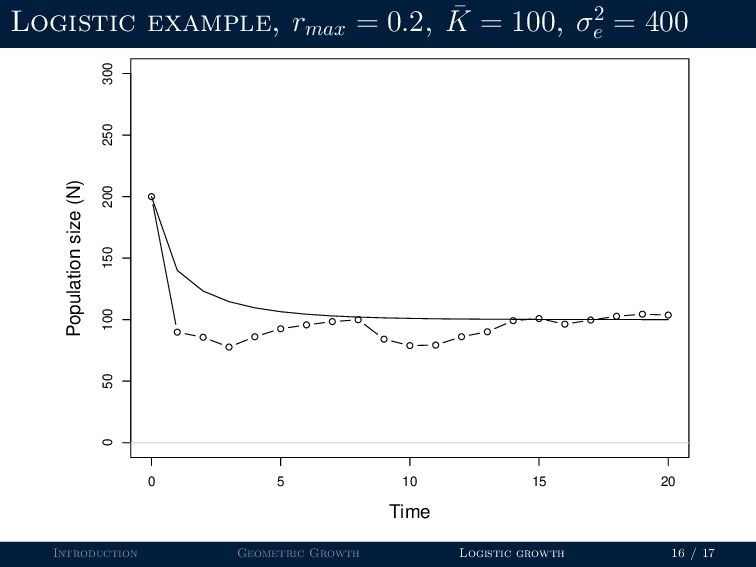
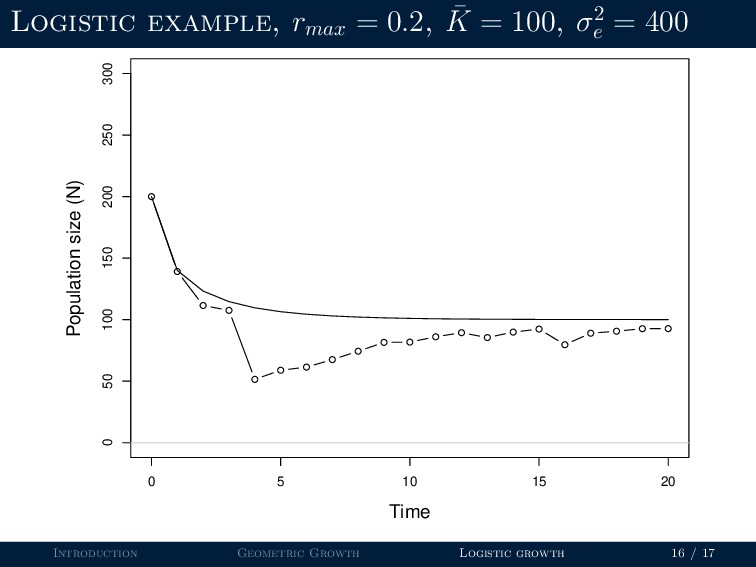
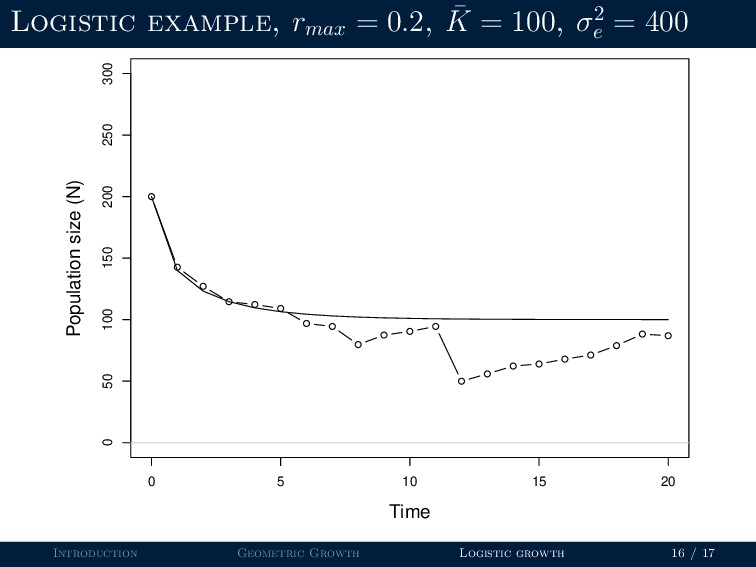
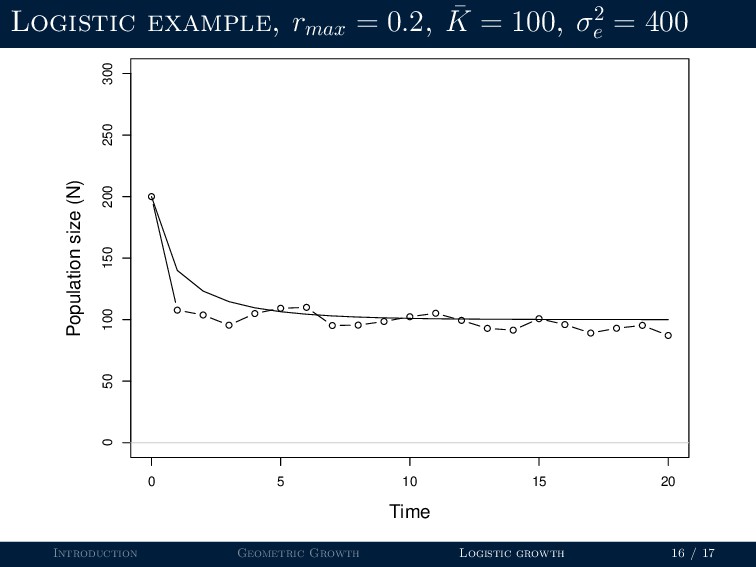
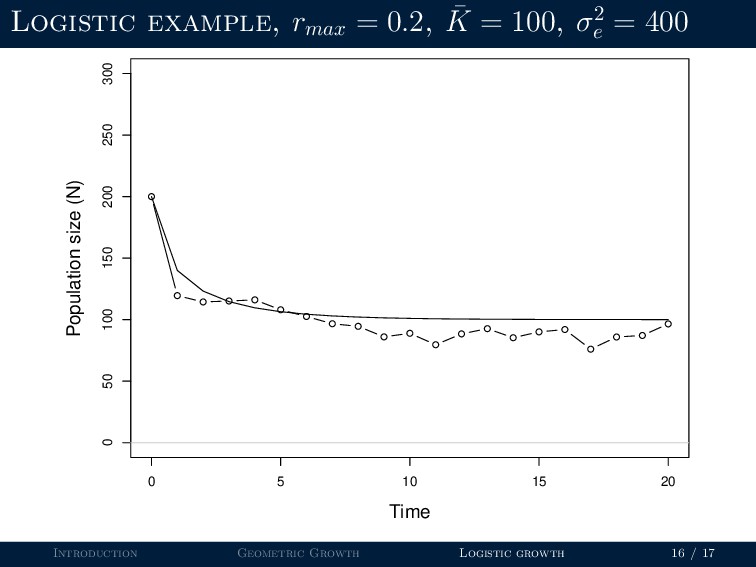
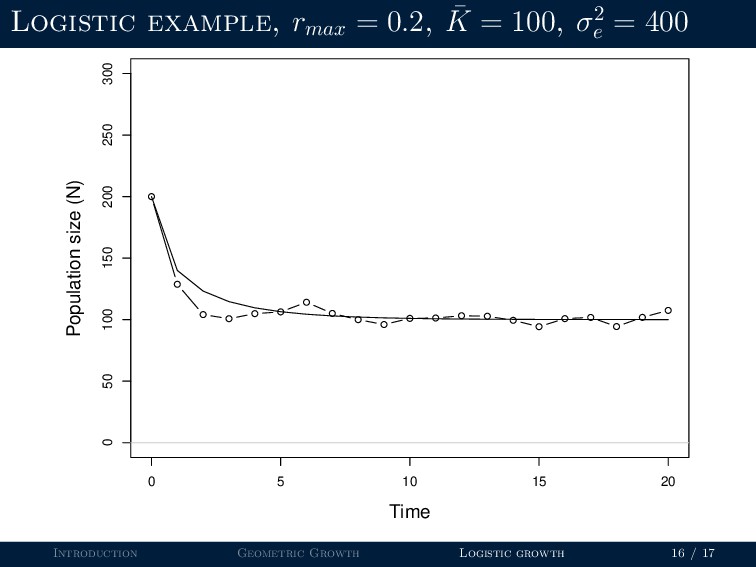
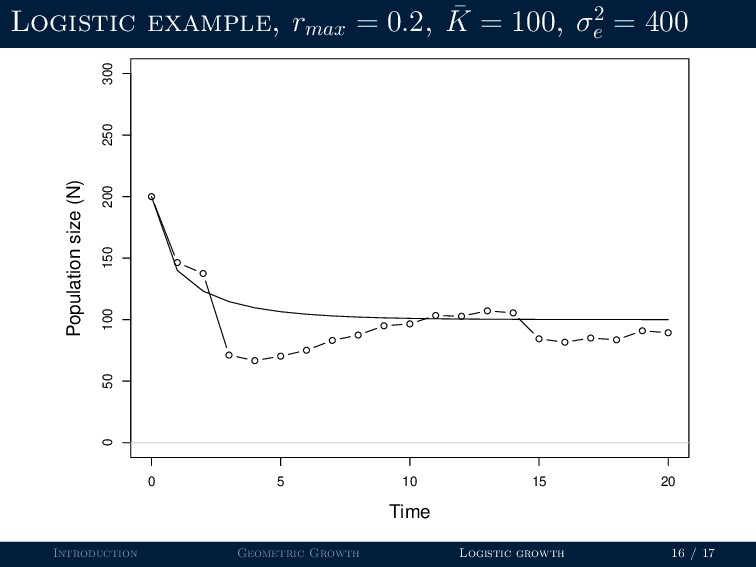
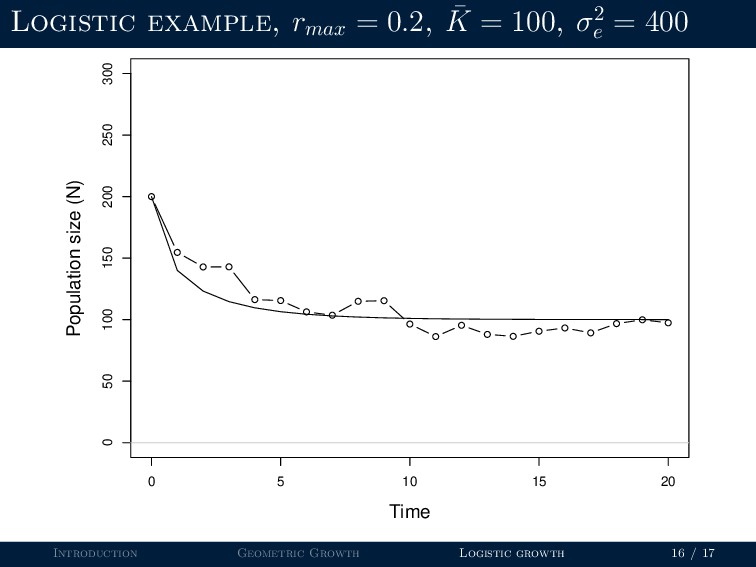
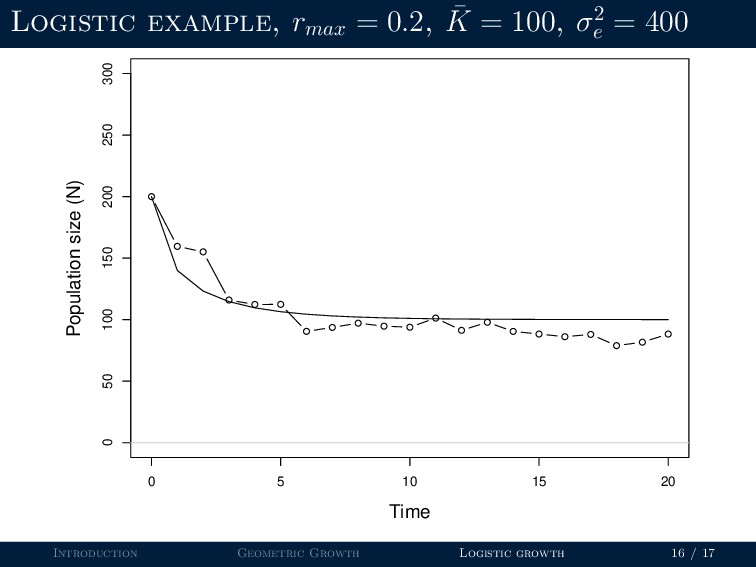
Logistic growth with stochastic carrying capacity Nt+1 = Nt +
Nt rmax (1 − Nt /Kt ) where Kt ∼ Normal( ¯ K, σ2 e ) Introduction Geometric Growth Logistic growth 15 / 17 -
Logistic example, rmax = 0.2, ¯ K = 100, σ2
e = 400 q q q q q q q q q q q q q q q q q q q q q 0 5 10 15 20 0 50 100 150 200 250 300 Time Population size (N) Introduction Geometric Growth Logistic growth 16 / 17 -
Logistic example, rmax = 0.2, ¯ K = 100, σ2
e = 400 q q q q q q q q q q q q q q q q q q q q q 0 5 10 15 20 0 50 100 150 200 250 300 Time Population size (N) Introduction Geometric Growth Logistic growth 16 / 17 -
Logistic example, rmax = 0.2, ¯ K = 100, σ2
e = 400 q q q q q q q q q q q q q q q q q q q q q 0 5 10 15 20 0 50 100 150 200 250 300 Time Population size (N) Introduction Geometric Growth Logistic growth 16 / 17 -
Logistic example, rmax = 0.2, ¯ K = 100, σ2
e = 400 q q q q q q q q q q q q q q q q q q q q q 0 5 10 15 20 0 50 100 150 200 250 300 Time Population size (N) Introduction Geometric Growth Logistic growth 16 / 17 -
Logistic example, rmax = 0.2, ¯ K = 100, σ2
e = 400 q q q q q q q q q q q q q q q q q q q q q 0 5 10 15 20 0 50 100 150 200 250 300 Time Population size (N) Introduction Geometric Growth Logistic growth 16 / 17 -
Logistic example, rmax = 0.2, ¯ K = 100, σ2
e = 400 q q q q q q q q q q q q q q q q q q q q q 0 5 10 15 20 0 50 100 150 200 250 300 Time Population size (N) Introduction Geometric Growth Logistic growth 16 / 17 -
Logistic example, rmax = 0.2, ¯ K = 100, σ2
e = 400 q q q q q q q q q q q q q q q q q q q q q 0 5 10 15 20 0 50 100 150 200 250 300 Time Population size (N) Introduction Geometric Growth Logistic growth 16 / 17 -
Logistic example, rmax = 0.2, ¯ K = 100, σ2
e = 400 q q q q q q q q q q q q q q q q q q q q q 0 5 10 15 20 0 50 100 150 200 250 300 Time Population size (N) Introduction Geometric Growth Logistic growth 16 / 17 -
Logistic example, rmax = 0.2, ¯ K = 100, σ2
e = 400 q q q q q q q q q q q q q q q q q q q q q 0 5 10 15 20 0 50 100 150 200 250 300 Time Population size (N) Introduction Geometric Growth Logistic growth 16 / 17 -
Logistic example, rmax = 0.2, ¯ K = 100, σ2
e = 400 q q q q q q q q q q q q q q q q q q q q q 0 5 10 15 20 0 50 100 150 200 250 300 Time Population size (N) Introduction Geometric Growth Logistic growth 16 / 17 -
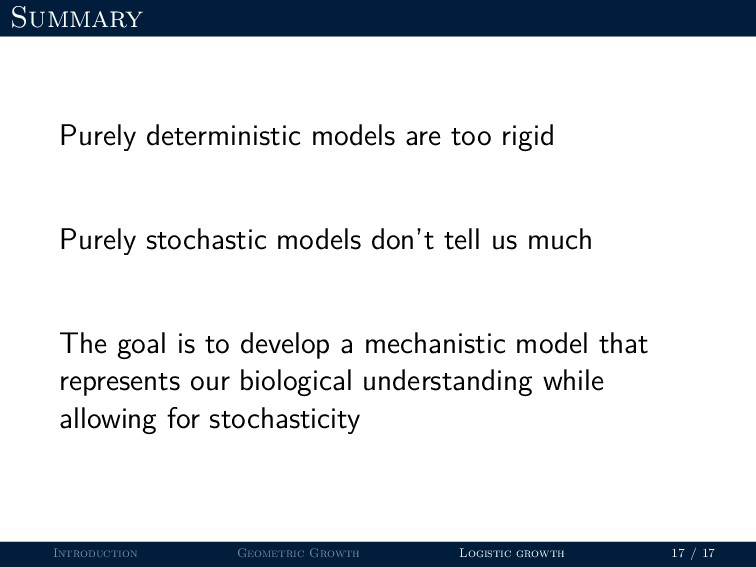
Summary Purely deterministic models are too rigid Purely stochastic models
don’t tell us much The goal is to develop a mechanistic model that represents our biological understanding while allowing for stochasticity Introduction Geometric Growth Logistic growth 17 / 17