rates will differ between populations with different age structures. Some age classes contribute more to population growth than others. Introduction Matrix Models Reproductive value Stage-structured models 3 / 28
rates will differ between populations with different age structures. Some age classes contribute more to population growth than others. This has important management implications. Introduction Matrix Models Reproductive value Stage-structured models 3 / 28
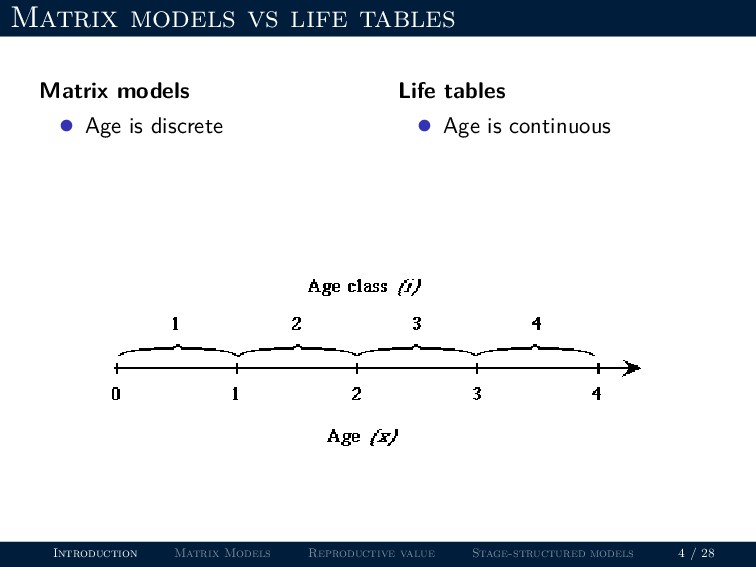
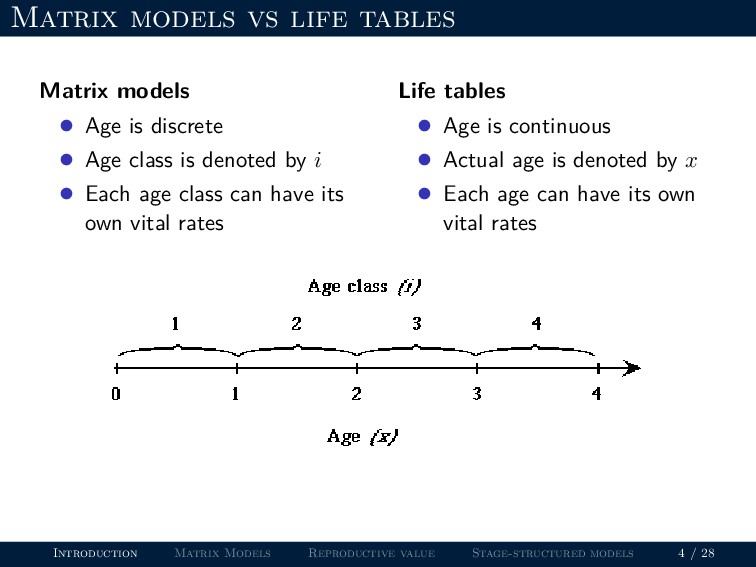
discrete • Age class is denoted by i Life tables • Age is continuous • Actual age is denoted by x Introduction Matrix Models Reproductive value Stage-structured models 4 / 28
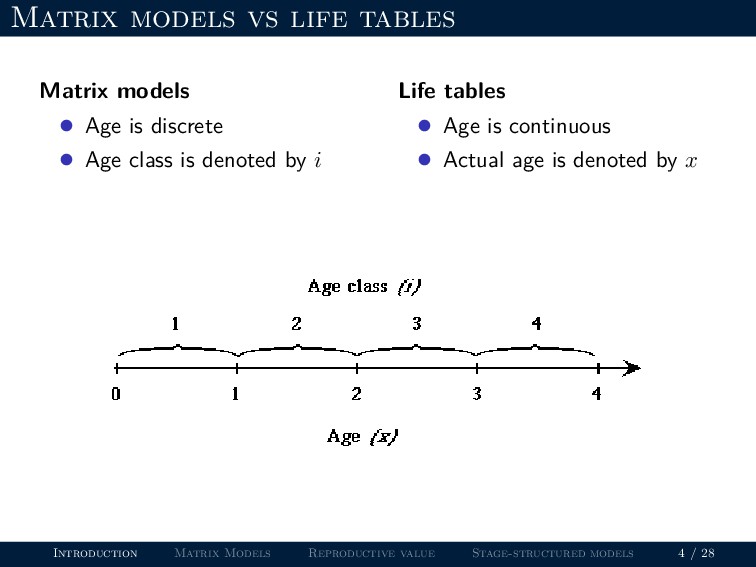
discrete • Age class is denoted by i • Each age class can have its own vital rates Life tables • Age is continuous • Actual age is denoted by x • Each age can have its own vital rates Introduction Matrix Models Reproductive value Stage-structured models 4 / 28
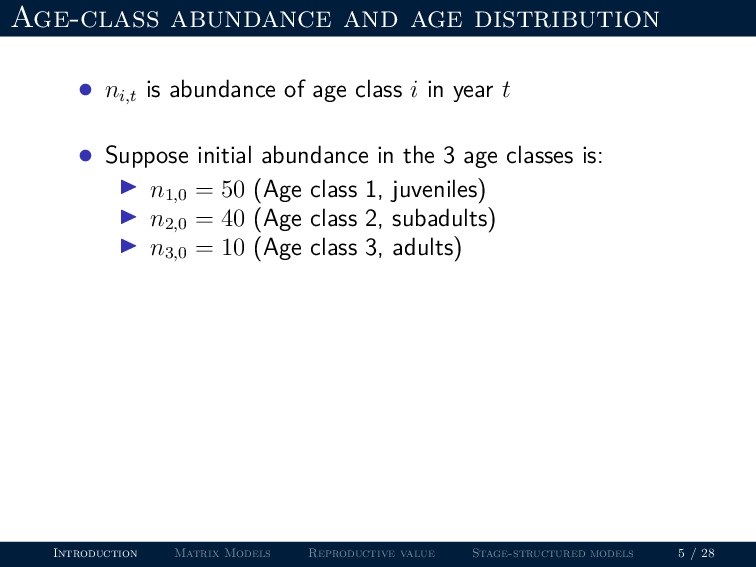
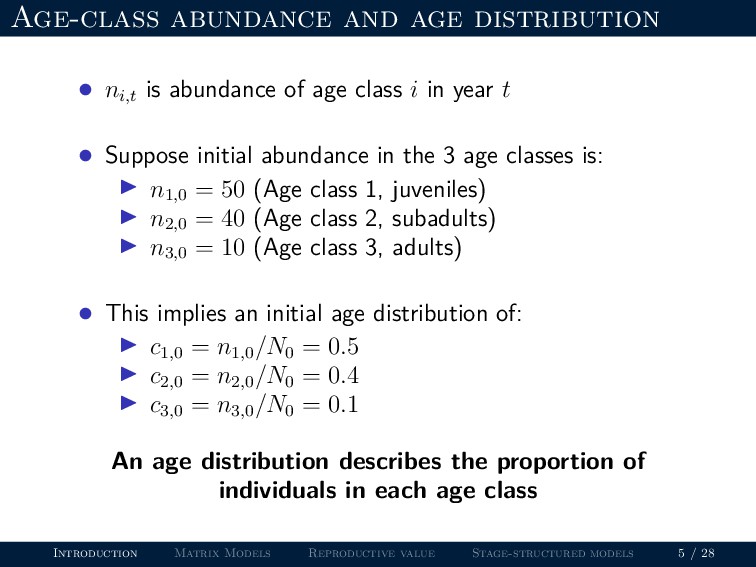
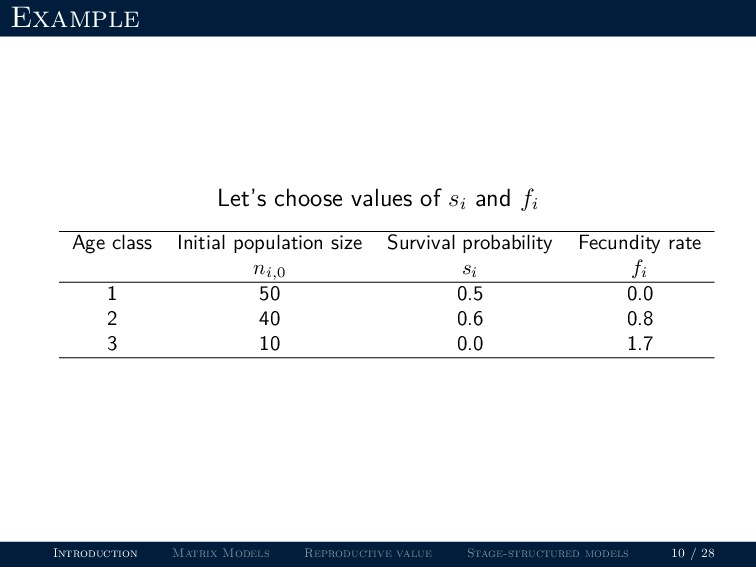
age class i in year t • Suppose initial abundance in the 3 age classes is: n1,0 = 50 (Age class 1, juveniles) n2,0 = 40 (Age class 2, subadults) n3,0 = 10 (Age class 3, adults) Introduction Matrix Models Reproductive value Stage-structured models 5 / 28
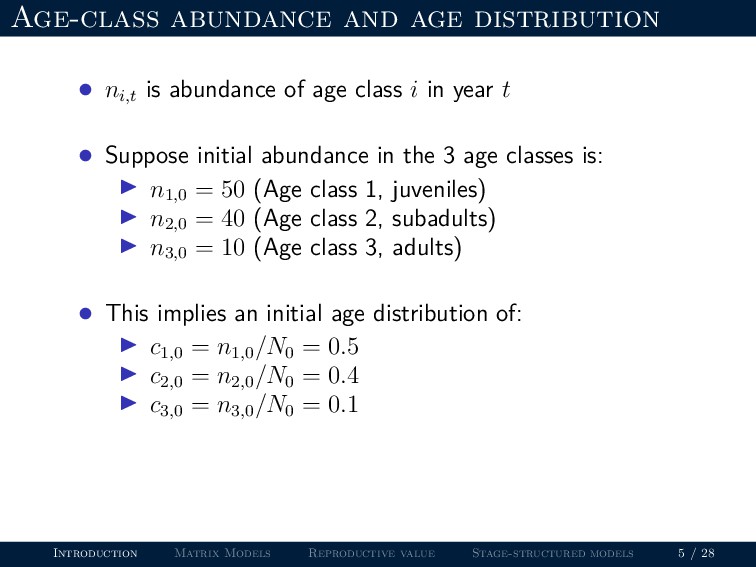
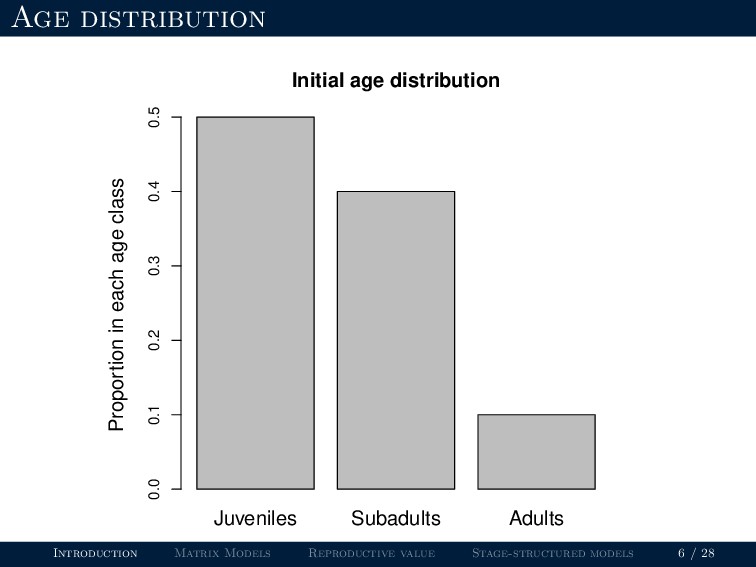
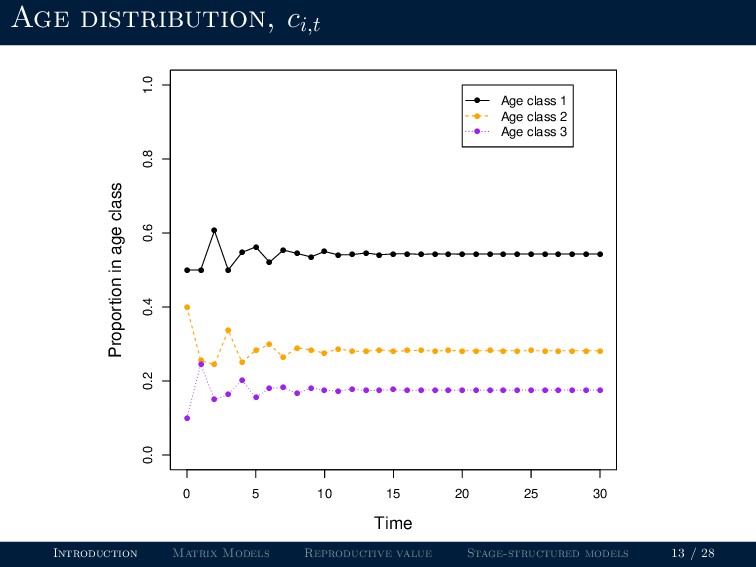
age class i in year t • Suppose initial abundance in the 3 age classes is: n1,0 = 50 (Age class 1, juveniles) n2,0 = 40 (Age class 2, subadults) n3,0 = 10 (Age class 3, adults) • This implies an initial age distribution of: c1,0 = n1,0 /N0 = 0.5 c2,0 = n2,0 /N0 = 0.4 c3,0 = n3,0 /N0 = 0.1 Introduction Matrix Models Reproductive value Stage-structured models 5 / 28
age class i in year t • Suppose initial abundance in the 3 age classes is: n1,0 = 50 (Age class 1, juveniles) n2,0 = 40 (Age class 2, subadults) n3,0 = 10 (Age class 3, adults) • This implies an initial age distribution of: c1,0 = n1,0 /N0 = 0.5 c2,0 = n2,0 /N0 = 0.4 c3,0 = n3,0 /N0 = 0.1 An age distribution describes the proportion of individuals in each age class Introduction Matrix Models Reproductive value Stage-structured models 5 / 28
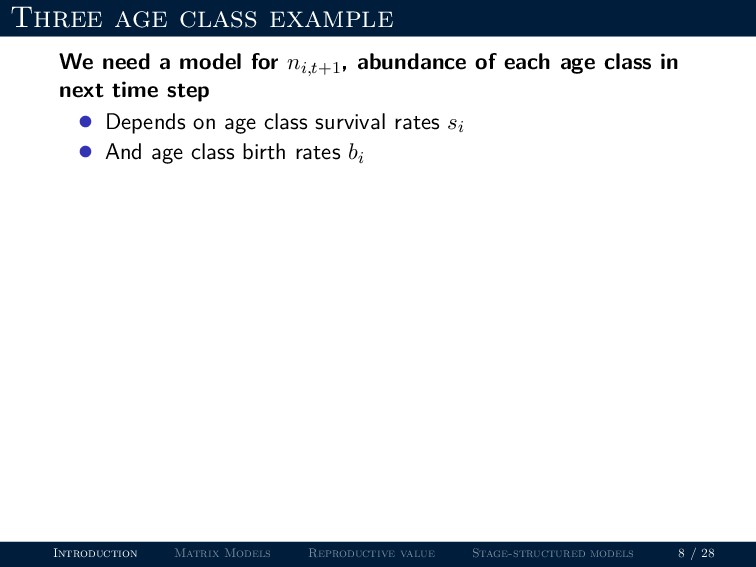
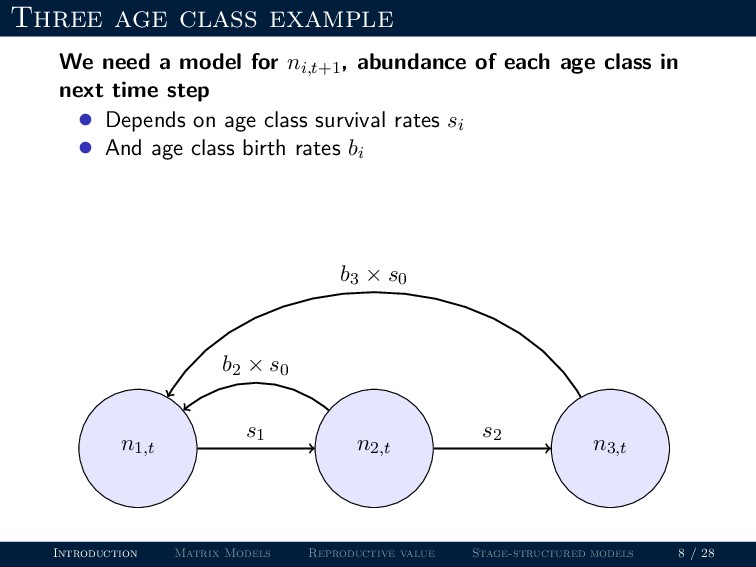
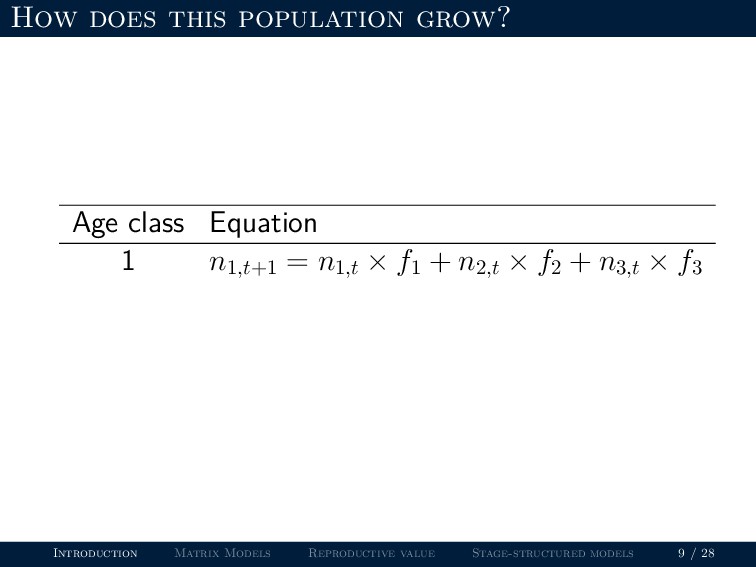
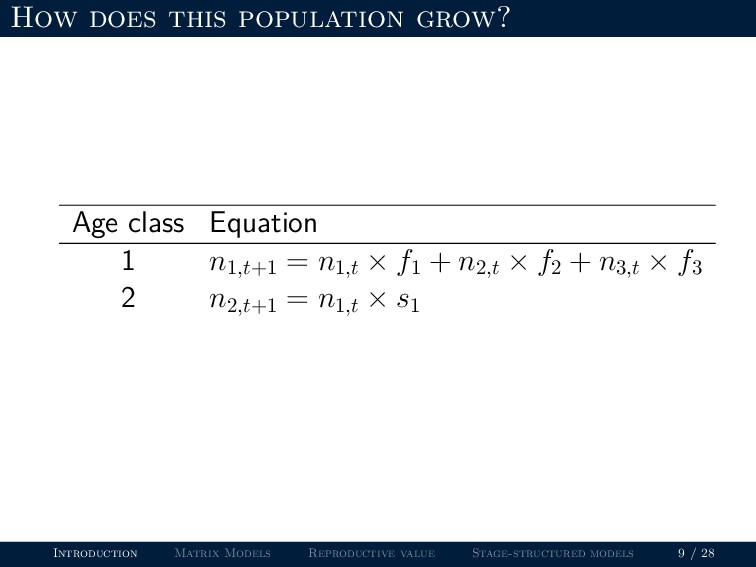
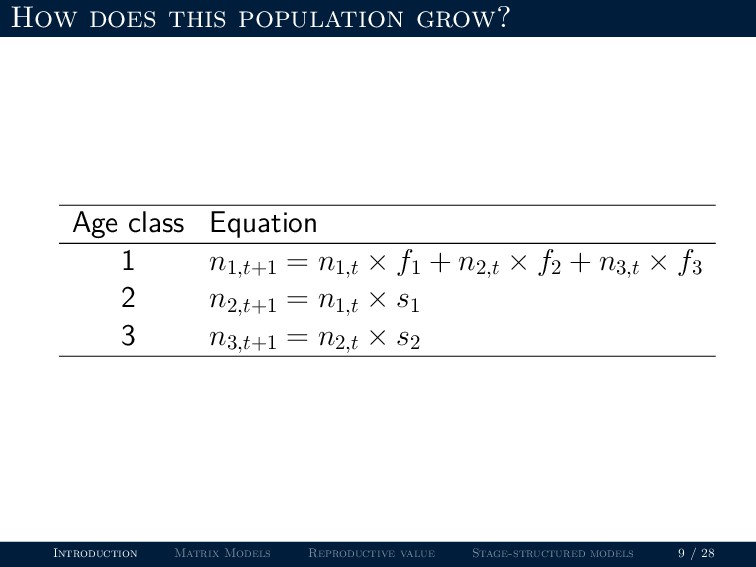
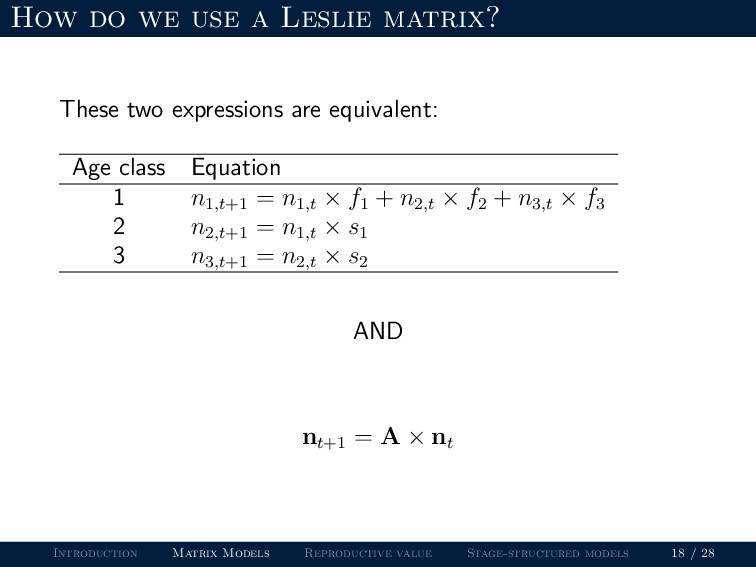
abundance of each age class in next time step • Depends on age class survival rates si • And age class birth rates bi Introduction Matrix Models Reproductive value Stage-structured models 8 / 28
abundance of each age class in next time step • Depends on age class survival rates si • And age class birth rates bi n1,t n2,t n3,t s1 s2 b2 × s0 b3 × s0 Introduction Matrix Models Reproductive value Stage-structured models 8 / 28
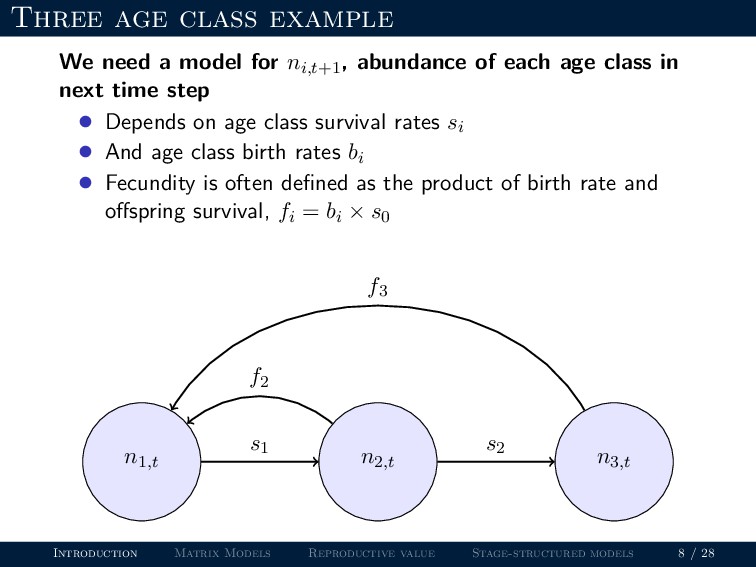
abundance of each age class in next time step • Depends on age class survival rates si • And age class birth rates bi • Fecundity is often defined as the product of birth rate and offspring survival, fi = bi × s0 n1,t n2,t n3,t s1 s2 f2 f3 Introduction Matrix Models Reproductive value Stage-structured models 8 / 28
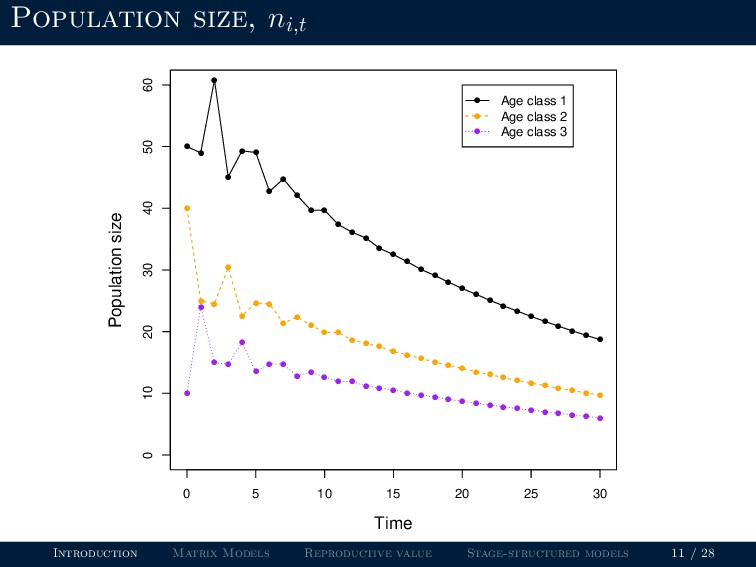
age distribution when survival and fecundity rates are constant. Stable age distribution is the proportion of individuals in each age class when the population converges. Introduction Matrix Models Reproductive value Stage-structured models 14 / 28
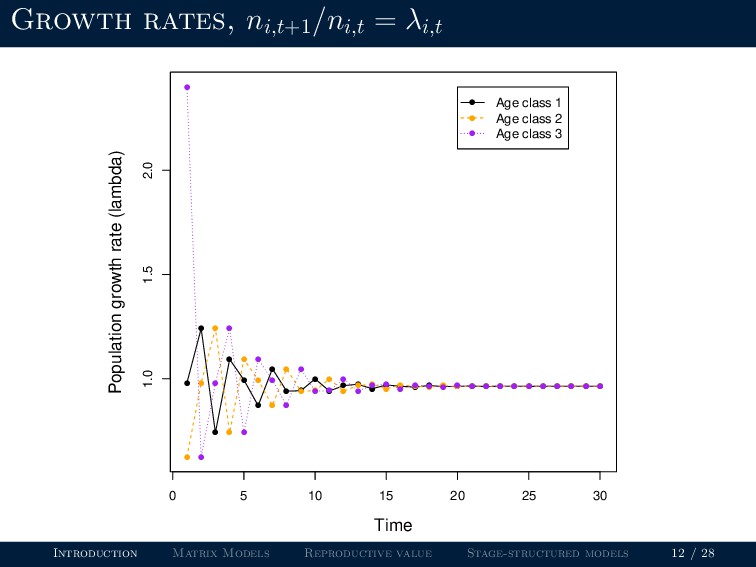
age distribution when survival and fecundity rates are constant. Stable age distribution is the proportion of individuals in each age class when the population converges. Growth rates of each age class differ at first, but converge once the stable age distribution is reached. Introduction Matrix Models Reproductive value Stage-structured models 14 / 28
age distribution when survival and fecundity rates are constant. Stable age distribution is the proportion of individuals in each age class when the population converges. Growth rates of each age class differ at first, but converge once the stable age distribution is reached. Asymptotic growth rate is λ (without subscript). Introduction Matrix Models Reproductive value Stage-structured models 14 / 28
age distribution when survival and fecundity rates are constant. Stable age distribution is the proportion of individuals in each age class when the population converges. Growth rates of each age class differ at first, but converge once the stable age distribution is reached. Asymptotic growth rate is λ (without subscript). Growth rate at the stable age distribution is the same for all age classes, and it is geometric! Introduction Matrix Models Reproductive value Stage-structured models 14 / 28
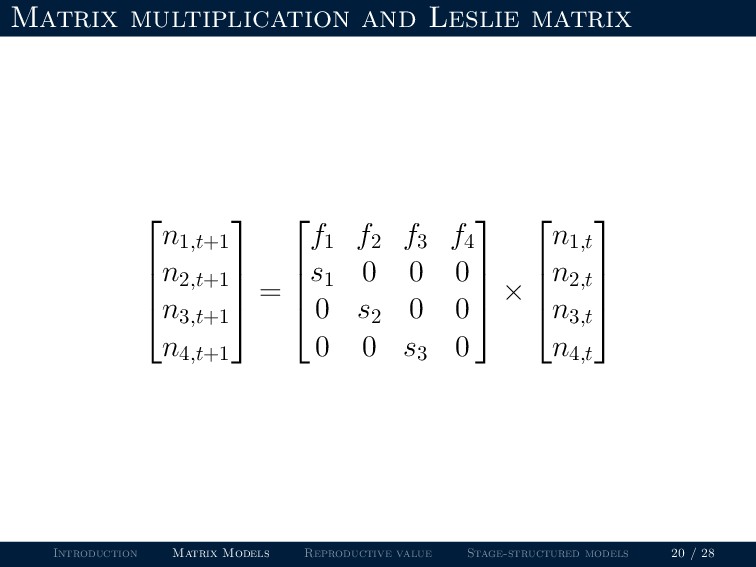
the same old models we have been talking about. But, they make it much easier to compute important quantities like λ and reproductive value. Introduction Matrix Models Reproductive value Stage-structured models 15 / 28
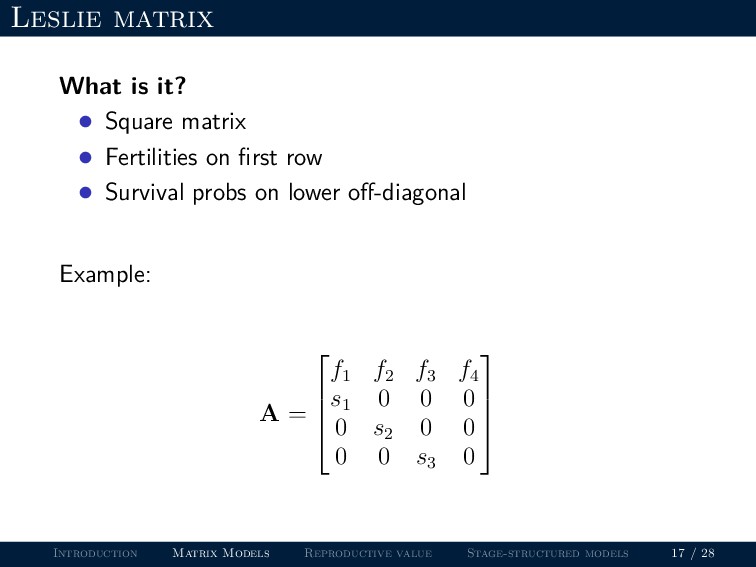
array of numbers • Usually denoted by an uppercase, bold letter • Either square or rounded brackets are used • Usually, rows are indexed by i, columns by j Introduction Matrix Models Reproductive value Stage-structured models 16 / 28
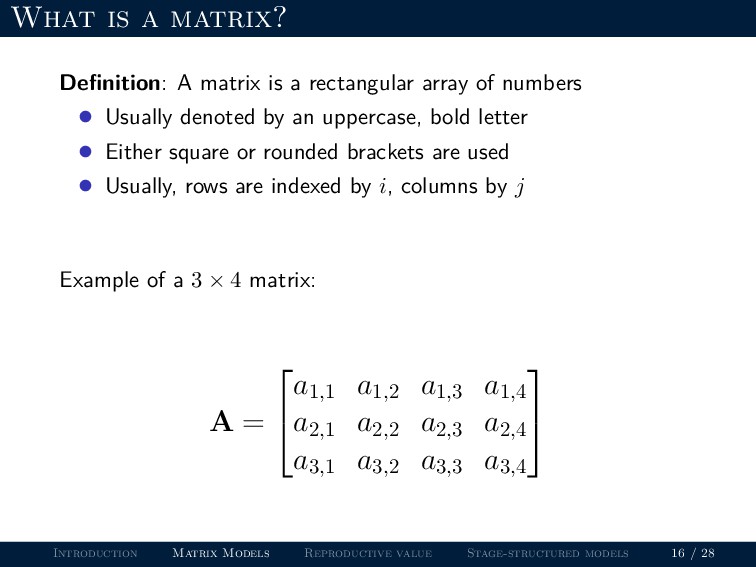
array of numbers • Usually denoted by an uppercase, bold letter • Either square or rounded brackets are used • Usually, rows are indexed by i, columns by j Example of a 3 × 4 matrix: A = a1,1 a1,2 a1,3 a1,4 a2,1 a2,2 a2,3 a2,4 a3,1 a3,2 a3,3 a3,4 Introduction Matrix Models Reproductive value Stage-structured models 16 / 28
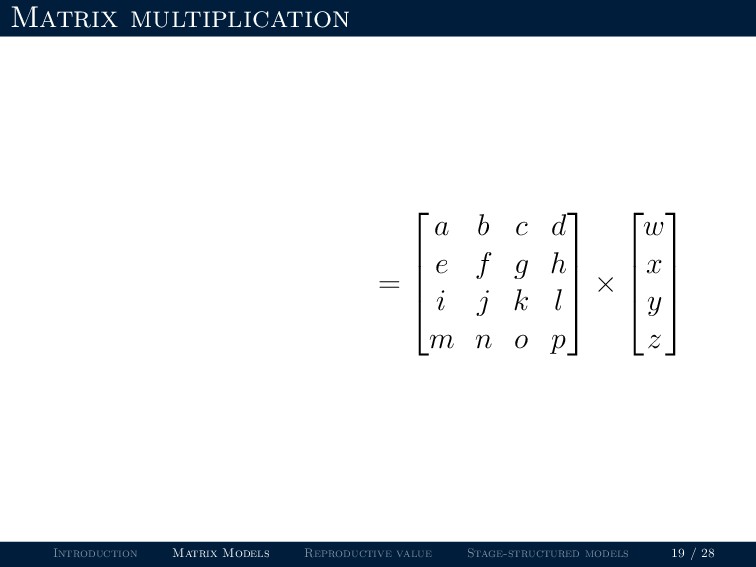
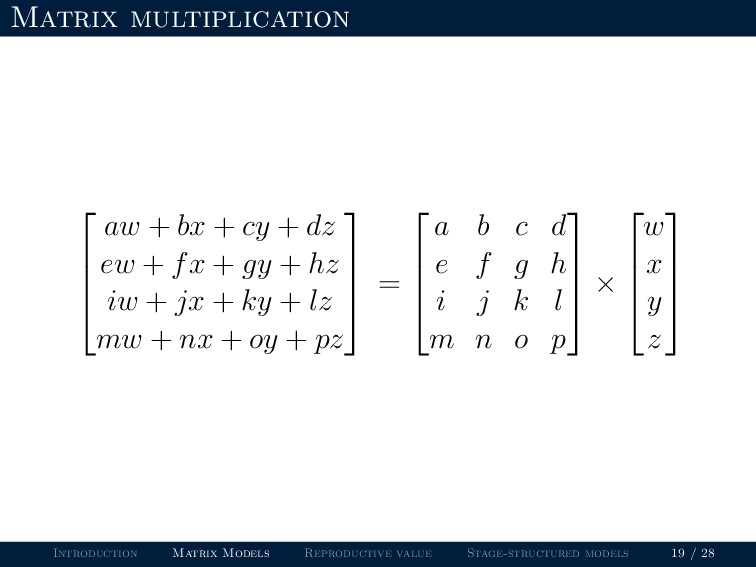
cy + dz ew + fx + gy + hz iw + jx + ky + lz mw + nx + oy + pz = a b c d e f g h i j k l m n o p × w x y z Introduction Matrix Models Reproductive value Stage-structured models 19 / 28
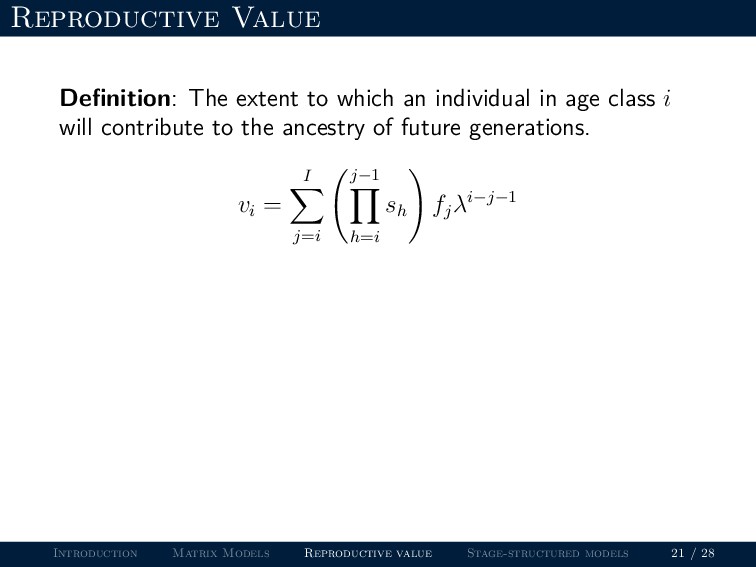
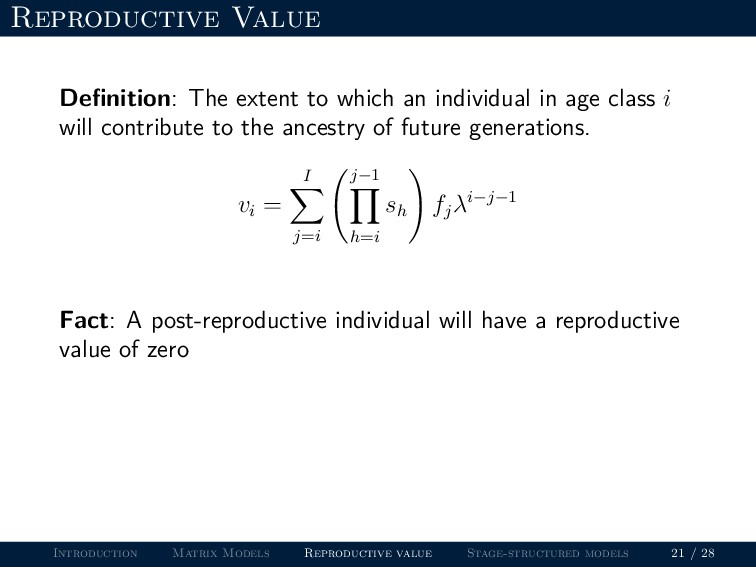
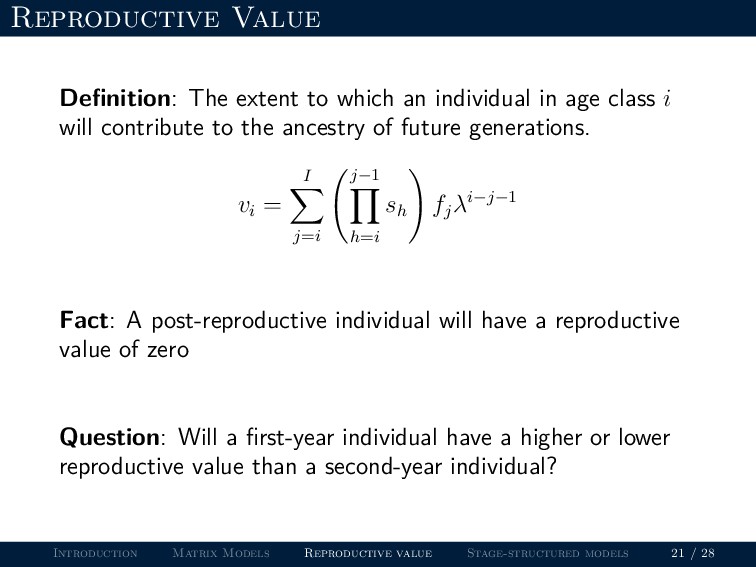
age class i will contribute to the ancestry of future generations. vi = I j=i j−1 h=i sh fj λi−j−1 Introduction Matrix Models Reproductive value Stage-structured models 21 / 28
age class i will contribute to the ancestry of future generations. vi = I j=i j−1 h=i sh fj λi−j−1 Fact: A post-reproductive individual will have a reproductive value of zero Introduction Matrix Models Reproductive value Stage-structured models 21 / 28
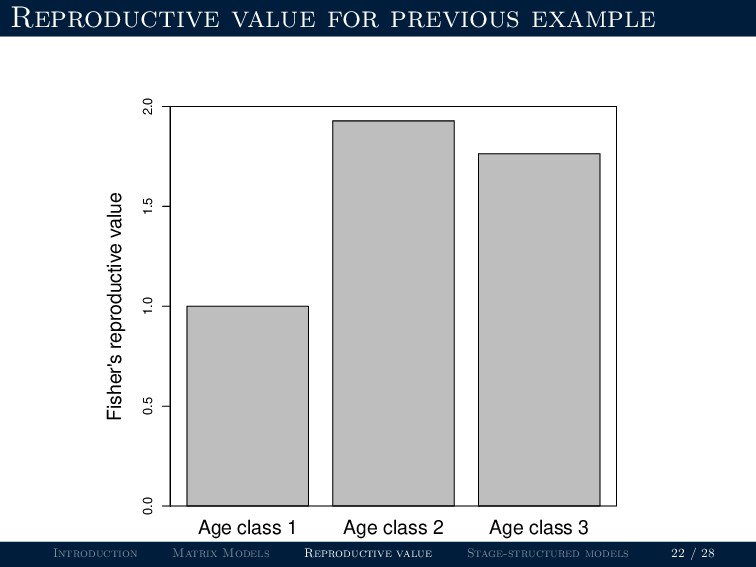
age class i will contribute to the ancestry of future generations. vi = I j=i j−1 h=i sh fj λi−j−1 Fact: A post-reproductive individual will have a reproductive value of zero Question: Will a first-year individual have a higher or lower reproductive value than a second-year individual? Introduction Matrix Models Reproductive value Stage-structured models 21 / 28
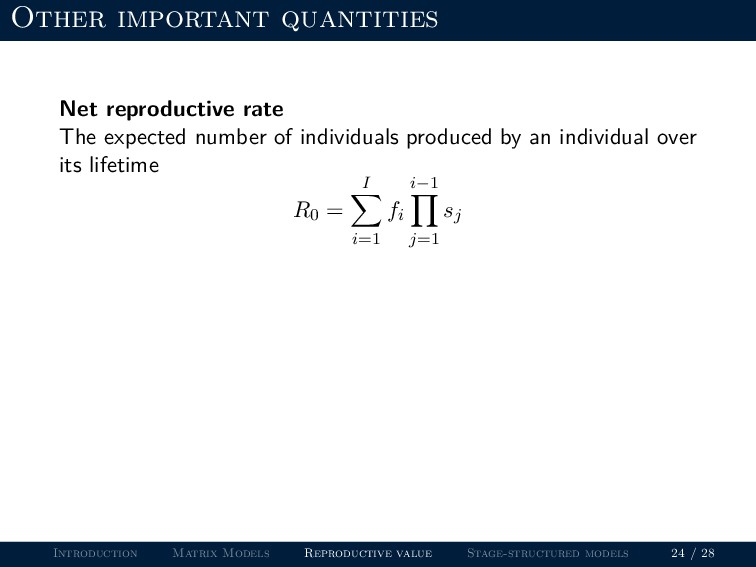
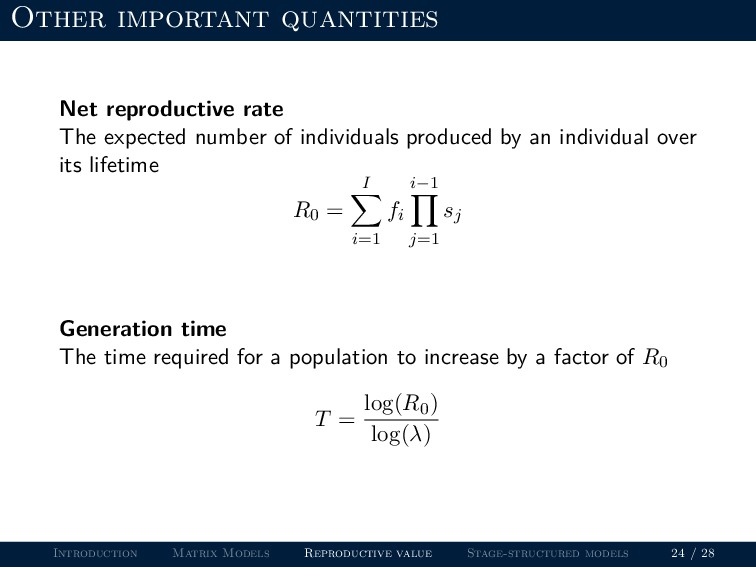
individuals produced by an individual over its lifetime R0 = I i=1 fi i−1 j=1 sj Introduction Matrix Models Reproductive value Stage-structured models 24 / 28
individuals produced by an individual over its lifetime R0 = I i=1 fi i−1 j=1 sj Generation time The time required for a population to increase by a factor of R0 T = log(R0) log(λ) Introduction Matrix Models Reproductive value Stage-structured models 24 / 28
A is the growth rate λ. The right eigenvector is the stable age distribution. 1This is for graduate students only Introduction Matrix Models Reproductive value Stage-structured models 25 / 28
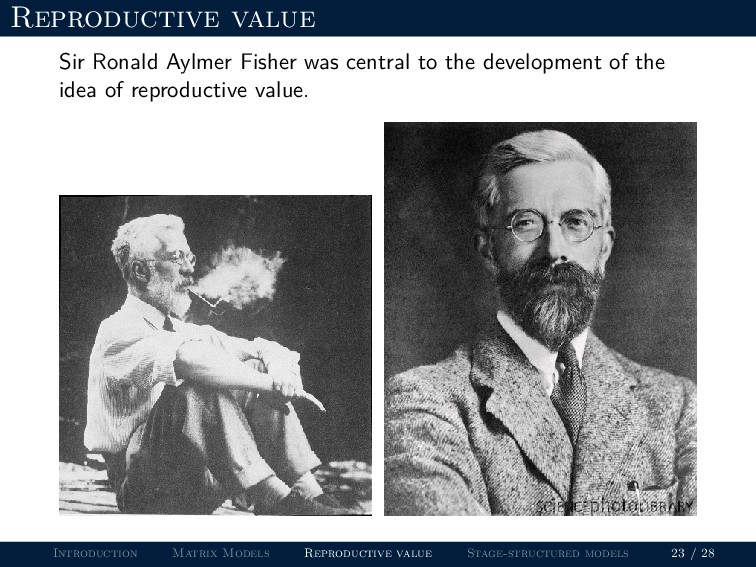
A is the growth rate λ. The right eigenvector is the stable age distribution. The left eigenvector is Fisher’s reproductive value. 1This is for graduate students only Introduction Matrix Models Reproductive value Stage-structured models 25 / 28
to think about population structure • For some populations, it is much more useful to think about size structure or even spatial structure. Introduction Matrix Models Reproductive value Stage-structured models 26 / 28
to think about population structure • For some populations, it is much more useful to think about size structure or even spatial structure. • These “stage-structured” models differ from age-structured models in that individuals can remain in a stage class (with probability 1 − pi) for multiple time periods. Introduction Matrix Models Reproductive value Stage-structured models 26 / 28
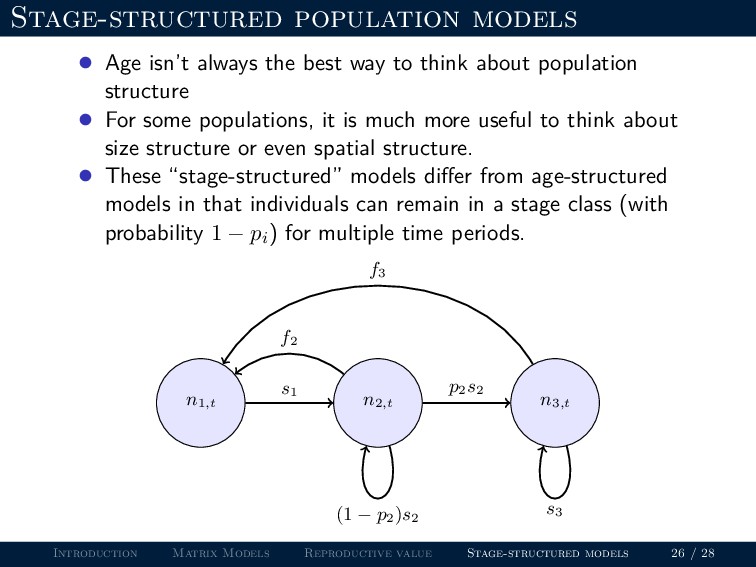
to think about population structure • For some populations, it is much more useful to think about size structure or even spatial structure. • These “stage-structured” models differ from age-structured models in that individuals can remain in a stage class (with probability 1 − pi) for multiple time periods. n1,t n2,t n3,t s1 p2 s2 f2 f3 (1 − p2 )s2 s3 Introduction Matrix Models Reproductive value Stage-structured models 26 / 28
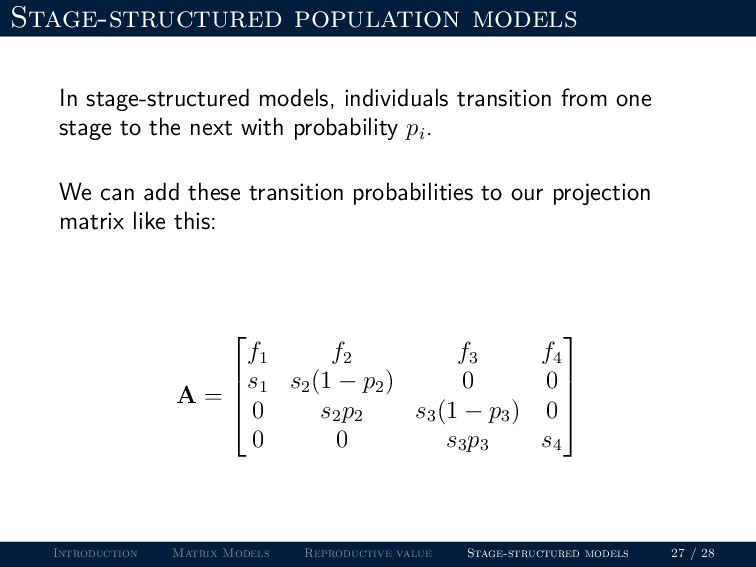
stage to the next with probability pi . We can add these transition probabilities to our projection matrix like this: Introduction Matrix Models Reproductive value Stage-structured models 27 / 28
stage to the next with probability pi . We can add these transition probabilities to our projection matrix like this: A = f1 f2 f3 f4 s1 s2 (1 − p2 ) 0 0 0 s2 p2 s3 (1 − p3 ) 0 0 0 s3 p3 s4 Introduction Matrix Models Reproductive value Stage-structured models 27 / 28
growth will depend on age distribution. If vital rates are constant, population will reach stable age distribution with constant growth rate λ. Introduction Matrix Models Reproductive value Stage-structured models 28 / 28
growth will depend on age distribution. If vital rates are constant, population will reach stable age distribution with constant growth rate λ. Reproductive value indicates which age class contributes the most to population growth. Introduction Matrix Models Reproductive value Stage-structured models 28 / 28
growth will depend on age distribution. If vital rates are constant, population will reach stable age distribution with constant growth rate λ. Reproductive value indicates which age class contributes the most to population growth. Matrix models are a convenient method used to work with age-structured populations. Introduction Matrix Models Reproductive value Stage-structured models 28 / 28