Share
Embed
Map Gardening in Practice: Tracing Patterns of Growth and Maintenance in OpenStreetMap

Alan McConchie
April 24, 2015
Transcript
68 slides
-
[email protected] // @mappingmashups // #AAG2015 // Session 4444 Map Gardening
in Practice: Tracing Patterns of Growth and Maintenance in OpenStreetMap Alan McConchie PhD Candidate, University of British Columbia Design Technologist, Stamen Design [email protected] // @mappingmashups Association of American Geographers Annual Meeting April 24, 2015 1 -
[email protected] // @mappingmashups // #AAG2015 // Session 4444 1. Editing
existing features is as important as adding new ones 3 -
[email protected] // @mappingmashups // #AAG2015 // Session 4444 2. OSM
is a hybrid of volunteered data and imported datasets 4 -
[email protected] // @mappingmashups // #AAG2015 // Session 4444 Hypotheses/questions: 1.
do the “explorers” stick around? 2. do imports hinder growth of community? 3. does activity shift to “gardening”? 5 -
[email protected] // @mappingmashups // #AAG2015 // Session 4444 OSM TIGER
Import Stands for “Topologically Integrated Geographic Encoding and Referencing” TIGER is a product of the United States Census Bureau, therefore in the Public Domain OpenStreetMap imported TIGER’s 2005 data starting in late 2007: animation: wiki.osm.org/wiki/Tiger 6 -
[email protected] // @mappingmashups // #AAG2015 // Session 4444 Just last
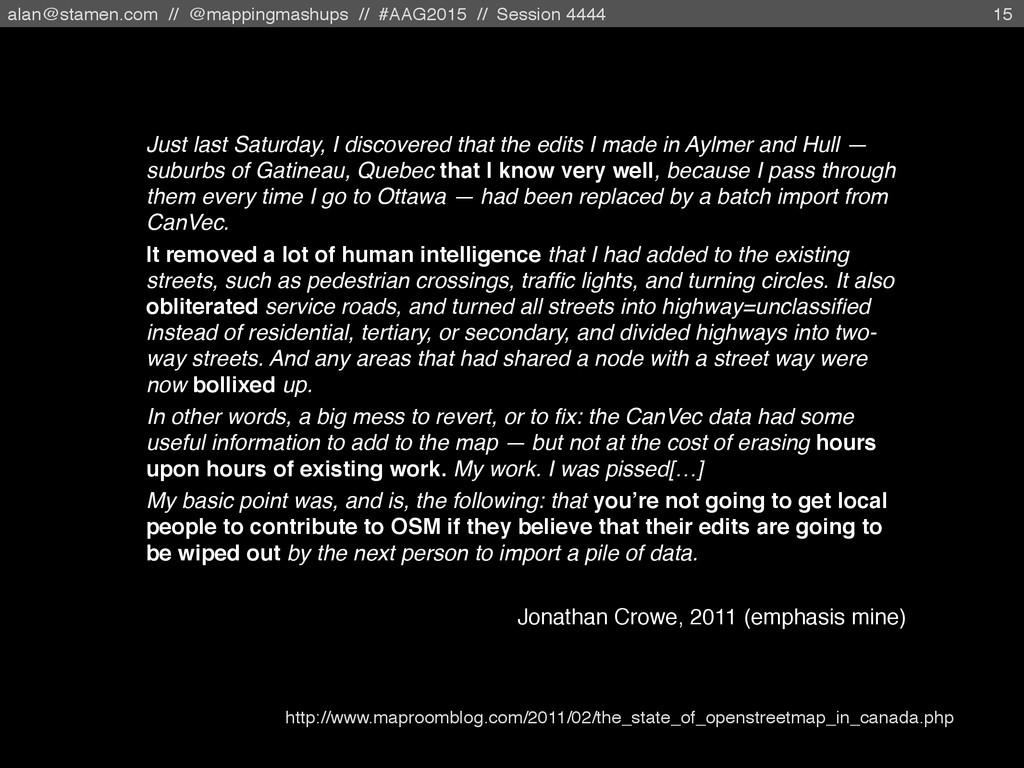
Saturday, I discovered that the edits I made in Aylmer and Hull — suburbs of Gatineau, Quebec that I know very well, because I pass through them every time I go to Ottawa — had been replaced by a batch import from CanVec. It removed a lot of human intelligence that I had added to the existing streets, such as pedestrian crossings, traffic lights, and turning circles. It also obliterated service roads, and turned all streets into highway=unclassified instead of residential, tertiary, or secondary, and divided highways into two- way streets. And any areas that had shared a node with a street way were now bollixed up. In other words, a big mess to revert, or to fix: the CanVec data had some useful information to add to the map — but not at the cost of erasing hours upon hours of existing work. My work. I was pissed[…] My basic point was, and is, the following: that you’re not going to get local people to contribute to OSM if they believe that their edits are going to be wiped out by the next person to import a pile of data. Jonathan Crowe, 2011 (emphasis mine) http://www.maproomblog.com/2011/02/the_state_of_openstreetmap_in_canada.php 15 -
[email protected] // @mappingmashups // #AAG2015 // Session 4444 OSM is
part of a greater movement of collaborative productivity, where people all over the world can and do join forces to create something great, something of value. I believe that in 40 years, probably even in 15, hardly anything of the data we have collected will retain much value - but we will have been part of a great development, and mankind will be the better for it. Will OSM, instead of being the social endeavor of “a great map that people made themselves”, then be the technical challenge of “the geo database where a few clever guys managed to combine lots of existing data”? Frederik Ramm, 2012 (emphasis mine) https://lists.openstreetmap.org/pipermail/talk-us/2012-December/009966.html 16 -
[email protected] // @mappingmashups // #AAG2015 // Session 4444 A popular
(although not universally accepted) theory is that massive imports are to blame for slowing down the development of the US community. …instead of the fun task of going out, finding new streets, and filling in a blank map, new contributors in the US were now faced with the relative tedium of correcting repetitive errors in an existing dataset. Meanwhile, in countries like Germany, almost all data has been collected by volunteer mappers, with only a few small-scale imports conducted in places where there already was an active community. This was not by design - there simply wasn't a comparable dataset that could have been imported - but it was ultimately beneficial. At least if you accept the theory, of course. Tobias Knerr, 2015 (emphasis mine) http://forum.openstreetmap.org/viewtopic.php?id=30121 17 -
[email protected] // @mappingmashups // #AAG2015 // Session 4444 Current best
practice wiki.osm.org / wiki / Import / Guidelines 18 -
[email protected] // @mappingmashups // #AAG2015 // Session 4444 Community Imports
• Divide data into chunks • Community members manually upload each chunk NOTE: The term "Import" is highly loaded in the OSM community. "A distributed and curated merge," is a more accurate description of what Seattle OSM planning to do. — wiki.osm.org/wiki/Seattle_Import 19 -
[email protected] // @mappingmashups // #AAG2015 // Session 4444 Building community
through imports Four training events and editathons Five events out walking around 20+ active participants slideshare.net/gwhathistory/osm-sotm-us-2013-imports4community-002 20 -
[email protected] // @mappingmashups // #AAG2015 // Session 4444 NYC community
building import • Estimated 1500 hours of work • Volunteers + Mapbox employees • Coordination with NYC GIS Dept animation: mapbox.com/blog/nyc-buildings-openstreetmap 21 -
[email protected] // @mappingmashups // #AAG2015 // Session 4444 24 Zielstra,
Dennis, Hartwig H. Hochmair, and Pascal Neis. 2013. Assessing the Effect of Data Imports on the Completeness of OpenStreetMap - A United States Case Study. Transactions in GIS 17, no. 3 (June): 315–334. The impact of the TIGER import on OSM completeness -
[email protected] // @mappingmashups // #AAG2015 // Session 4444 25 Neis,
Pascal, Dennis Zielstra, and Alexander Zipf. 2013. Comparison of Volunteered Geographic Information Data Contributions and Community Development for Selected World Regions. Future Internet 5, no. 2 (June 3): 282–300. Comparison of OSM in various cities: -
[email protected] // @mappingmashups // #AAG2015 // Session 4444 “A WikiGardener
is a person who goes around the wiki, correcting typos here, rearranging things to be more readable there. In general, good WikiGardeners are liked and respected, since they have the magical ability to take a jumble of pages and create good, readable text out of them. Anyone can be a WikiGardener. If you see a typo or a spelling mistake, feel free to correct it! If you feel up to it, rearrange a page, or split a long page to smaller pages, or if you think some page belongs to some WikiCategory, add a link to it. If you make a mistake, don't worry about it, since everything you do can be restored. Also, remember to add a change note when doing your wikigardening.” http://www.jspwiki.org/wiki/WikiGardener 26 Wiki Gardening -
[email protected] // @mappingmashups // #AAG2015 // Session 4444 • Complete
history dump of OSM up to December 31, 2014 • Extract a small number of study areas • Only look at nodes, disregard all other data types • Overlay grid (1 km) • Find earliest node in each grid cell • For each username, count following values: Number of total node edits Number of version 1 edits (node creation) Number of version 2+ edits (move node or change attributes) Number of edits in “blank spots on the map” • Only count a user's activity within each study area. 27 The analysis -
[email protected] // @mappingmashups // #AAG2015 // Session 4444 28 Central
London OSM ways (all versions) -
[email protected] // @mappingmashups // #AAG2015 // Session 4444 29 Central
London with 1000m grid -
[email protected] // @mappingmashups // #AAG2015 // Session 4444 30 Central
London with 1000m grid First OSM nodes in each cell -
[email protected] // @mappingmashups // #AAG2015 // Session 4444 31 Downtown
Vancouver 1000m grid First OSM nodes in each cell -
[email protected] // @mappingmashups // #AAG2015 // Session 4444 32 Total
edits vs “blank spot” edits -
[email protected] // @mappingmashups // #AAG2015 // Session 4444 33 Greater
London: OSM contributors plotted by number of “blank spot” edits and number of total edits. Circles are individuals editors sized according to number of days active London -
[email protected] // @mappingmashups // #AAG2015 // Session 4444 34 San
Francisco Bay Area: OSM contributors plotted by number of “blank spot” edits and number of total edits. Circles are individuals editors sized according to number of days active Bay Area -
[email protected] // @mappingmashups // #AAG2015 // Session 4444 35 Selected
bounding boxes around approximate extent of urban areas Bounding box population estimated using Gridded Population of the World dataset for year 2000 (GPWv3) London Population 8,500,000 Land area 3300 sq km Berlin Population 1,900,000 Land area 2100 sq km Seattle Population 3,200,000 Land area 6300 sq km -
[email protected] // @mappingmashups // #AAG2015 // Session 4444 36 Area
(sq km) Population (thousands) 100,000 10,000 1,000 100 1,000 10,000 -
[email protected] // @mappingmashups // #AAG2015 // Session 4444 37 Total
edited nodes by month (new nodes + modified nodes) TIGER imports Boston building import Haiti earthquake Paris building import second Boston import NYC building imports seattle building import -
[email protected] // @mappingmashups // #AAG2015 // Session 4444 38 Total
modified nodes by month Modification history lost before OSM API v0.5 Berlin Haiti Berlin Bay Area Montevideo London New York Bay Area Los Angeles Paris Los Angeles -
[email protected] // @mappingmashups // #AAG2015 // Session 4444 39 Total
“blankspot” nodes by month Haiti TIGER imports -
[email protected] // @mappingmashups // #AAG2015 // Session 4444 40 Total
edited nodes by month normalized by area Boston Boston Amsterdam Amsterdam Paris -
[email protected] // @mappingmashups // #AAG2015 // Session 4444 41 Total
edited nodes by month normalized by population Boston Boston Amsterdam Montevideo -
[email protected] // @mappingmashups // #AAG2015 // Session 4444 42 Total
edited nodes by month: London (new nodes + modified nodes) -
[email protected] // @mappingmashups // #AAG2015 // Session 4444 43 Total
created nodes by month: London (new nodes only) -
[email protected] // @mappingmashups // #AAG2015 // Session 4444 44 Total
created nodes by month: London (modified nodes only) -
[email protected] // @mappingmashups // #AAG2015 // Session 4444 45 Total
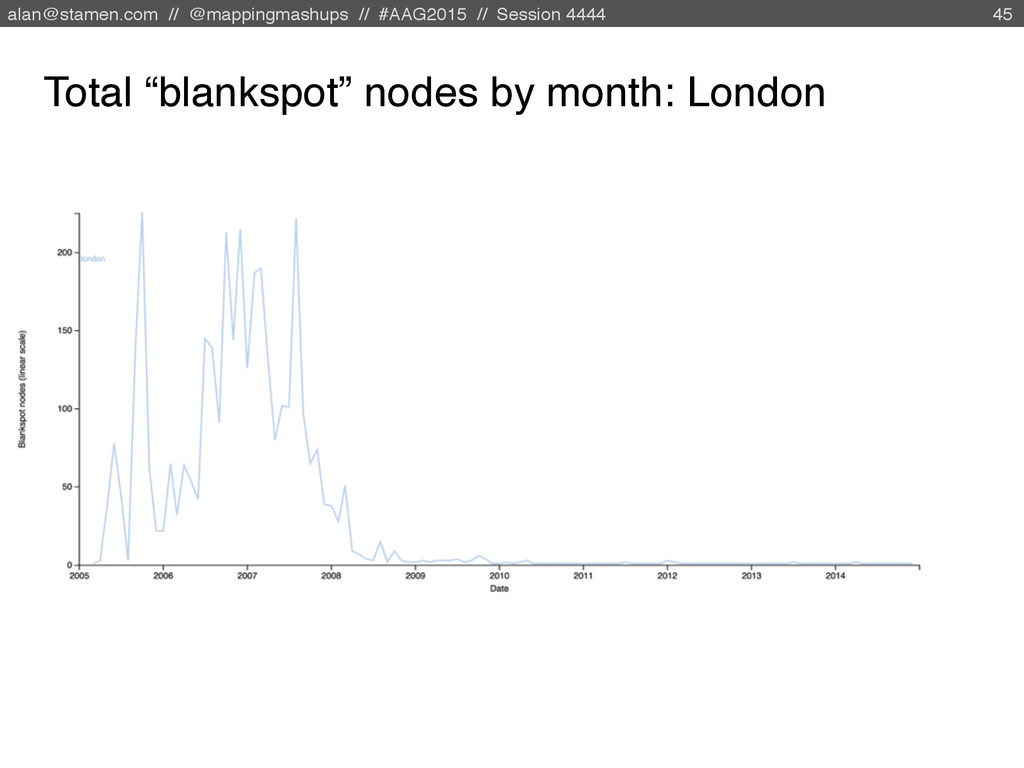
“blankspot” nodes by month: London -
[email protected] // @mappingmashups // #AAG2015 // Session 4444 46 Total
edited nodes by month: London red: blankspot contributors light blue: non-blankspot contributors -
[email protected] // @mappingmashups // #AAG2015 // Session 4444 47 Created
nodes by month: London red: blankspot contributors light blue: non-blankspot contributors -
[email protected] // @mappingmashups // #AAG2015 // Session 4444 48 Modified
nodes by month: London red: blankspot contributors light blue: non-blankspot contributors -
[email protected] // @mappingmashups // #AAG2015 // Session 4444 49 Total
edited nodes by month: London solid line: aggregated blankspot contributors (n = 130) dotted line: aggregated non-blankspot contributors (n = 5488) -
[email protected] // @mappingmashups // #AAG2015 // Session 4444 50 Total
created nodes by month: London solid line: aggregated blankspot contributors (n = 130) dotted line: aggregated non-blankspot contributors (n = 5488) -
[email protected] // @mappingmashups // #AAG2015 // Session 4444 51 Total
modified nodes by month: London solid line: aggregated blankspot contributors (n = 130) dotted line: aggregated non-blankspot contributors (n = 5488) -
[email protected] // @mappingmashups // #AAG2015 // Session 4444 52 Total
edited nodes by month: Berlin solid line: aggregated blankspot contributors (n = 109) dotted line: aggregated non-blankspot contributors (n = 6893) -
[email protected] // @mappingmashups // #AAG2015 // Session 4444 53 Total
created nodes by month: Berlin solid line: aggregated blankspot contributors (n = 109) dotted blue: aggregated non-blankspot contributors (n = 6893) -
[email protected] // @mappingmashups // #AAG2015 // Session 4444 54 Total
modified nodes by month: Berlin solid line: aggregated blankspot contributors (n = 109) dotted blue: aggregated non-blankspot contributors (n = 6893) -
[email protected] // @mappingmashups // #AAG2015 // Session 4444 55 Total
edited nodes by month: Moscow solid line: aggregated blankspot contributors (n = 79) dotted line: aggregated non-blankspot contributors (n = 3268) -
[email protected] // @mappingmashups // #AAG2015 // Session 4444 56 Total
created nodes by month: Moscow solid line: aggregated blankspot contributors (n = 79) dotted line: aggregated non-blankspot contributors (n = 3268) -
[email protected] // @mappingmashups // #AAG2015 // Session 4444 57 Total
modified nodes by month: Moscow solid line: aggregated blankspot contributors (n = 79) dotted line: aggregated non-blankspot contributors (n = 3268) -
[email protected] // @mappingmashups // #AAG2015 // Session 4444 58 Total
created nodes by month: Toronto solid line: aggregated blankspot contributors (n = 58) dotted line: aggregated non-blankspot contributors (n = 1395) -
[email protected] // @mappingmashups // #AAG2015 // Session 4444 59 Total
modified nodes by month: Toronto solid line: aggregated blankspot contributors (n = 58) dotted line: aggregated non-blankspot contributors (n = 1395) -
[email protected] // @mappingmashups // #AAG2015 // Session 4444 60 Total
modified nodes by month: Vancouver solid line: aggregated blankspot contributors (n = 72) dotted line: aggregated non-blankspot contributors (n = 1004) -
[email protected] // @mappingmashups // #AAG2015 // Session 4444 61 Total
modified nodes by month: Vancouver solid line: aggregated blankspot contributors (n = 72) dotted line: aggregated non-blankspot contributors (n = 1004) -
[email protected] // @mappingmashups // #AAG2015 // Session 4444 62 Total
modified nodes by month: Haiti solid line: aggregated blankspot contributors (n = 317) dotted line: aggregated non-blankspot contributors (n = 1120) -
[email protected] // @mappingmashups // #AAG2015 // Session 4444 63 Total
modified nodes by month: Haiti solid line: aggregated blankspot contributors (n = 317) dotted line: aggregated non-blankspot contributors (n = 1120) -
[email protected] // @mappingmashups // #AAG2015 // Session 4444 64 Total
created nodes by month: Four U.S. cities solid lines: aggregated blankspot contributors (Bay Area n = 119, Seattle = 54, New York = 61, Boston = 27) dotted lines: aggregated non-blankspot contributors (Bay Area n = 3485, Seattle = 2067, New York = 3116, Boston = 1406) -
[email protected] // @mappingmashups // #AAG2015 // Session 4444 65 Total
modified nodes by month: Four U.S. cities solid lines: aggregated blankspot contributors (Bay Area n = 119, Seattle = 54, New York = 61, Boston = 27) dotted lines: aggregated non-blankspot contributors (Bay Area n = 3485, Seattle = 2067, New York = 3116, Boston = 1406) -
[email protected] // @mappingmashups // #AAG2015 // Session 4444 Discussion: •
Power law effects trump everything else. • Gradual shift to new contributors (less so in Canada!) • Subtle shift to maintenance tasks… • …but there are always new things to add. • Maintenance is “bursty”, like additions are. • Do imports hinder the growth of community? 66 -
[email protected] // @mappingmashups // #AAG2015 // Session 4444 Discussion: •
Power law effects trump everything else. • Gradual shift to new contributors (less so in Canada!) • Subtle shift to maintenance tasks… • …but there are always new things to add. • Maintenance is “bursty”, like additions are. • Do imports hinder the growth of community? 67 …not very clear cut at all -
[email protected] // @mappingmashups // #AAG2015 // Session 4444 @mappingmashups [email protected]
68 http://almccon.github.io/mapgardening/timeseries.html (work in progress: use at own risk!) Thanks!
 almccon
 institutdelelevage
 datascientistsociety
 hirachan
 tomonom
 yumulab
 resolutionfoundation
 sira
 xspa2012
 beale
 analokmaus
 zakiyama
 marketingsoph
 tammyeverts
 shpigford
 tammielis
 mza
 jct
 reverentgeek
 madoxten
 rabernat
 baasie
 sonatard