conglomeration of interrelated and interdependent parts that is either natural or man-made ➢ Every system is delineated by its spatial and temporal boundaries, surrounded and influenced by its environment, described by its structure and purpose or nature and expressed in its functioning ➢ In terms of its effects, a system can be more than the sum of its parts if it expresses synergy or emergent behavior ➢ Changing one part of the system usually affects other parts and the whole system, with predictable patterns of behavior ➢ For systems that are self-learning and self-adapting, the positive growth and adaptation depend upon how well the system is adjusted with its environment
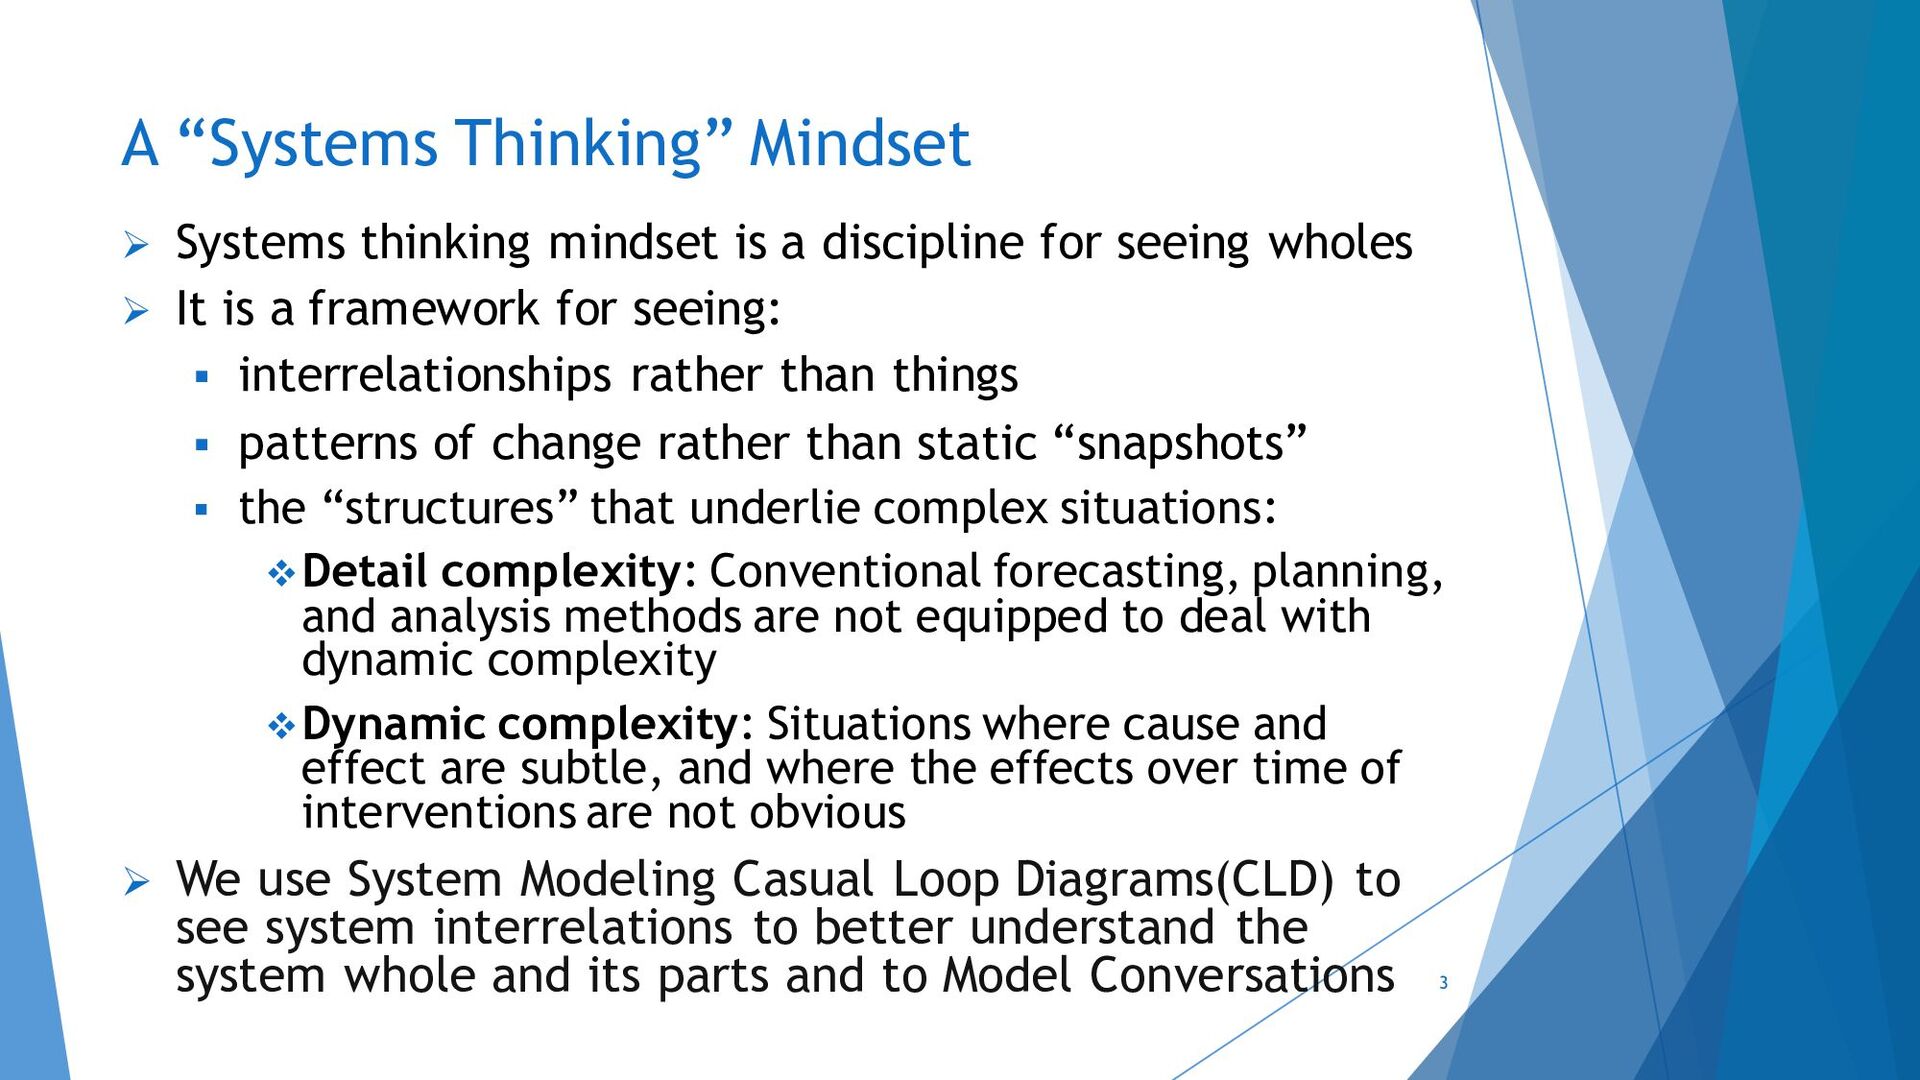
discipline for seeing wholes ➢ It is a framework for seeing: ▪ interrelationships rather than things ▪ patterns of change rather than static “snapshots” ▪ the “structures” that underlie complex situations: ❖Detail complexity: Conventional forecasting, planning, and analysis methods are not equipped to deal with dynamic complexity ❖Dynamic complexity: Situations where cause and effect are subtle, and where the effects over time of interventions are not obvious ➢ We use System Modeling Casual Loop Diagrams(CLD) to see system interrelations to better understand the system whole and its parts and to Model Conversations 3
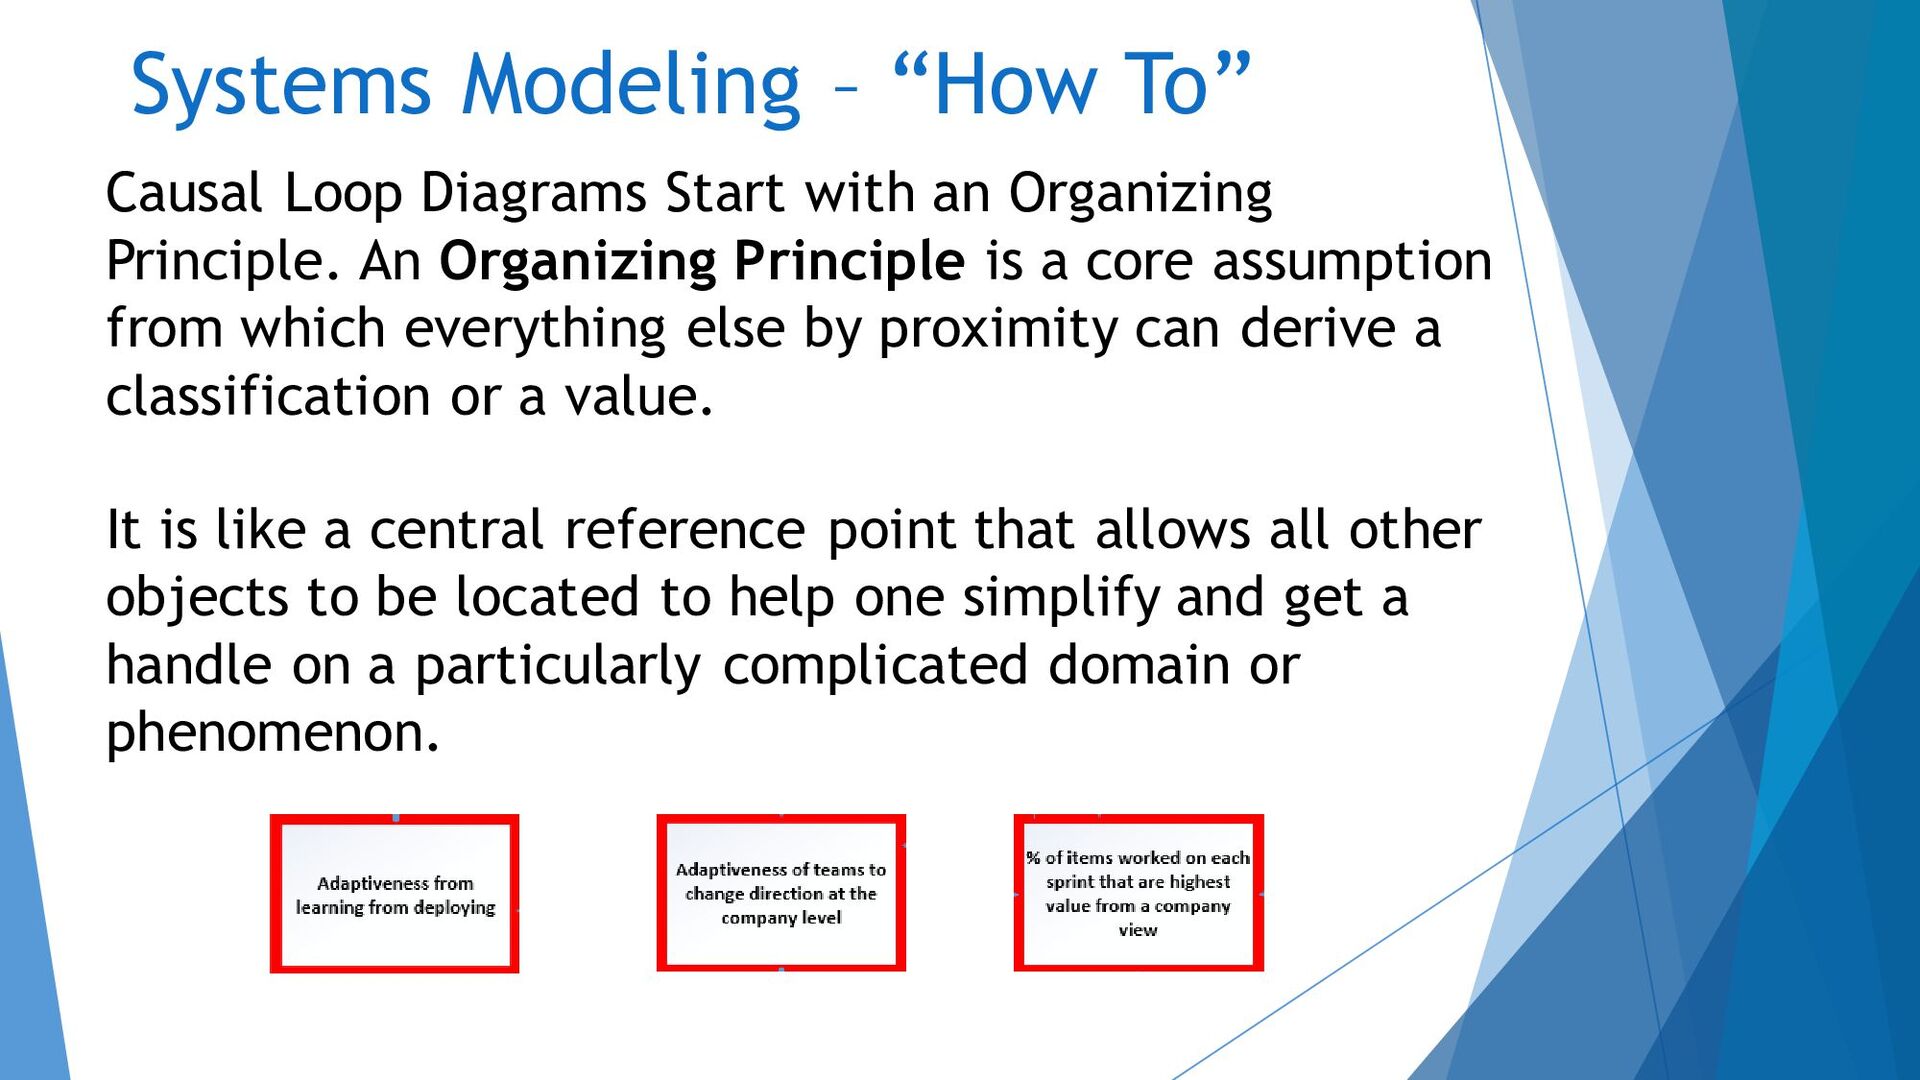
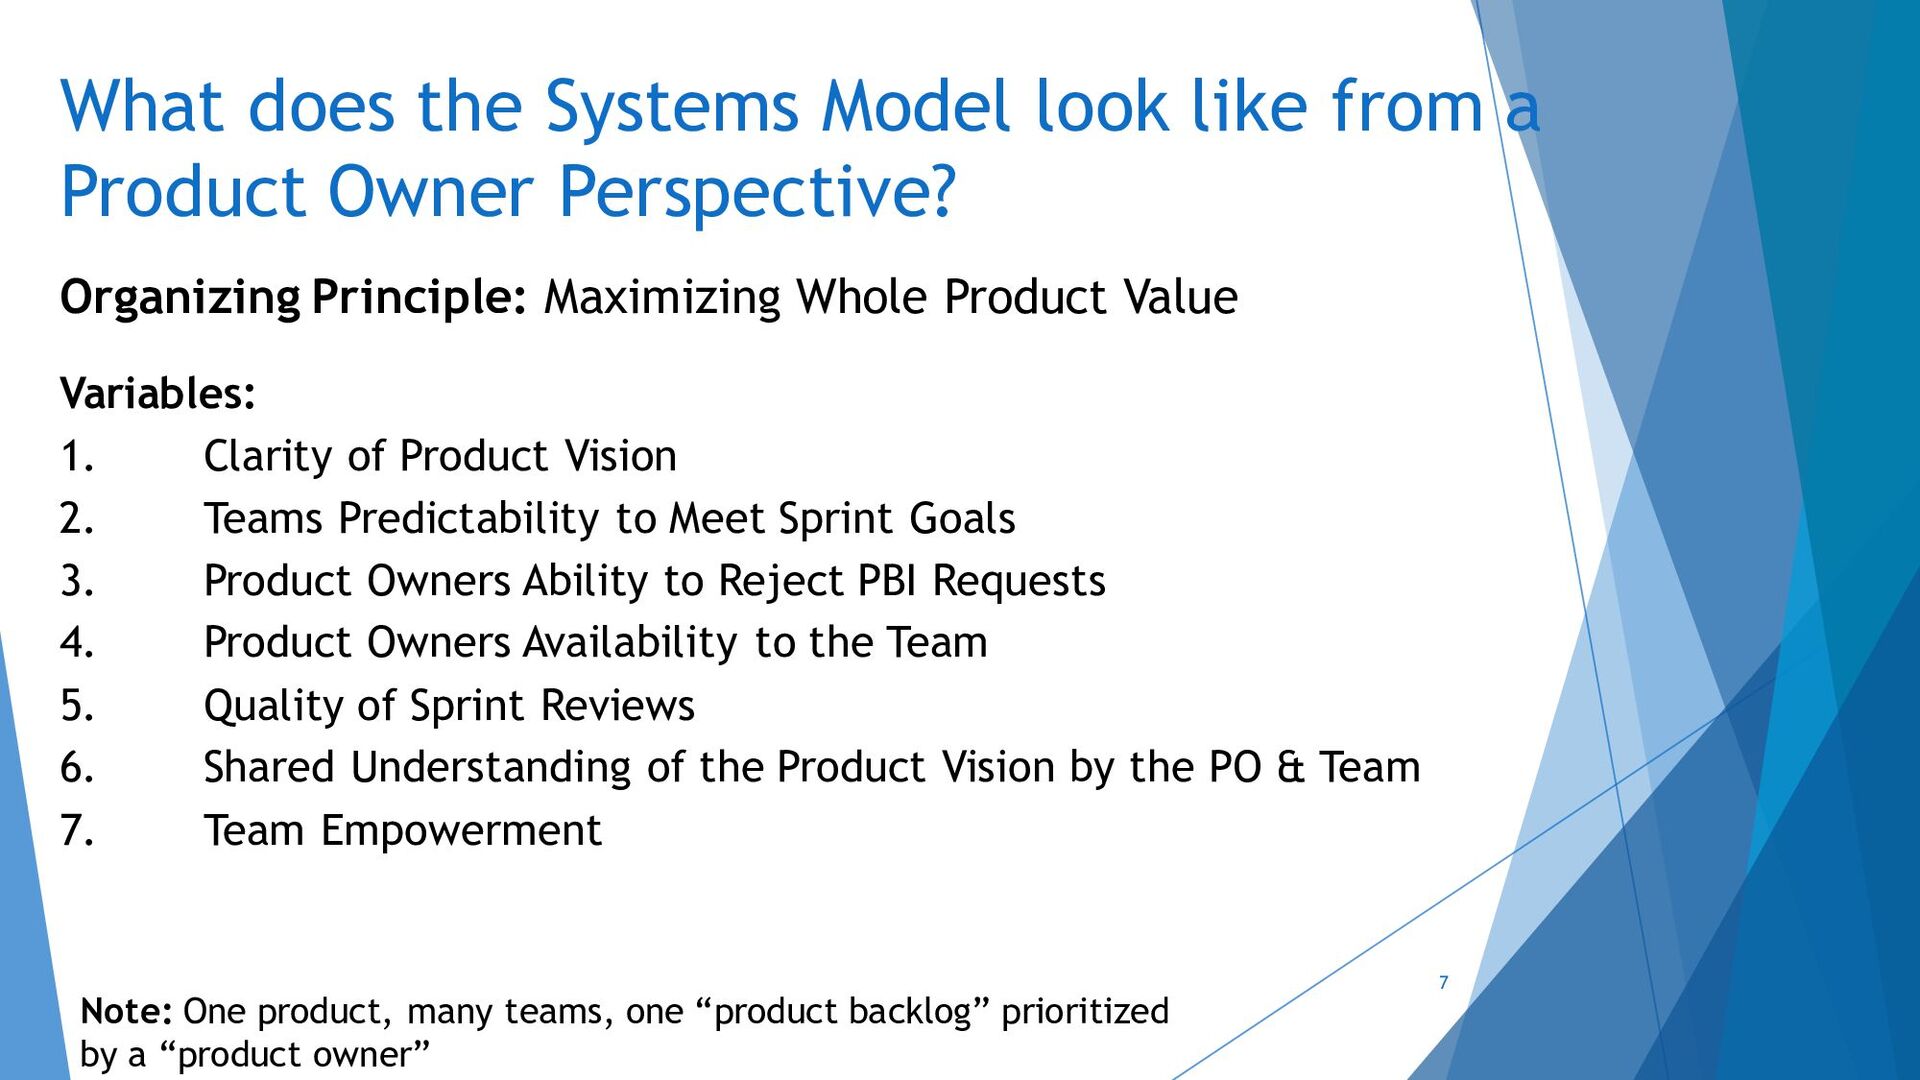
an Organizing Principle. An Organizing Principle is a core assumption from which everything else by proximity can derive a classification or a value. It is like a central reference point that allows all other objects to be located to help one simplify and get a handle on a particularly complicated domain or phenomenon.
Owner Perspective? Organizing Principle: Maximizing Whole Product Value Variables: 1. Clarity of Product Vision 2. Teams Predictability to Meet Sprint Goals 3. Product Owners Ability to Reject PBI Requests 4. Product Owners Availability to the Team 5. Quality of Sprint Reviews 6. Shared Understanding of the Product Vision by the PO & Team 7. Team Empowerment 7 Note: One product, many teams, one “product backlog” prioritized by a “product owner”
diagram (CLD) is a causal diagram that aids in visualizing how different variables in a system are interrelated. • The diagram consists of a set of nodes and edges. Nodes represent the variables and edges are the links that represent a connection or a relation between the two variables. 8
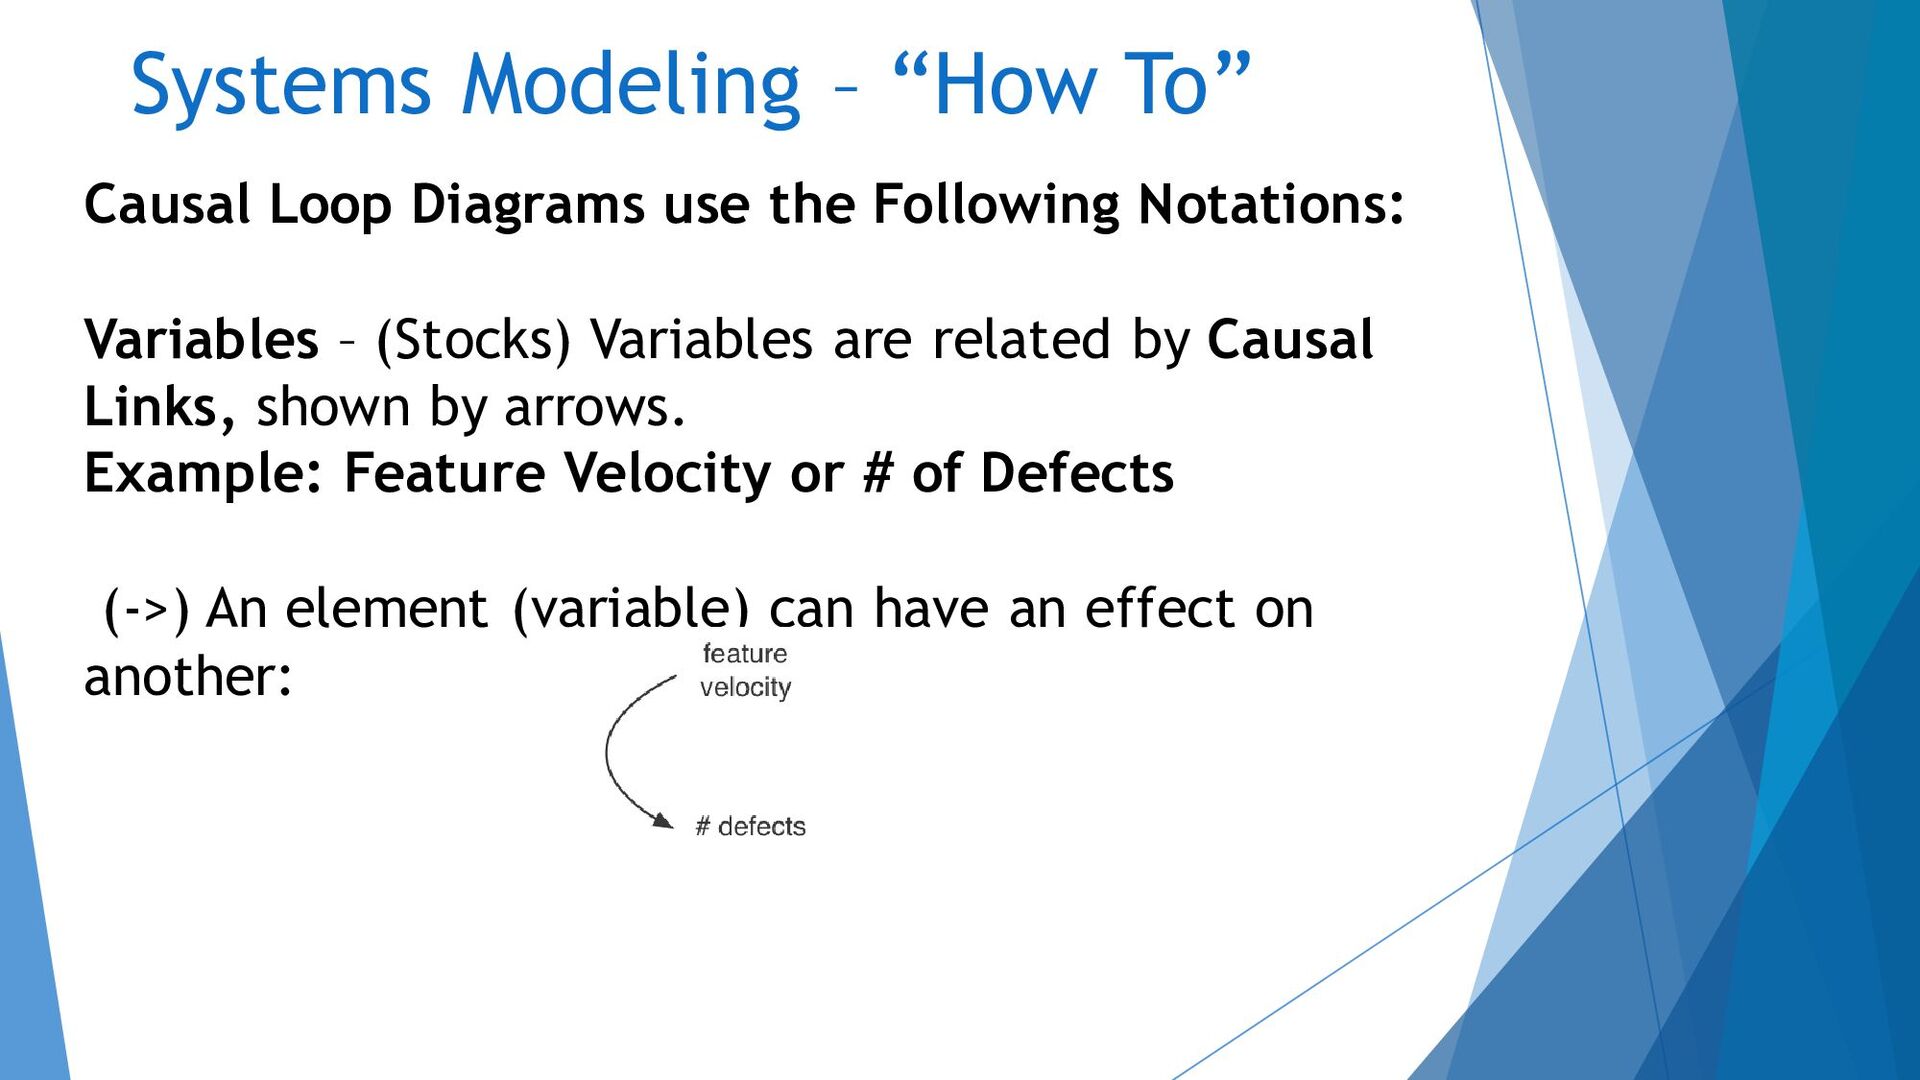
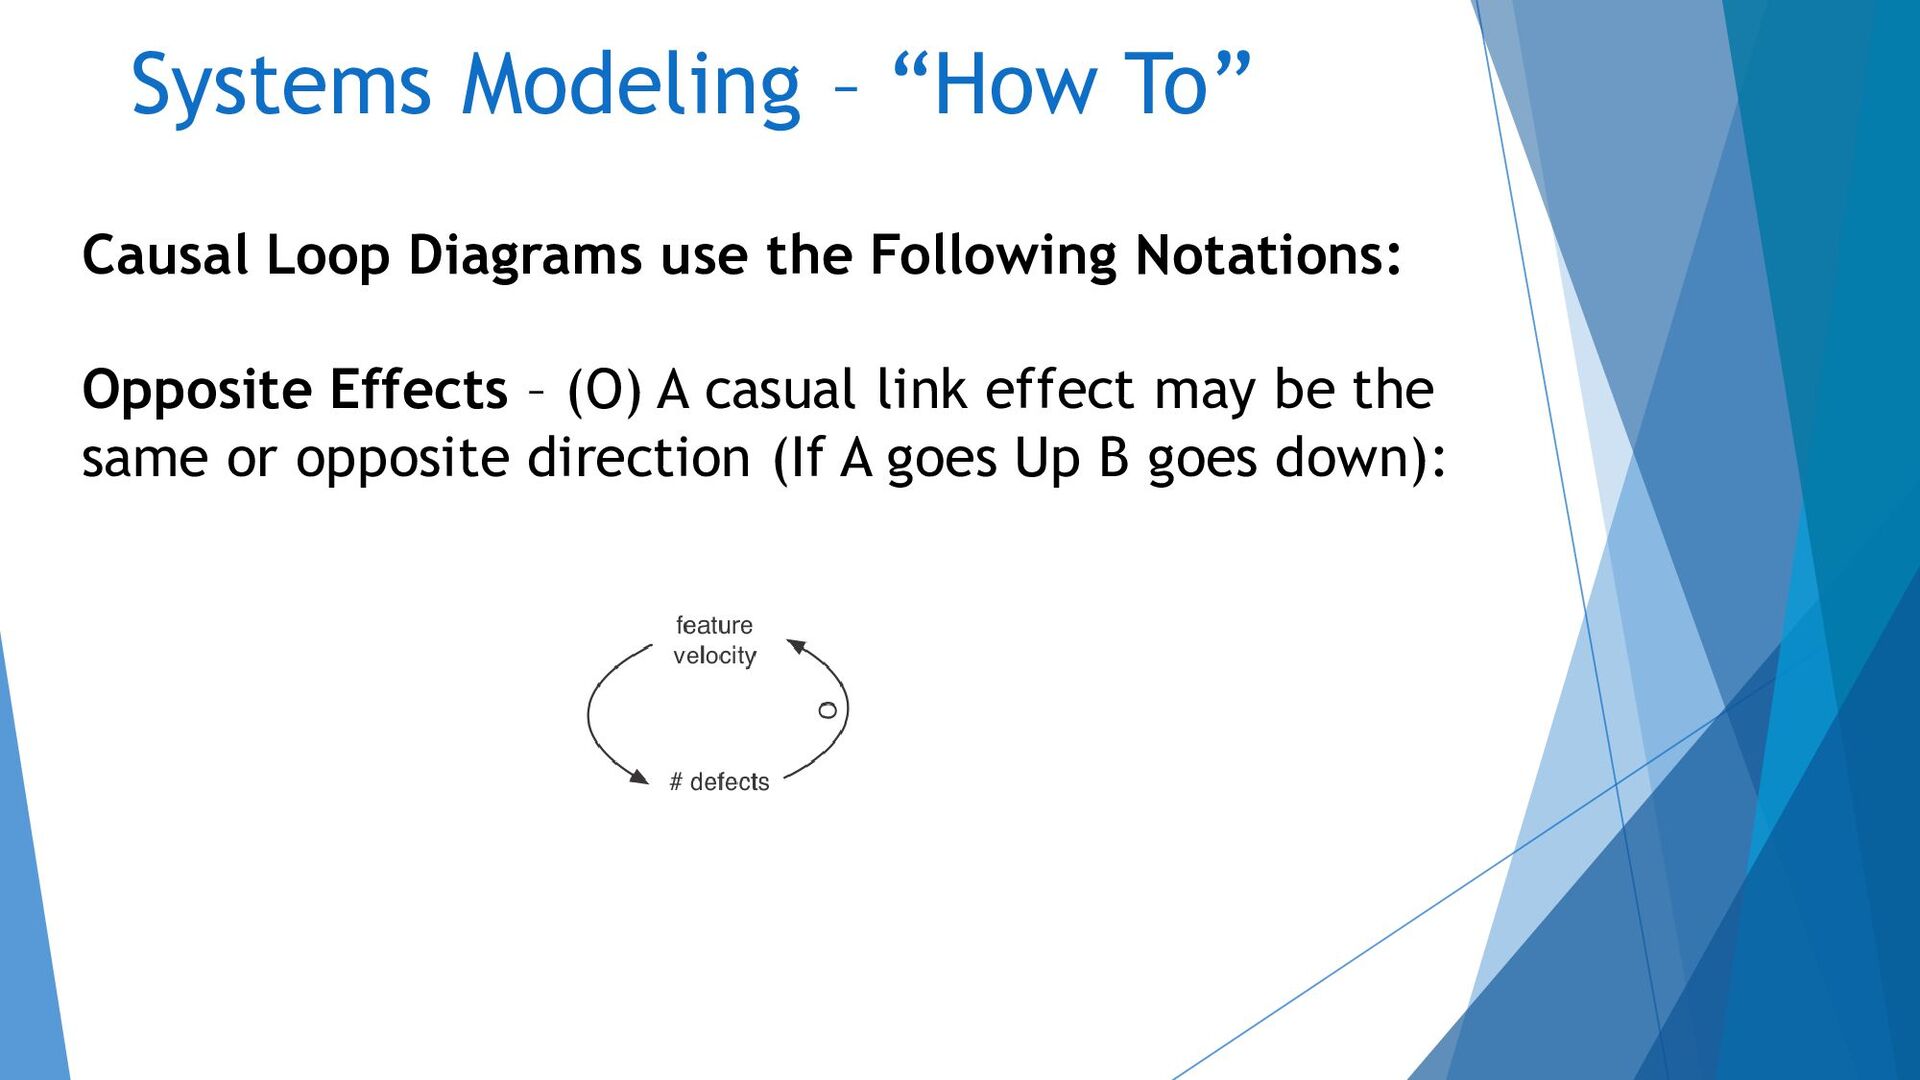
Following Notations: Variables – (Stocks) Variables are related by Causal Links, shown by arrows. Example: Feature Velocity or # of Defects (->) An element (variable) can have an effect on another:
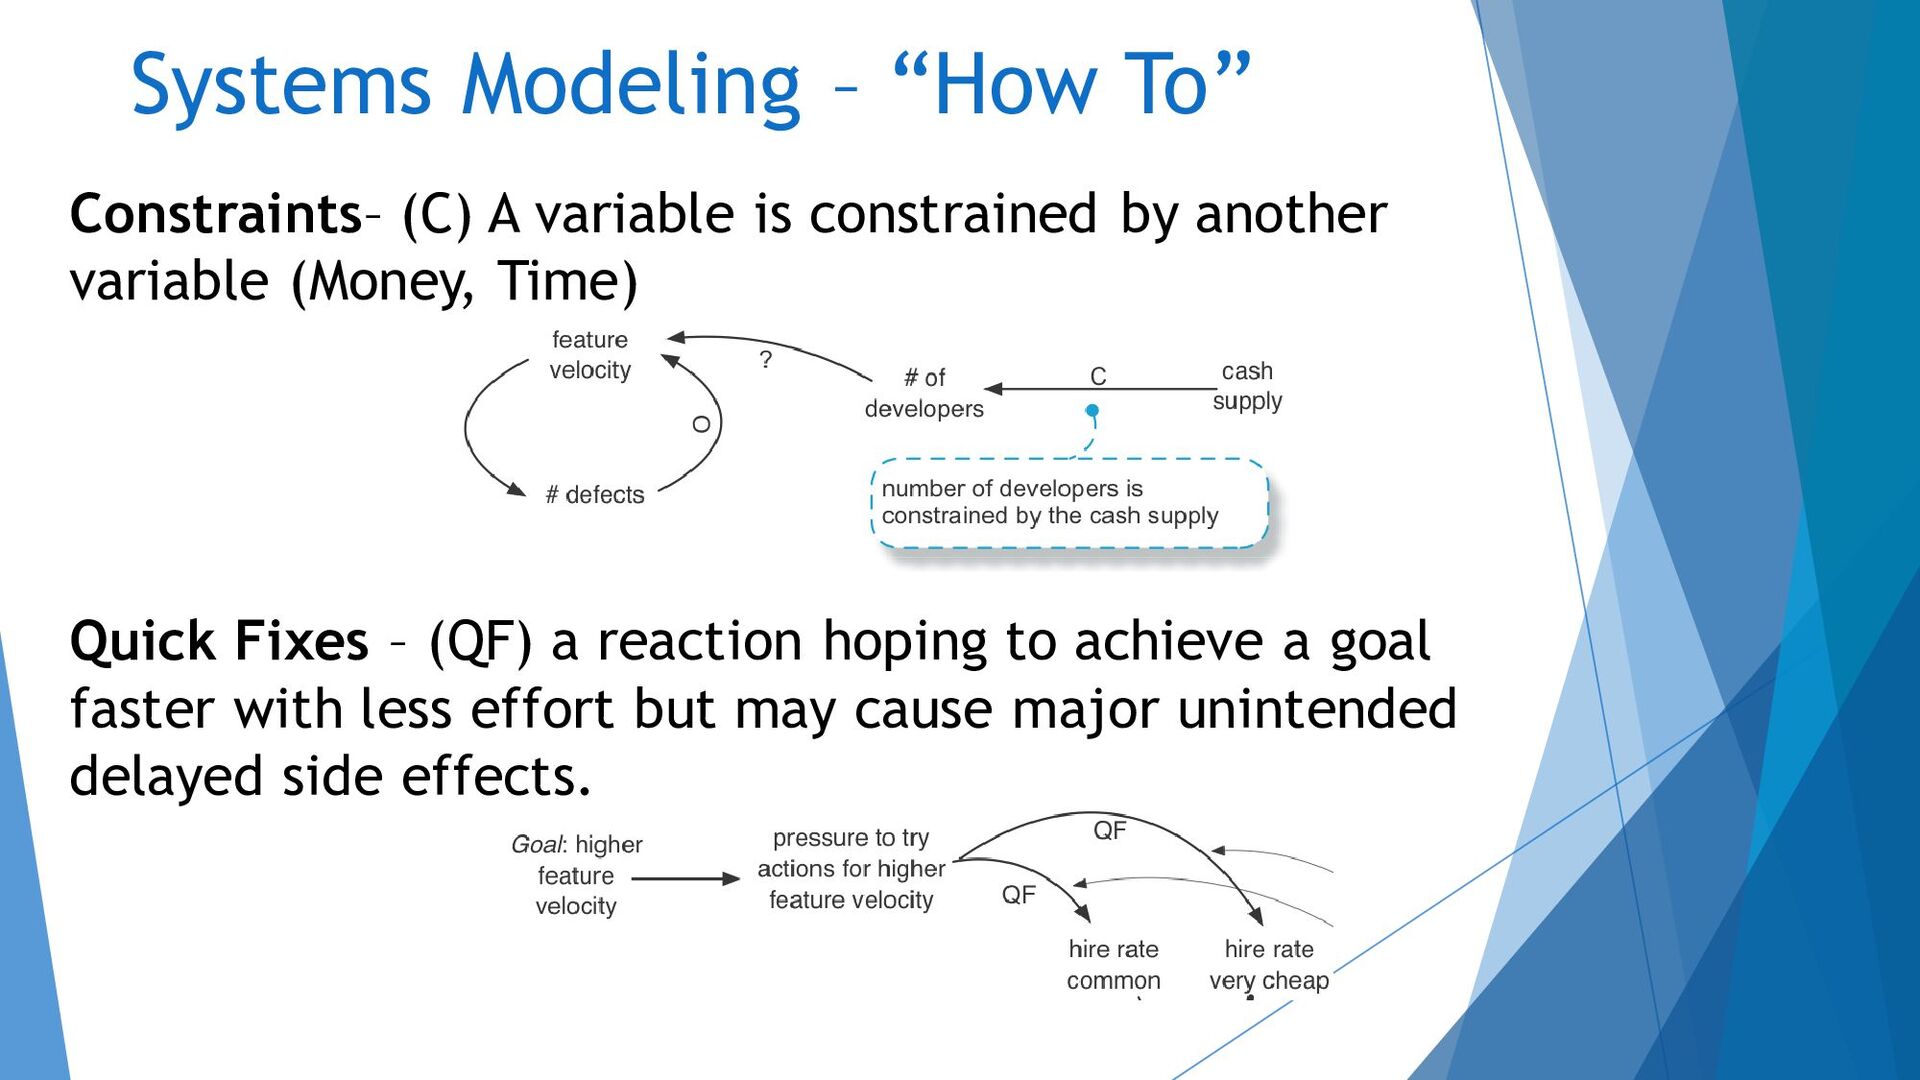
reaction hoping to achieve a goal faster with less effort but may cause major unintended delayed side effects. Constraints– (C) A variable is constrained by another variable (Money, Time)