Upgrade to Pro — share decks privately, control downloads, hide ads and more …

Secondary Analysis in Applied Linguistics

TerasawaT
February 20, 2024

Secondary Analysis in Applied Linguistics

TerasawaT

February 20, 2024
Tweet

More Decks by TerasawaT

Other Decks in Education

Transcript

  1. Secondary Analysis in Applied Linguistics TERASAWA, Takunori Visiting Researcher at

    LLED, UBC Associate Professor at School of Sociology, Kwansei Gakuin University, Japan LLED Research Seminar February 7, 2023 | 1:00PM – 2:00PM
  2. The sociology of language and I • Two distinct approaches

    • (Qualitative) analysis of historical and policy documents • Quantitative sociology Terasawa, T. (2018). Learning English in Japan: Myths and realities (J. Commons, trans.). Melbourne: Trans Pacific Press.
  3. Quantitative sociology • A branch of sociology that aims to

    uncover sociological realities through quantitative analysis of data (e.g. population statistics, social surveys, and opinion polls) • Quantitative data: questionnaire survey data in most cases • Sociological realities: macro structure of a society in most cases • Highly sensitive to the issue of representativeness --- whether and to what degree a sample represents the population (i.e. whether and to what degree a survey result can be generalised to the people in a society)
  4. What is Secondary Analysis? The Routledge Encyclopedia of Research Methods

    in Applied Linguistics. (Riazi, 2016, p. 267) Reanalysis/secondary analysis In quantitative research it sometimes happens that the same researcher or other researchers perform a secondary or a reanalysis of the existing data, which has been collected for another purpose. Secondary analysis is different from literature review or research synthesis or meta-analysis…. Secondary analysis of the existing data is done with some purposes distinct from the original analysis. This type of analysis is more common in sociology, but it may also be used in applied linguistics. Both large government datasets, such as those collected through census study, and large datasets collected by researchers can be used for secondary analysis. Census surveys are conducted by governments usually every 10 years and provide a huge amount of data on different attributes of the society. Such datasets are usually reanalysed by different researchers to investigate and address different research questions. Applied linguist researchers may, for example, be interested in investigating the pattern of multilingualism in a particular country using census data. On the other hand, sociologists may use the census data to address issues related to family structure in the same society, and still economics researchers may reanalyse the same data to investigate the rate of unemployment and perform some trend studies. Apart from the census data collected by the governments, large datasets collected by research teams lend themselves to secondary analyses too. Researchers may use the same datasets to address new research questions, or they may investigate the same research questions using more sophisticated statistical analyses and perform a secondary analysis on the existing datasets. In qualitative research …
  5. Secondary analysis Qualitative Quantitative Processed data (aggregate values or survey

    reports) Raw datasets that contain individual responses Non-survey data (e.g. ‘Big data’, behaviour log) Survey data Small-scale surveys (datasets might be available in-person) Censuses and other large-scale surveys (datasets are available via data archives) Secondary-analysis-of-social-surveys approach: Key features Secondary analysis of Census or large-scale social surveys, whose raw datasets are usually provided via data archives
  6. Comparison between ordinary questionnaire surveys (OQS) and secondary analysis of

    social surveys (SASS) 6 OQS SASS 1) Cost less (budgets, hours and other resources)? - + 2) Is a dataset large enough? -/+ + 3) Was a survey well designed (sampling, measurement, items, etc.)? -/+ + 4) Representative? - + 5) Is the study NOT invasive to questionnaire respondents? -/+ + 6) Measure and examine whatever a researcher wants? + - 7) The freshness of survey data? + - 8) Relatively easy in presenting novel findings? +? -
  7. Data Archives • Many raw datasets of well-designed, large-scale, and

    nationally-representative social survey are available in data archives. • ICPSR: Inter-university Consortium for Political and Social Research https://www.icpsr.umich.edu/ • CESSDA: Consortium of European Social Science Data Archives https://www.cessda.eu/ • EASSDA: East Asian Social Survey Data Archive https://www.eassda.org/ • SSJDA: Social Science Japan Data Archive https://csrda.iss.u-tokyo.ac.jp/english/ • For more lists, google ‘survey data archive’. 7
  8. Applied linguistic studies employing SASS 1. Chiswick & Miller (2003):

    An impact of L2 proficiency on earnings of immigrants [Canada Census]. 2. Robinson, Rivers, & Brecht (2006): Attitudes towards multilingualism and their determinants [General Social Surveys, US] 3. Terasawa (2018): Position of foreign language learning and other cultural activities in a social and cultural space [Social Stratification and Social Mobility Survey, Japan] 4. Terasawa (2017): English learning divide, i.e. unequal access to obtain English proficiency in an EFL setting, and its generational change [Japanese General Social Surveys] 5. Terasawa (in progress): Cross-national comparison of English learning divides [AsiaBarometer, over 30 jurisdictions]
  9. 1. An impact of L2 proficiency on earnings of immigrants

    • Source: Chiswick, B. & Miller, P. (2003). The complementarity of language and other human capital: immigrant earnings in Canada. Economics of Education Review, 22(5), 469-480. • Data: 1991 Census of Canada, public use microdata file • Respondents: over 25,000 adult male immigrants born in non-English speaking countries • Representativeness: Nationally representative (randomly sampled from a Census) • Variables in focus: • Dependent variable: earnings • Independent variables: L2 proficiency of the official languages (English or French) Major findings • L2 language proficiency had a significantly positive impact on the earnings of immigrants in Canada. • L2 language skills influenced the extent to which education attainment impacted earnings. Immigrants with L2 skills were more likely to benefit significantly from their educational experience compared to immigrants without L2 skills.
  10. 2. Attitudes towards multilingualism and their determinants • Source: Robinson,

    J. P., Rivers, W. P., & Brecht, R. D. (2006). Demographic and sociopolitical predictors of American attitudes towards foreign language policy. Language Policy, 5(4), 421–442. • Data: General Social Surveys, 2000 • Respondents: 2,817 US citizens • Representativeness: Nationally representative (random sampling used) • Dependent variables: 1. Pro-FL attitudes such as ‘Children in the U.S. should learn a second language fluently before they finish high school.’ 2. Anti-English-only-policy attitudes such as the opposition to the statement ‘Bilingual education programs should be eliminated in American public schools.’ Pro-FL Anti-EOP Women + + Younger age + Hispanic, Asian, others + + Highly educated + + Income Urban dwellers + Region (Northeast, Midwest, South, West) Religion (Protestant, Catholic, Jewish, Other, None) Political Ideology = Liberal + Party identification = Democrats + Able to speak one or more FLs + +
  11. 3. Position of foreign language learning and other cultural activities

    in a social and cultural space. • Source: Chapter 5 from Terasawa, T. (2018). Learning English in Japan: Myths and realities (J. Commons, trans.). Melbourne: Trans Pacific Press. • Data: Social Stratification and Social Mobility Survey, 2005, Japan • Respondents: 5,742 Japanese citizens • Representativeness: Nationally representative (random sampling used) • Variables in focus • Behaviour-level: The experience of cultural activities in the past 5-6 years, including FL learning • Demographic: Age group, Gender, Education level, Job status • Theoretical background • FL learning as leisure and consumption (Kubota, R. 2011. Learning a foreign language as leisure and consumption: enjoyment, desire, and the business of eikaiwa. International Journal of Bilingual Education and Bilingualism, 14) • Position of FL learning and other cultural activities in a social and cultural space (P. Bourdieu’s Distinction)
  12. + - Male Female Cultural/ academic capital Correspondence analysis of

    cultural activities experienced in the past 5-6 years FL leaning requires a larger amount of cultural or academic capital than other cultural activities in the Japanese society in the mid-2000s Note: F = female; M = Male
  13. 4. English learning divide: the impact of socioeconomic factors on

    the opportunities to obtain English skills and its generational change • Source: Terasawa, T. (2017). Has socioeconomic development reduced the English divide? A statistical analysis of access to English skills in Japan. Journal of Multilingual and Multicultural Development, 38(8), 671-685 • Data: Japanese General Social Surveys, 2002, 2003, 2006, and 2010 (four datasets pooled). • Respondents: 9,539 Japanese citizens (in total) • Representativeness: Nationally representative (random sampling used) • Variables in focus: Dependent variable: Self-reported L2 English proficiency Independent variables: Family socioeconomic status at the age of 15 Grouping variable: Generational cohort
  14. • Some types of English learning divides (ELD) deceased •

    Being raised in an urban area & in higher income families: ELD caused by such physical disparities might tend to be reduced relatively easily. • Other types of ELD did not decrease (despite the fact that Japan’s socioeconomic and educational conditions were improved in the 80 years). • Parents’ education level & father’s job status: ELD caused by such cultural disparities might tend to persist. ↑ No disparity
  15. 5. Cross-national comparison of English learning divides • Source: Terasawa

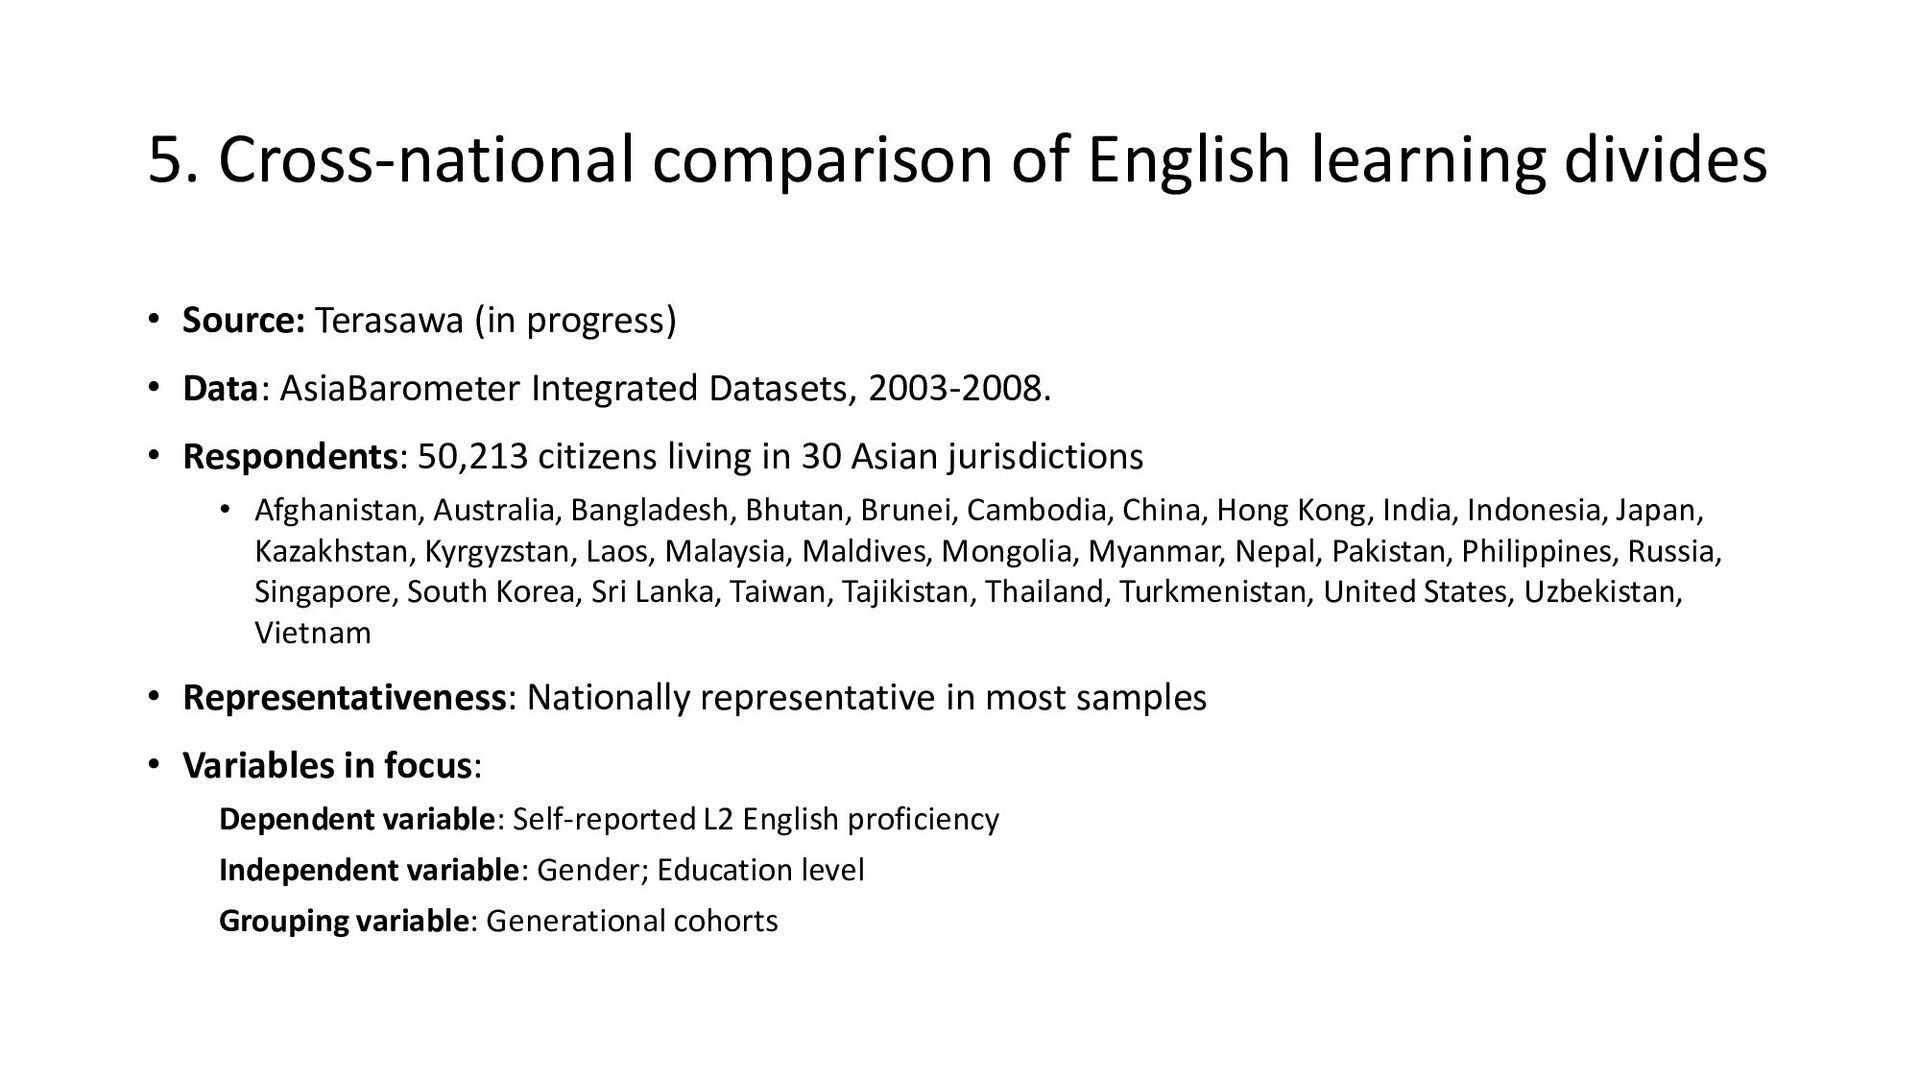
    (in progress) • Data: AsiaBarometer Integrated Datasets, 2003-2008. • Respondents: 50,213 citizens living in 30 Asian jurisdictions • Afghanistan, Australia, Bangladesh, Bhutan, Brunei, Cambodia, China, Hong Kong, India, Indonesia, Japan, Kazakhstan, Kyrgyzstan, Laos, Malaysia, Maldives, Mongolia, Myanmar, Nepal, Pakistan, Philippines, Russia, Singapore, South Korea, Sri Lanka, Taiwan, Tajikistan, Thailand, Turkmenistan, United States, Uzbekistan, Vietnam • Representativeness: Nationally representative in most samples • Variables in focus: Dependent variable: Self-reported L2 English proficiency Independent variable: Gender; Education level Grouping variable: Generational cohorts
  16. Taiwan Tajikistan Thailand Turkmenist Uzbekistan Vietnam Pakistan Philippines Russia Singapore

    South Kore Sri Lanka Laos Malaysia Maldives Mongolia Myanmar Nepal Hong Kong India Indonesia Japan Kazakhstan Kyrgyzstan Afghanistan Bangladesh Bhutan Brunei Cambodia China 20-29 30-39 40-49 50-59 60-69 20-29 30-39 40-49 50-59 60-69 20-29 30-39 40-49 50-59 60-69 20-29 30-39 40-49 50-59 60-69 20-29 30-39 40-49 50-59 60-69 20-29 30-39 40-49 50-59 60-69 0% 25% 50% 75% 100% 0% 25% 50% 75% 100% 0% 25% 50% 75% 100% 0% 25% 50% 75% 100% 0% 25% 50% 75% 100% Age group Gender - Education Female - Edu:High Female - Edu:Low/Mid Male - Edu:High Male - Edu:Low/Mid Vertical axis: % of people who speak English Cross-national trends of English learning divides
  17. Summary Great strengths and weaknesses • Strength: Large-scale, representative, well-designed

    • Weakness: We cannot do anything when we failed to find an appropriate dataset. What to do if we failed to find it? 1. Do not use secondary analysis. Use other approaches 2. Find an indirectly related dataset and modify our own research question so that it’s fitted to the dataset. Search, search, and search for a proper dataset in data archives