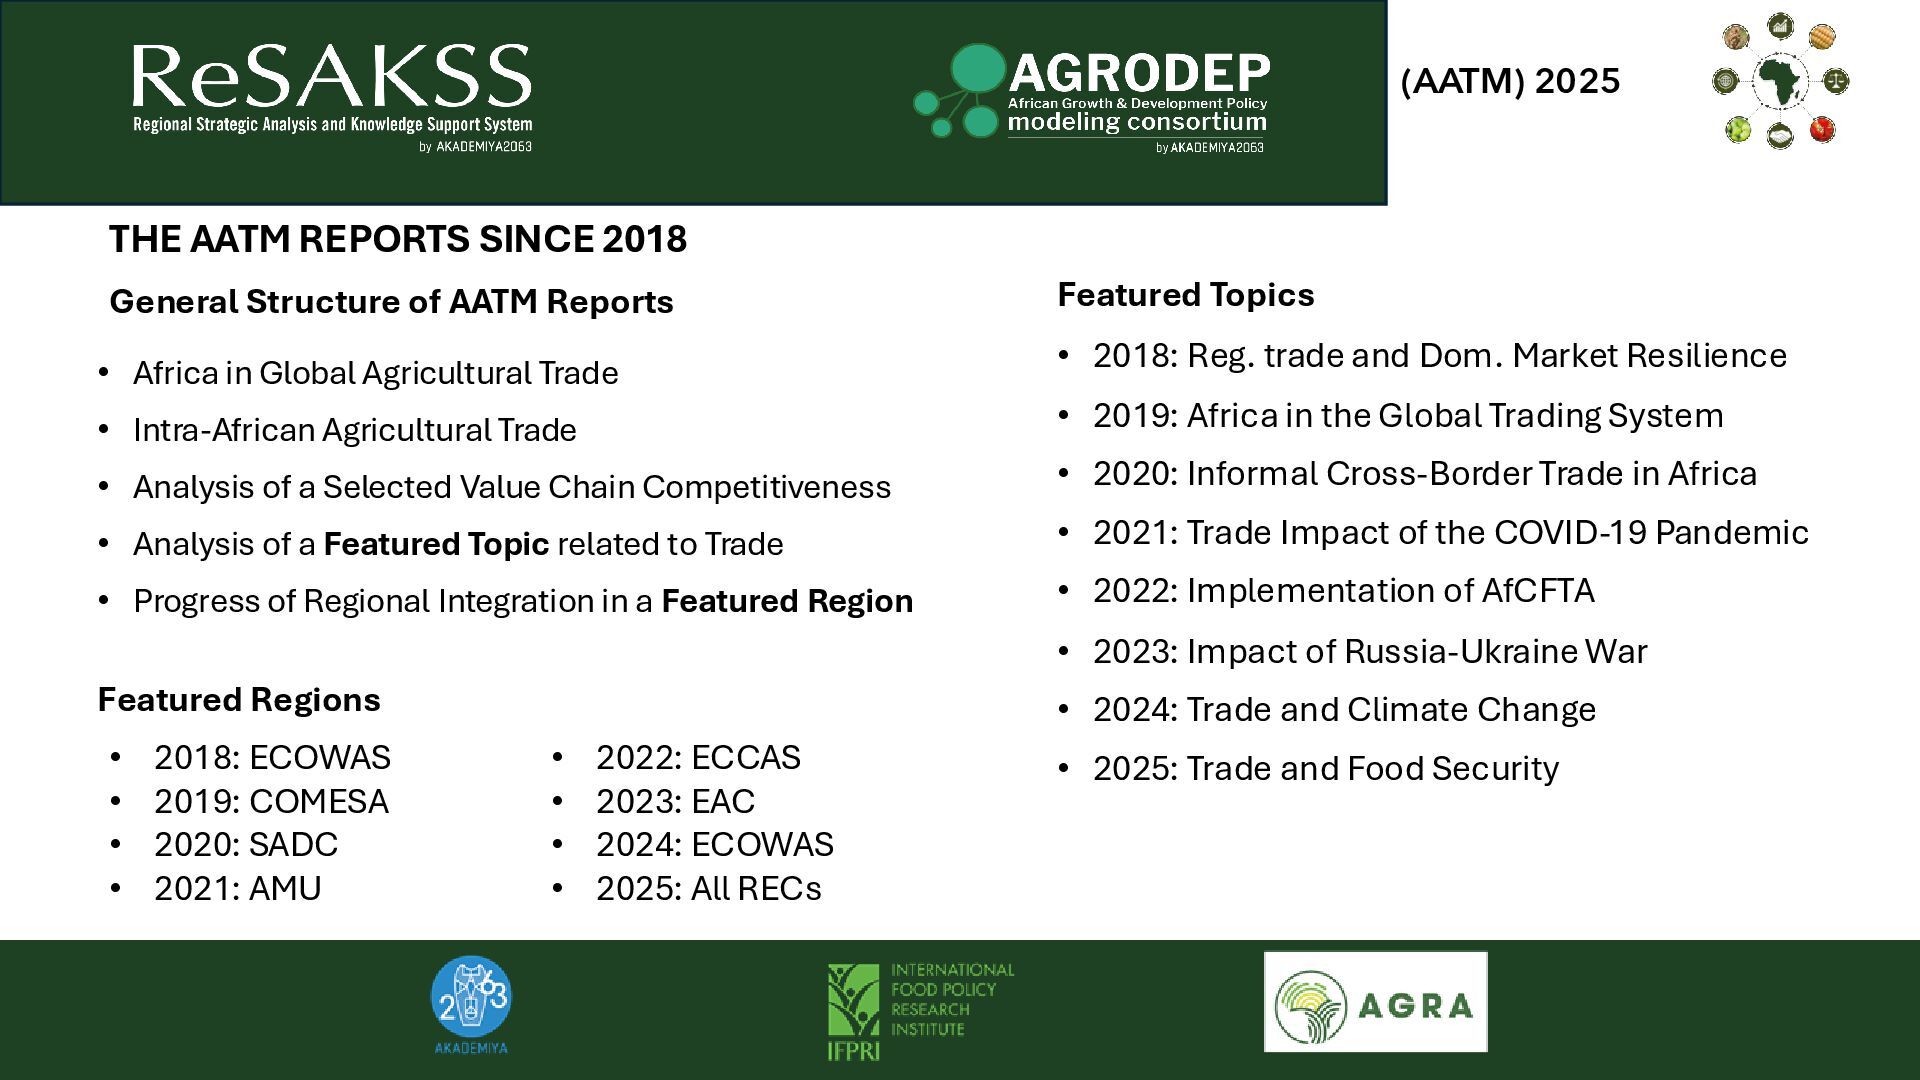
Agricultural Trade • Analysis of a Selected Value Chain Competitiveness • Analysis of a Featured Topic related to Trade • Progress of Regional Integration in a Featured Region • 2018: Reg. trade and Dom. Market Resilience • 2019: Africa in the Global Trading System • 2020: Informal Cross-Border Trade in Africa • 2021: Trade Impact of the COVID-19 Pandemic • 2022: Implementation of AfCFTA • 2023: Impact of Russia-Ukraine War • 2024: Trade and Climate Change • 2025: Trade and Food Security General Structure of AATM Reports Featured Topics THE AATM REPORTS SINCE 2018 Featured Regions • 2018: ECOWAS • 2019: COMESA • 2020: SADC • 2021: AMU • 2022: ECCAS • 2023: EAC • 2024: ECOWAS • 2025: All RECs
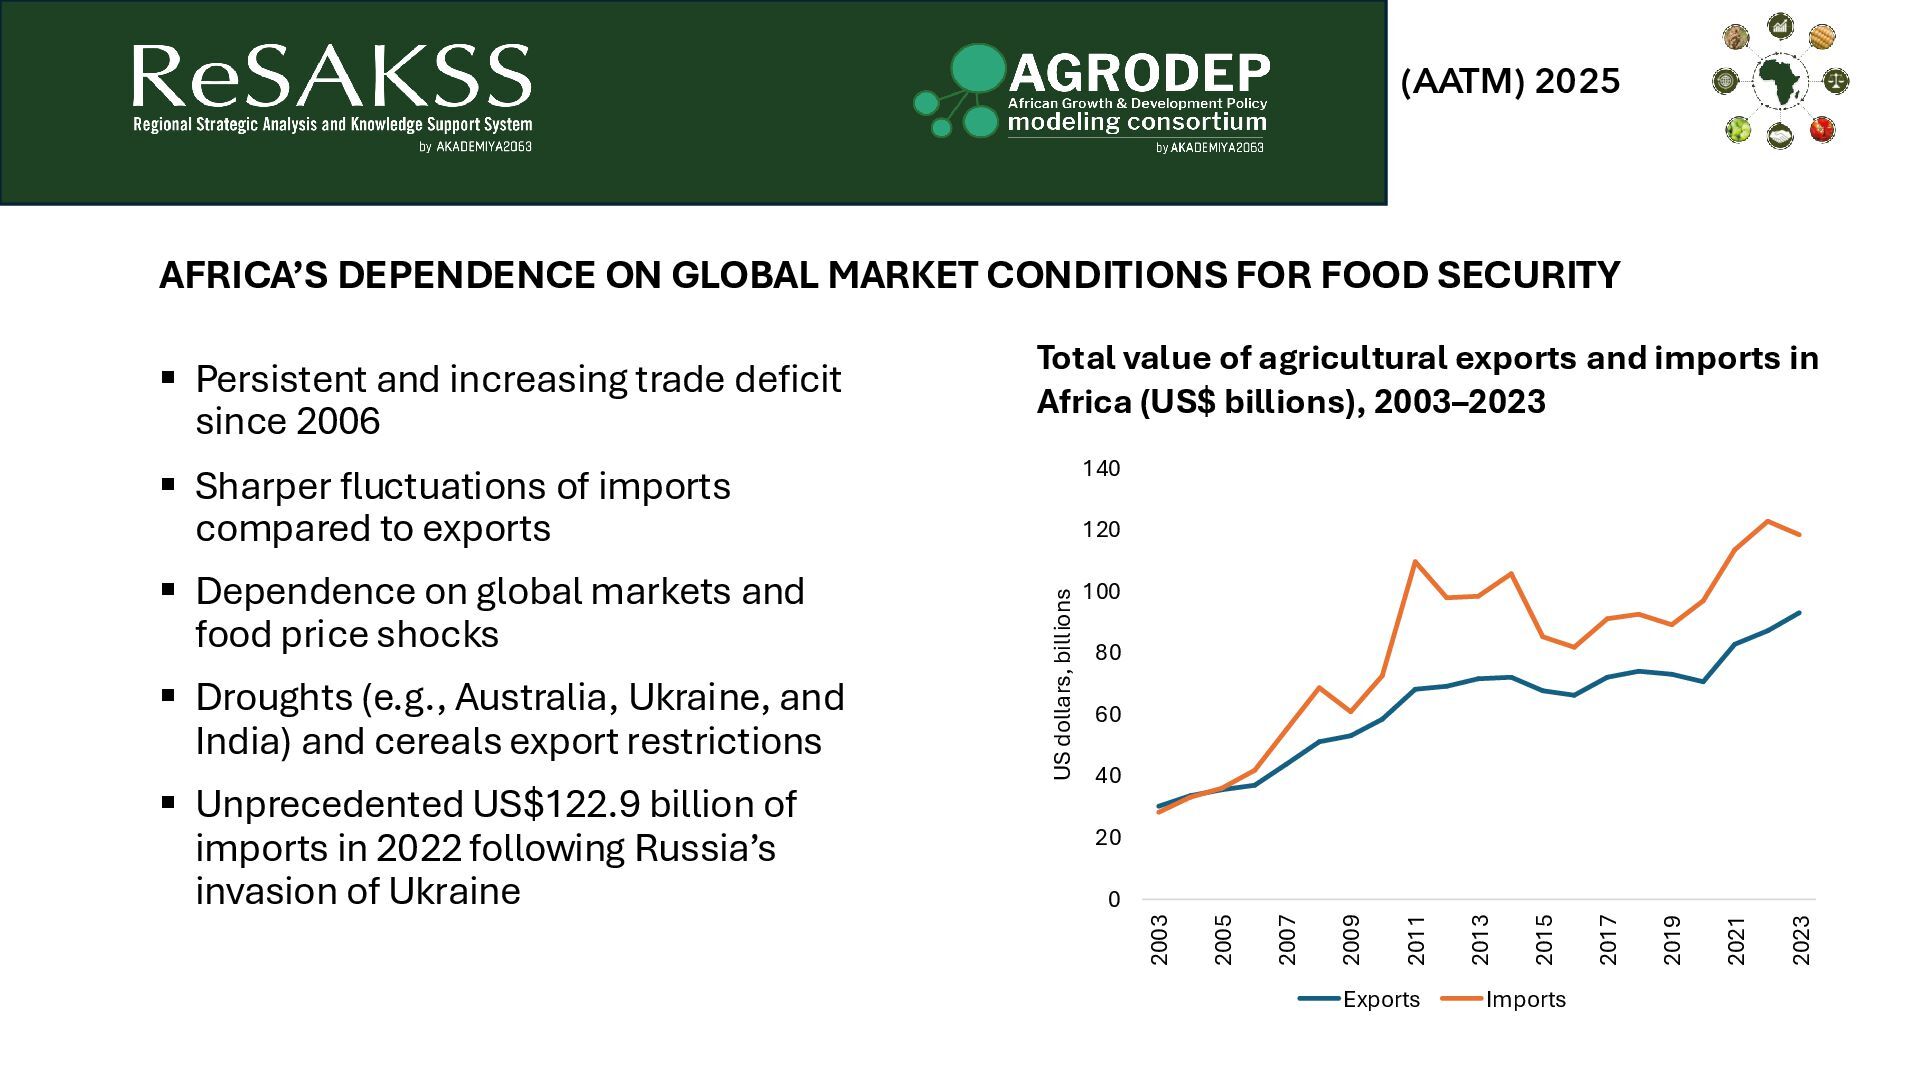
▪ Sharper fluctuations of imports compared to exports ▪ Dependence on global markets and food price shocks ▪ Droughts (e.g., Australia, Ukraine, and India) and cereals export restrictions ▪ Unprecedented US$122.9 billion of imports in 2022 following Russia’s invasion of Ukraine 0 20 40 60 80 100 120 140 2003 2005 2007 2009 2011 2013 2015 2017 2019 2021 2023 US dollars, billions Exports Imports Total value of agricultural exports and imports in Africa (US$ billions), 2003–2023 AFRICA’S DEPENDENCE ON GLOBAL MARKET CONDITIONS FOR FOOD SECURITY
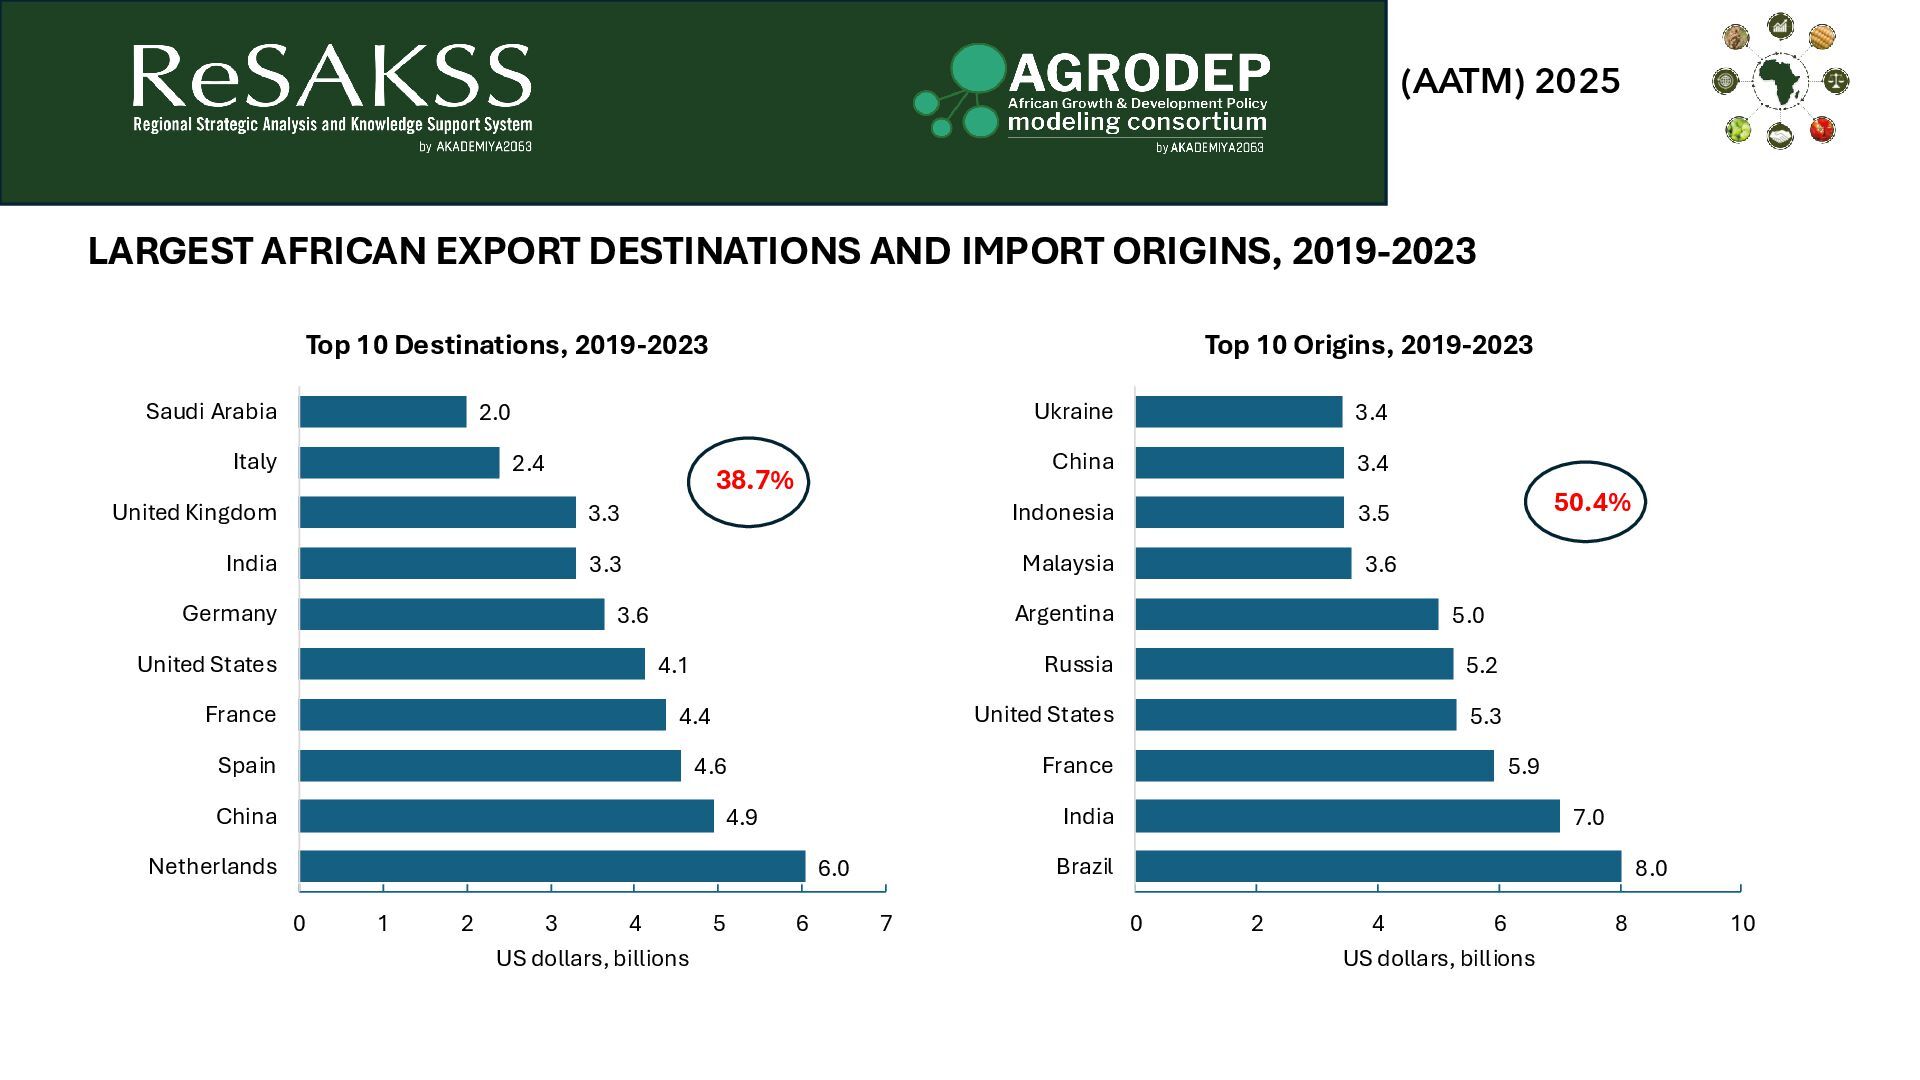
2.4 2.0 0 1 2 3 4 5 6 7 Netherlands China Spain France United States Germany India United Kingdom Italy Saudi Arabia US dollars, billions Top 10 Destinations, 2019-2023 38.7% 8.0 7.0 5.9 5.3 5.2 5.0 3.6 3.5 3.4 3.4 0 2 4 6 8 10 Brazil India France United States Russia Argentina Malaysia Indonesia China Ukraine US dollars, billions Top 10 Origins, 2019-2023 LARGEST AFRICAN EXPORT DESTINATIONS AND IMPORT ORIGINS, 2019-2023 50.4%
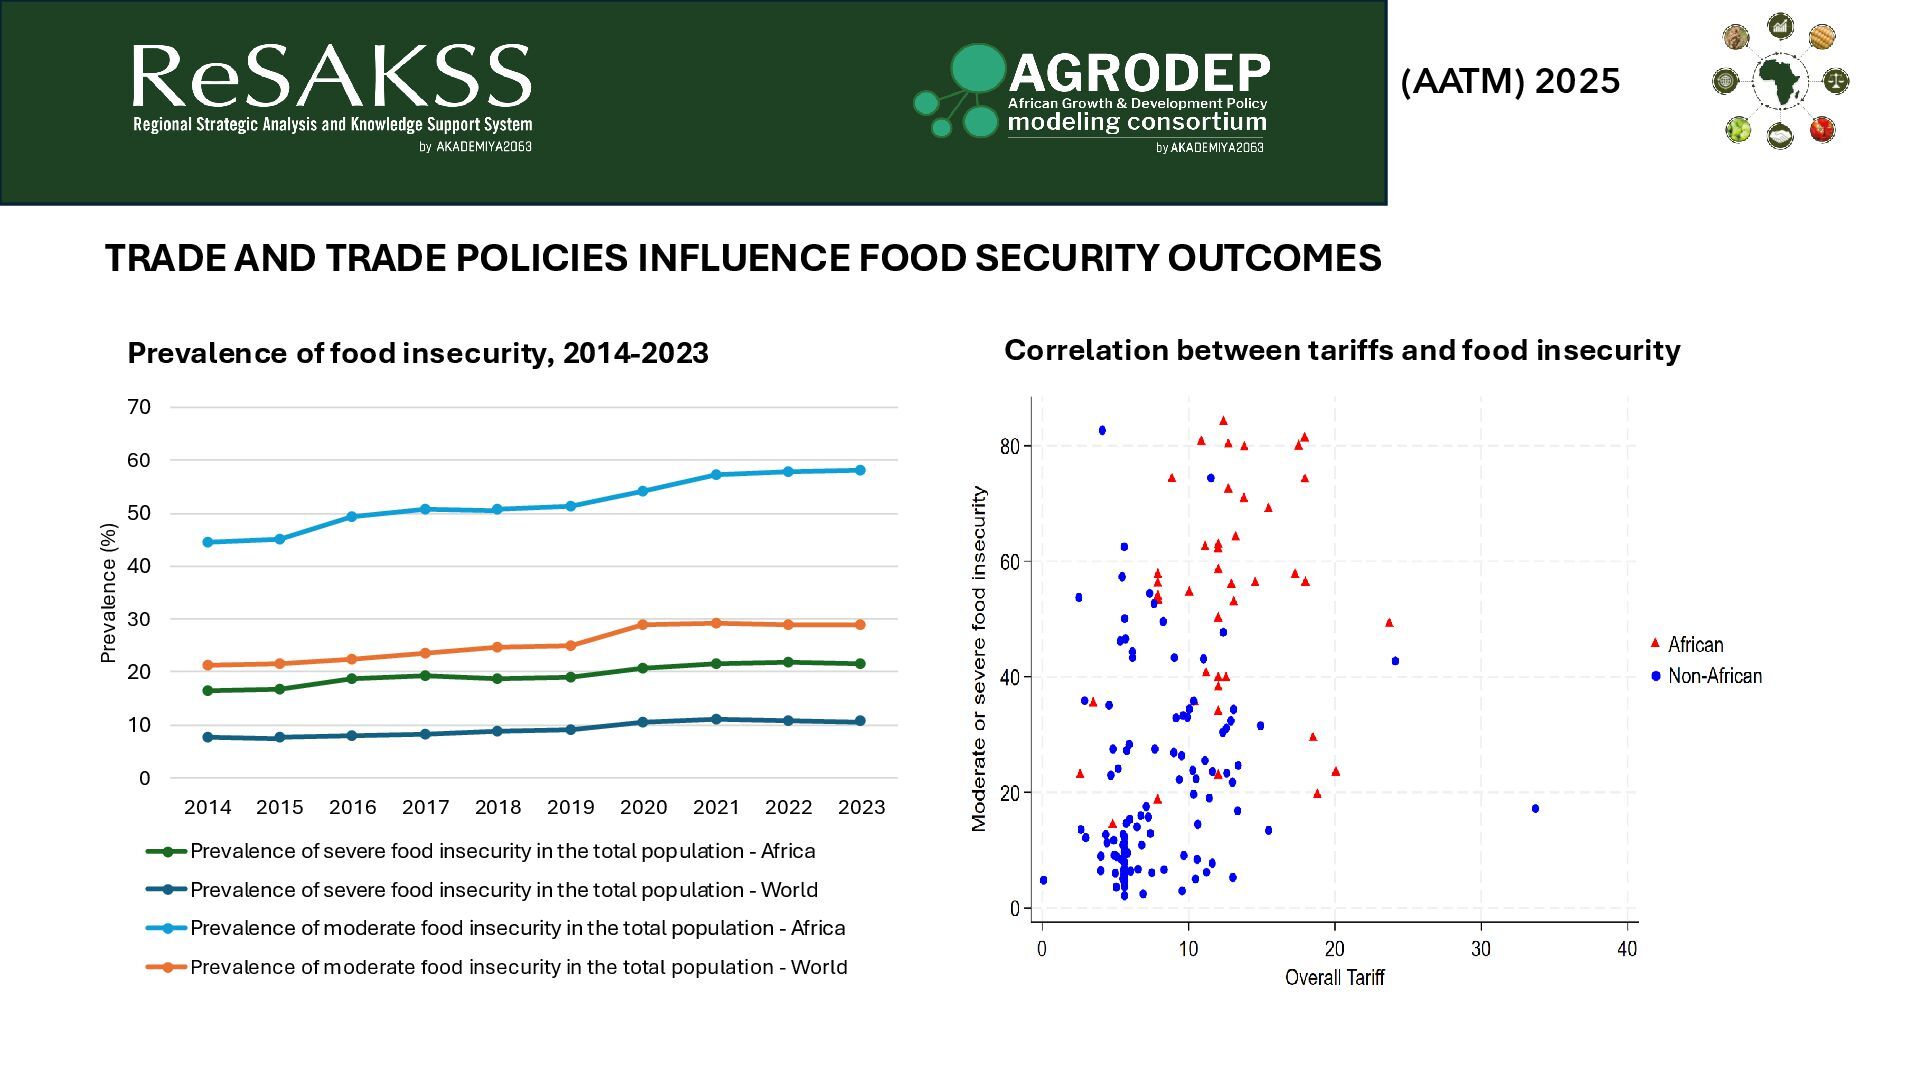
2014 2015 2016 2017 2018 2019 2020 2021 2022 2023 Prevalence (%) Prevalence of severe food insecurity in the total population - Africa Prevalence of severe food insecurity in the total population - World Prevalence of moderate food insecurity in the total population - Africa Prevalence of moderate food insecurity in the total population - World Prevalence of food insecurity, 2014-2023 Correlation between tariffs and food insecurity TRADE AND TRADE POLICIES INFLUENCE FOOD SECURITY OUTCOMES
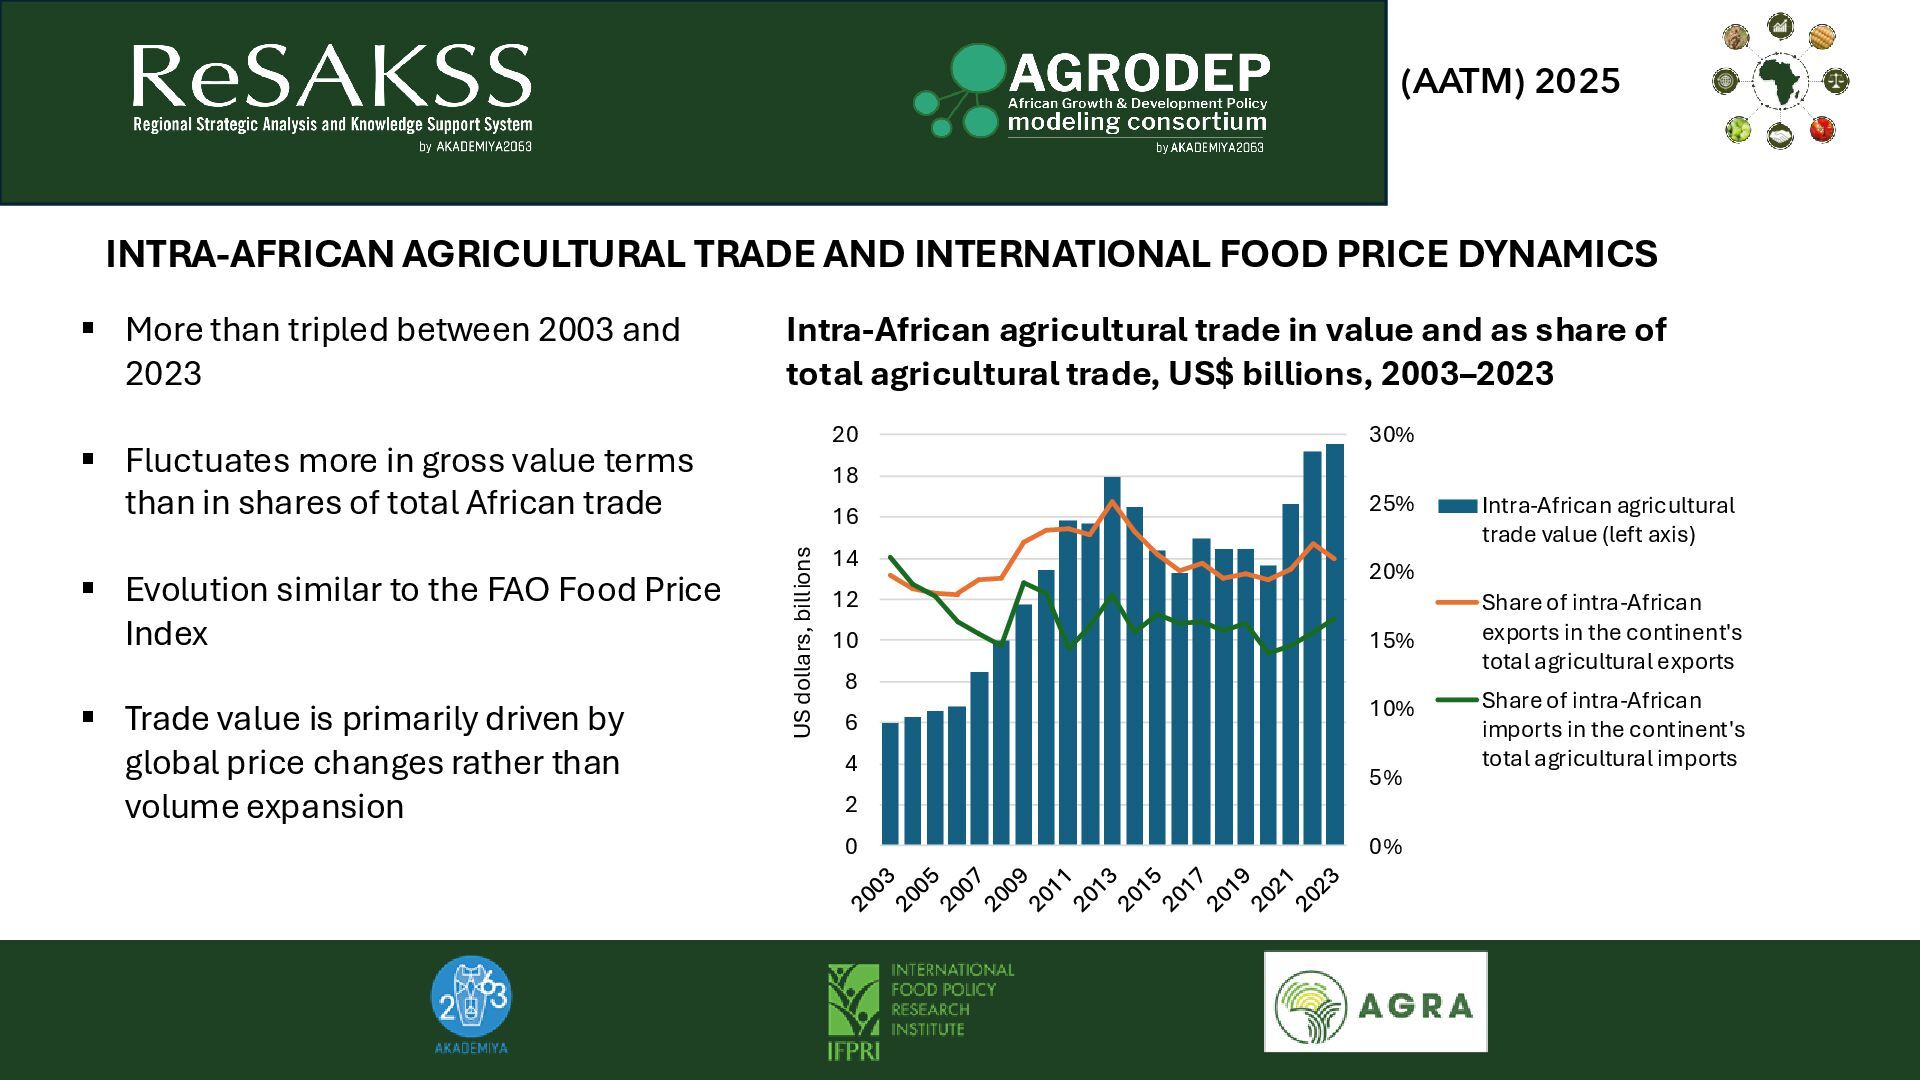
2 4 6 8 10 12 14 16 18 20 US dollars, billions Intra-African agricultural trade value (left axis) Share of intra-African exports in the continent's total agricultural exports Share of intra-African imports in the continent's total agricultural imports Intra-African agricultural trade in value and as share of total agricultural trade, US$ billions, 2003–2023 ▪ More than tripled between 2003 and 2023 ▪ Fluctuates more in gross value terms than in shares of total African trade ▪ Evolution similar to the FAO Food Price Index ▪ Trade value is primarily driven by global price changes rather than volume expansion INTRA-AFRICAN AGRICULTURAL TRADE AND INTERNATIONAL FOOD PRICE DYNAMICS
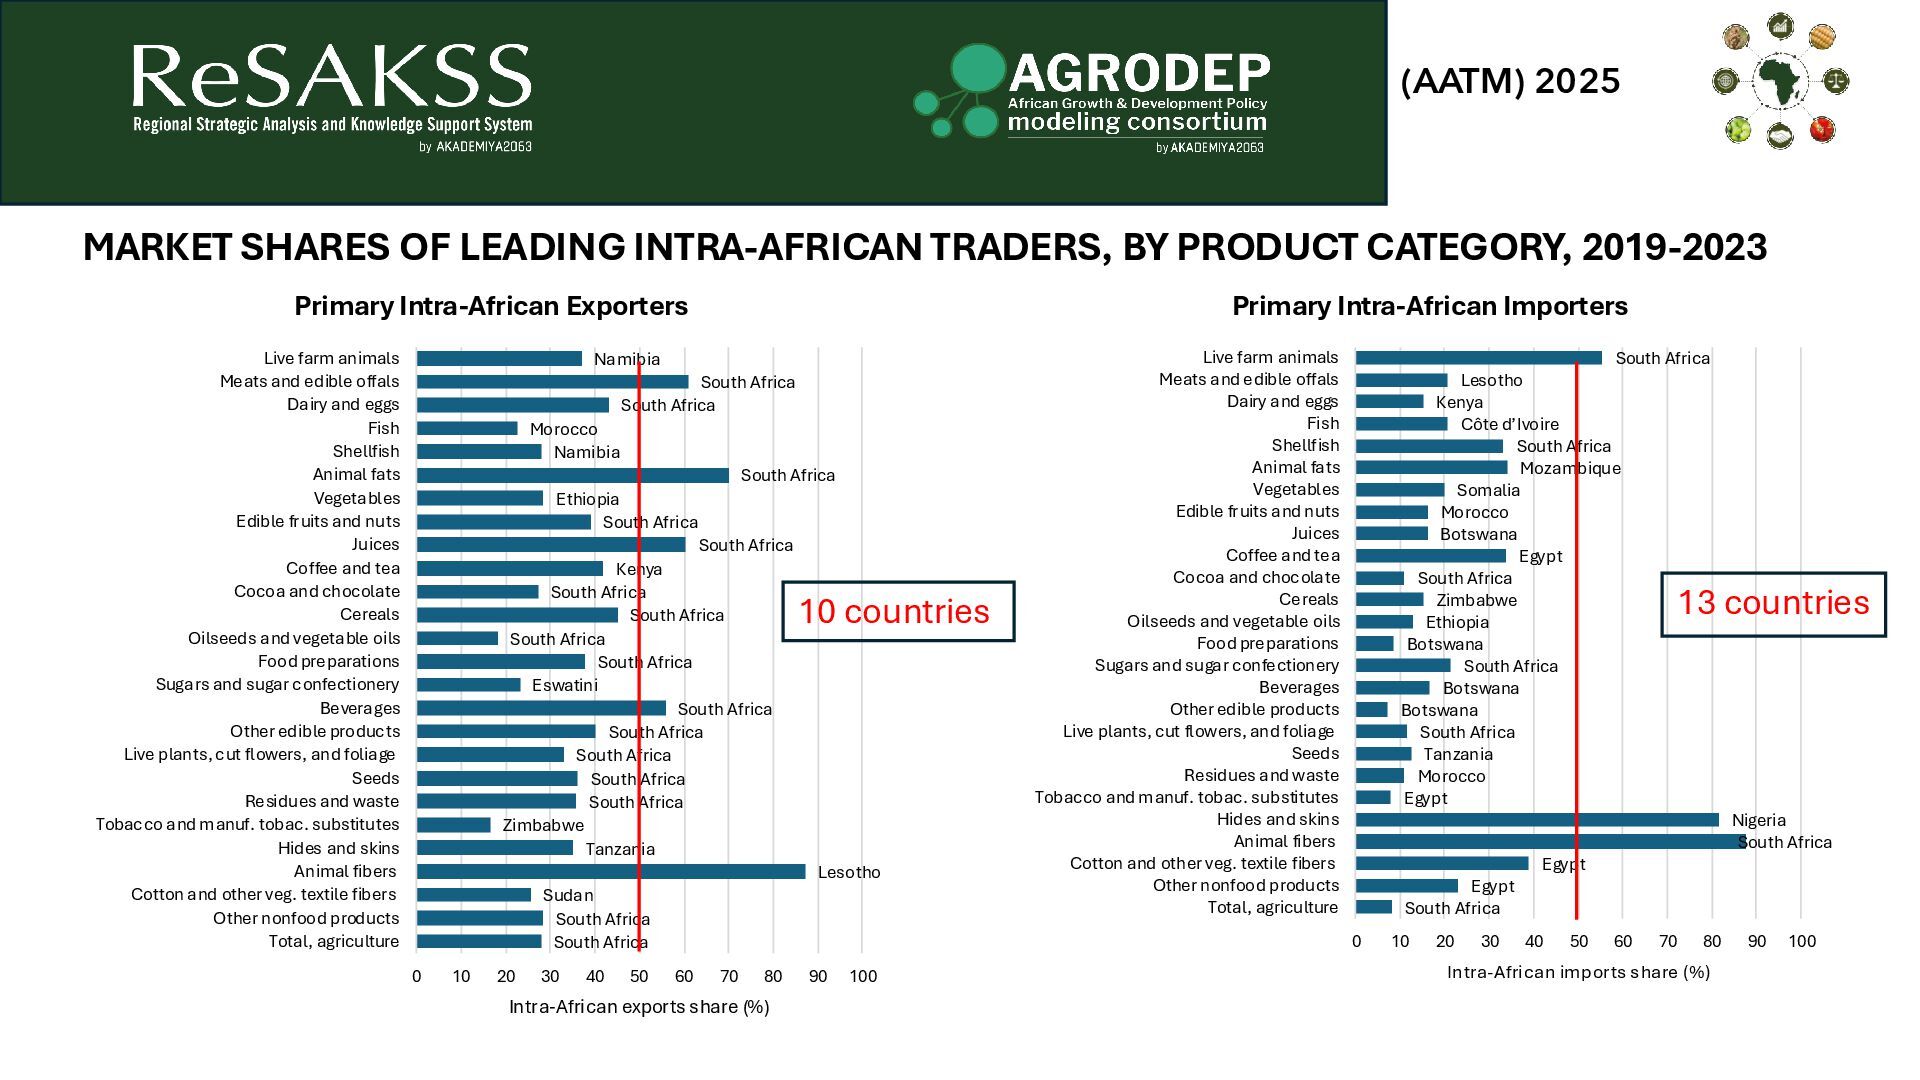
South Africa South Africa South Africa South Africa South Africa Eswatini South Africa South Africa South Africa South Africa Kenya South Africa South Africa Ethiopia South Africa Namibia Morocco South Africa South Africa Namibia 0 10 20 30 40 50 60 70 80 90 100 Total, agriculture Other nonfood products Cotton and other veg. textile fibers Animal fibers Hides and skins Tobacco and manuf. tobac. substitutes Residues and waste Seeds Live plants, cut flowers, and foliage Other edible products Beverages Sugars and sugar confectionery Food preparations Oilseeds and vegetable oils Cereals Cocoa and chocolate Coffee and tea Juices Edible fruits and nuts Vegetables Animal fats Shellfish Fish Dairy and eggs Meats and edible offals Live farm animals Intra-African exports share (%) Primary Intra-African Exporters South Africa Egypt Egypt South Africa Nigeria Egypt Morocco Tanzania South Africa Botswana Botswana South Africa Botswana Ethiopia Zimbabwe South Africa Egypt Botswana Morocco Somalia Mozambique South Africa Côte d’Ivoire Kenya Lesotho South Africa 0 10 20 30 40 50 60 70 80 90 100 Total, agriculture Other nonfood products Cotton and other veg. textile fibers Animal fibers Hides and skins Tobacco and manuf. tobac. substitutes Residues and waste Seeds Live plants, cut flowers, and foliage Other edible products Beverages Sugars and sugar confectionery Food preparations Oilseeds and vegetable oils Cereals Cocoa and chocolate Coffee and tea Juices Edible fruits and nuts Vegetables Animal fats Shellfish Fish Dairy and eggs Meats and edible offals Live farm animals Intra-African imports share (%) Primary Intra-African Importers MARKET SHARES OF LEADING INTRA-AFRICAN TRADERS, BY PRODUCT CATEGORY, 2019-2023 10 countries 13 countries
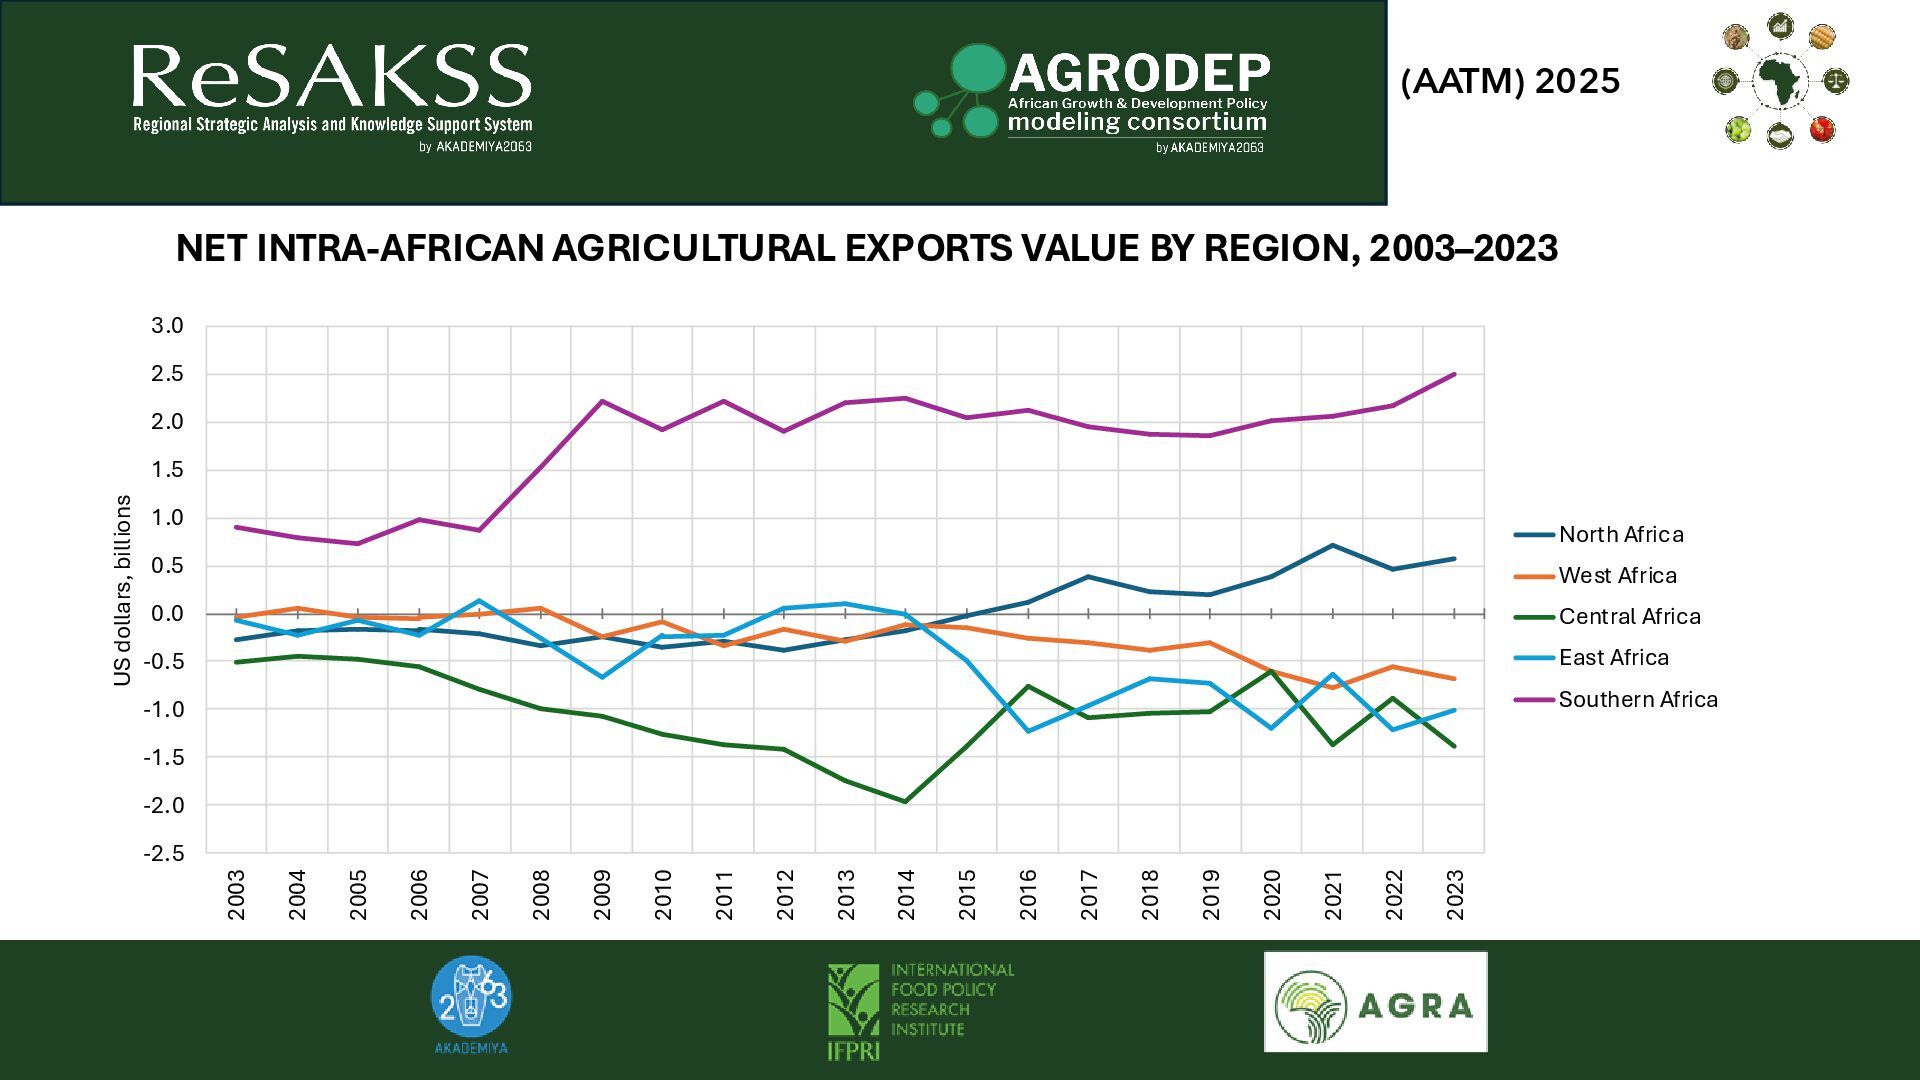
1.5 2.0 2.5 3.0 2003 2004 2005 2006 2007 2008 2009 2010 2011 2012 2013 2014 2015 2016 2017 2018 2019 2020 2021 2022 2023 US dollars, billions North Africa West Africa Central Africa East Africa Southern Africa NET INTRA-AFRICAN AGRICULTURAL EXPORTS VALUE BY REGION, 2003–2023
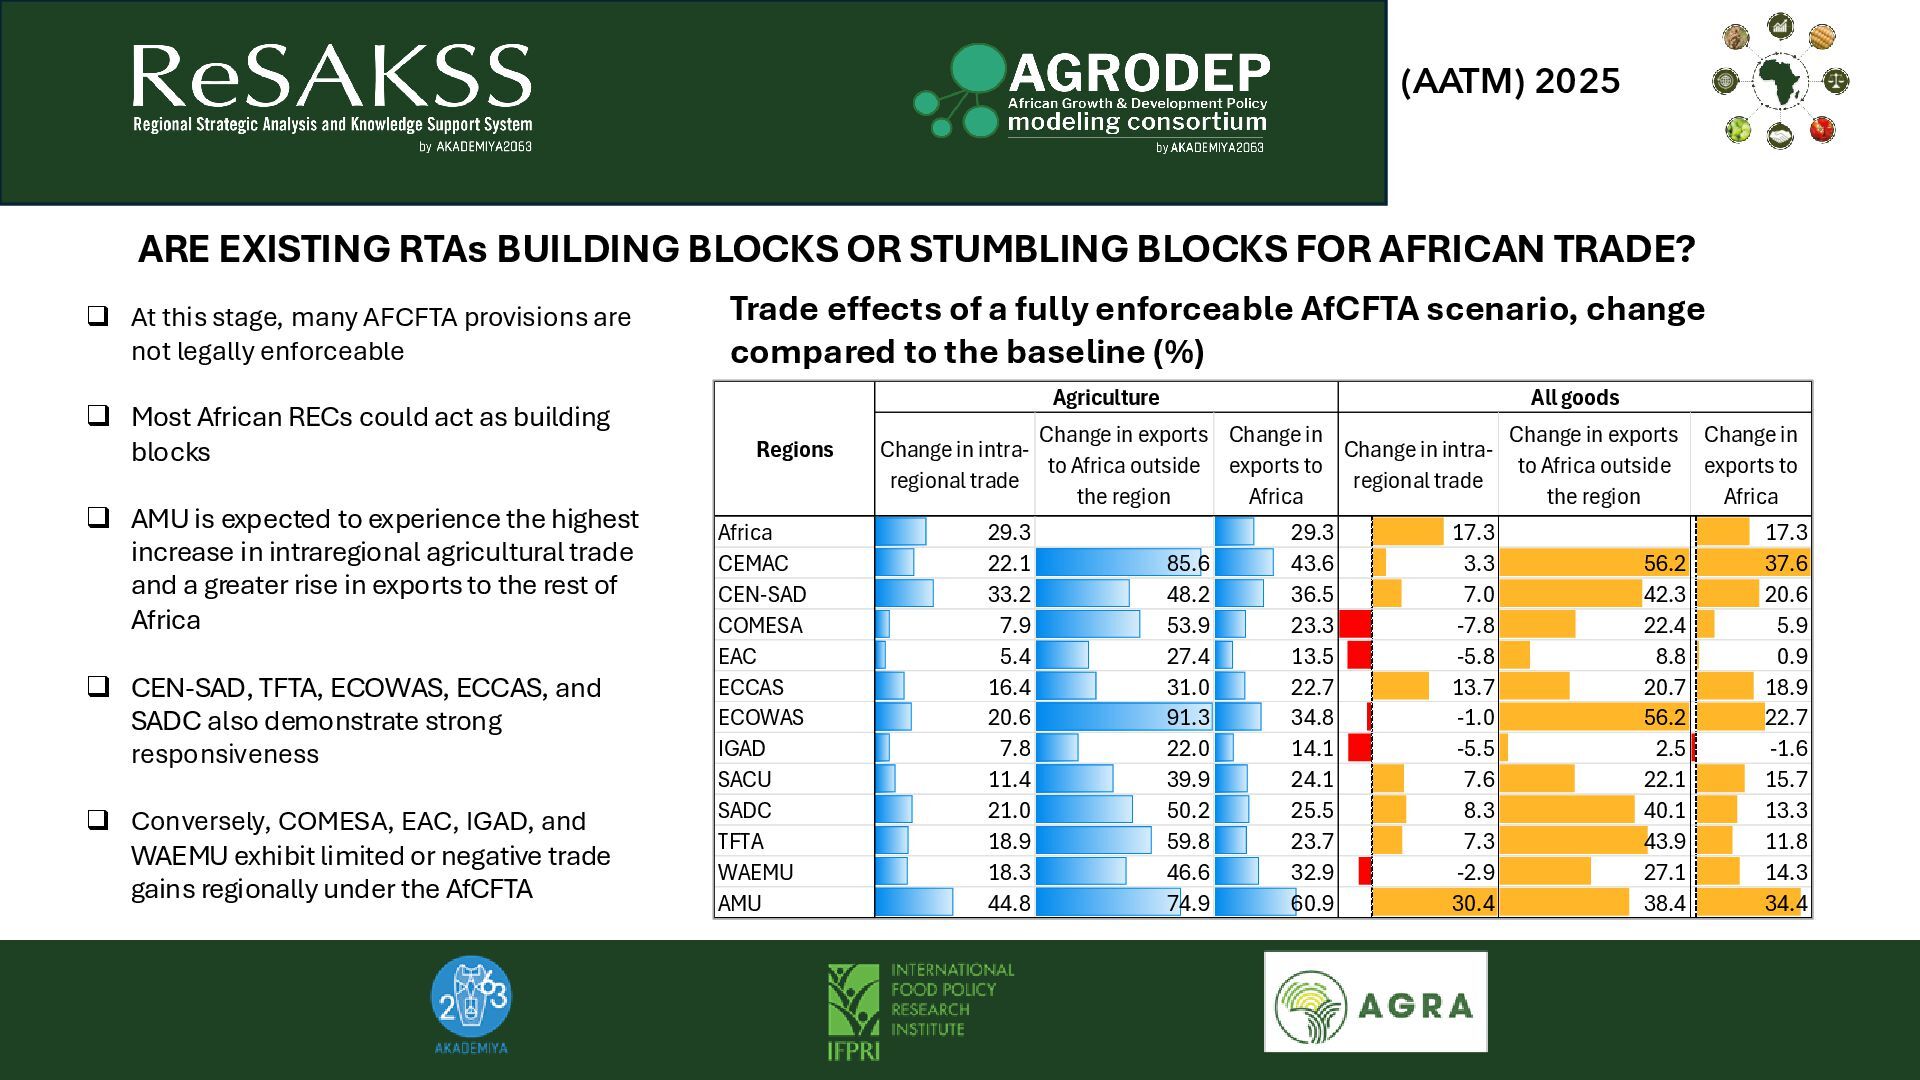
to Africa outside the region Change in exports to Africa Change in intra- regional trade Change in exports to Africa outside the region Change in exports to Africa Africa 29.3 29.3 17.3 17.3 CEMAC 22.1 85.6 43.6 3.3 56.2 37.6 CEN-SAD 33.2 48.2 36.5 7.0 42.3 20.6 COMESA 7.9 53.9 23.3 -7.8 22.4 5.9 EAC 5.4 27.4 13.5 -5.8 8.8 0.9 ECCAS 16.4 31.0 22.7 13.7 20.7 18.9 ECOWAS 20.6 91.3 34.8 -1.0 56.2 22.7 IGAD 7.8 22.0 14.1 -5.5 2.5 -1.6 SACU 11.4 39.9 24.1 7.6 22.1 15.7 SADC 21.0 50.2 25.5 8.3 40.1 13.3 TFTA 18.9 59.8 23.7 7.3 43.9 11.8 WAEMU 18.3 46.6 32.9 -2.9 27.1 14.3 AMU 44.8 74.9 60.9 30.4 38.4 34.4 Regions Agriculture All goods Trade effects of a fully enforceable AfCFTA scenario, change compared to the baseline (%) ❑ At this stage, many AFCFTA provisions are not legally enforceable ❑ Most African RECs could act as building blocks ❑ AMU is expected to experience the highest increase in intraregional agricultural trade and a greater rise in exports to the rest of Africa ❑ CEN-SAD, TFTA, ECOWAS, ECCAS, and SADC also demonstrate strong responsiveness ❑ Conversely, COMESA, EAC, IGAD, and WAEMU exhibit limited or negative trade gains regionally under the AfCFTA ARE EXISTING RTAs BUILDING BLOCKS OR STUMBLING BLOCKS FOR AFRICAN TRADE?
among analysts) ▪ Cereals yields are only at 40% of world average ▪ Fertilizers (organic and mineral) are crucial for delivering essential nutrients to crops ▪ Boosting agricultural productivity -> enhancing food security. ohigher crop yields and production ofood more available and affordable oInelastic demand for main food products ▪ Higher crop yields on the same land area -> reduce the need to expand agricultural land, helping to prevent deforestation.
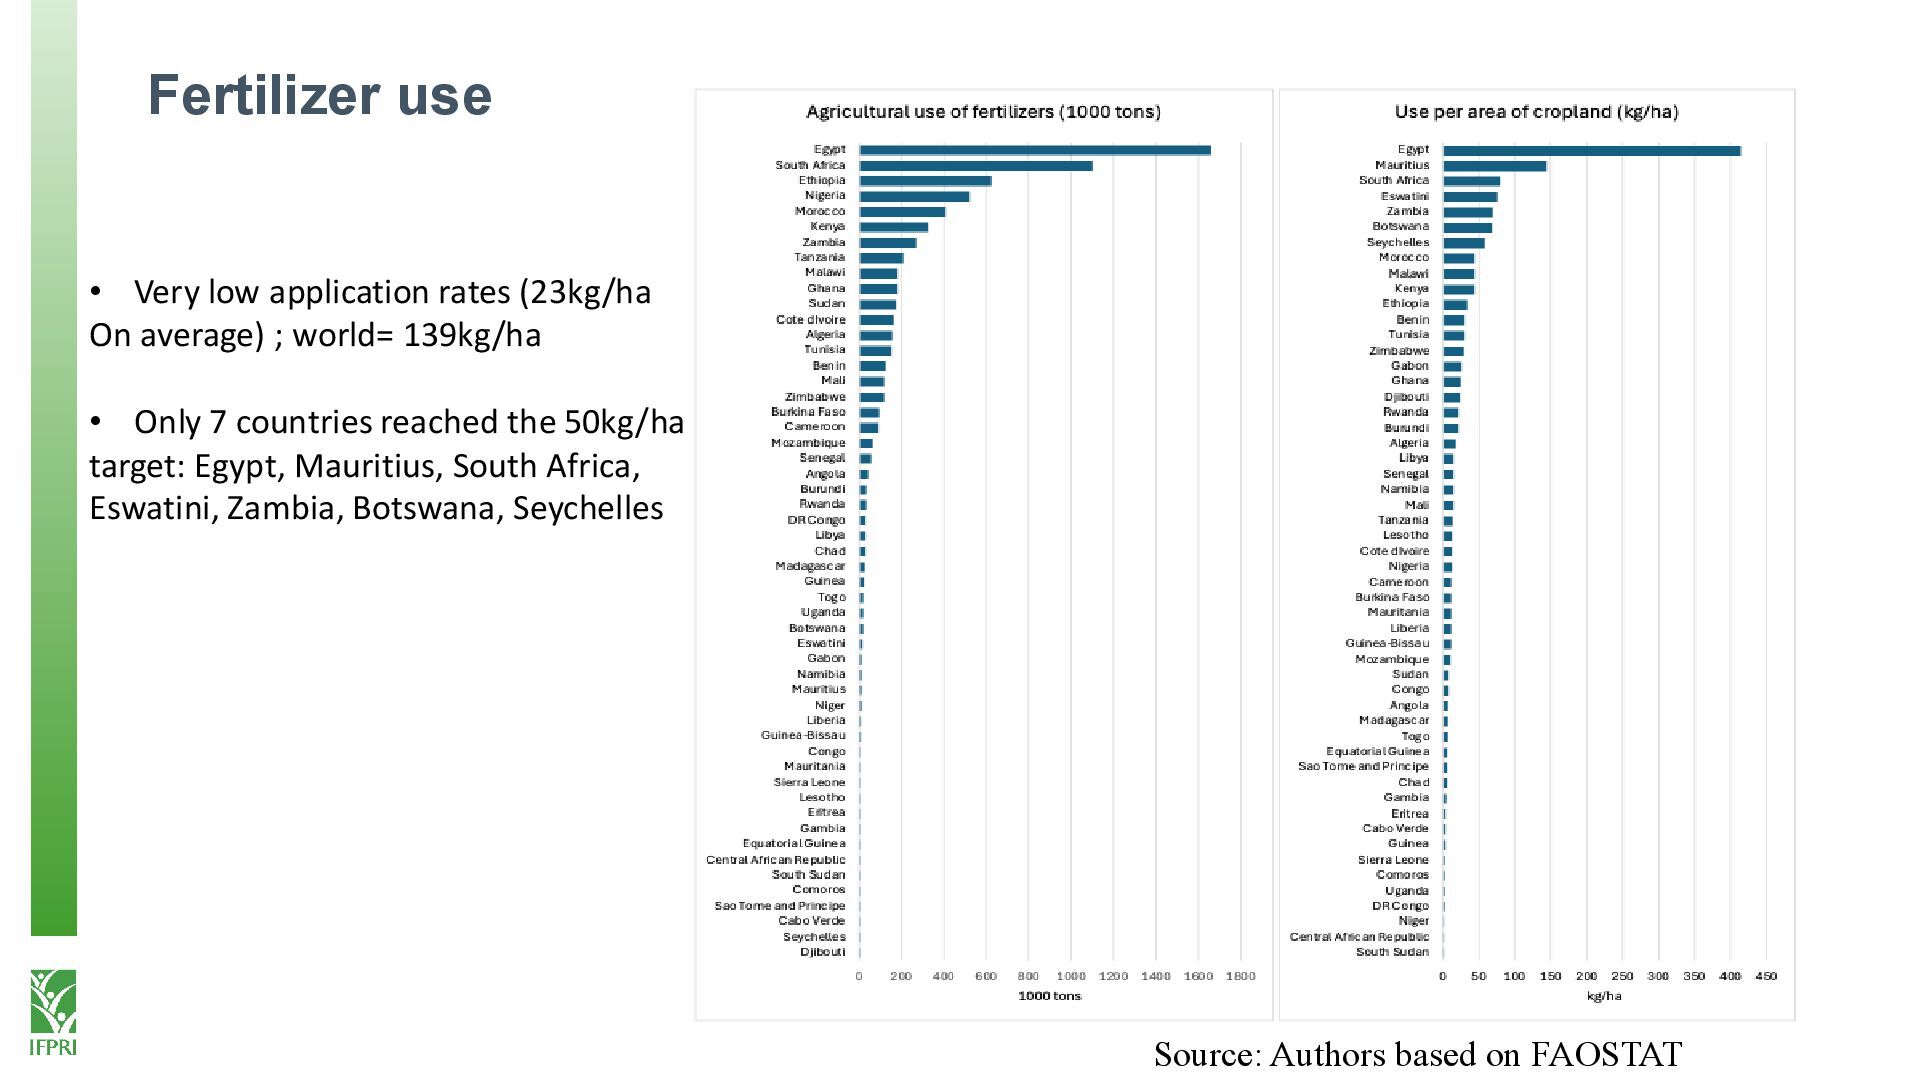
application rates (23kg/ha On average) ; world= 139kg/ha • Only 7 countries reached the 50kg/ha target: Egypt, Mauritius, South Africa, Eswatini, Zambia, Botswana, Seychelles
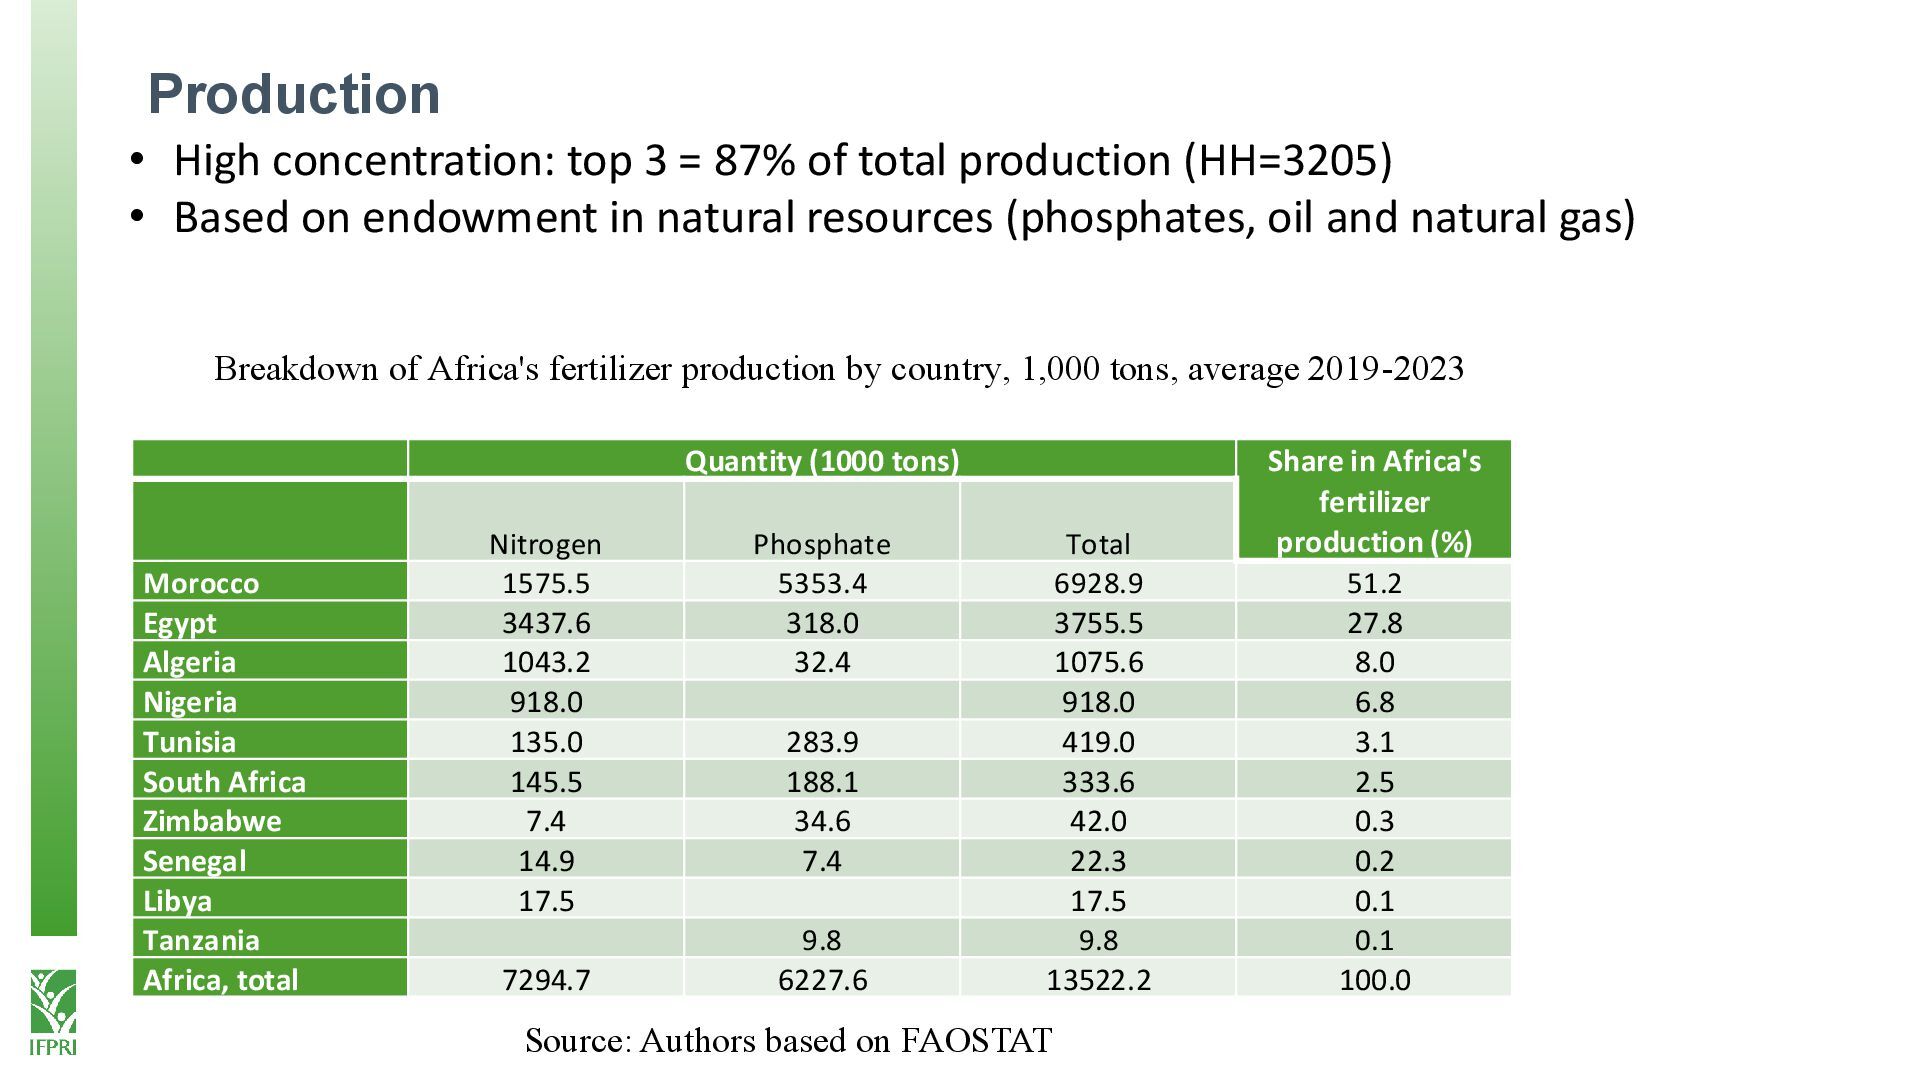
Nitrogen Phosphate Total Morocco 1575.5 5353.4 6928.9 51.2 Egypt 3437.6 318.0 3755.5 27.8 Algeria 1043.2 32.4 1075.6 8.0 Nigeria 918.0 918.0 6.8 Tunisia 135.0 283.9 419.0 3.1 South Africa 145.5 188.1 333.6 2.5 Zimbabwe 7.4 34.6 42.0 0.3 Senegal 14.9 7.4 22.3 0.2 Libya 17.5 17.5 0.1 Tanzania 9.8 9.8 0.1 Africa, total 7294.7 6227.6 13522.2 100.0 Breakdown of Africa's fertilizer production by country, 1,000 tons, average 2019-2023 Source: Authors based on FAOSTAT • High concentration: top 3 = 87% of total production (HH=3205) • Based on endowment in natural resources (phosphates, oil and natural gas)
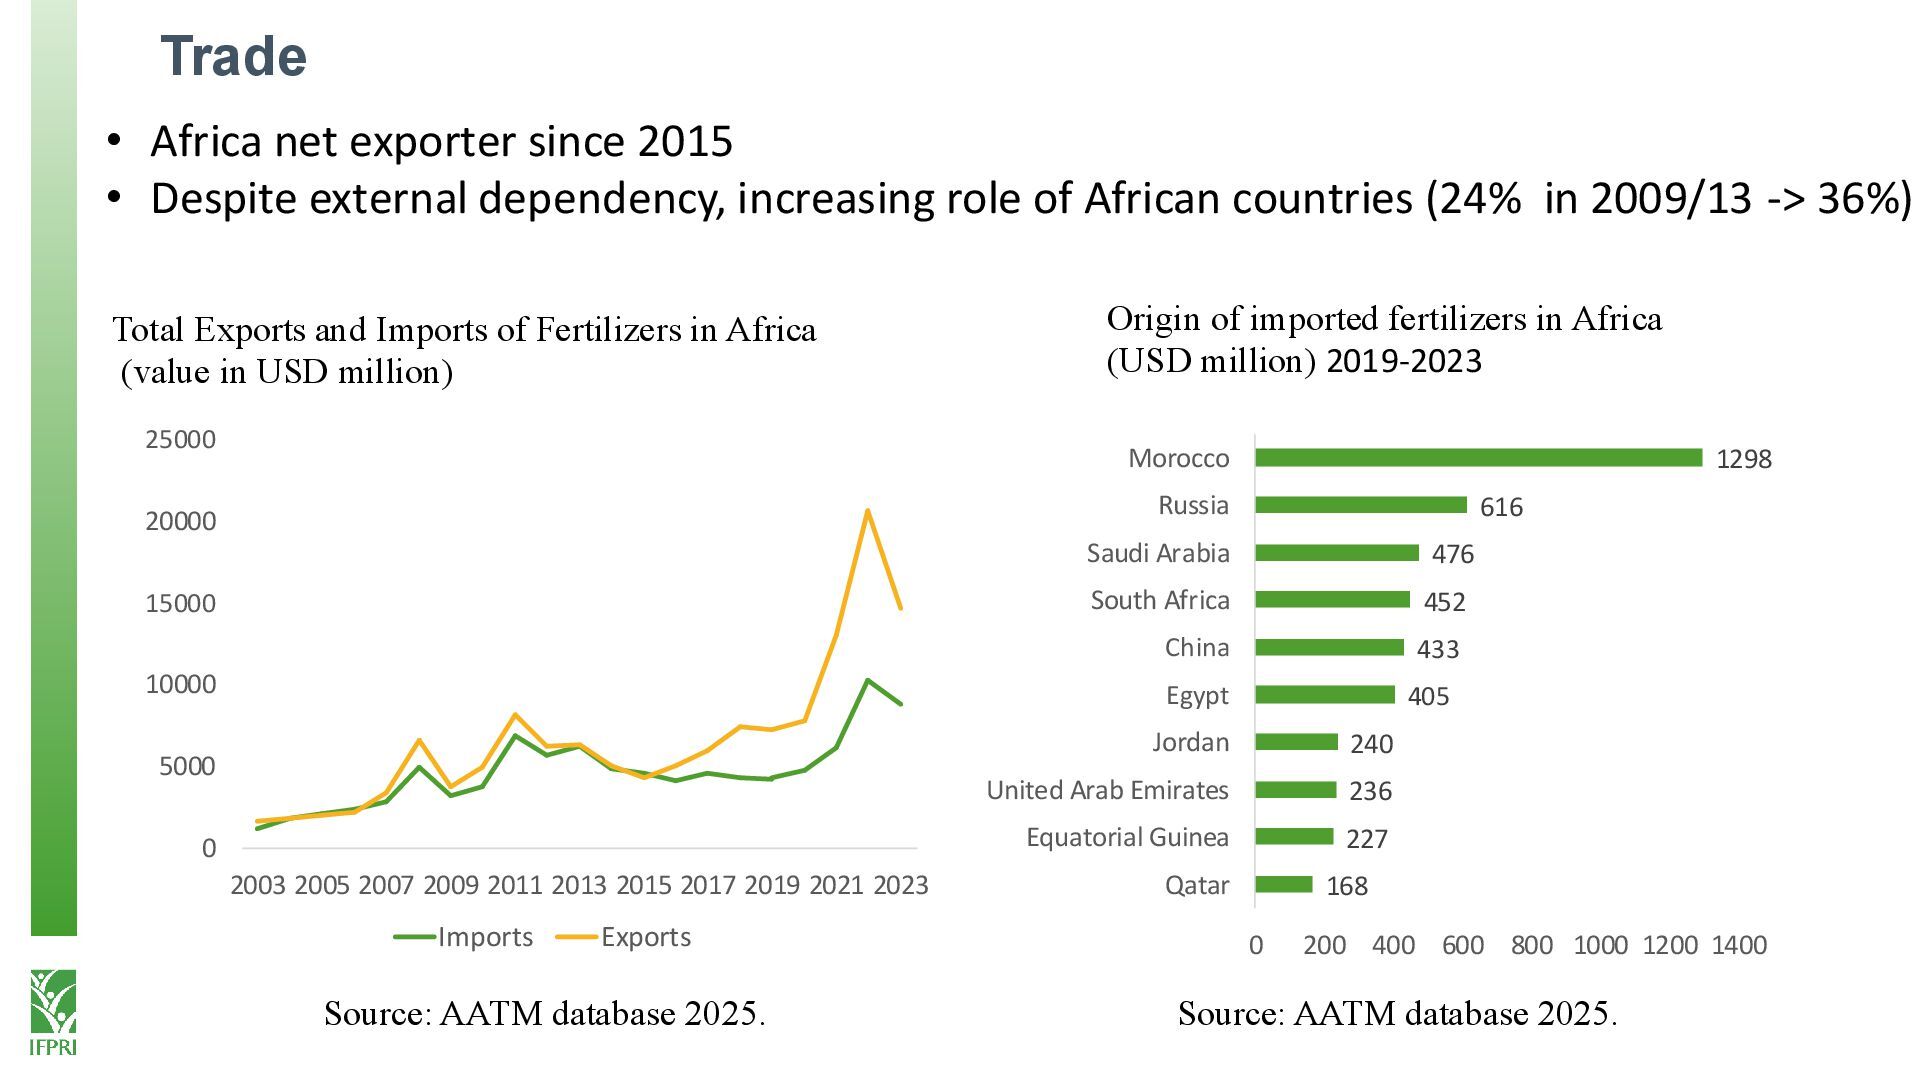
2009 2011 2013 2015 2017 2019 2021 2023 Imports Exports 168 227 236 240 405 433 452 476 616 1298 0 200 400 600 800 1000 1200 1400 Qatar Equatorial Guinea United Arab Emirates Jordan Egypt China South Africa Saudi Arabia Russia Morocco Total Exports and Imports of Fertilizers in Africa (value in USD million) Origin of imported fertilizers in Africa (USD million) 2019-2023 Source: AATM database 2025. Source: AATM database 2025. • Africa net exporter since 2015 • Despite external dependency, increasing role of African countries (24% in 2009/13 -> 36%)
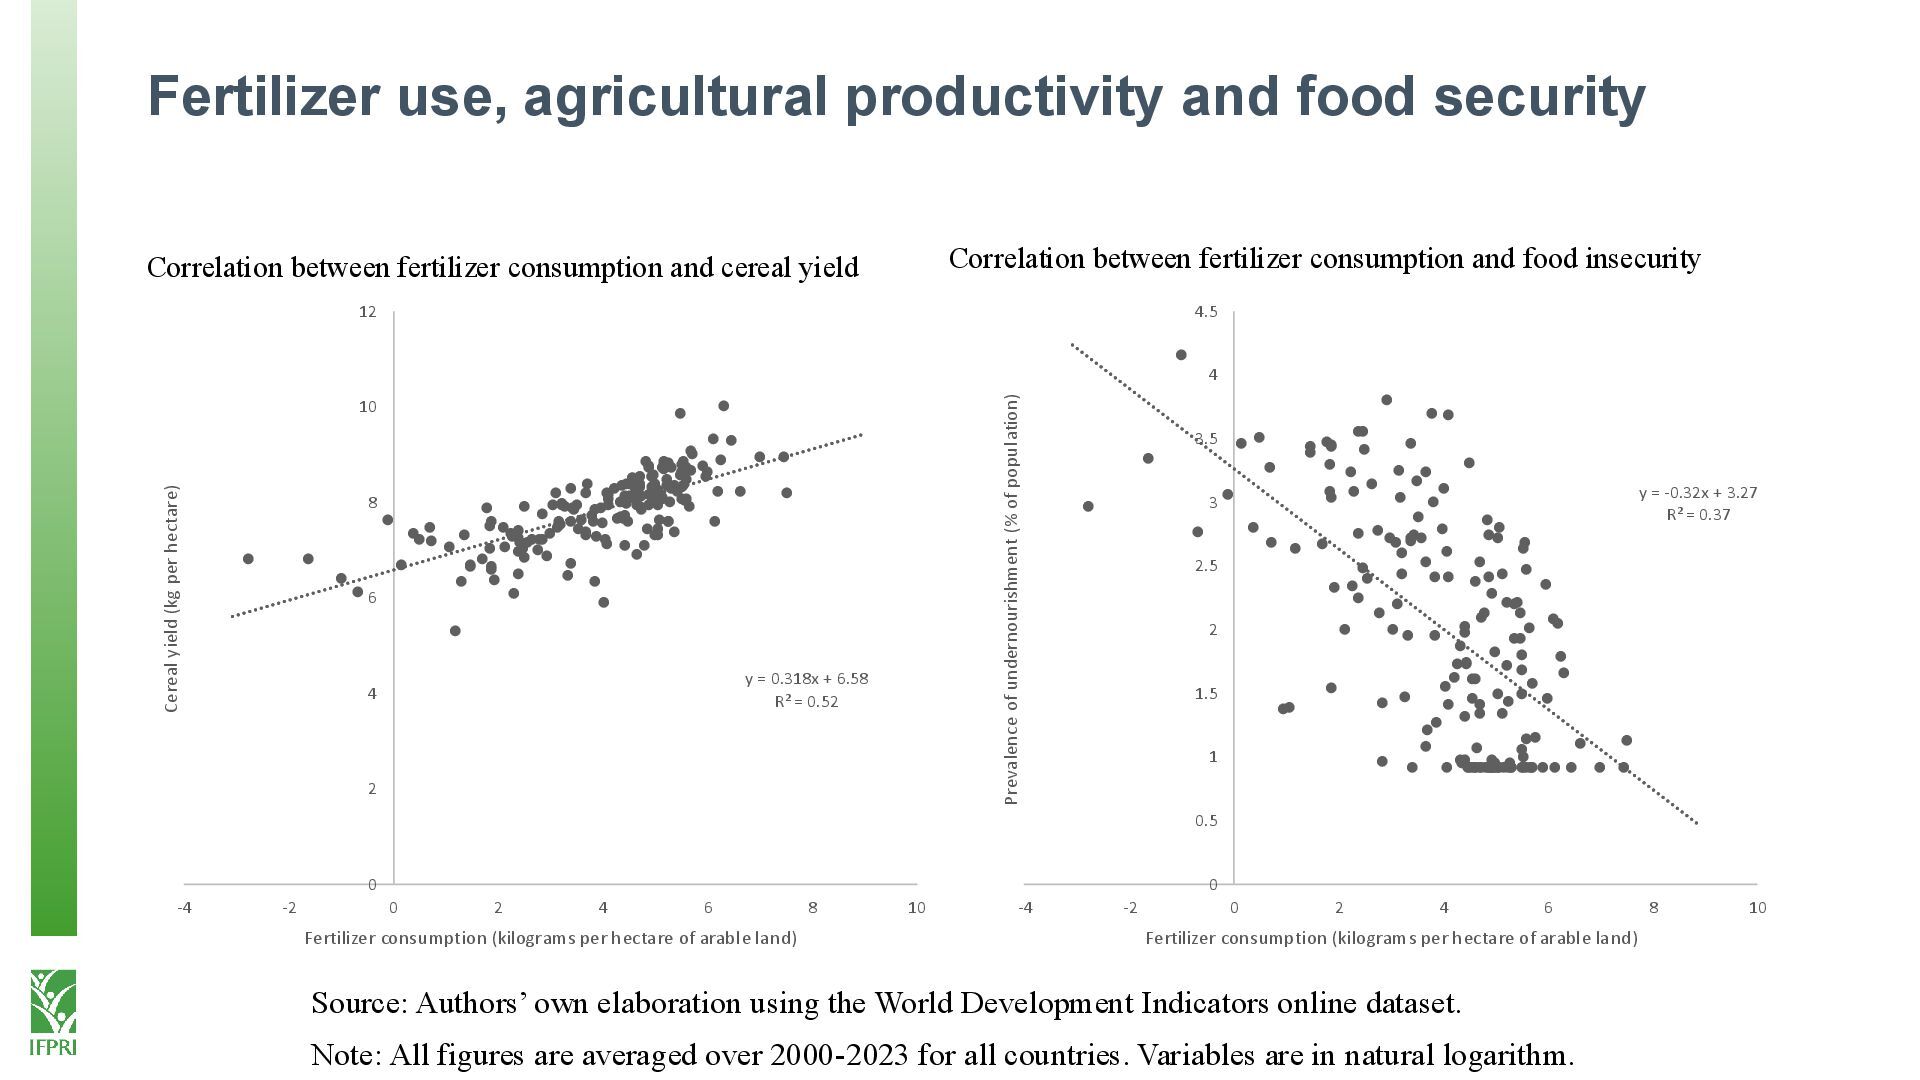
+ 6.58 R² = 0.52 0 2 4 6 8 10 12 -4 -2 0 2 4 6 8 10 Cereal yield (kg per hectare) Fertilizer consumption (kilograms per hectare of arable land) y = -0.32x + 3.27 R² = 0.37 0 0.5 1 1.5 2 2.5 3 3.5 4 4.5 -4 -2 0 2 4 6 8 10 Prevalence of undernourishment (% of population) Fertilizer consumption (kilograms per hectare of arable land) Correlation between fertilizer consumption and cereal yield Correlation between fertilizer consumption and food insecurity Source: Authors’ own elaboration using the World Development Indicators online dataset. Note: All figures are averaged over 2000-2023 for all countries. Variables are in natural logarithm.
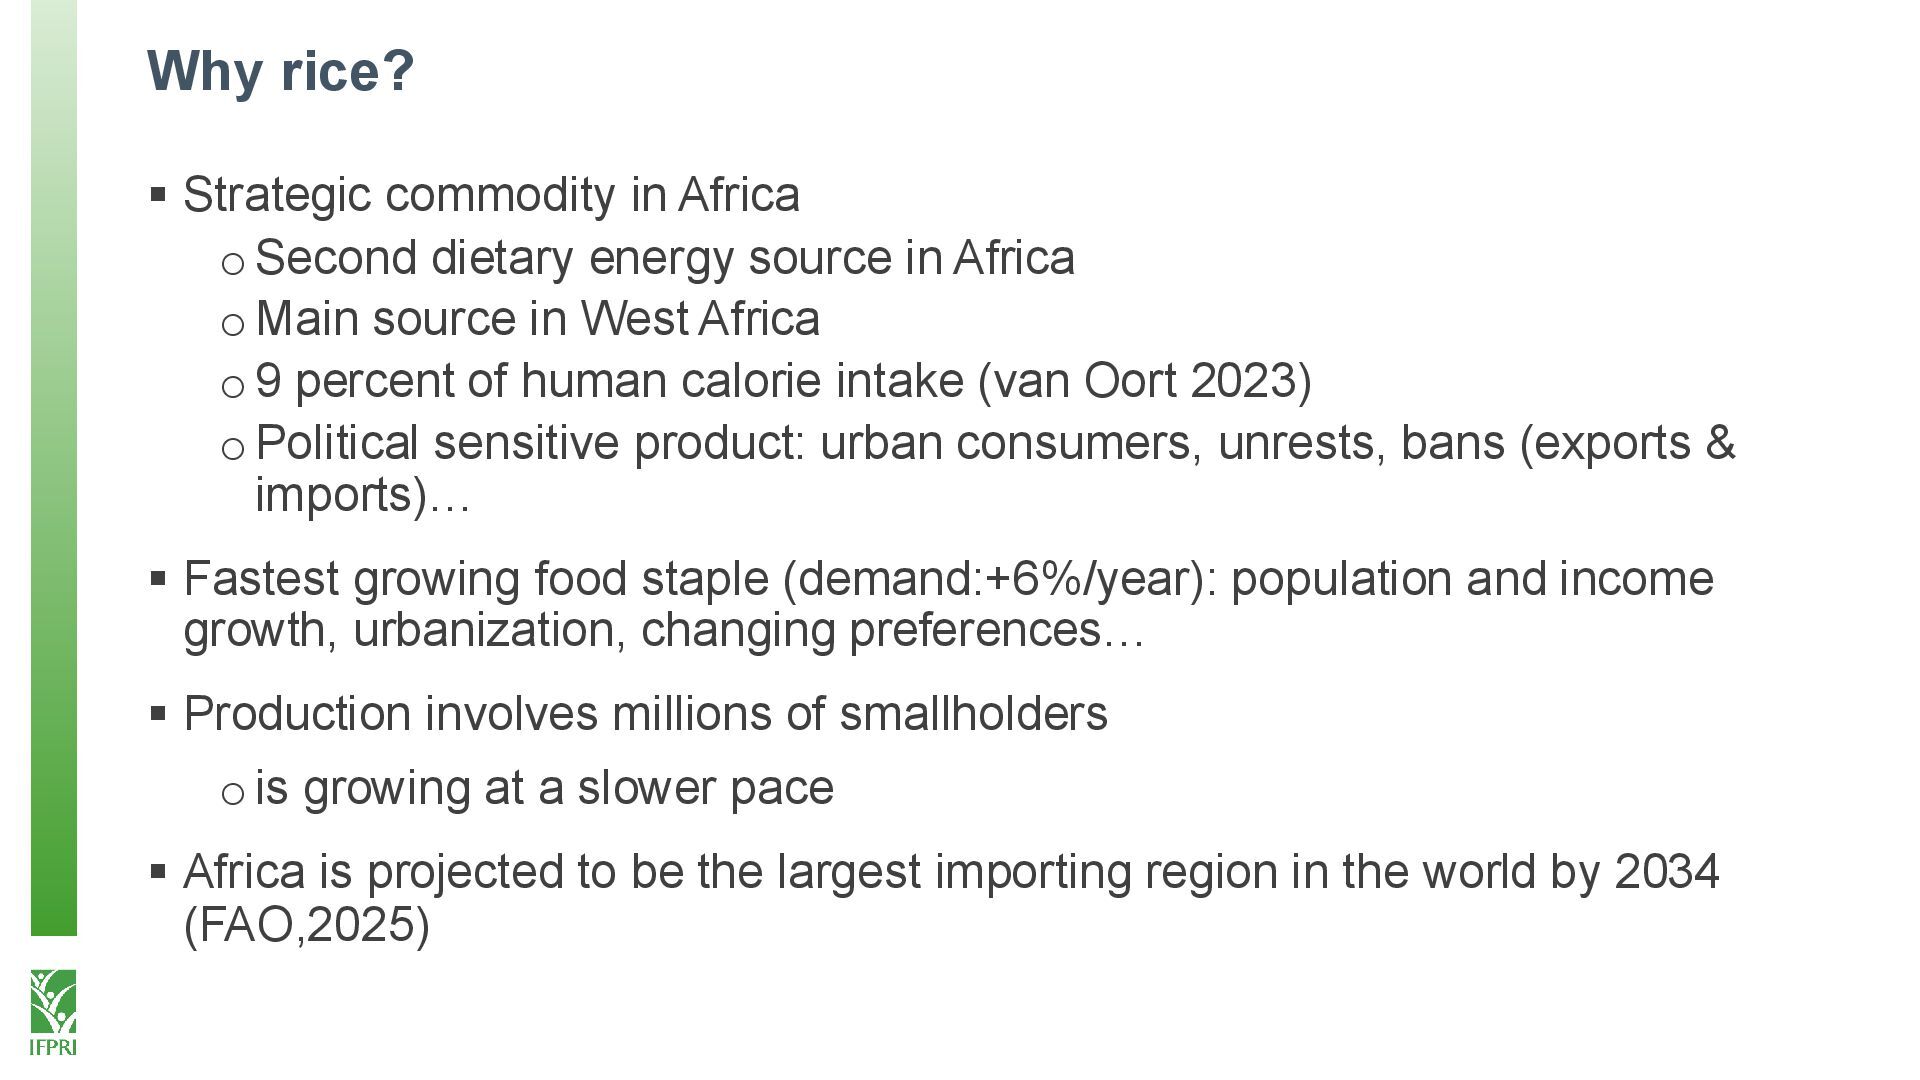
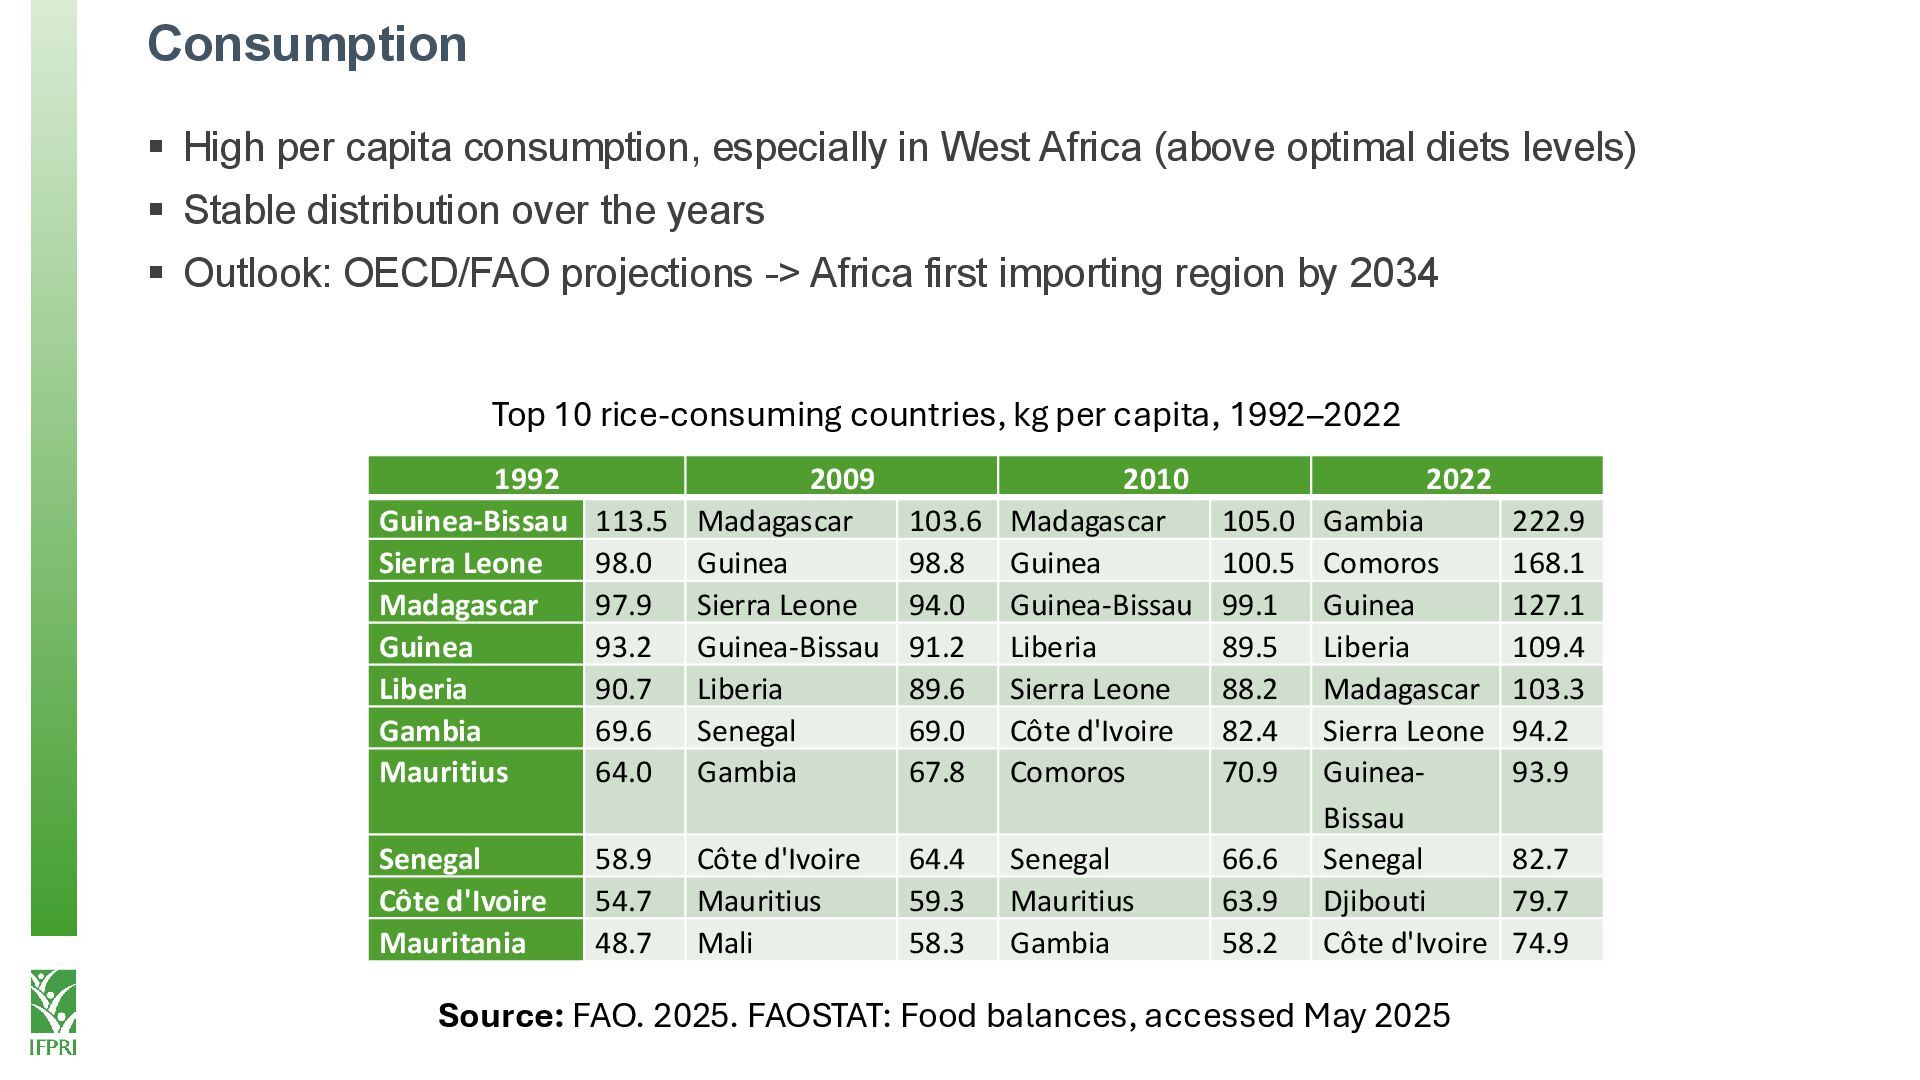
energy source in Africa o Main source in West Africa o9 percent of human calorie intake (van Oort 2023) o Political sensitive product: urban consumers, unrests, bans (exports & imports)… ▪ Fastest growing food staple (demand:+6%/year): population and income growth, urbanization, changing preferences… ▪ Production involves millions of smallholders o is growing at a slower pace ▪ Africa is projected to be the largest importing region in the world by 2034 (FAO,2025)
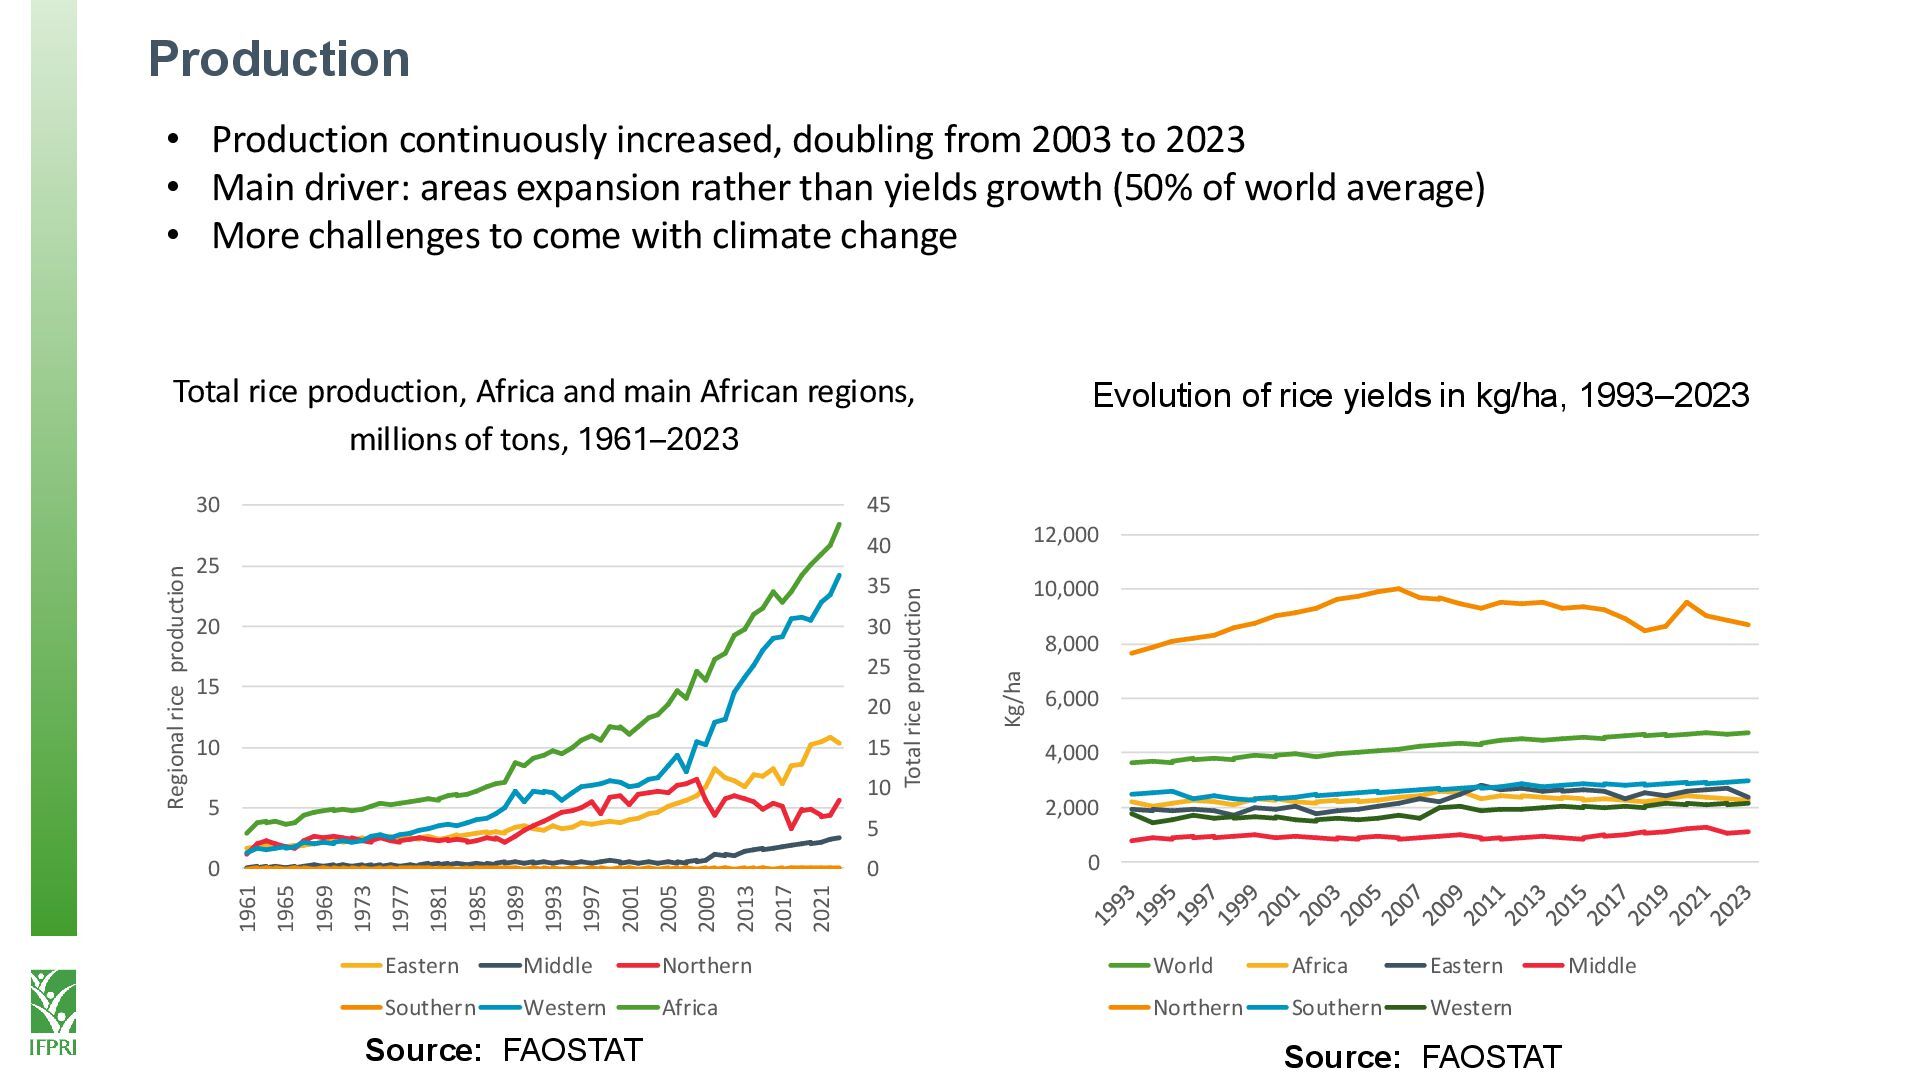
45 0 5 10 15 20 25 30 1961 1965 1969 1973 1977 1981 1985 1989 1993 1997 2001 2005 2009 2013 2017 2021 Total rice production Regional rice production Eastern Middle Northern Southern Western Africa 0 2,000 4,000 6,000 8,000 10,000 12,000 Kg/ha World Africa Eastern Middle Northern Southern Western Evolution of rice yields in kg/ha, 1993–2023 Total rice production, Africa and main African regions, millions of tons, 1961–2023 • Production continuously increased, doubling from 2003 to 2023 • Main driver: areas expansion rather than yields growth (50% of world average) • More challenges to come with climate change Source: FAOSTAT Source: FAOSTAT
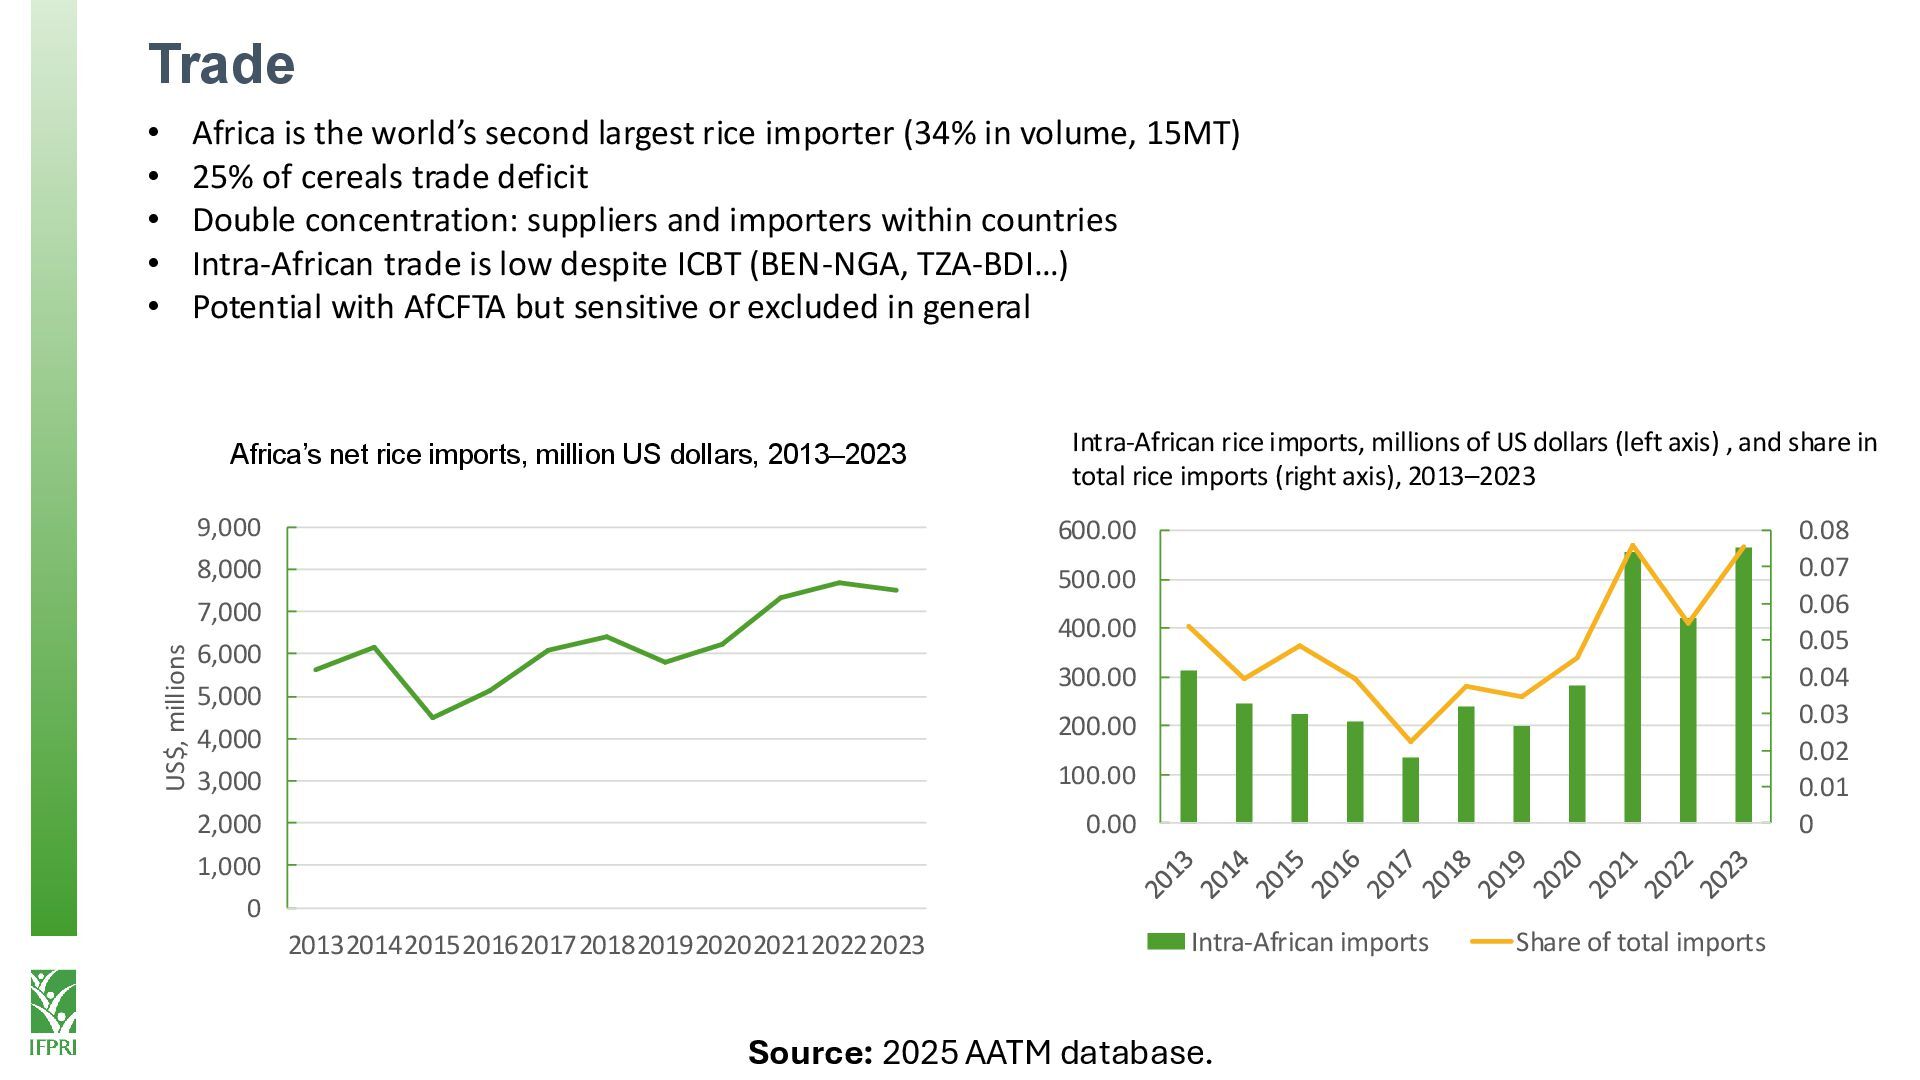
9,000 20132014201520162017201820192020202120222023 US$, millions • Africa is the world’s second largest rice importer (34% in volume, 15MT) • 25% of cereals trade deficit • Double concentration: suppliers and importers within countries • Intra-African trade is low despite ICBT (BEN-NGA, TZA-BDI…) • Potential with AfCFTA but sensitive or excluded in general Intra-African rice imports, millions of US dollars (left axis) , and share in total rice imports (right axis), 2013–2023 Africa’s net rice imports, million US dollars, 2013–2023 Source: 2025 AATM database. 0 0.01 0.02 0.03 0.04 0.05 0.06 0.07 0.08 0.00 100.00 200.00 300.00 400.00 500.00 600.00 Intra-African imports Share of total imports
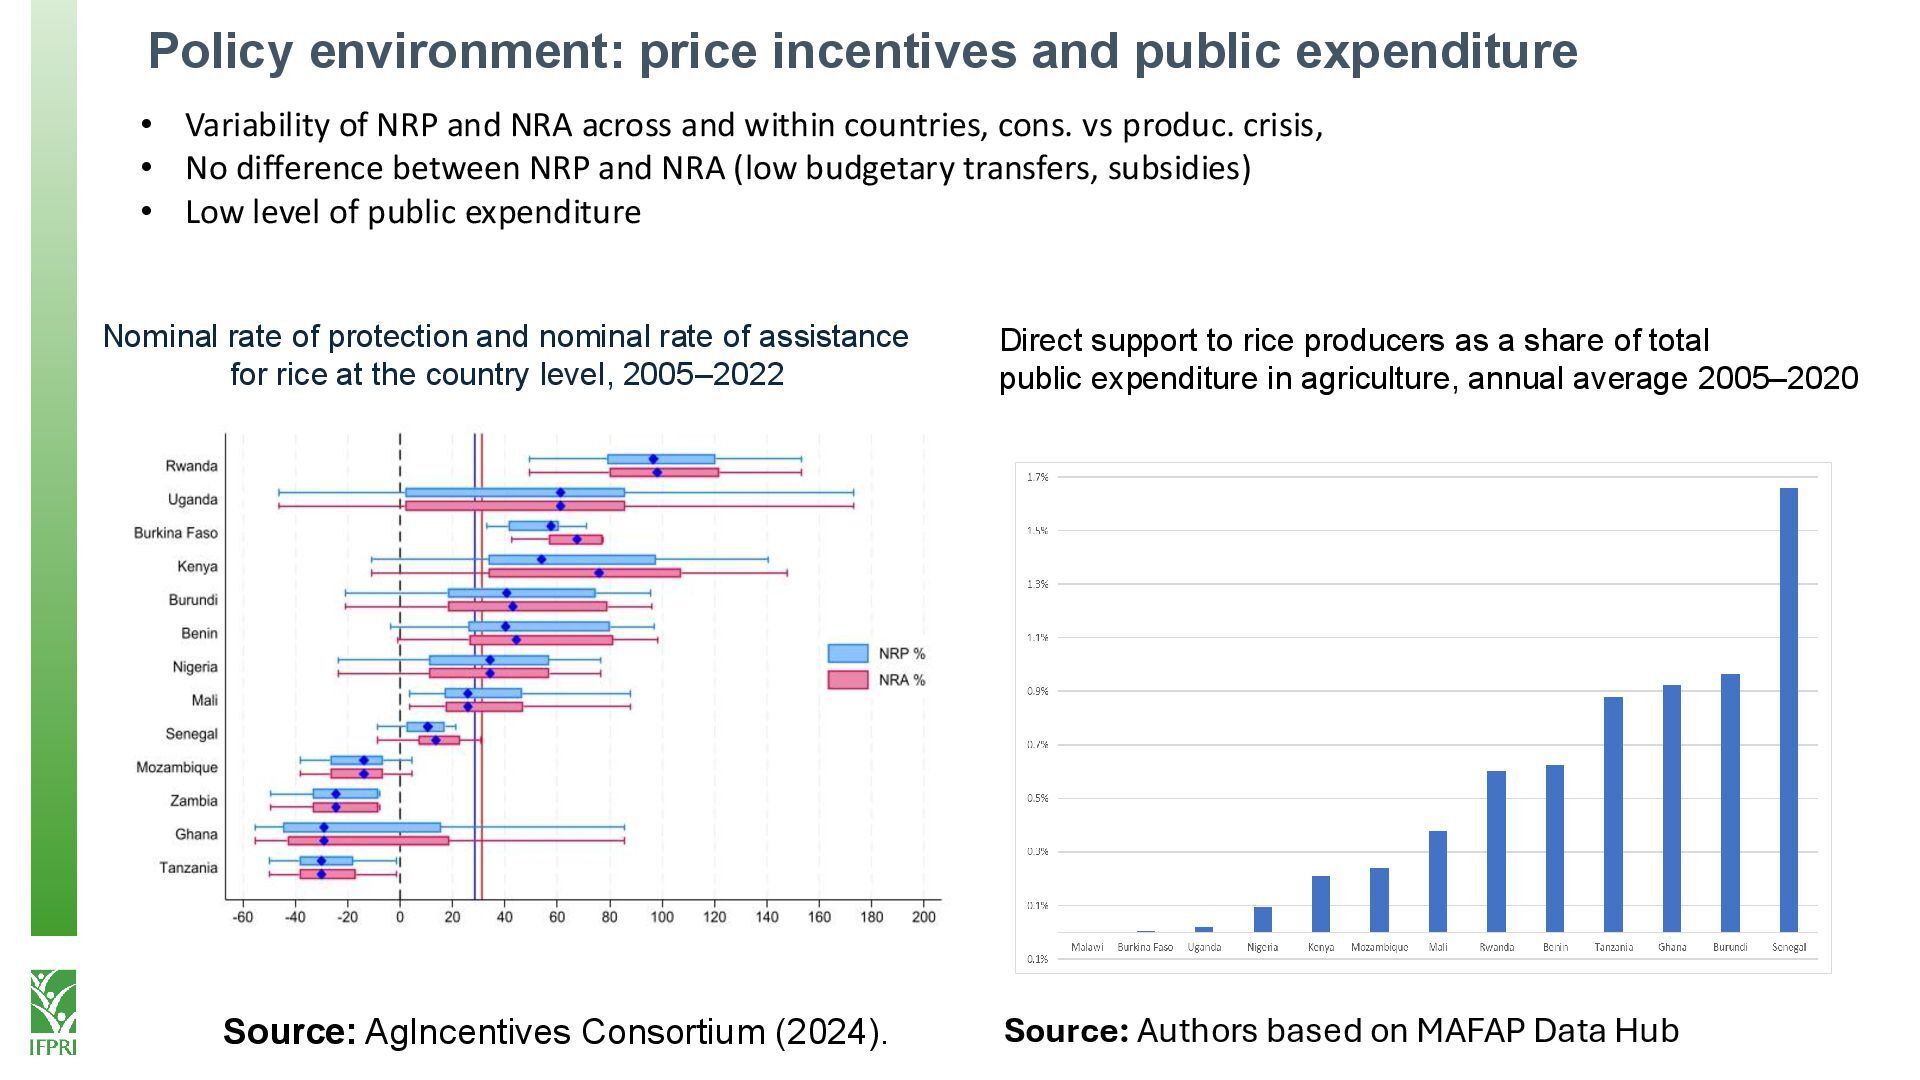
NRP and NRA across and within countries, cons. vs produc. crisis, • No difference between NRP and NRA (low budgetary transfers, subsidies) • Low level of public expenditure Direct support to rice producers as a share of total public expenditure in agriculture, annual average 2005–2020 Nominal rate of protection and nominal rate of assistance for rice at the country level, 2005–2022 Source: AgIncentives Consortium (2024). Source: Authors based on MAFAP Data Hub