Upgrade to Pro
— share decks privately, control downloads, hide ads and more …
Speaker Deck
Features
Speaker Deck
PRO
Sign in
Sign up for free
Search
Search
How to probe prometheus & grafana. What is helm
Search
Sponsored
·
Your Podcast. Everywhere. Effortlessly.
Share. Educate. Inspire. Entertain. You do you. We'll handle the rest.
→
threetreeslight
November 17, 2018
Technology
54
0
Share
Embed
Copy iframe code
Copy JS code
Copy link
Start on current slide
How to probe prometheus & grafana. What is helm
How to probe prometheus & grafana. What is helm on shinjuku mokumoku programming vol.20
threetreeslight
November 17, 2018
More Decks by threetreeslight
See All by threetreeslight
実録 採用一投入魂
threetreeslight
0
41
Bottleneck is You
threetreeslight
0
130
Japan Office Society オフィスはスタートアップの成長を助長するのか?阻害するのか?
threetreeslight
0
130
スタートアップは見極められたくない
threetreeslight
0
59
VPoEの責務とは
threetreeslight
0
95
CiecleCIでもくもく会を支える技術
threetreeslight
0
69
Ego vs higher self
threetreeslight
0
51
Performance Hack 101
threetreeslight
0
120
複数のスタートアップを 通して得た失敗と学び
threetreeslight
0
90
Other Decks in Technology
See All in Technology
個人開発で育てる「大規模設計の苗床」 - AI時代の1人開発から始める業務への知識接続 / The Seedbed for Large-Scale Design - From AI-Era Solo Projects to Professional Knowledge
bitkey
PRO
1
280
CSに"SLO"は要らない、経営層に"99.9%"は伝わらない - SREを全社に"翻訳"する3原則
cscengineer
PRO
1
5k
SoccerMaster: A Vision Foundation Model for Soccer Understanding
kzykmyzw
0
130
型は壁、Rustでもバグを直すな、表現できなくせよ
nwiizo
14
2.1k
ruby.wasmとPicoRuby.wasmに対応した仮想DOMライブラリを作ってる話 #kaigieffect_kaigi
sue445
PRO
0
150
アップデートで何が変わった?デモで学んで使いこなすIBM Bob2.0
muehara
0
110
AI時代の闇と光
tatsuya1970
0
110
CIで使うClaude
iwatatomoya
0
290
10年目を迎えた「ABEMA」がどのように AI 活用を推進して、AI 駆動開発にシフトしているのか / How ABEMA, entering its 10th year, is promoting the use of AI and shifting toward AI-driven development
miyukki
0
260
AI、CDK と協働する Full TypeScript アプリケーション開発 / Full TypeScript Application with AI and CDK
geekplus_tech
2
360
OPENLOGI Company Profile for engineer
hr01
1
74k
Making sense of Google’s agentic dev tools
glaforge
1
280
Featured
See All Featured
Bash Introduction
62gerente
615
220k
Rebuilding a faster, lazier Slack
samanthasiow
85
9.6k
DevOps and Value Stream Thinking: Enabling flow, efficiency and business value
helenjbeal
1
260
The Spectacular Lies of Maps
axbom
PRO
1
860
Practical Tips for Bootstrapping Information Extraction Pipelines
honnibal
25
2k
Amusing Abliteration
ianozsvald
1
230
Leading Effective Engineering Teams in the AI Era
addyosmani
9
2.1k
Leo the Paperboy
mayatellez
8
1.9k
Dominate Local Search Results - an insider guide to GBP, reviews, and Local SEO
greggifford
PRO
0
210
Visual Storytelling: How to be a Superhuman Communicator
reverentgeek
2
590
Breaking role norms: Why Content Design is so much more than writing copy - Taylor Woolridge
uxyall
0
350
Taking LLMs out of the black box: A practical guide to human-in-the-loop distillation
inesmontani
PRO
3
2.3k
Transcript
How to probe prometheus & grafana What is helm @threetreeslight
on shinjuku mokumoku programming #20 1 / 19
Who VP of Engineering at Event Organizer おじさん Repro 2
/ 19
今⽇やること blog 監視のgrafana において外形監視が落ちるを解決す る Istio のchart を基にprometheus とgrafana の設定⾒直す
3 / 19
できたこと blog 監視のgrafana において外形監視が落ちるを解決 する Istio のchart を基にprometheus とgrafana の設定⾒直す
あわせて helm chart の構成理解 istio の正常(多分)稼働 4 / 19
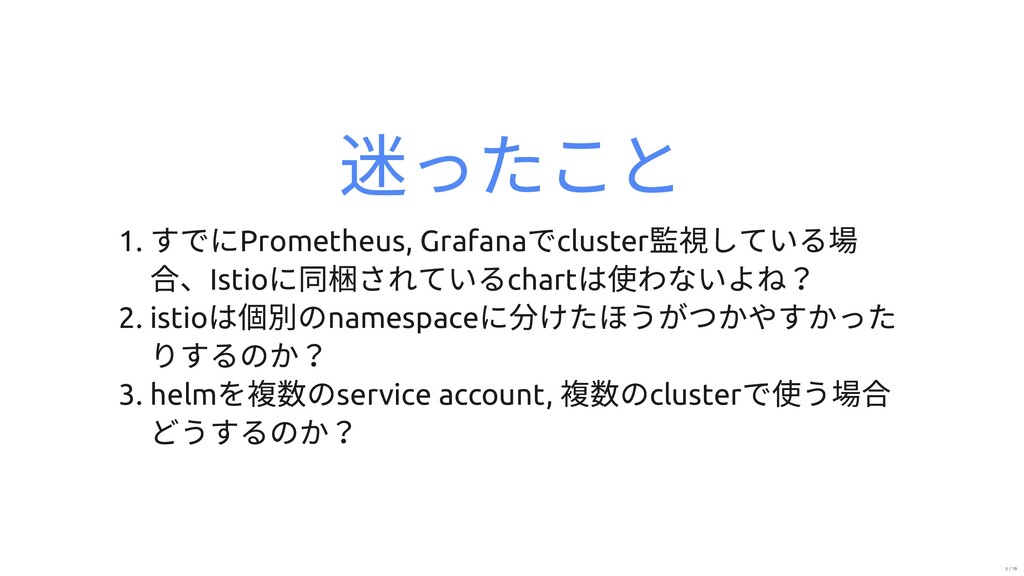
迷ったこと 1. すでにPrometheus, Grafana でcluster 監視している場 合、Istio に同梱されているchart は使わないよね? 2.
istio は個別のnamespace に分けたほうがつかやすかった りするのか? 3. helm を複数のservice account, 複数のcluster で使う場合 どうするのか? 5 / 19
せっかくなので いくつかtips ご紹介 6 / 19
healthcheck Prometheus Grafana 7 / 19
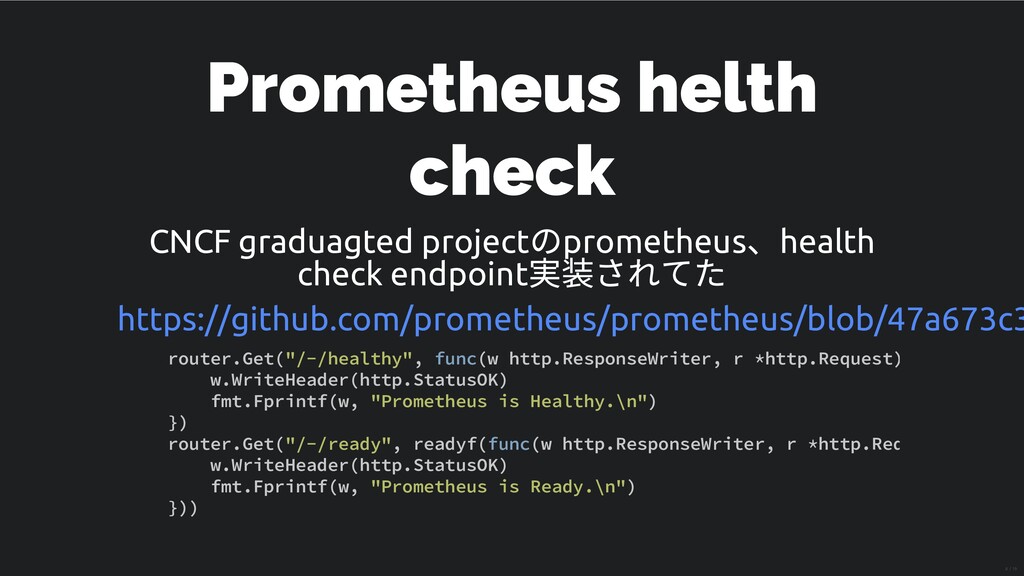
Prometheus helth check CNCF graduagted project のprometheus 、health check endpoint
実装されてた https://github.com/prometheus/prometheus/blob/47a673c3 router.Get("/-/healthy", func(w http.ResponseWriter, r *http.Request) w.WriteHeader(http.StatusOK) fmt.Fprintf(w, "Prometheus is Healthy.\n") }) router.Get("/-/ready", readyf(func(w http.ResponseWriter, r *http.Req w.WriteHeader(http.StatusOK) fmt.Fprintf(w, "Prometheus is Ready.\n") })) 8 / 19
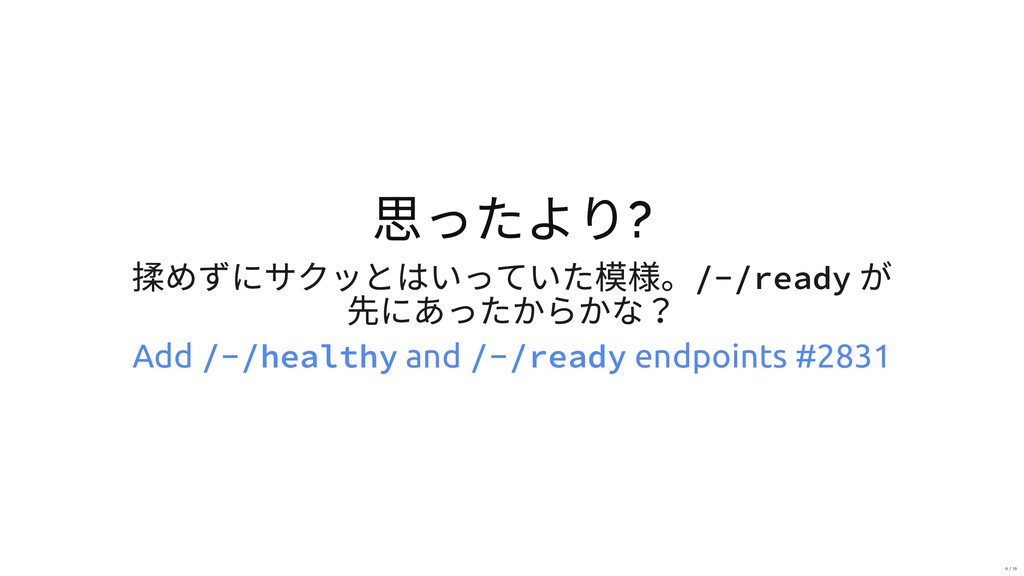
思ったより? 揉めずにサクッとはいっていた模様。/-/ready が 先にあったからかな? Add /-/healthy and /-/ready endpoints #2831
9 / 19
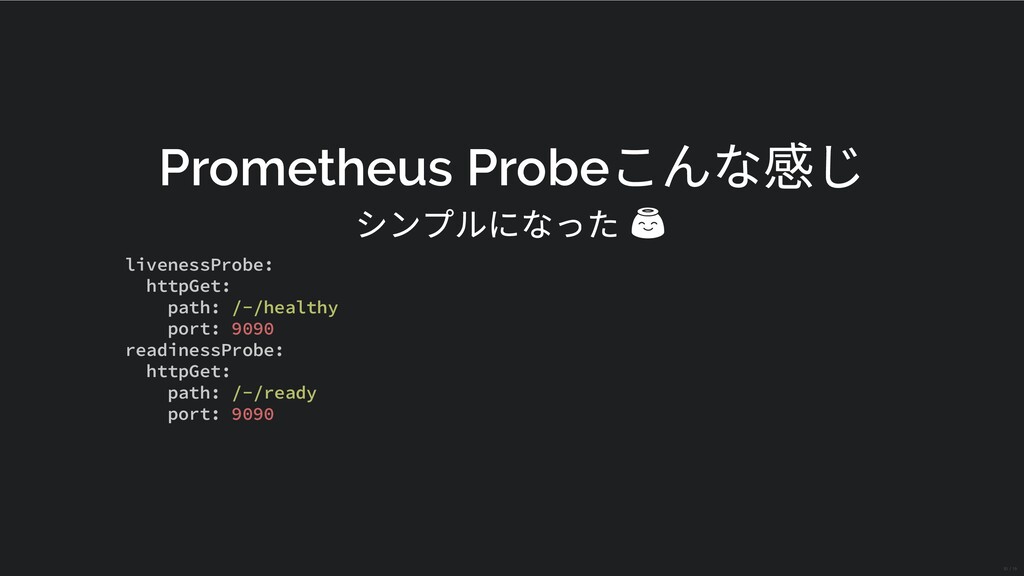
Prometheus Probe こんな感じ シンプルになった livenessProbe: httpGet: path: /-/healthy port: 9090
readinessProbe: httpGet: path: /-/ready port: 9090 10 / 19
Grafana health check で /api/health endpoint が提供されて いた。 Grafana 4.3
https://github.com/grafana/grafana/blob/e78c1b4abc7eda7 func (hs *HTTPServer) healthHandler(ctx *macaron.Context) { notHeadOrGet := ctx.Req.Method != http.MethodGet && ctx.Req.Method != if notHeadOrGet || ctx.Req.URL.Path != "/api/health" { return } data := simplejson.New() data.Set("database", "ok") data.Set("version", setting.BuildVersion) data.Set("commit", setting.BuildCommit) 11 / 19
ぼちぼちコメントが それなりにこまっていたということだろうか?ぼち ぼちコメントが有る。 grafana のicon が帰ってくるかどうかでwork around しているひともいるぐらい。 アクセスすると認証前だったらlogin 画⾯に⾶ばされ
たり、そもそもそのログイン画⾯がちょいと重かっ たりするから欲しい気持ちめっちゃわかる。 Monitoring Grafana #3302 12 / 19
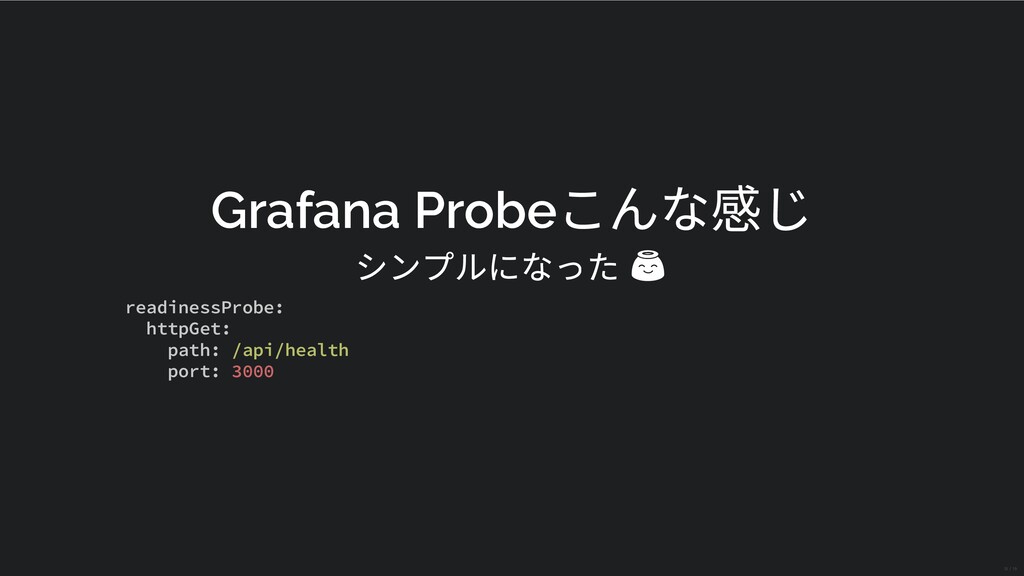
Grafana Probe こんな感じ シンプルになった readinessProbe: httpGet: path: /api/health port: 3000
13 / 19
health check の仕組み が提供されているとよい よね 14 / 19
helm chart 15 / 19
What is helm helm ( ) とは、CNCF ( ) でhosting
されている kubernetes 上のpackage manager 。 https://helm.sh/ https://www.cncf.io/ 16 / 19
stop the copy-and- paste madness. この表現がなされるほどのyaml wall 1. Helm は単純にkubernetes
のresource をGo templating し ているだけ 2. local にchart をおいて複数cluster に展開することもでき るので便利だったりする 細かい話はblog にあげていく 17 / 19
Tips 終わり 18 / 19
頑張っていく 19 / 19