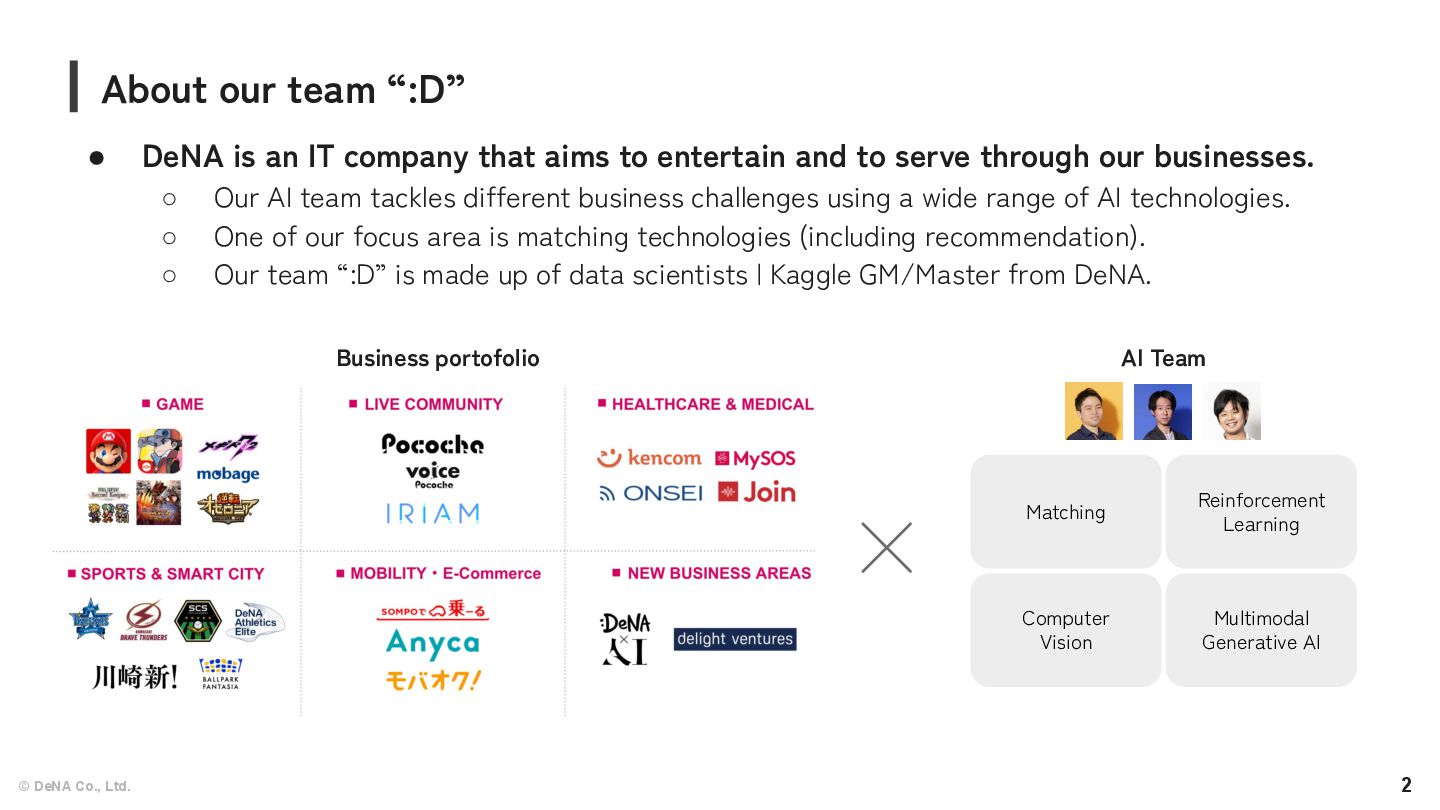
DeNA is an IT company that aims to entertain and to serve through our businesses. ◦ Our AI team tackles different business challenges using a wide range of AI technologies. ◦ One of our focus area is matching technologies (including recommendation). ◦ Our team “:D” is made up of data scientists | Kaggle GM/Master from DeNA. Business portofolio AI Team Reinforcement Learning Matching Computer Vision Multimodal Generative AI
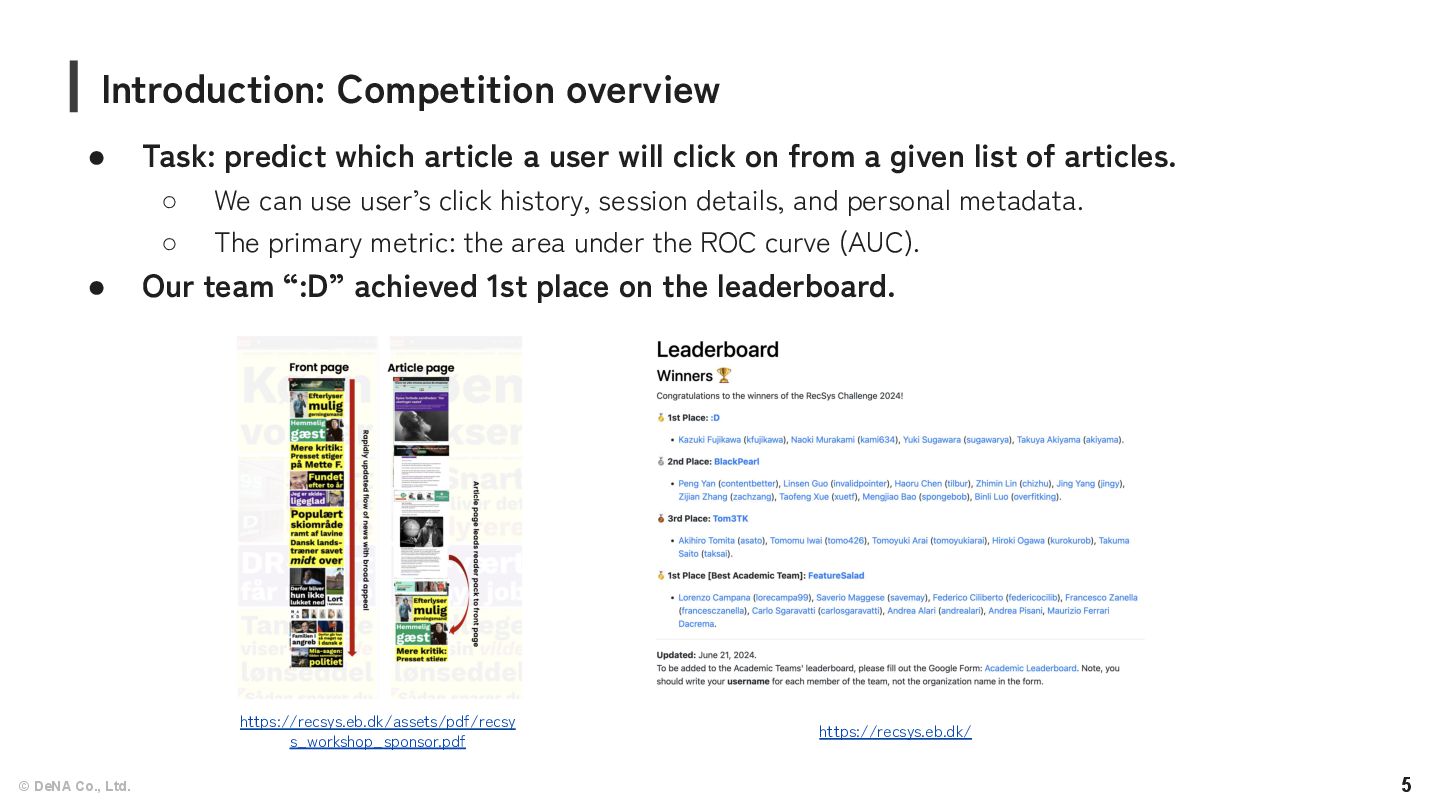
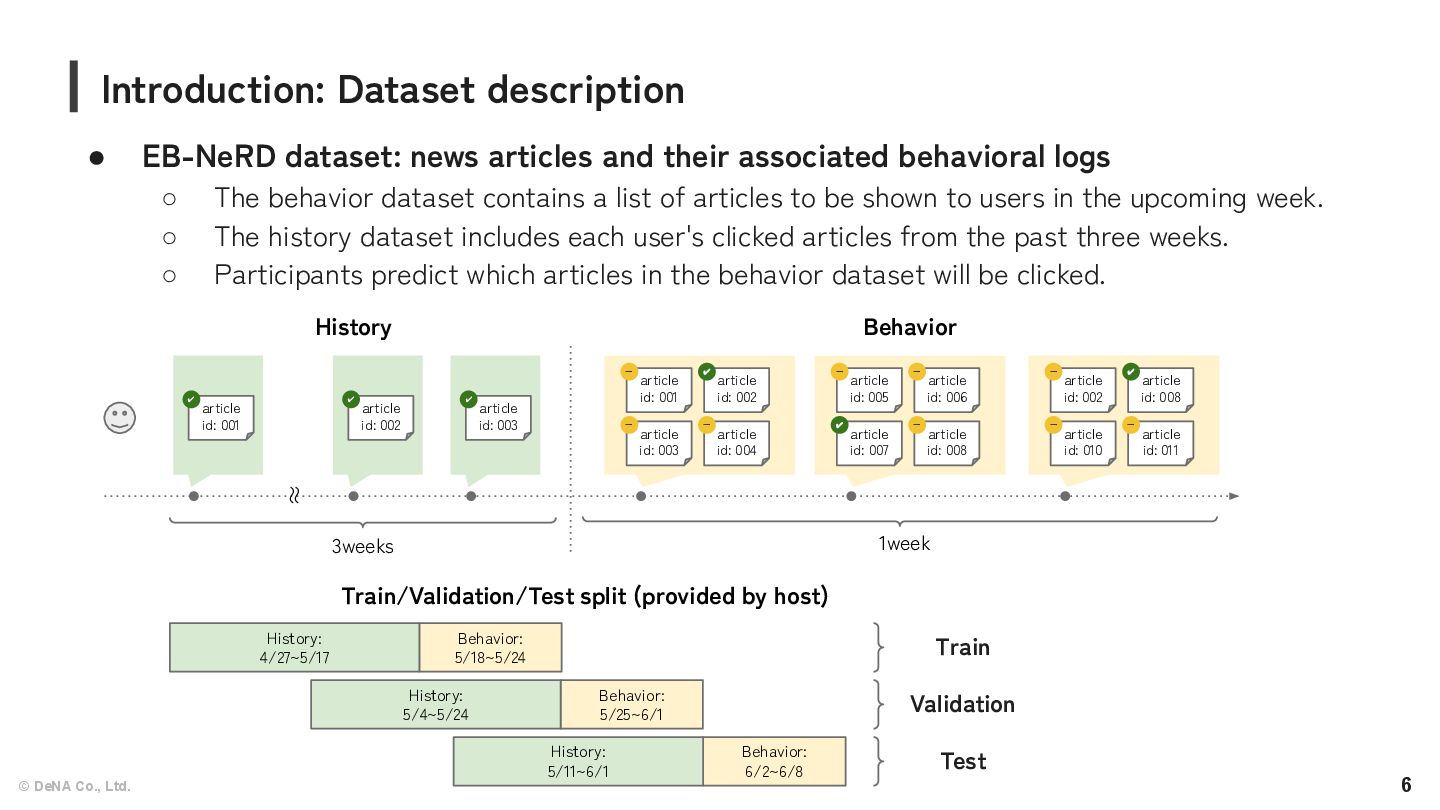
a user will click on from a given list of articles. ◦ We can use user’s click history, session details, and personal metadata. ◦ The primary metric: the area under the ROC curve (AUC). • Our team “:D” achieved 1st place on the leaderboard. Introduction: Competition overview https://recsys.eb.dk/assets/pdf/recsy s_workshop_sponsor.pdf https://recsys.eb.dk/
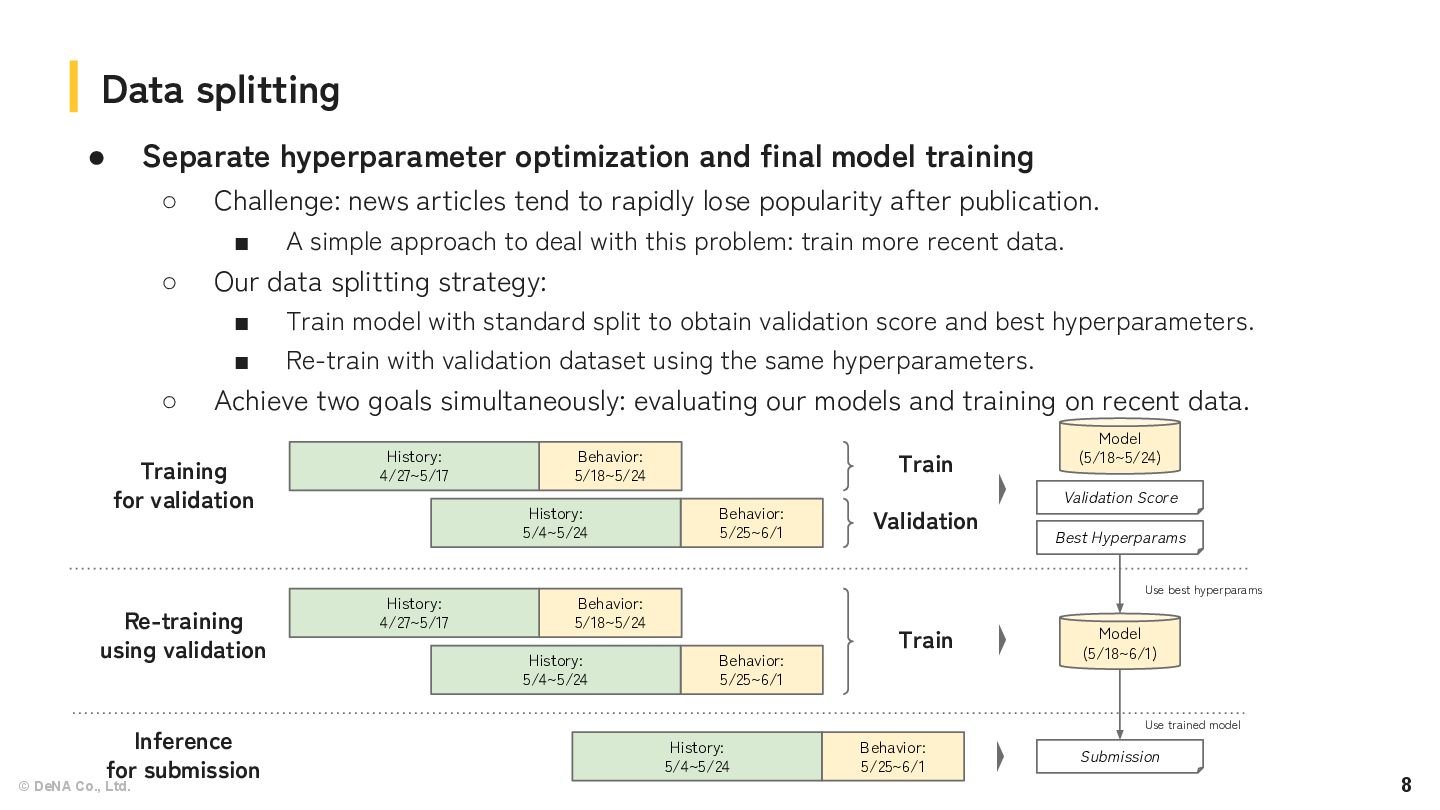
final model training ◦ Challenge: news articles tend to rapidly lose popularity after publication. ▪ A simple approach to deal with this problem: train more recent data. ◦ Our data splitting strategy: ▪ Train model with standard split to obtain validation score and best hyperparameters. ▪ Re-train with validation dataset using the same hyperparameters. ◦ Achieve two goals simultaneously: evaluating our models and training on recent data. Data splitting Training for validation Re-training using validation Inference for submission Behavior: 5/18~5/24 History: 4/27~5/17 Behavior: 5/25~6/1 History: 5/4~5/24 Train Validation Model (5/18~5/24) Validation Score Best Hyperparams Behavior: 5/18~5/24 History: 4/27~5/17 Behavior: 5/25~6/1 History: 5/4~5/24 Train Model (5/18~6/1) Behavior: 5/25~6/1 History: 5/4~5/24 Submission Use best hyperparams Use trained model
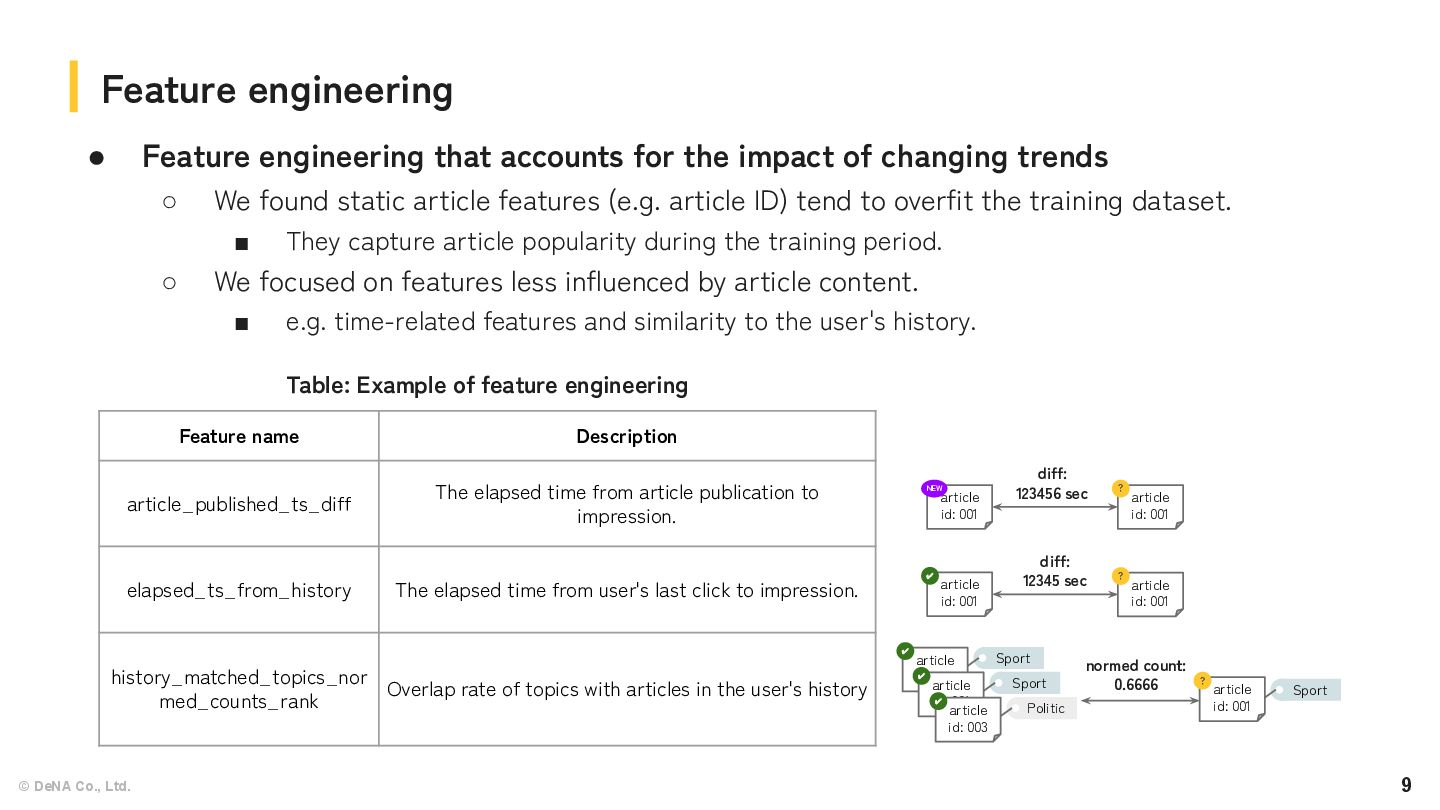
for the impact of changing trends ◦ We found static article features (e.g. article ID) tend to overfit the training dataset. ▪ They capture article popularity during the training period. ◦ We focused on features less influenced by article content. ▪ e.g. time-related features and similarity to the user's history. Feature engineering Feature name Description article_published_ts_diff The elapsed time from article publication to impression. elapsed_ts_from_history The elapsed time from user's last click to impression. history_matched_topics_nor med_counts_rank Overlap rate of topics with articles in the user's history article id: 001 NEW article id: 001 ? diff: 123456 sec article id: 001 ✔ article id: 001 ? diff: 12345 sec article id: 001 ? Sport article id: 001 ✔ Sport article id: 001 ✔ Sport article id: 003 ✔ Politic normed count: 0.6666 Table: Example of feature engineering
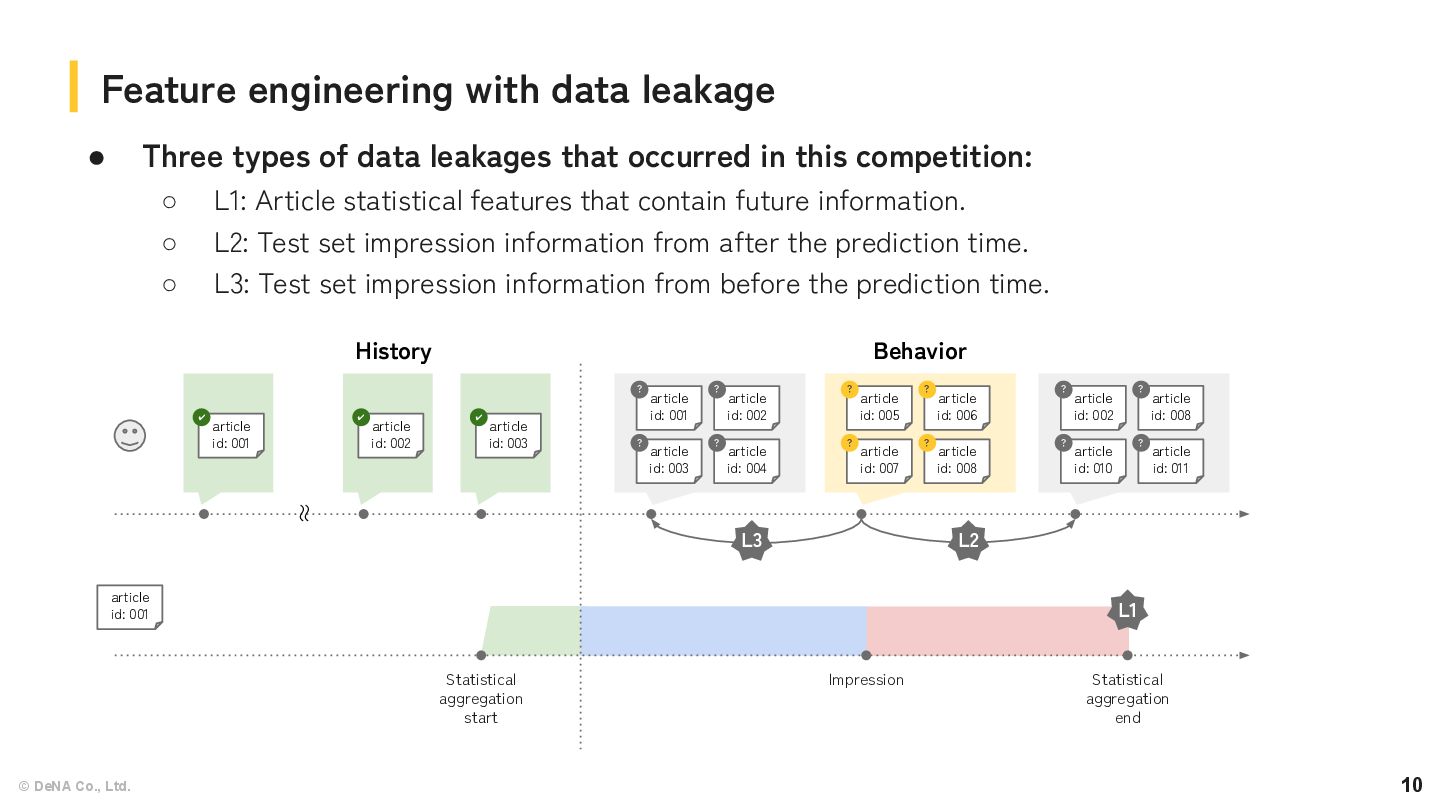
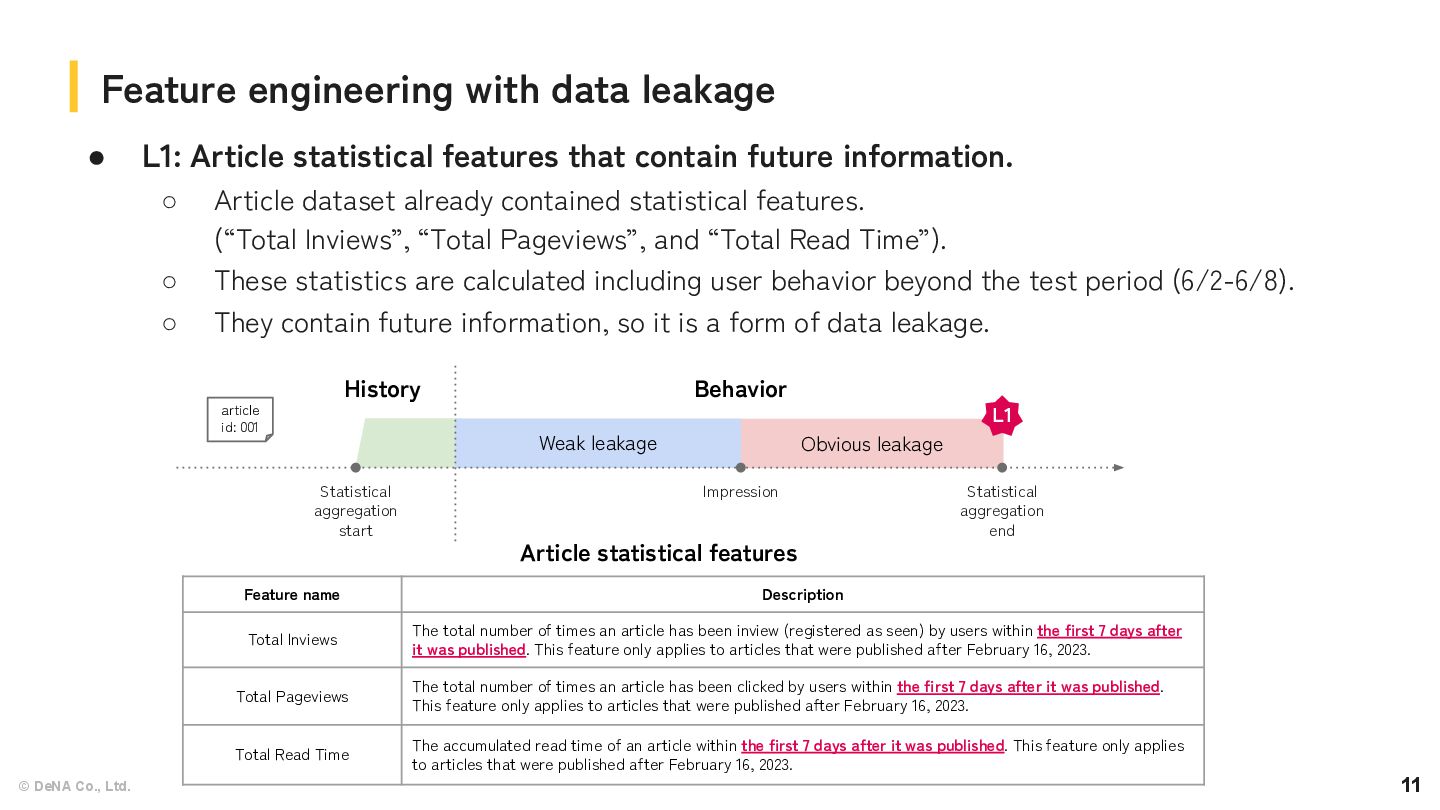
that contain future information. ◦ Article dataset already contained statistical features. (“Total Inviews”, “Total Pageviews”, and “Total Read Time”). ◦ These statistics are calculated including user behavior beyond the test period (6/2-6/8). ◦ They contain future information, so it is a form of data leakage. Feature engineering with data leakage Feature name Description Total Inviews The total number of times an article has been inview (registered as seen) by users within the first 7 days after it was published. This feature only applies to articles that were published after February 16, 2023. Total Pageviews The total number of times an article has been clicked by users within the first 7 days after it was published. This feature only applies to articles that were published after February 16, 2023. Total Read Time The accumulated read time of an article within the first 7 days after it was published. This feature only applies to articles that were published after February 16, 2023. Article statistical features Obvious leakage Weak leakage article id: 001 Statistical aggregation start Impression Statistical aggregation end Behavior History L1
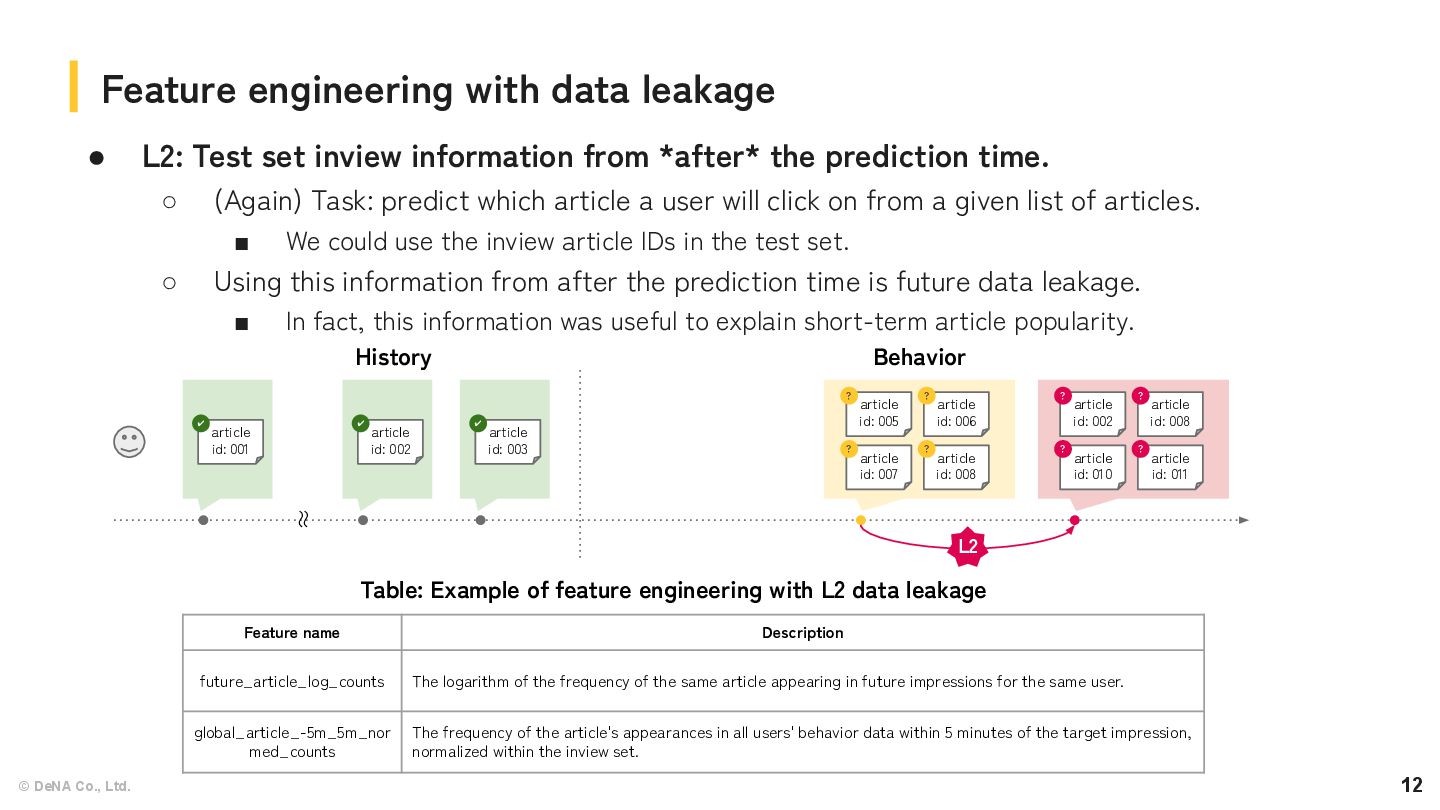
information from *after* the prediction time. ◦ (Again) Task: predict which article a user will click on from a given list of articles. ▪ We could use the inview article IDs in the test set. ◦ Using this information from after the prediction time is future data leakage. ▪ In fact, this information was useful to explain short-term article popularity. Feature engineering with data leakage article id: 001 ✔ article id: 002 ✔ article id: 003 ✔ article id: 005 ? article id: 007 ? article id: 006 ? article id: 008 ? article id: 002 ? article id: 010 ? article id: 008 ? article id: 011 ? Behavior History 〜 〜 Table: Example of feature engineering with L2 data leakage Feature name Description future_article_log_counts The logarithm of the frequency of the same article appearing in future impressions for the same user. global_article_-5m_5m_nor med_counts The frequency of the article's appearances in all users' behavior data within 5 minutes of the target impression, normalized within the inview set. L2
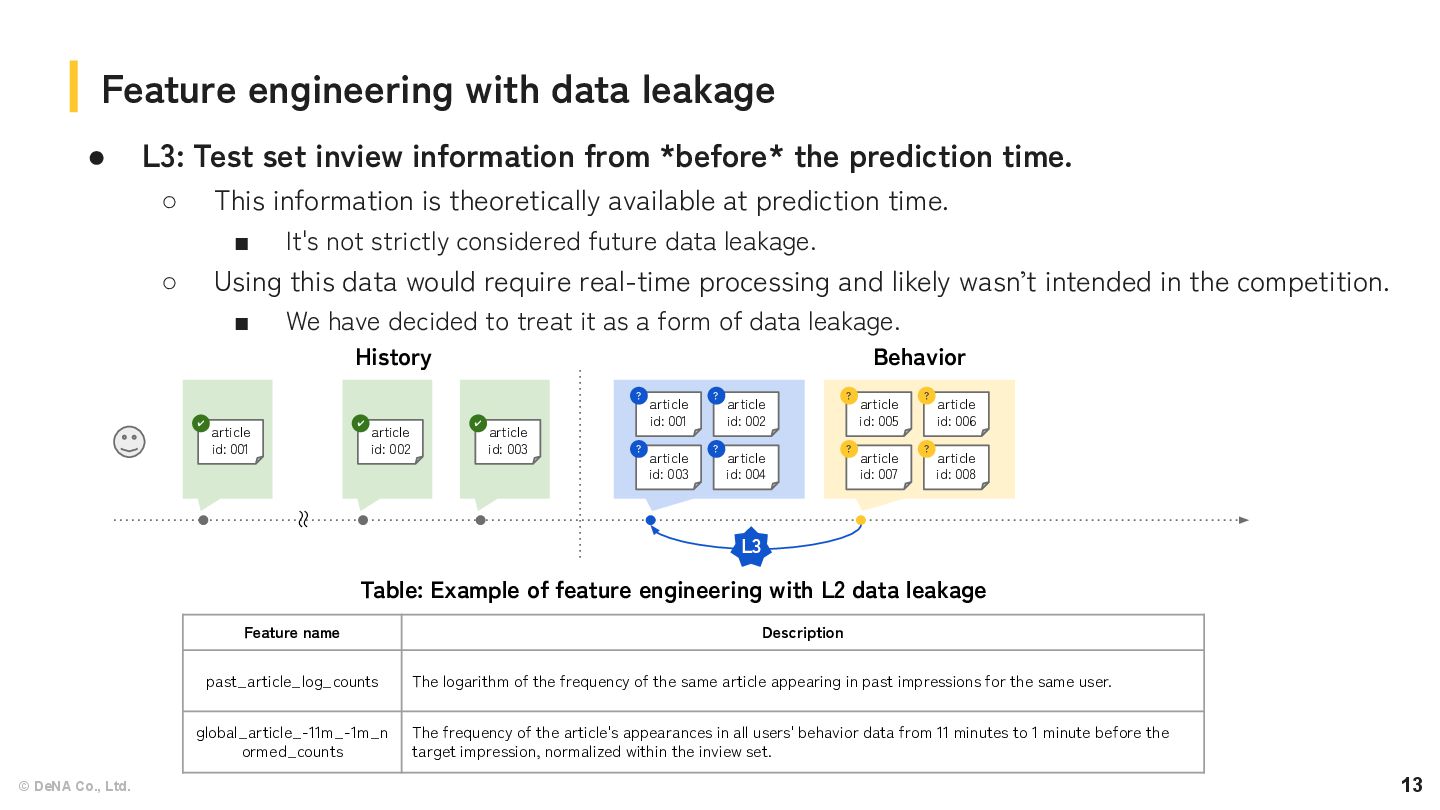
• L3: Test set inview information from *before* the prediction time. ◦ This information is theoretically available at prediction time. ▪ It's not strictly considered future data leakage. ◦ Using this data would require real-time processing and likely wasn’t intended in the competition. ▪ We have decided to treat it as a form of data leakage. article id: 001 ✔ article id: 002 ✔ article id: 003 ✔ article id: 001 ? article id: 003 ? article id: 002 ? article id: 004 ? article id: 005 ? article id: 007 ? article id: 006 ? article id: 008 ? Behavior History 〜 〜 L3 Table: Example of feature engineering with L2 data leakage Feature name Description past_article_log_counts The logarithm of the frequency of the same article appearing in past impressions for the same user. global_article_-11m_-1m_n ormed_counts The frequency of the article's appearances in all users' behavior data from 11 minutes to 1 minute before the target impression, normalized within the inview set.
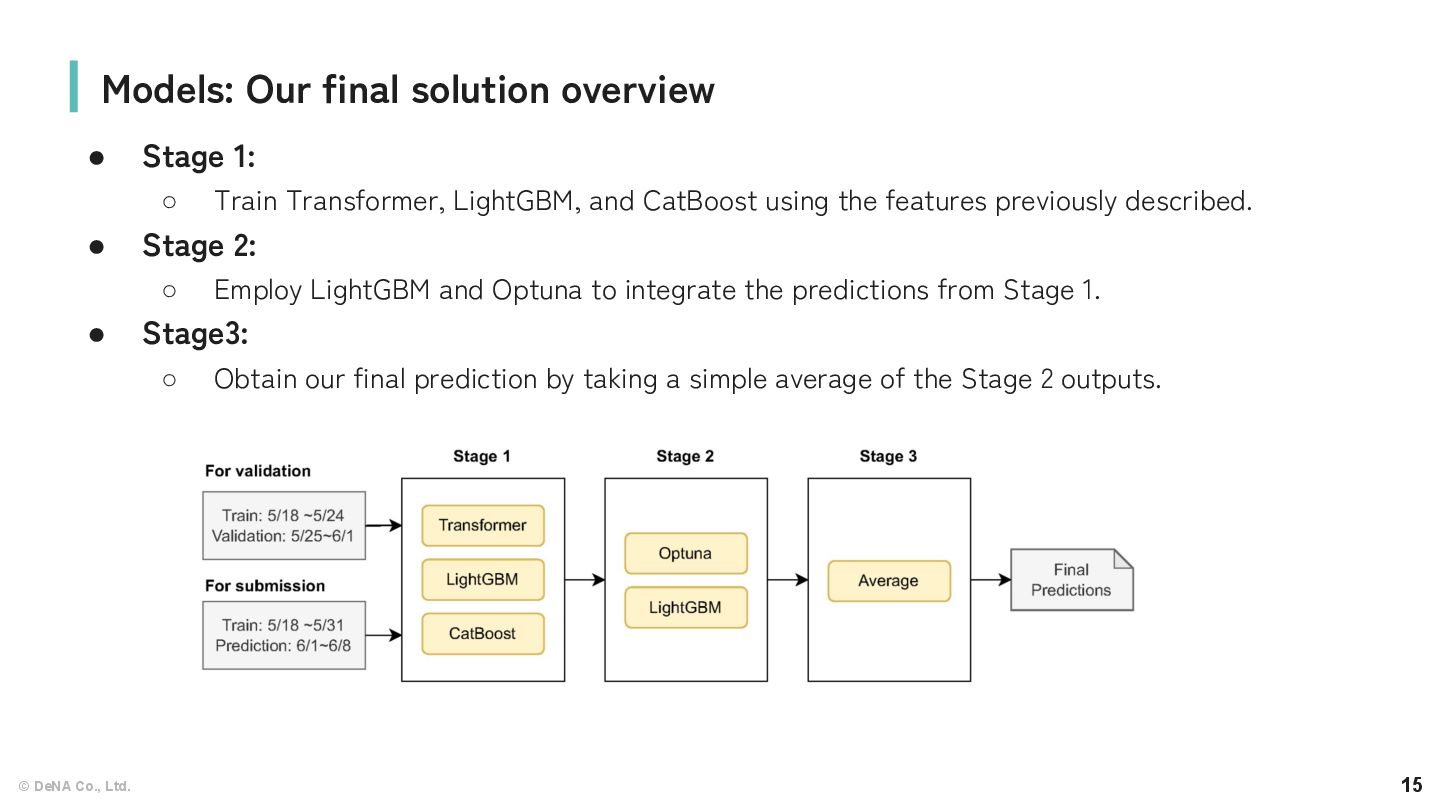
Transformer, LightGBM, and CatBoost using the features previously described. • Stage 2: ◦ Employ LightGBM and Optuna to integrate the predictions from Stage 1. • Stage3: ◦ Obtain our final prediction by taking a simple average of the Stage 2 outputs. Models: Our final solution overview
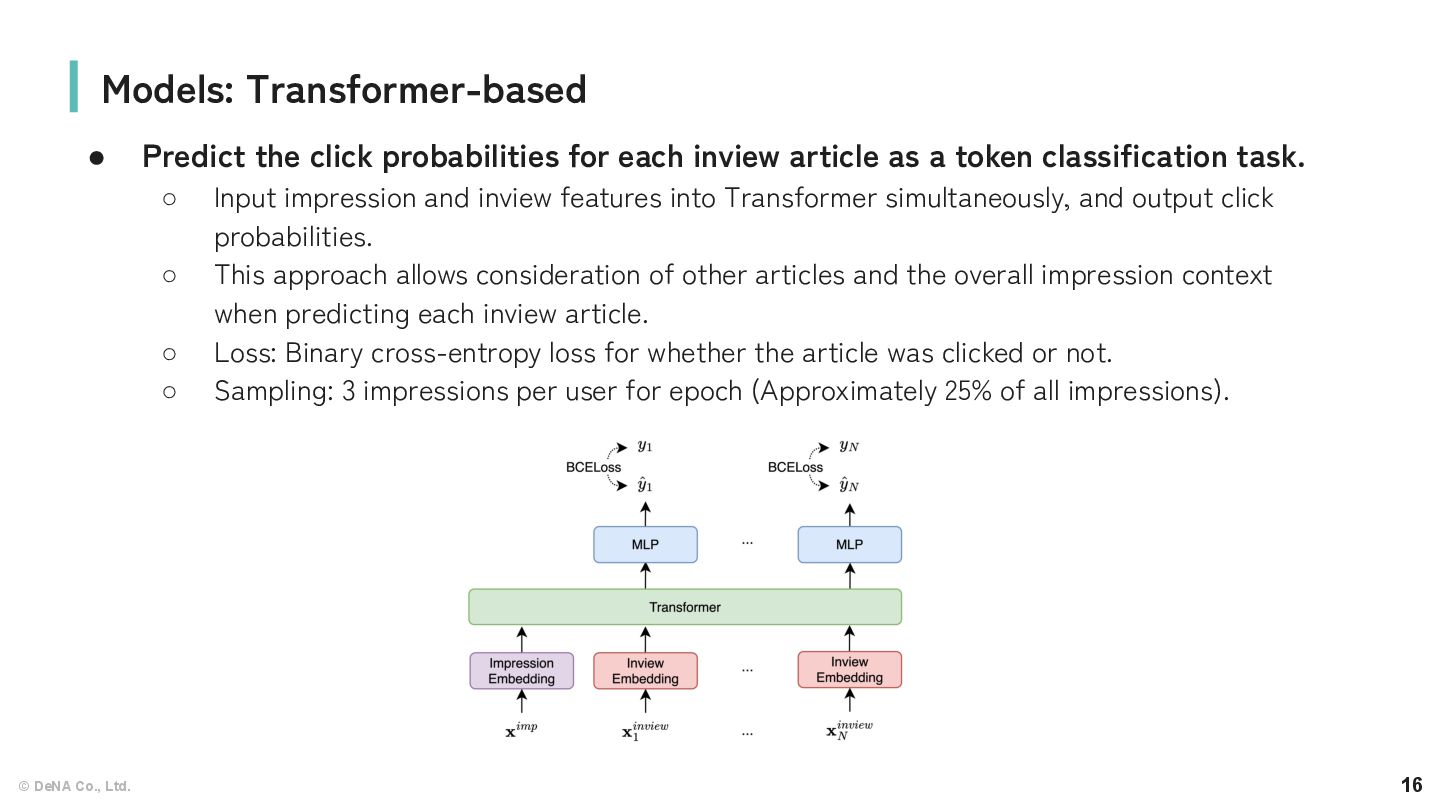
for each inview article as a token classification task. ◦ Input impression and inview features into Transformer simultaneously, and output click probabilities. ◦ This approach allows consideration of other articles and the overall impression context when predicting each inview article. ◦ Loss: Binary cross-entropy loss for whether the article was clicked or not. ◦ Sampling: 3 impressions per user for epoch (Approximately 25% of all impressions). Models: Transformer-based
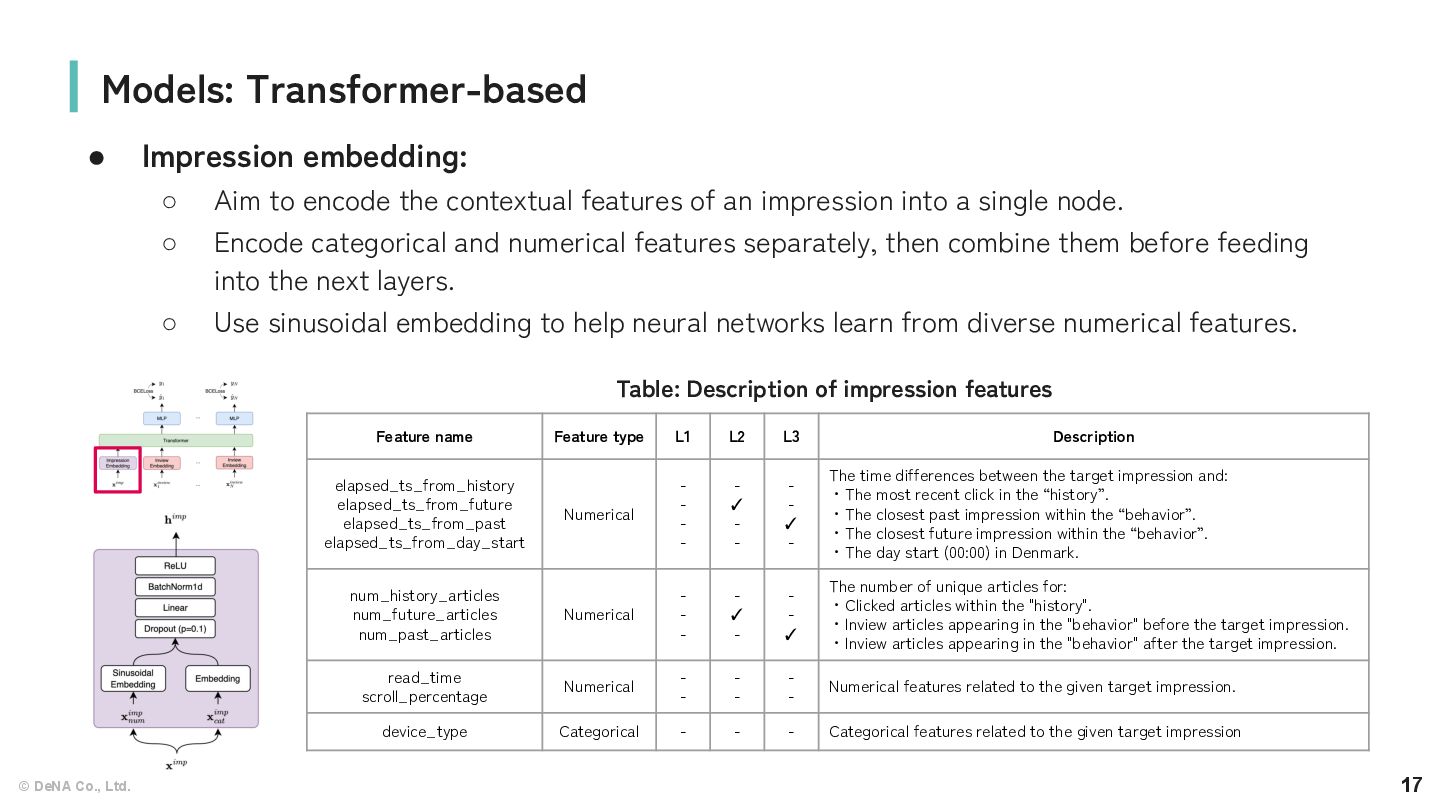
to encode the contextual features of an impression into a single node. ◦ Encode categorical and numerical features separately, then combine them before feeding into the next layers. ◦ Use sinusoidal embedding to help neural networks learn from diverse numerical features. Models: Transformer-based Feature name Feature type L1 L2 L3 Description elapsed_ts_from_history elapsed_ts_from_future elapsed_ts_from_past elapsed_ts_from_day_start Numerical - - - - - ✓ - - - - ✓ - The time differences between the target impression and: ・The most recent click in the “history”. ・The closest past impression within the “behavior”. ・The closest future impression within the “behavior”. ・The day start (00:00) in Denmark. num_history_articles num_future_articles num_past_articles Numerical - - - - ✓ - - - ✓ The number of unique articles for: ・Clicked articles within the "history". ・Inview articles appearing in the "behavior" before the target impression. ・Inview articles appearing in the "behavior" after the target impression. read_time scroll_percentage Numerical - - - - - - Numerical features related to the given target impression. device_type Categorical - - - Categorical features related to the given target impression Table: Description of impression features
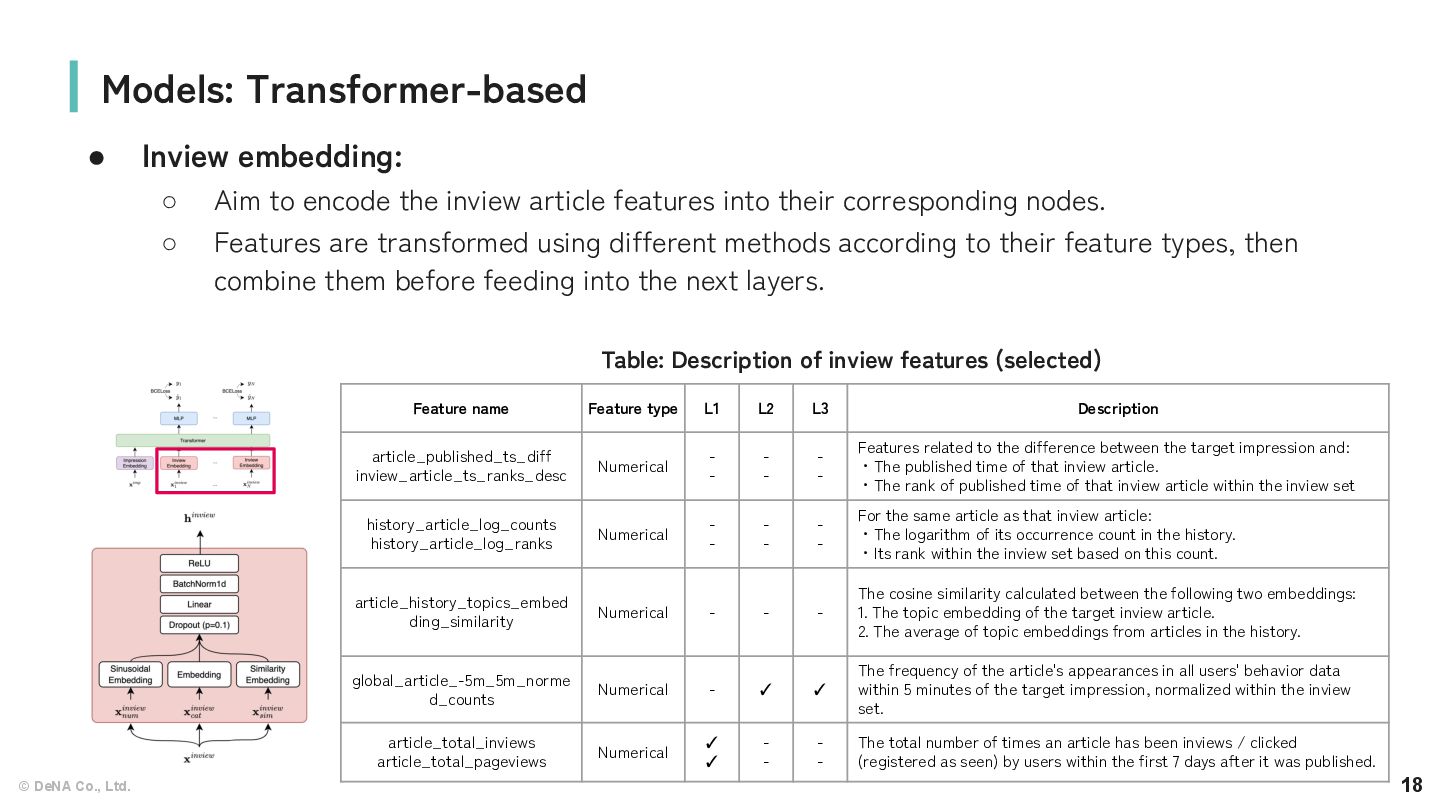
to encode the inview article features into their corresponding nodes. ◦ Features are transformed using different methods according to their feature types, then combine them before feeding into the next layers. Models: Transformer-based Feature name Feature type L1 L2 L3 Description article_published_ts_diff inview_article_ts_ranks_desc Numerical - - - - - - Features related to the difference between the target impression and: ・The published time of that inview article. ・The rank of published time of that inview article within the inview set history_article_log_counts history_article_log_ranks Numerical - - - - - - For the same article as that inview article: ・The logarithm of its occurrence count in the history. ・Its rank within the inview set based on this count. article_history_topics_embed ding_similarity Numerical - - - The cosine similarity calculated between the following two embeddings: 1. The topic embedding of the target inview article. 2. The average of topic embeddings from articles in the history. global_article_-5m_5m_norme d_counts Numerical - ✓ ✓ The frequency of the article's appearances in all users' behavior data within 5 minutes of the target impression, normalized within the inview set. article_total_inviews article_total_pageviews Numerical ✓ ✓ - - - - The total number of times an article has been inviews / clicked (registered as seen) by users within the first 7 days after it was published. Table: Description of inview features (selected)
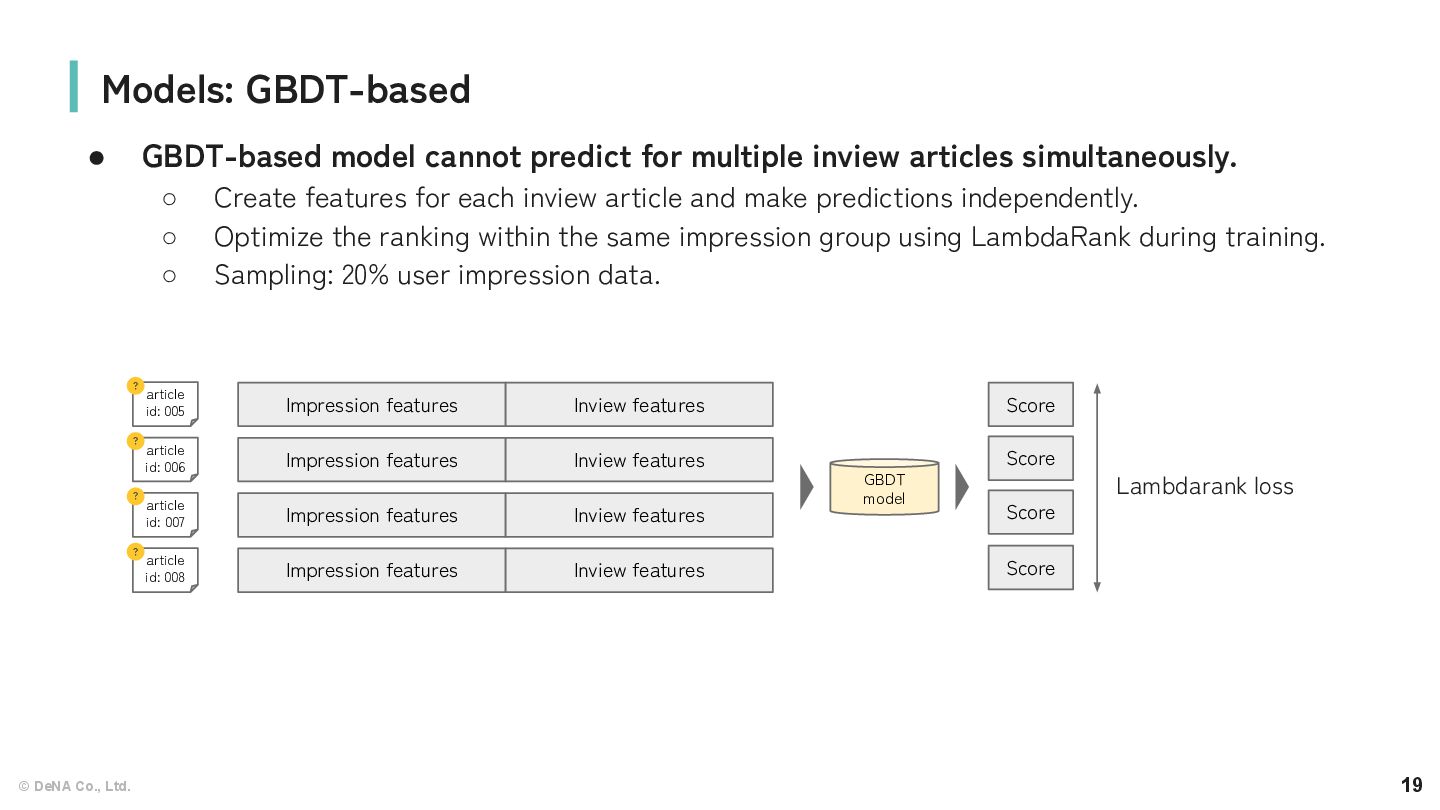
cannot predict for multiple inview articles simultaneously. ◦ Create features for each inview article and make predictions independently. ◦ Optimize the ranking within the same impression group using LambdaRank during training. ◦ Sampling: 20% user impression data. article id: 005 ? article id: 007 ? article id: 006 ? article id: 008 ? Impression features Inview features GBDT model Impression features Inview features Impression features Inview features Impression features Inview features Score Score Score Score Lambdarank loss
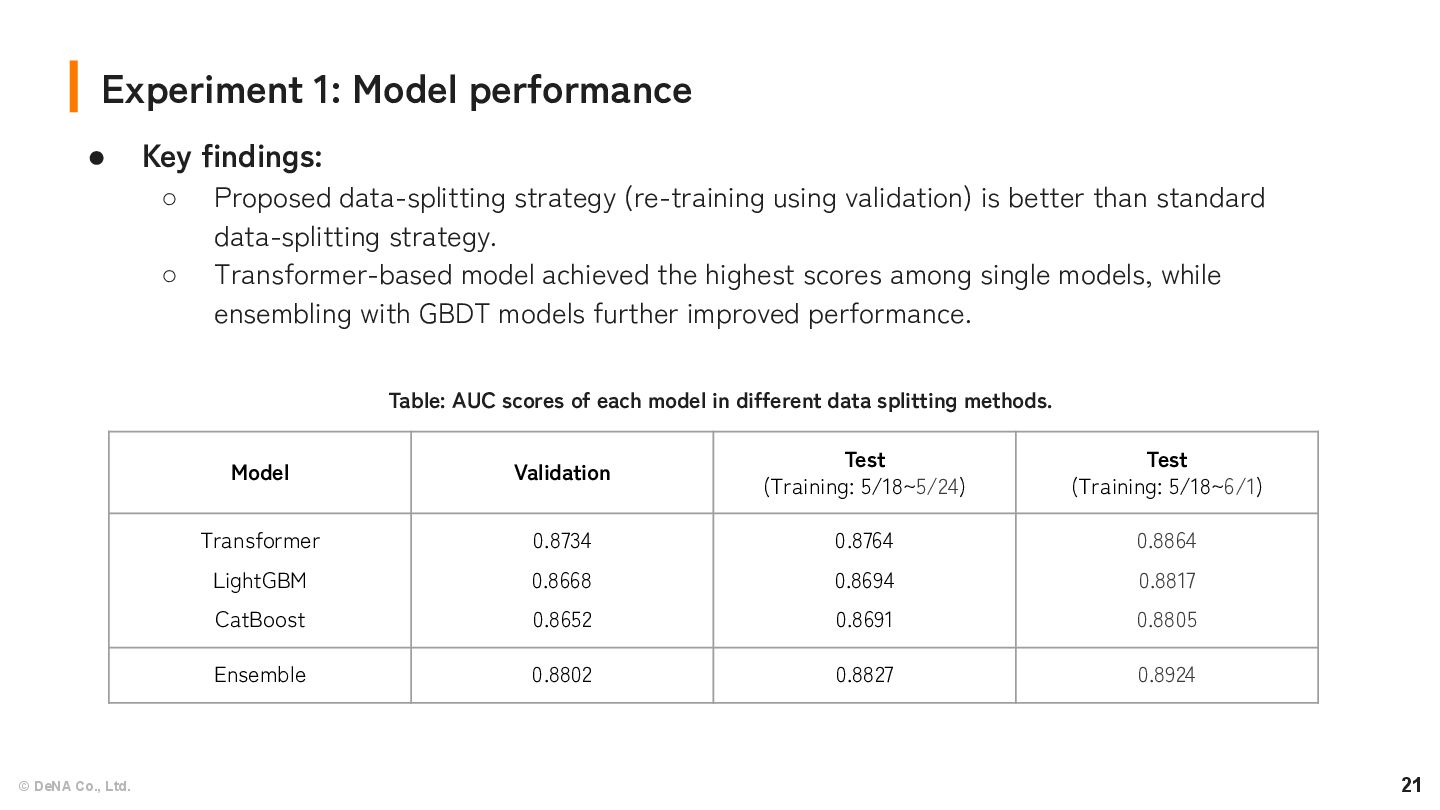
Key findings: ◦ Proposed data-splitting strategy (re-training using validation) is better than standard data-splitting strategy. ◦ Transformer-based model achieved the highest scores among single models, while ensembling with GBDT models further improved performance. Model Validation Test (Training: 5/18~5/24) Test (Training: 5/18~6/1) Transformer LightGBM CatBoost 0.8734 0.8668 0.8652 0.8764 0.8694 0.8691 0.8864 0.8817 0.8805 Ensemble 0.8802 0.8827 0.8924 Table: AUC scores of each model in different data splitting methods.
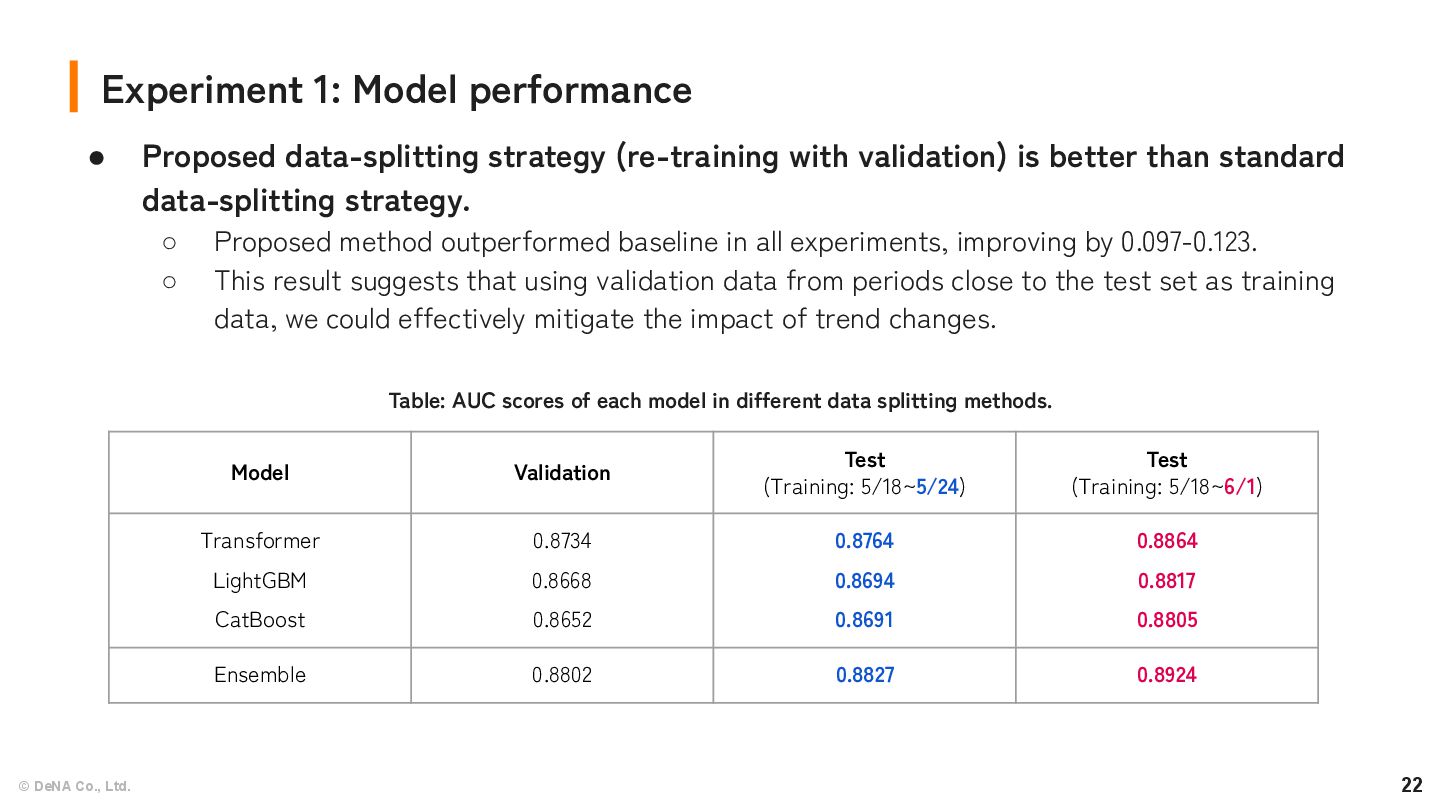
Proposed data-splitting strategy (re-training with validation) is better than standard data-splitting strategy. ◦ Proposed method outperformed baseline in all experiments, improving by 0.097-0.123. ◦ This result suggests that using validation data from periods close to the test set as training data, we could effectively mitigate the impact of trend changes. Model Validation Test (Training: 5/18~5/24) Test (Training: 5/18~6/1) Transformer LightGBM CatBoost 0.8734 0.8668 0.8652 0.8764 0.8694 0.8691 0.8864 0.8817 0.8805 Ensemble 0.8802 0.8827 0.8924 Table: AUC scores of each model in different data splitting methods.
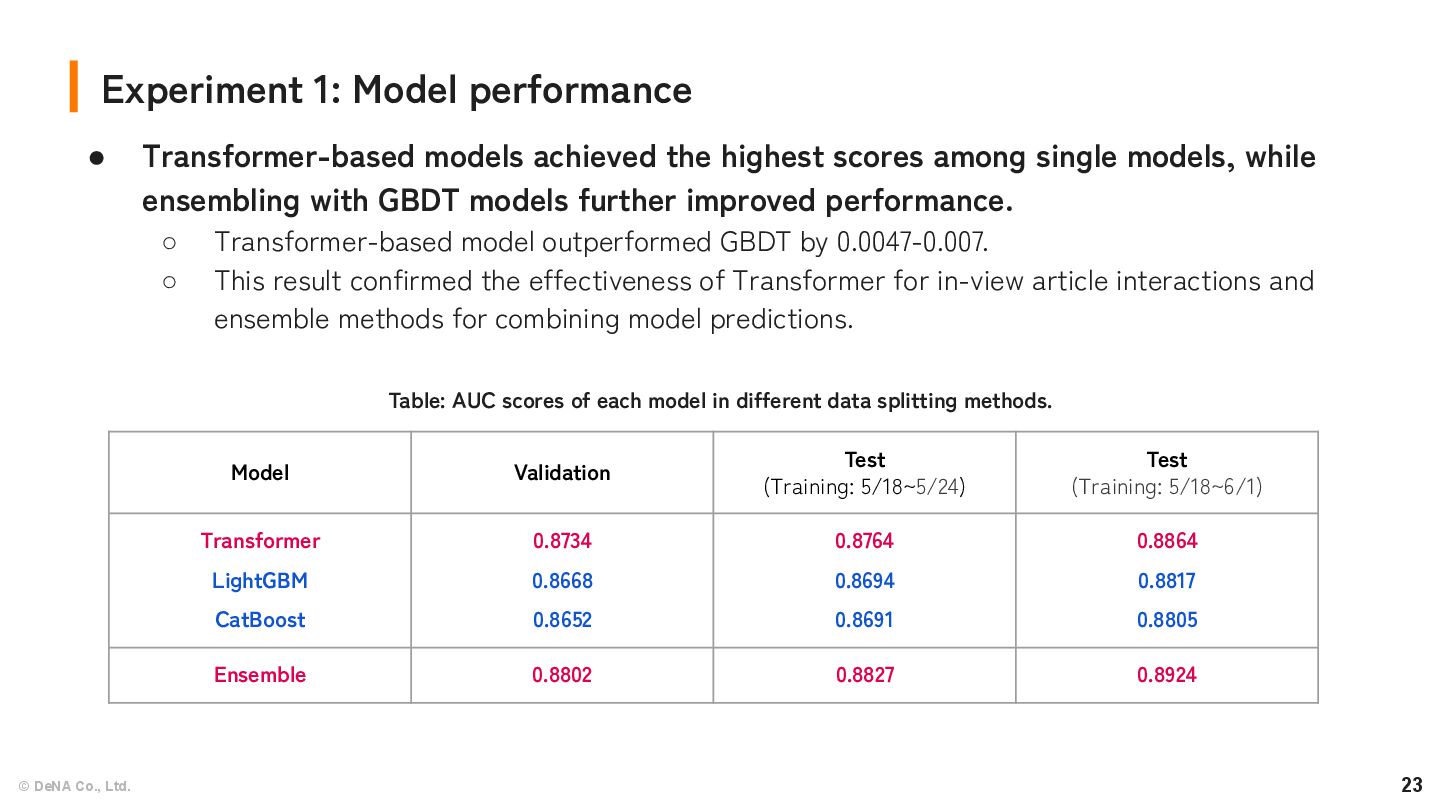
Validation Test (Training: 5/18~5/24) Test (Training: 5/18~6/1) Transformer LightGBM CatBoost 0.8734 0.8668 0.8652 0.8764 0.8694 0.8691 0.8864 0.8817 0.8805 Ensemble 0.8802 0.8827 0.8924 • Transformer-based models achieved the highest scores among single models, while ensembling with GBDT models further improved performance. ◦ Transformer-based model outperformed GBDT by 0.0047-0.007. ◦ This result confirmed the effectiveness of Transformer for in-view article interactions and ensemble methods for combining model predictions. Table: AUC scores of each model in different data splitting methods.
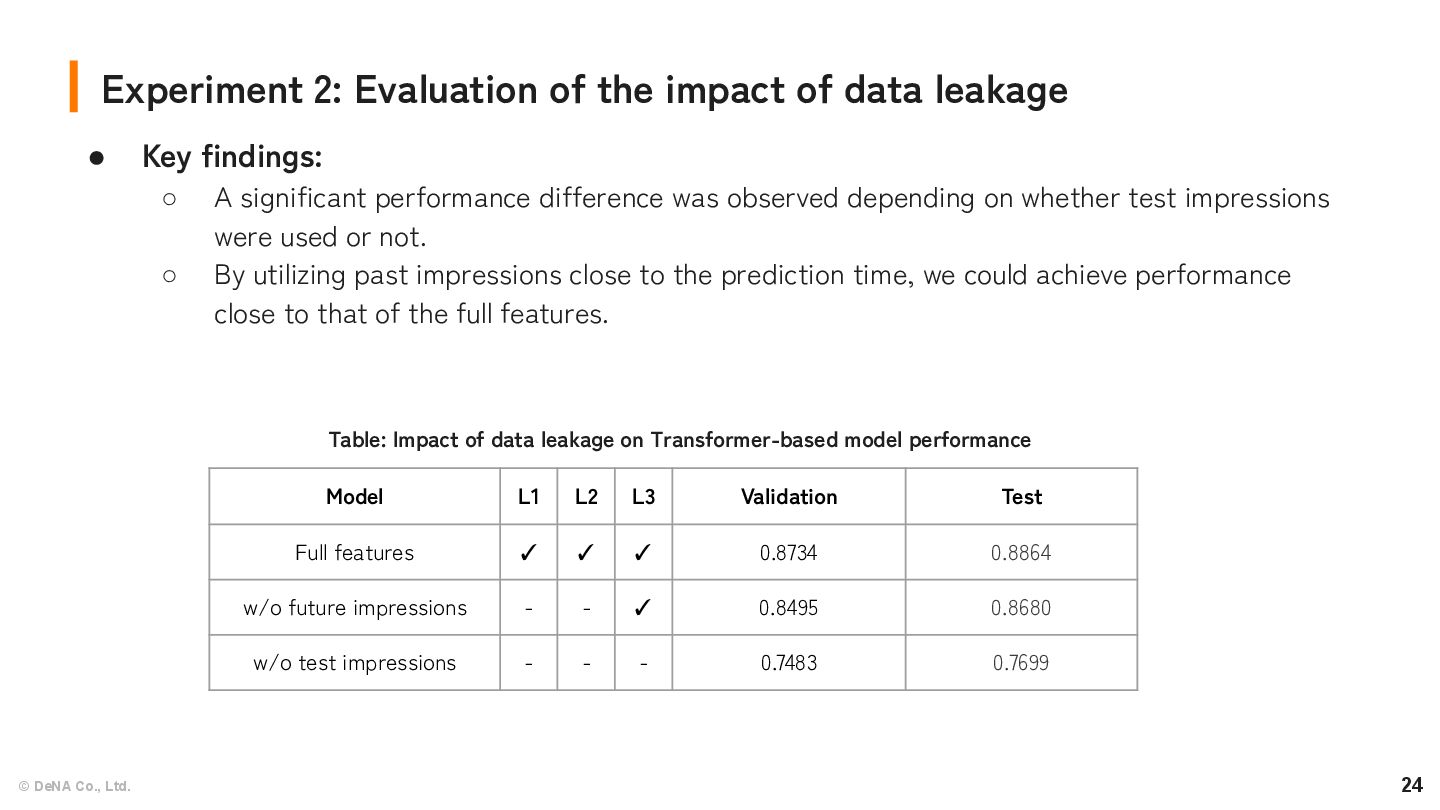
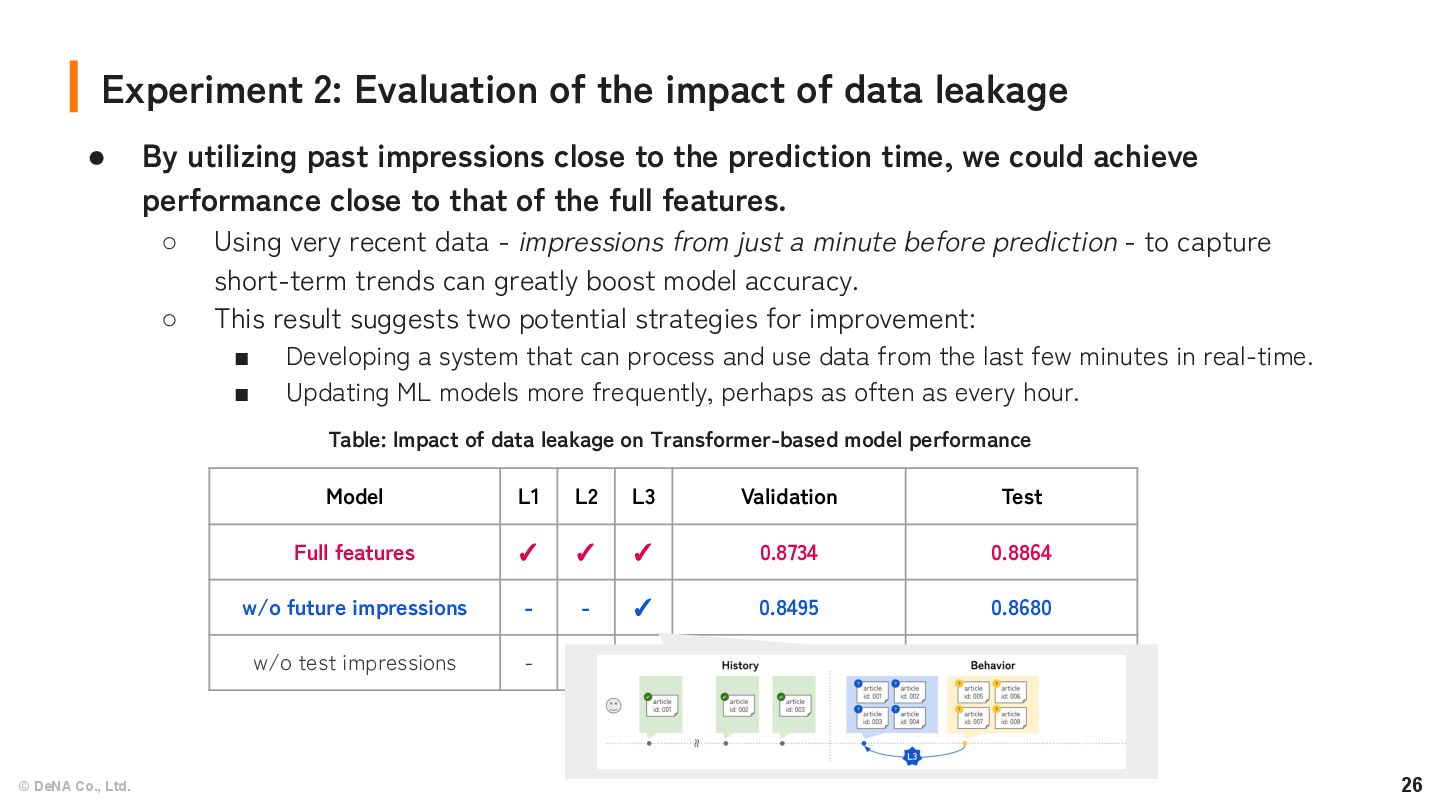
impact of data leakage • Key findings: ◦ A significant performance difference was observed depending on whether test impressions were used or not. ◦ By utilizing past impressions close to the prediction time, we could achieve performance close to that of the full features. Model L1 L2 L3 Validation Test Full features ✓ ✓ ✓ 0.8734 0.8864 w/o future impressions - - ✓ 0.8495 0.8680 w/o test impressions - - - 0.7483 0.7699 Table: Impact of data leakage on Transformer-based model performance
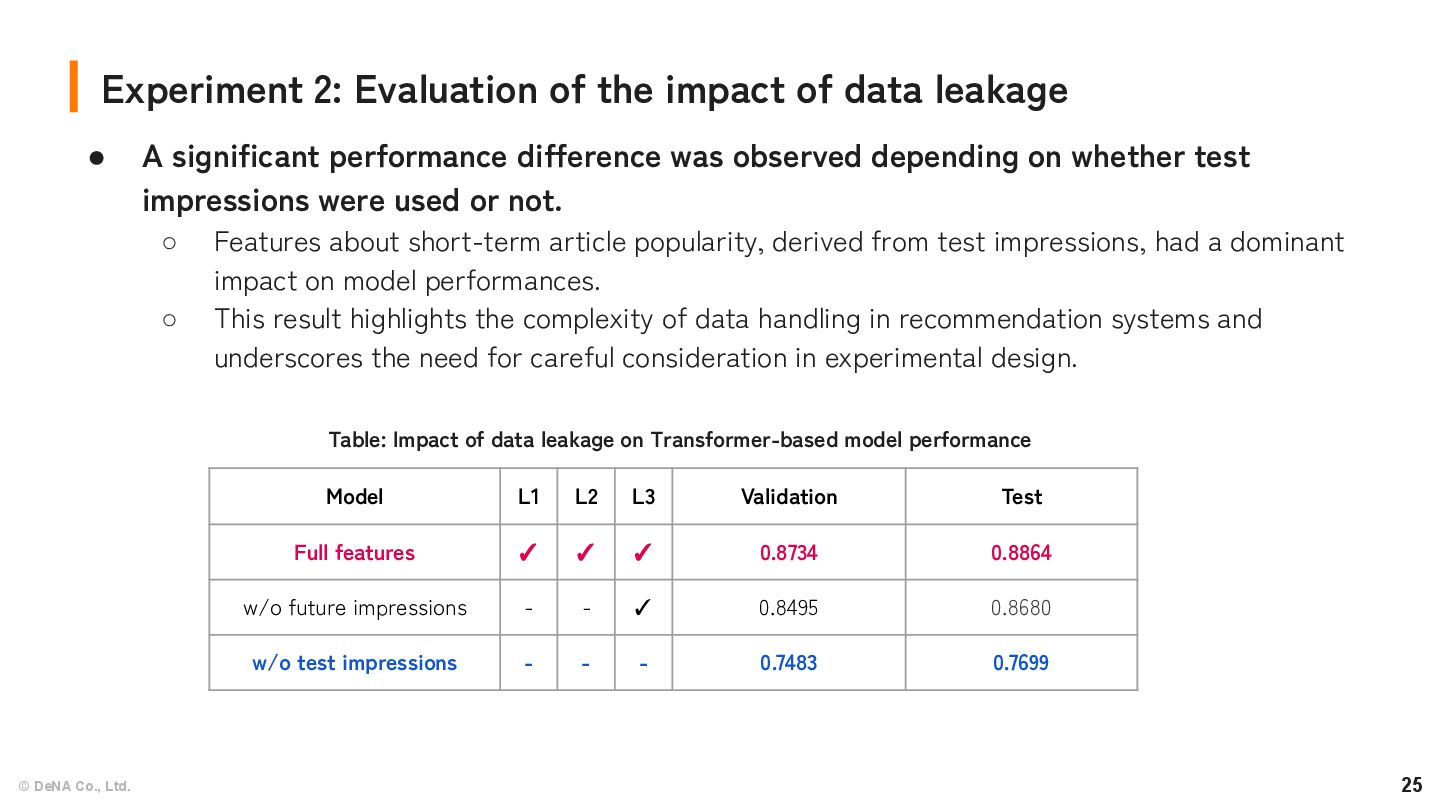
impact of data leakage • A significant performance difference was observed depending on whether test impressions were used or not. ◦ Features about short-term article popularity, derived from test impressions, had a dominant impact on model performances. ◦ This result highlights the complexity of data handling in recommendation systems and underscores the need for careful consideration in experimental design. Model L1 L2 L3 Validation Test Full features ✓ ✓ ✓ 0.8734 0.8864 w/o future impressions - - ✓ 0.8495 0.8680 w/o test impressions - - - 0.7483 0.7699 Table: Impact of data leakage on Transformer-based model performance
impact of data leakage • By utilizing past impressions close to the prediction time, we could achieve performance close to that of the full features. ◦ Using very recent data - impressions from just a minute before prediction - to capture short-term trends can greatly boost model accuracy. ◦ This result suggests two potential strategies for improvement: ▪ Developing a system that can process and use data from the last few minutes in real-time. ▪ Updating ML models more frequently, perhaps as often as every hour. Model L1 L2 L3 Validation Test Full features ✓ ✓ ✓ 0.8734 0.8864 w/o future impressions - - ✓ 0.8495 0.8680 w/o test impressions - - - 0.7483 0.7699 Table: Impact of data leakage on Transformer-based model performance
“:D” solution for RecSys Challenge 2024, which won the 1st place. ◦ Introduced our feature engineering methods and data-splitting strategies to address the temporal nature of news articles and improve model generalization. ◦ Proposed an efficient method using a Transformer-based model to process inview and impression features simultaneously. ◦ Experiments on data leakages provided insights into usefulness of statistical information from recent impressions.
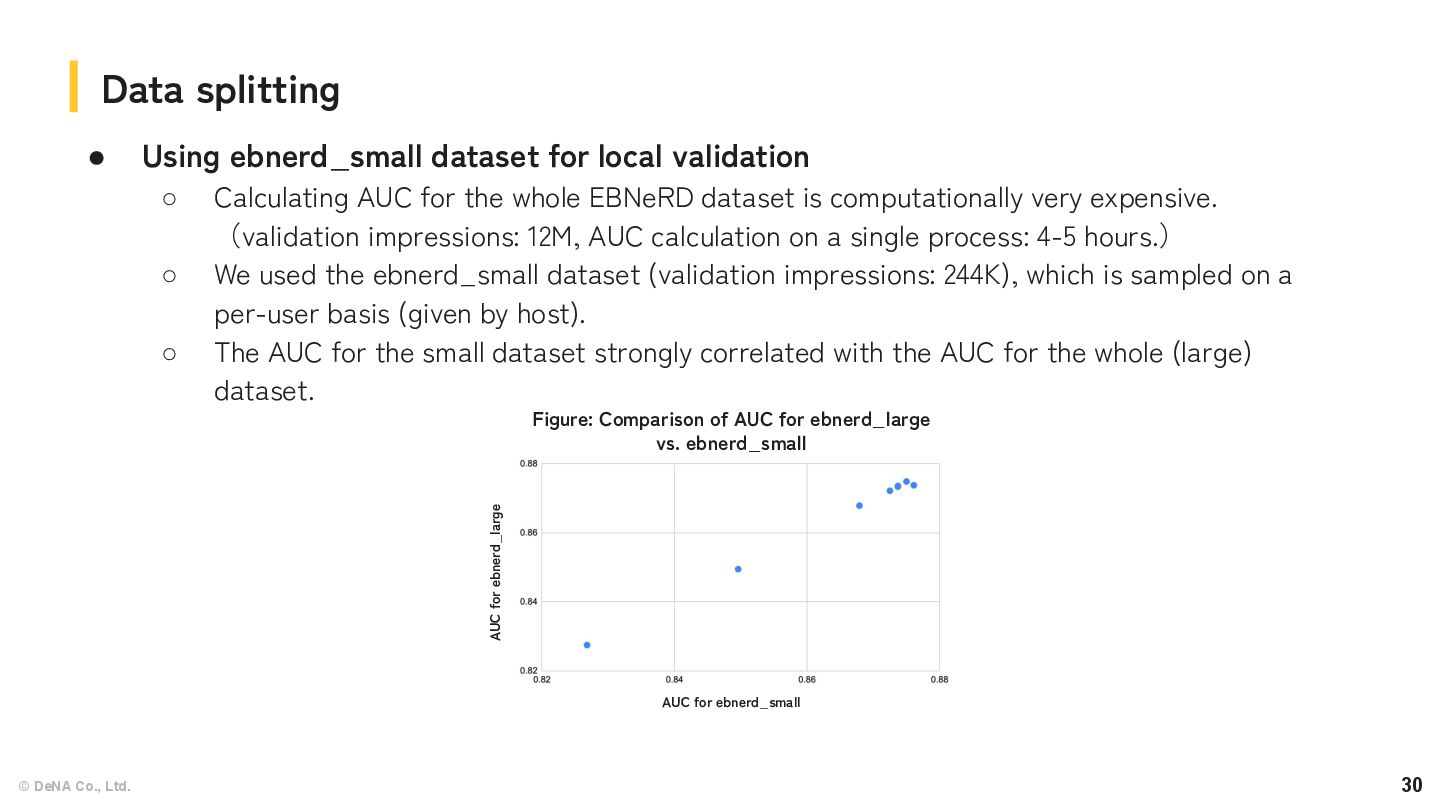
local validation ◦ Calculating AUC for the whole EBNeRD dataset is computationally very expensive. (validation impressions: 12M, AUC calculation on a single process: 4-5 hours.) ◦ We used the ebnerd_small dataset (validation impressions: 244K), which is sampled on a per-user basis (given by host). ◦ The AUC for the small dataset strongly correlated with the AUC for the whole (large) dataset. Data splitting AUC for ebnerd_small AUC for ebnerd_large Figure: Comparison of AUC for ebnerd_large vs. ebnerd_small